

Abstract
Introduction:
Peru carries a high burden of childhood anemia, particularly in high-altitude regions where hemoglobin (Hb) adjustment for altitude is recommended. This study aimed to evaluate whether the proportion of anemia attributable to iron deficiency (ID), inflammation, and red blood cell indices varies by altitude in children, using different diagnostic criteria.
Methods:
We conducted a cross-sectional study of 280 children aged 6 to 72 months residing in Arequipa, Peru at altitudes ranging from 9 to 4310 m above sea level. Venous blood samples were collected to assess Hb, complete blood count, and serum biomarkers of iron status and inflammation. Spearman’s rank correlation was used to examine relationships between altitude and hematologic or biochemical parameters. Logistic regression models evaluated associations between altitude, Hb concentration, and anemia prevalence, defined with and without altitude adjustment.
Results:
Anemia prevalence increased from 12% to 31% after applying altitude-adjusted Hb thresholds. At mid-altitudes (1000–<3000 m), prevalence rose from 8.3% to 43.8% (P < .001), and at ≥3000 m, from 0% to 16.3% (P < .001). Overweight and obese children had a higher anemia prevalence using unadjusted Hb (28.6% vs 10.5%; P < .05), a difference that disappeared after adjustment. Iron deficiency was present in 5.6% of participants, while inflammation was detected up to 26.5%. Receiver operating characteristic (ROC) analysis indicated that unadjusted Hb thresholds had better diagnostic performance for identifying iron deficiency anemia (IDA) compared to altitude-adjusted definitions.
Conclusion:
These findings suggest that altitude-adjusted Hb cutoffs may overestimate anemia prevalence and lead to misclassification of IDA in high-altitude pediatric populations.
Keywords: anemia, iron deficiency, altitude, etiology
Highlights.
● Anemia prevalence in high-altitude infants and children rises substantially after applying WHO 2024 Hb correction.
● Iron deficiency is absent in most infants and children, regardless of anemia status.
● Statistical analyses show Hb adjustment is inadequate for diagnosing iron deficiency anemia, confirmed by gold-standard biomarkers.
Introduction
In 2021, global anemia prevalence was 24.3%, down from 28.2% in 1990. Among children under 5, it remained high at 41.4%, with no sex differences. Reductions were greater in adult men, not in young children or women of reproductive age. High prevalence persists, especially in western sub-Saharan Africa and Southeast Asia. 1
In children aged 0 to 59 months, prevalence of anemia changes from >60% in children aged 0 to 6 days to almost 35% in children aged 2 to 4 years. 1 This decrease in the prevalence of anemia with age is due to a physiological effect of fetal hemoglobin which is normally shut-off after birth to be switched to beta-hemoglobin. 2
In Latin America and the Caribbean, the prevalence of childhood anemia is 21% overall, yet varies substantially by country. In South America, the lowest prevalence rates of anemia among children under 6 years of age were found in Chile (4.0%), Costa Rica (4.0%), Argentina (7.6%), and Mexico (19.9%). In Nicaragua, Brazil, Ecuador, Panama, and Honduras, anemia is a moderate public health problem, with prevalence ranging from 20.1% to 37.3% in El Salvador, Cuba, Colombia, the Dominican Republic, Peru Anemia is a severe public health problem in Guatemala, Haiti, and Bolivia. 3
However, the prevalence of anemia varies in Latin America depending on the data source. 4
In Peru, the prevalence of anemia among children aged 6– to 59 months was 32.2% between 2017 and 2023, based on data from the Peruvian Demographic and Health Survey (ENDES). 5 Anemia was diagnosed using a hemoglobin threshold of <11.0 g/dL for children under 5 years. However, prior studies suggest that improving socioeconomic status alone is insufficient to eliminate ethnic disparities in child health such as anemia. 6
All these publications have been developed using the old WHO criteria to define anemia according to age and altitude, so it is necessary to update the prevalence of anemia according to the new WHO standards. 7
This higher prevalence of anemia in Peru compared to the rest of Latin America is likely multifactorial. One contributing factor may be the recommended adjustment of hemoglobin (Hb) for altitude of residence. Findings from prior studies suggest the adjustment of Hb for altitude increases the prevalence of anemia in children aged 6 to 59 months from 4.7% to 65.6%. 8 Many have expressed that the adjustment of Hb for altitude is inappropriate and the adjustment equation should be modified, 9 some even suggests not correcting Hb for altitude at all.10 -12
In 2024, the WHO proposed revised hemoglobin cutoffs for diagnosing anemia in children aged 6 to 23 months and in those residing in high-altitude areas with the aim of increasing sensitivity and ensuring uniformity in the diagnosis of anemia. 13 The updated guideline recommends an adjustment of Hb for altitude with a new equation that modifies the hemoglobin cutoff for children who reside above 500 m. This new formula increases the adjustment factor for altitudes from 500 to 3000 m and has shown lower estimates ofthe prevalence of anemia for children who live at altitudes above 3500 m. 14
A recent study in the Southern Andes of Peru showed that in infants, 21% of anemia was attributable to iron deficiency (ID), 14.5% to inflammation, and 65% that must be explained by other causes. This group may include infants who do not have a cause of anemia and is diagnosed with anemia due to altitude adjustment alone. 15 Importantly, other causes such as deficiency of folate, vitamin B12, vitamin A, or inherited blood disorders could also explain the high prevalence of anemia in Peru. However, such causes were not measured in this recent study in the Southern Andes of Peru nor in other studies with data from populations at low altitudes in Peru.16,17
The aim of this study was to evaluate whether the proportion of anemia due to iron deficiency, inflammation, and red blood cell indices vary by altitude among children using different diagnostic criteria.
Materials and Methods
Study Design and Population
A cross-sectional study was carried out during 2023 in 3 provinces of the Arequipa Region in Southern Peru. The selection criteria included children with permanent residence in the enrollment districts, those who lived in the study areas for at least 6 months, single birth, who had parents willing to provide informed consent, and showed no clinical signs of acute or chronic disease. Children with congenital diseases, a history of perinatal asphyxia, chronic diseases, and those who received vaccinations on the same day of enrollment were excluded.
The reporting of this study is aligned with the STROBE (Strengthening the Reporting of cross-sectional Studies in Epidemiology) guidelines (see Supplemental Table 1).
Sample Size
Assuming a baseline adjusted prevalence of anemia of ≥20%, a sample size of 39 children per altitudinal region were estimated to detect differences between groups, accounting for 20% heterogeneity. The calculation was based on a 2-proportion comparison test. A 50% prevalence of iron-deficiency anemia (IDA) was considered the reference, based on reports from the Peruvian Ministry of Health, and according to data that 22% of cases of anemia in children aged 6 to 59 months are attributable to iron deficiency in Puno, Peru. 18 Allowing for a 20% potential loss to follow-up, the target sample size per group increased to 47 children. Statistical power was recalculated based on the final sample obtained, considering a group ratio of 1.21, using children residing at 1000–2999 m as the reference group. The estimated statistical power reached approximately 99%. In total, 278 children from Arequipa were recruited. The final sample size was rounded to 280 for analysis.
Study Setting
The Arequipa region has populations living from 9 to 4310 meters above sea level. The 3 main provinces selected for the study were Islay with 6 districts, Arequipa with 29 districts, and Caylloma with 20 districts. These 3 provinces represent populations residing at low altitude (N = 84; between 0 and 999 m), at moderate altitudes (N = 102; between 1000 and 2999 m) and at high altitude (N = 94; >3000 m). 19
Recruitment
Recruitment took place between March and May 2023. Samples from children who lived in low altitudes were obtained in the districts of Pedregal, Punta de Bombon, Cocachacra, Islay and Mollendo. Blood samples from children living at moderate altitudes were collected in the districts of Yura, Chiguata, Characato, Hunter, Quequeña and Yarabamba. Blood samples from children living at high altitude were collected in the districts of Chivay and Caylloma.
Children were recruited in health centers participating in the Growth and Development Control (CRED) program, which is, according to the Ministry of Health (MINSA), the set of periodic and systematic activities with the objective of adequately and timely monitoring growth and development of children to detect early risks or disorders, as well as the presence of diseases facilitating their diagnosis and timely intervention. CRED visits are carried out in all, first-level health facilities, public and private, and in some hospitals. 20 During recruitment, parents voluntarily signed informed consent forms, completed both a sociodemographic and a child health questionnaire, and a trained nurse measured the child’s length (height) and weight during the same clinical visit.
Sample Collection and Processing
On the day of sampling, a certified staff of the health center withdrew a venous blood sample of 3 ml from the child from the anterior area of the forearm. To circumvent the influence of the circadian cycle on serum hepcidin, the collection of venous blood was performed between 8.00 am and 11:00 am. 21
Samples were split into 2 tubes, 1 with anticoagulant for hemogram and the other without anticoagulant for the serum to analyze iron status markers and inflammatory markers. The tube with BD vacutainer SST II Advance separator gel (BD-Belliver Industrial State, Belliver Way, Roborough, UK) was used for the collection of serum for the evaluation of the parameters of iron status and inflammation and a tube with K2EDTA (Becton Dickinson Medical Devices Co Ltd., Frankin Lakes, NJ, USA) for the automated hemogram. The whole blood sample was transported to Arequipa City and analyzed for the hemogram and tubes without anticoagulant were processed to obtain serum. Serum samples were frozen at −20°C until subsequent use. Frozen serum samples were transported to Lima, the capital of Peru, in which they were assessed in the laboratory.
For hematological values, the SYSMEX KX-21N Automated Hematology Analyzer (SYSMEX Corporation Chuo-Ku, Kobe, Japan) was used, according to the manufacturer’s instructions. For hematological values, the Simex Kx21N automated analyzer was used. The hemogram included red blood cell count (RBC), Hb, hematocrit (Hct), mean corpuscular volume (MCV), mean corpuscular hemoglobin (MCH), mean corpuscular hemoglobin concentration (MCHC), red blood cell distribution width-coefficient of variation (RDW-CV). The equipment was calibrated and used according to the manufacturer’s instructions.
Serum Biomarkers
Levels of serum ferritin (SF, µg/L), Hepcidin (HPC, ng/mL), soluble transferrin receptor (sTfR, mg/L), and interleukin 6 (IL-6, pg/mL) were measured with ELISA kits (DRG, GmBh, Marburg, Germany). Turbidimetry was used for transferrin (TF, mg/dL) and C-reactive protein (CRP, mg/L). Serum iron was measured by the photometric test with Ferene (Ferene Iron WS, MS 80115310192, Kovalent, Brazil). All measurements were processed according to standard laboratory practice and following the manufacturer’s instructions.
Total body iron (TBI) was calculated following the equation used in previous studies22,23:
Total iron binding capacity (TIBC) (µg/mL) was calculated by transferrin (g/L) × 25.1. 24 Total transferrin saturation (TSAT) was calculated using the formula [TSAT = (Fe/transferrin [TF]) × 70.9]. 25
Nutritional Status
At the primary healthcare center, anthropometric data were collected using standardized instruments calibrated by the Ministry of Health. An infantometer was used for children up to 23 months of age, while a stadiometer and weighing scale were used for those aged 24 months and older. Body mass index was calculated as weight (kg/height2 [m2]). Weight-for-height Z score, height- and weight-for-age Z scores were calculated according to the WHO guidelines to identify children who were underweight (weight-for-age), stunted or chronically malnourished (height-for-age), wasted or acutely malnourished (weight-for-height). 26 Z scores between −2 and +2 were considered as normal nutrition. Z- scores <- 2 or -3 were categorized as moderate or severe malnutrition, respectively.
We defined children as overweight/obese if their weight for height Z-score (WHZ) was higher than 2 standard deviations (SD) from the mean, for each sex.
Definition of Anemia
Anemia was defined as hemoglobin <10.5 g/dL in children aged 6 to 23 months, <11 g/dL in children aged 23 to 59 months and11.5 g/dL for children aged 60 to 72 months. For populations above 500 m, hemoglobin adjustment for altitude was used with the updated WHO recommendations. 7
Definition of Iron Deficiency
ID was defined as serum ferritin concentration <12 μg/L for children aged 6 to 59 months, 7 and 15 μg/L for children aged 60 to 72 months. 27 Iron Deficiency anemia (IDA) was defined when a child with ID due to low ferritin levels has also anemia. Iron Deficiency was also defined as TBI <0 mg/kg and IDA was defined as TBI < - 4 mg/Kg. 22 This parameter does not correlate with CRP (24). For this study, sTfR concentration >2.8 mg/L for children aged 6 months to 6 years was considered high. 28 Consistent with prior studies, we used <10% for the assessment of low TSAT to define ID. 29
Other Definitions for IDA
IDA was also defined when MCV < 72 fL, RBC <4* 10 12 , MCH < 25 pg, MCHC < 33 g/dL, and serum iron <28 µg/dL according to 2.5th percentile described previously for children aged 6 to 72 months. 30 As high transferrin levels have been shown to be associated with ID and low serum transferrin has been associated with hemolytic anemia, the reference range for serum transferrin levels in children was based on the 2.5th and 95th percentiles (ie, 210-350 mg/dL).31,32 Macrocytosis in children was defined as MCV > 97 fL and it was used as a proxy for folate or B12 deficiency. 33 Anemia with macrocytosis was defined when the Hb concentration was below the reference cut-off recommended by the WHO. 7
Inflammatory Markers
CRP>10 mg/L,34,35 or IL-6> 40 pg/mL were considered as diagnoses of inflammation. For the determination of the cut-off value for high IL-6, a population of 108 children aged 6 to 72 months with CRP <10 mg/L without anemia or iron deficiency was used, and the 90th percentile for IL-6 was calculated, resulting in a cut-off point of 40 pg/mL.
Statistical Analyses
Continuous data with normal distribution were analyzed by the Kolmogorov–Smirnov test. The Mann–Whitney U test was used to analyze data that were not normally distributed. Frequencies were presented as percentages and were analyzed by the Chi-square test. To test if iron biomarker concentrations differed among those diagnosed as having anemia with or without Hb adjustment by altitude, an unpaired, 2-sided t-test was used. An F-test for equal variances was performed before to ensure the T-test was appropriately used. The correlation between Hb, adjusted Hb, MCV, MCH, MCHC, RDW-CV, serum iron, transferrin, ferritin, hepcidin, TSAT, sTfR, TBI, TIBC, CRP, and IL-6 (dependent variables) were assessed with altitude (independent variables) by Spearman correlation.
Multivariable analysis was performed to assess ID with corrected adjusted and unadjusted anemia and adjusted and unadjusted Hb using logistic regression and GLM Gaussian families, respectively. The accuracy of anemia (with unadjusted and adjusted Hb as recommended by the WHO) was assessed using receiver-operating characteristic (ROC) curves and the area under the curve (AUC) was calculated by comparing 2 iron markers: ferritin and TBI.
Ethics Considerations
The study was conducted in accordance with the Declaration of Helsinki and approved by the Institutional Review Board the institution that led the project (protocol code N°037-01-19). Authorization was also obtained from the Regional Health Directorate of Arequipa to obtain data and contact caregivers in health centers of the Ministry of Health. The parents or tutors of the infants signed informed consent for each of the participants.
Results
Description of Population
Of the 280 enrolled children, 59.6% were aged 6-35 months, 51.4% were female, 9.5% had chronic malnutrition, and 7.8% were overweight/obese (Table 1). The general characteristics and physiological parameters of the children studied according to their altitude of residence are shown in Supplemental Table 2.
Table 1.
Descriptive Characteristics From Children Living in Arequipa Region, 2023.
| Characteristic | N | % |
|---|---|---|
| Age (months) | ||
| 6 to 35 | 165 | 59.6 |
| 36 to 72 | 112 | 40.4 |
| Sex | ||
| Female | 143 | 51.4 |
| Male | 135 | 48.6 |
| Province | ||
| Islay | 83 | 29.9 |
| Arequipa | 90 | 32.4 |
| Caylloma | 105 | 37.8 |
| Acute malnutrition* | 4 | 1.5 |
| Chronic malnutrition | 25 | 9.5 |
| Global malnutrition | 8 | 3.0 |
| Overweight/obesity | 21 | 7.8 |
| Unadjusted anemia | 31 | 12.1 |
| Adjusted Anemia | 80 | 31.0 |
| Iron status: | ||
| Low | 14 | 5.6 |
| Normal | 225 | 89.6 |
| Overload | 12 | 4.8 |
| Inflammation | ||
| CRP (>10 mg/L) | 63 | 26.5 |
| IL-6 (>40 pg/mL) | 34 | 15.3 |
| Altitude (masl) | ||
| <1000 | 83 | 29.9 |
| 1000 to 2999 | 101 | 36.3 |
| >3000 | 94 | 33.8 |
Iron deficiency was defined as low when ferritin (<12 until 59 months and <15 from 60 to 72 months); Normal; SF: 12 to 100 µg/L until 59 months and 15 to 100 µg/L from 60 to 72 months; Overload when serum ferritin was >100 µg/L.
Acute malnutrition: weight-for-height standard deviation below the −2 z-score of the median. Overweight/obesity: Z score weight per age >2 to <6. CRP: C-reactive protein. IL-6: Interleukin-6.
Prevalence of Anemia
In the overall sample studied, a total of 12% had anemia defined without adjustment of Hb for altitude of residence. However, the prevalence increased to 31% after adjusting Hb levels for altitude of residence.
At low altitudes (0-500 m), the prevalence of anemia was 33.3%. Between 1000 and <3000 m, the prevalence of anemia was 8.3% without Hb adjustment for altitude and increased to 43.8% after Hb adjustment for altitude (P < .001). At altitudes ≥3000 meters, no cases of anemia were observed when Hb was not adjusted for altitude, but the prevalence of anemia rose to 16.3% (P < .001) when Hb was adjusted for altitude (Figure 1A).
Figure 1.

A. Proportion of anemia in children aged 6 to 72 months residing at different altitudes without adjusting Hb for altitude (Blue) and after adjustment of Hb for altitude. B. Proportion of anemia with and without Hb adjustment for altitude and according to weight Chi square test.
*P = .014; **P = .00001; ***P = .00025.
In children aged 6 to 72 months with overweight/obesity, 28.6% had anemia diagnosed without adjustment of the Hb concentration for altitude. This value was significantly higher than that obtained in children of the same age group with normal weight (10.5%; Figure 1B). There was also an inverse relationship between weight-for-age Z-score and Hb in children aged 6 to 72 months (r = −0.26; p < 0.01; Figure 2). However, when Hb was adjusted for altitude no difference in anemia prevalence was observed between overweight/obese children and children with normal weight (P = .15; Figure 3).
Figure 2.

The relationship between Z-score-weight-for-age and hemoglobin in children aged 6–72 months.
Figure 3.
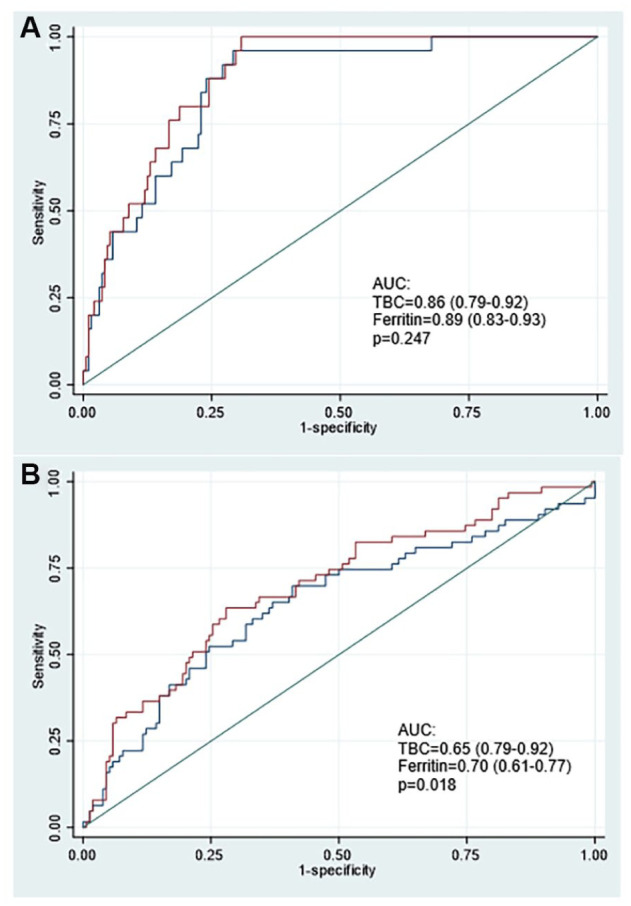
Comparison of areas under the ROC curves considering TBI < 0 and low Ferritin as diagnosis of A. non-adjusted IDA (without adjusted hemoglobin) or B. adjusted IDA (adjusted hemoglobin). Model adjusted by age, sex, altitude of residence, and inflammation (IL-6).
After removing children with low iron status, inflammation, and macrocytic anemia, with Z-score weight per age >2 to <6 and applying the updated WHO hemoglobin threshold values, adjusted only for age (21), we obtained a sub-sample of 125 children that were classified as normal or non-anemic. When the updated WHO hemoglobin threshold values to adjust for age and residence altitude were applied, and the adjusted prevalence of anemia rose to 18.4% (17.9% for boys and 18.9% for girls).
Figure 3 shows the ROC curves, in which hemoglobin adjustment by the altitude of residence presents a lower AUC than using the definition of anemia without Hb adjustment for altitude for the diagnosis of IDA when dosed with ferritin or BIC as markers of ID.
Iron deficiency anemia and inflammatory anemia
High values of hepcidin, ferritin, transferrin saturation, and serum iron were observed in the non-anemic group defined with adjusted or unadjusted hemoglobin for altitude (Table 2). Adjustment of Hb for altitude increased the values of serum hepcidin, ferritin and iron in anemic compared to those defined as anemia without Hb adjustment.
Table 2.
Iron and Inflammatory Biomarkers by Anemia Status (With/Without Hemoglobin Adjustment for Altitude) in Children in Arequipa, Peru in 2023.
| Biomarkers | Unadjusted Hb | Adjusted Hb | ||
|---|---|---|---|---|
| With anemia | Without anemia | With anemia | Without anemia | |
| M [P25, P75] | M [P25, P75] | M [P25, P75] | M [P25, P75] | |
| Hepcidin (ng/ml) | 2.7 [1.2, 6.7] | 9.2 [5.0, 14.1]** | 11.2 [2.7, 13.4] | 9.3 [5.4, 13.6]* |
| Ferritin (µg/l) | 13.0 [3.3, 25.0] | 32.6 [17.7, 44.3]** | 21.7 [9.6, 37.7] | 33.6 [18.9, 46.7]** |
| Transferrin | 484.9 [294, 551] | 319 [269, 393]** | 337 [266, 474] | 318 [274, 377] |
| TSAT (%) | 7.6 [4.3, 14.9] | 17.5 [10.5, 23.3]** | 10.4 [6.6, 20.3] | 18.6 [12.8, 24.2]** |
| Iron | 48 [30, 91] | 82 [54, 107]** | 54.5 [37, 85] | 87 [62, 110]** |
| TIBC | 7.6 [4.3, 14.9] | 17.5 [10.5, 23.3]** | 10.4 [6.6, 20.3] | 18.6 [12.8, 24.2] |
| CRP (mg/l) | 2 [1, 6] | 7 [1, 11]* | 6 [1, 10] | 7 [1, 11] |
| IL-6 (pg/ml) | 33.1 [19.5, 48.0] | 22.2 [16.3, 30.4]* | 24.9 [18.6, 34.7] | 20.3 [16.0, 30.8]* |
TSAT; Transferrin saturation. TIBC: total iron binding capacity. M: median. P25: percentile 25.
Mann-Whitney U test: **P < .001; *P < .05 anemia versus without anemia in the unadjusted Hb group or the adjusted Hb group analyzed separately.
IL-6 was higher in anemics with unadjusted Hb for altitude concerning anemics defined after Hb adjustment for altitude. In anemics with unadjusted Hb for altitude, IL-6 was higher than in those without anemia (P < .05; Table 2). CRP was significantly higher in the group without anemia respect to children with anemia defined with unadjusted Hb for altitude.
RBC, Hb, CRP, Hct, and MCHM values were higher among children living at higher altitudes (Supplemental Table 3). Serum iron, sTfR, TSAT, and hepcidin increase with altitude.
ID was observed at 5.6% and iron overload in 4.8% of cases. Inflammation was observed in 26.5% of children using CRP and 15.3% using serum IL-6 levels as markers.
Prevalence of Etiologies of Anemia According to Corpuscular Index and Inflammation
The prevalence of anemia associated with microcytosis was similar with and without Hb adjustment (9.7% vs 7.5%; P > .05, Table 3). The prevalence of inflammatory anemia by serum IL-6 levels were 27% without adjusting Hb for altitude and 19% in adjusted anemia (P = .37). The prevalence of anemia with CRP > 10 mg/L was 3.6% and 20% for unadjusted and adjusted anemia, respectively (P = .039).
Table 3.
Prevalence of Etiologies of Anemia, Iron Deficiency and Inflammation in Children aged 6 to 72 months in Arequipa, Peru.
| Categories | Age groups | P-value | ||
|---|---|---|---|---|
| 6-72 months | 6-23 months | 24-72 months | ||
| Unadjusted microcytic anemia | 9.7% (3/31) | 14.3% (2/14) | 5.9% (1/17) | .47 |
| Adjusted microcytic anemia | 7.5% (6/80) | 13.8% (5/36) | 2.3% (1/44) | .049 |
| Unadjusted IDA (Low TSAT +Low SF)/Anemia | 32.2% (10/31) | 50% (7/14) | 17.6% (3/17) | .06 |
| Adjusted IDA (Low TSAT +Low SF)/Adjusted anemia | 23.8% (19/80) | 36% (13/36) | 13.6% (6/44) | .018 |
| Macrocytic anemia/anemia | 3.2% (1/31) | 0% (0/14) | 5.9% (1/17) | .88 |
| Macrocytic adjusted anemia/adjusted anemia | 2.5% (2/80) | 0% (0/36) | 4.5% (2/44) | .67 |
| Inflammatory anemia IL-6 > 40 pg/ml/anemia |
27% (7/26) | 33% (4/12) | 21% (3/14) | .49 |
| Inflammatory adjusted anemia IL-6 > 40 pg/ml/ adjusted anemia |
19% (13/70) | 12% (4/33) | 24% (9/37) | .19 |
| Inflammatory anemia CRP > 10/anemia |
3.6% (1/28) a | 0% (0/13) | 6.6% (1/15) | .91 |
| Inflammatory adjusted anemia CRP > 10 |
20% (16/80) | 25% (9/36) | 16% (7/44) | .31 |
| Overweight/obesity induced anemia | 19% (6/31) | 21% (3/14) | 18% (3/17) | .79 |
| Overweight/obesity induced adjusted anemia | 11% (9/80) | 8.3% (3/36) | 13.6% (6/44) | .45 |
IDA was defined when Hb is lower than cutoff recommended by the WHO (WHO, 2024) and low serum ferritin. Microcytic anemia when Hb is low and MCV is lower than 72 fL. Overweight/Obesity induced anemia was defined as unadjusted anemia with Z-score >2–<6 for weight per age.
P = .039 (Chi square test) between unadjusted and adjusted anemia.
Correlations Between Altitude and Several Hematological Parameters, Iron Status Markers and Inflammation Markers
Altitude was associated directly with Hb concentration, adjusted Hb, hematocrit, MCH, MCHC, ferritin, sTfR and hepcidin (Supplemental Table 4). CRP increased, but IL-6 decreased with higher altitude (P = .0001). In this population, the normal values of Hb measured by 2.5, 5, 50, 90, and 95 percentiles were lower than those defined by the 2024 WHO guideline 7 (Supplemental Table 5).
Discussion
The use of the updated guidelines of the WHO to diagnose anemia generated a higher prevalence of anemia in children residing between 500 and 3000 m and reduced the prevalence among those residing at 3500 m. 36 Overweight/obesity was associated with anemia. Many of those who had anemia with altitude adjustment did not have an identified etiology of anemia. There was a correlation between blood markers and altitude of residence.
There is mounting evidence that supports the need to potentially revise the adjustment of Hb for altitude of residence. Studies in Asia and Africa suggest that in the absence of ID, Acute and chronic inflammation, hemoglobinopathies and other inherited red blood cell disorders, anemia may simply be due to the adjustment of the Hb for altitude.10,11 In the absence of any known cause of anemia is the most likely explanation of anemia in these healthy individuals may be a misdiagnosis. In our study, children without anemia and without causes of anemia the prevalence of anemia rose from zero to 18.4% through altitude adjustment. Additional studies are warranted to assess if children who had anemia only with altitude adjustment may have underlying hemoglobinopathies or other vitamin deficiencies.
Likewise, studies conducted in the Americas region show that Argentina provides evidence of a strong association between inflammatory processes, such as the presence of parasites and the prevalence of anemia. 37 In Brazil at 800 m above sea level used the new recommendations from the WHO for population living at different altitudes. However, they failed to use the recommendations from the WHO for children aged 6 to 23 months (Hb<10.5 g/dl) and aged 24 to 59 months (Hb < 11 g/dl). In such study, anemia was considered when hemoglobin < 10.9 g/dL for children under 24 months; and hemoglobin < 11.4 g/dL for children over 24 months. 38
We observed several correlations between altitude of residence and biomarkers important in the diagnosis of anemia, yet no anemia in children with some deficiencies. Hb, adjusted Hb, hematocrit and MCHC were directly related to the altitude of residence, suggesting higher erythropoietic activity or reduction of plasma volume with increasing altitude. sTfR was also directly related to altitude, suggesting that high erythropoietic activity is occurring in the children as altitude of residence is increased. Increasing sTfR values reflect the activity of infant erythropoiesis. 39 All other iron markers were not modified suggesting that if high prevalences of anemia at high altitudes are observed compared to anemia at low altitudes, this is not due to ID.
Overweight/obesity is a prevalent condition in children and is considered a state of low-grade inflammation. In our study, no significant correlations were observed for IL-6 and weight for age and CRP and weight for age. This aligns with the finding that serum IL-6, and CRP levels were not significantly associated with overweight/obesity in Hispanic children aged 2 to 10 years were recruited at a large community health center in Northeast Tennessee. 40
The measurement of inflammatory markers such as C-reactive protein (CRP) and interleukin-6 (IL-6) is relevant, as their levels serve as indirect indicators of increased hepcidin, hormone that regulates iron bioavailability. 41 Hepcidin exerts its effect by blocking ferroportin, a transmembrane protein responsible for iron transport from storage tissues to developing erythroblasts, enabling their maturation into erythrocytes. 42 While the daily iron absorption from dietary sources is approximately 1 mg, the body relies on about 25 mg of iron from internal reserves. 43 Consequently, an upregulation of the inflammatory response, through elevated hepcidin, can result in a more rapid onset of anemia compared to cases caused solely by nutritional deficiencies.
At birth, full-term infants typically have high hemoglobin levels (16-22 g/dL), predominantly fetal hemoglobin (HbF), as an adaptation to intrauterine hypoxia. Following delivery, HbF is broken down and the iron released is stored—mainly as ferritin in the liver and reticuloendothelial tissues—and is subsequently mobilized to support erythropoiesis and adult hemoglobin (HbA) production during the first months of life. Umbilical cord ferritin studies indicate that 70% to 80% of fetal iron at term resides in red blood cells, while the rest is in storage forms (ferritin/hemosiderin) and tissue proteins (eg, 10% in myoglobin). 44
Iron recycling supplies approximately 80% of daily iron needs for red cell production via macrophage-mediated erythrophagocytosis (20-25 mg of iron daily), with only ~1-2 mg/day requiring absorption from the diet. 45 In healthy term infants, endogenous stores generally meet iron requirements for around 4 to 6 months, but preterm or low birth–weight infants with reduced iron stores face higher risk of early iron deficiency and anemia. 46
It follows that the major source of iron for erythropoiesis comes from stored iron rather than from diet. The release of stored iron is also regulated by the decrease in circulating hepcidin. When there is inflammation, there is a decrease in iron output from the storage tissues because hepcidin levels increase due to inflammation. 47 This determines that anemia is more likely to occur when there are underlying inflammatory processes.
This is in accordance with previous study highlighting the importance of prior diagnosis of anemia in the child population, as well as the detection of the main risk factors that can increase its prevalence, including inflammation and reinforces the recommendations of the WHO, emphasizing the global evidence-based recommendations on the use of indicators to assess iron status in the population and the joint assessment with indicators of iron status and acute phase proteins. 38
In our study, a correlation between overweight/obesity and lower Hb levels was observed in the face of an absence of inflammation. It is possible that it could be due to other causes, such as environmental pollutants which are common in Peru. 48 Oxidative stress pathways, resulting in endocrine alterations, could explain obesity in children but this needs to be further demonstrated. Pollution has also been shown to increase the severity of anemia. 49 Our findings suggest that obesity may act independently of an inflammatory process by producing anemia through the oxidative stress pathway.
Finally, the ROC area under the curve shows that the adjustment of Hb for altitude resulted in lower AUC than using Hb without adjustment for altitude to define anemia. These data suggest that it is unnecessary to adjust Hb for altitude and that high prevalence of anemia observed in the population living at 1000 to <3000 m is mainly due to wrong anemia diagnosis.
Recent evidence from the BRINDA team indicates that traditional altitude-adjustment formulas may underestimate anemia prevalence at moderate altitudes (~3000 m), with differences ranging from 3 to 22 percentage points across study sites. 50 In response, WHO adopted a new correction formula for anemia diagnosis at altitude. 7 At high elevations, elevated hemoglobin is a normal adaptation to reduced oxygen pressure; however, using inappropriate Hb cut-offs may overestimate anemia and obscure conditions like excessive erythrocytosis or chronic mountain sickness. 51 Our results suggest that current adjustment of Hb by altitude seems to be still unsuitable for diagnosing anemia.
Another problem with generalizing the use of altitude-adjusted hemoglobin is that populations with longer number of generations living at high altitude typically have less hemoglobin than newer populations residing at altitude. As an example, we have the lower hemoglobin values in populations of Tibetans who are older than the Han residing in Tibet, and those of inhabitants in Puno who are older than those living in the central Andes of Peru.52,53
To effectively reduce the prevalence of anemia in populations, it is important to broaden the scope of analysis by incorporating socioeconomic and environmental variables and further examining the practical implications of the findings. Future studies should address these gaps to strengthen the scientific foundation and enhance the applicability of the results. Although there is an inverse relationship between socioeconomic status and anemia prevalence, this association can be influenced by ethnicity. 6 Similarly, increased exposure to environmental pollutants has been associated with greater severity of anemia in children. 49
Limitations
Although CRED has a good level of coverage, since it is implemented and executed in all first-level health facilities of the public sector, it is possible that due to the barriers and difficult access that some families may have, representativeness may be lost, thus generating a decrease in the external validity of the study. In addition, due to the obligatory nature of the current regulations, there is a high probability that part of the samples are actively receiving preventive or therapeutic treatment with iron, or another micronutrients, impacting the differential diagnosis of etiologies. Anemia as a multicausal condition has several socioeconomic variables (family basket, access to basic services, level of education, etc.) that influence its development and/or management, so there is a group of variables in the social sphere that makes it impossible to have a broad understanding of the condition. These variables were not evaluated in the study, so future research should consider them.
Conclusions
Iron status in children aged 6 to 72 months was similar among low and at high altitude residents. Overweight and obesity were associated with an increase in the prevalence of anemia. Our results suggest that the most appropriate marker for the diagnosis of anemia in infants may be uncorrected Hb. Further studies are warranted to assess clinical outcomes that may or may not result from anemia that is the result of altitude adjustment.
Supplemental Material
Supplemental material, sj-docx-1-inq-10.1177_00469580251372827 for The New WHO Cut-off Point for Defining High-altitude Anemia may be Inadequate by Gustavo F. Gonzales, Cinthya Vásquez-Velásquez, Sandra Yucra, Vilma Tapia, Manuel Gasco, Parminder S Suchdev, Chris A. Rees and Julio Aguilar in INQUIRY: The Journal of Health Care Organization, Provision, and Financing
Supplemental material, sj-pdf-2-inq-10.1177_00469580251372827 for The New WHO Cut-off Point for Defining High-altitude Anemia may be Inadequate by Gustavo F. Gonzales, Cinthya Vásquez-Velásquez, Sandra Yucra, Vilma Tapia, Manuel Gasco, Parminder S Suchdev, Chris A. Rees and Julio Aguilar in INQUIRY: The Journal of Health Care Organization, Provision, and Financing
Footnotes
ORCID iDs: Gustavo F. Gonzales  https://orcid.org/0000-0003-1611-2894
Cinthya Vásquez-Velásquez
https://orcid.org/0000-0002-3326-0437
Sandra Yucra
https://orcid.org/0000-0002-7936-7467
Vilma Tapia
https://orcid.org/0000-0001-5966-8978
Manuel Gasco
https://orcid.org/0000-0001-8739-9533
Parminder S Suchdev
https://orcid.org/0000-0002-0350-3469
Chris A. Rees
https://orcid.org/0000-0001-6449-0377
Julio Aguilar
https://orcid.org/0000-0003-1461-1120
Funding: The authors disclosed receipt of the following financial support for the research, authorship, and/or publication of this article: This research has been funded by the Jorge Basadre Grohmann-Tacna National University, approved with Rectoral Resolution No. 4596-2018-UNJBG, financed with the Canon, Sobrecanon and Mining Royalties funds. Dr. Rees was supported, in part, by the US National Institutes of Health (K23HL173694). The funders had no role in the study design or in the collection, analysis, or interpretation of the data. The funders did not write the report and had no role in the decision to submit the paper for publication.
The authors declared no potential conflicts of interest with respect to the research, authorship, and/or publication of this article.
Supplemental Material: Supplemental material for this article is available online.
References
- 1. GBD 2021 Anaemia Collaborators. Prevalence, years lived with disability, and trends in anaemia burden by severity and cause, 1990–2021: findings from the Global Burden of Disease Study 2021. Lancet Haematol. 2023;10(9):e713-e734. doi: 10.1016/S2352-3026(23)00160-6. [DOI] [PMC free article] [PubMed] [Google Scholar]
- 2. Basak A, Sankaran VG. Regulation of the fetal hemoglobin silencing factor BCL11A. Ann N Y Acad Sci. 2016;1368(1):25-30. doi: 10.1111/nyas.13024 [DOI] [PMC free article] [PubMed] [Google Scholar]
- 3. Mujica-Coopman MF, Brito A, López de Romaña D, Ríos-Castillo I, Coris H, Olivares M. Prevalence of Anemia in Latin America and the Caribbean. Food Nutr Bull. 2015;36(2 Suppl.):S119-S128. doi: 10.1177/0379572115585775 [DOI] [PubMed] [Google Scholar]
- 4. World Bank. Prevalence of anemia among children (% of children ages 6–59 months) – Peru, Chile, Colombia, Ecuador, Bolivia, Argentina. World Bank Data. Updated 2024. Accessed July 15, 2025. https://datos.bancomundial.org/indicador/SH.ANM.CHLD.ZS?locations=PE-CL-CO-EC-BO-AR&view=chart
- 5. National Institute of Statistics and Informatics (INEI). Peru: Demographic and Family Health Survey 2023 (ENDES 2023). Lima, Peru: National Institute of Statistics and Informatics; 2024. Accessed July 18, 2025. https://www.inei.gob.pe
- 6. Al-Kassab-Córdova A, Intimayta-Escalante C, Robles-Valcarcel P, Urrunaga-Pastor D, Cabieses B. Ethnic disparities in the association between maternal socioeconomic status and childhood anemia in Peru: a nationwide multiyear cross-sectional study. Lancet Reg Health Am. 2025;47:101117. Published 2025 May 23.doi: 10.1016/j.lana.2025.101117 [DOI] [PMC free article] [PubMed] [Google Scholar]
- 7. World Health Organization. Guideline on haemoglobin cutoffs to define anaemia in individuals and populations. WHO; 2024. [PubMed] [Google Scholar]
- 8. Choque-Quispe BM, Vásquez-Velásquez C, Gonzales GF. Evaluation of dietary composition between hemoglobin categories, total body iron content and adherence to multi-micronutrients in preschooler residents of the highlands of Puno, Peru. BMC Nutr. 2024;10(1):28. doi: 10.1186/s40795-024-00837-x [DOI] [PMC free article] [PubMed] [Google Scholar]
- 9. Choque-Quispe BM, Alarcón-Yaquetto DE, Paredes-Ugarte W, Zaira A, Ochoa A, Gonzales GF. Is the prevalence of anemia in children living at high altitudes real? An observational study in Peru. Ann N Y Acad Sci. 2020;1473(1):35-47. doi: 10.1111/nyas.14356 [DOI] [PubMed] [Google Scholar]
- 10. Sarna K, Gebremedin A, Brittenham GM, Beall CM. WHO hemoglobin thresholds for altitude increase the prevalence of anemia among Ethiopian highlanders. Am J Hematol. 2018;93(9):E229-E231. doi: 10.1002/ajh.25194 [DOI] [PubMed] [Google Scholar]
- 11. Sarna K, Brittenham GM, Beall CM. Current WHO hemoglobin thresholds for altitude and misdiagnosis of anemia among Tibetan highlanders. Am J Hematol. 2020;95(6):E134-E136. doi: 10.1002/ajh.25765. [DOI] [PubMed] [Google Scholar]
- 12. Gonzales GF, Rubín de, Celis V, Begazo J, et al. Correcting the cut-off point of hemoglobin at high altitude favors misclassification of anemia, erythrocytosis and excessive erythrocytosis. Am J Hematol. 2018;93(1):E12-E16. doi: 10.1002/ajh.24932 [DOI] [PMC free article] [PubMed] [Google Scholar]
- 13. Khurana R, Kanvinde P, Mudaliar S. Revised WHO Guidelines on hemoglobin cutoffs to define anemia in individuals and populations. Indian Pediatr. 2024;61(7):671-674. [PubMed] [Google Scholar]
- 14. Gonzales GF, Suarez Moreno VJ. Hemoglobin levels for determining anemia: new World Health Organization guidelines and adaptation of the national standard. Rev Peru Med Exp Salud Publica. 2024;41(2):102-104. doi: 10.17843/rpmesp.2024.412.13894. [DOI] [PMC free article] [PubMed] [Google Scholar]
- 15. Vásquez-Velásquez C, Choque-Quispe BM, Suchdev PS, et al. Changes in anemia and proportion of anemia associated with iron deficiency or inflammation in young children residing in Puno, Peru: Analysis using new World Health Organization guidelines for defining anemia. PLOS One. Manuscript under review. [Google Scholar]
- 16. Figueroa-Mujica R, Ccahuantico LA, Ccorahua-Rios MS, et al. A critical analysis of the automated hematology assessment in pregnant women at low and at high altitude: association between red blood cells, platelet parameters, and iron status. Life (Basel). 2022;12(5):727. doi: 10.3390/life12050727 [DOI] [PMC free article] [PubMed] [Google Scholar]
- 17. Alarcón-Yaquetto DE, Figueroa-Mujica R, Valverde-Bruffau V, et al. Hematological parameters and iron status in adult men and women using altitude adjusted and unadjusted hemoglobin values for anemia diagnosis in Cusco, Peru (3400 MASL). Physiologia. 2022; 2(1):1-19. 10.3390/physiologia2010001 [DOI] [Google Scholar]
- 18. Choque-Quispe BM, Paz V, Gonzales GF. Proportion of anemia attributable to iron deficiency in high-altitude infant populations. Ann Hematol. 2019;98(11):2601-2603. doi: 10.1007/s00277-019-03823-7. [DOI] [PubMed] [Google Scholar]
- 19. INEI – Censos Nacionales de Población y Vivienda. Arequipa: Resultados definitivos. Perú: 2017:1–1173. [Google Scholar]
- 20. MINSA. Control de Crecimiento y Desarrollo (CRED) para menores de 11 años. MINSA: Lima; 2024. Accessed March 30, 2025. https://www.gob.pe/32588-control-de-crecimiento-y-desarrollo-cred-para-menores-de-11-anos
- 21. Schaap CC, Hendriks JC, Kortman GA, et al. Diurnal rhythm rather than dietary iron mediates daily hepcidin variations. Clin Chem. 2013;59(3):527-535. doi: 10.1373/clinchem.2012.194977 [DOI] [PubMed] [Google Scholar]
- 22. Cook JD, Flowers CH, Skikne BS. The quantitative assessment of body iron. Blood 2003;101:3359–3364. [DOI] [PubMed] [Google Scholar]
- 23. Suchdev PS, Williams AM, Mei Z, et al. Assessment of iron status in settings of inflammation: challenges and potential approaches. Am J Clin Nutr. 2017;106(Suppl. 6):1626S-1633S. doi: 10.3945/ajcn.117.155937 [DOI] [PMC free article] [PubMed] [Google Scholar]
- 24. Eie AMØ, Strand MF, Fredriksen PM, Lindberg M. Population-based reference intervals for ferritin, iron, transferrin and transferrin saturation and prevalence of iron deficiency in 6-12-year-old children: the Health Oriented Pedagogical Project (HOPP). Scand J Clin Lab Invest. 2021;81(3):208-212. doi: 10.1080/00365513.2021.1884893 [DOI] [PubMed] [Google Scholar]
- 25. Eleftheriadis T, Liakopoulos V, Antoniadi G, Stefanidis I. Which is the best way for estimating transferrin saturation?. Ren Fail. 2010;32(8):1022-1023. doi: 10.3109/0886022X.2010.502609 [DOI] [PubMed] [Google Scholar]
- 26. WHO child growth standards: length/height-for-age, weight-for-age, weight-for-length, weight-for-height and body mass index-for-age: methods and development. WHO; 2006: 1-312. Accessed March 30, 2025. https://www.who.int/publications-detail-redirect/924154693X [Google Scholar]
- 27. World Health Organization. WHO Guideline: use of ferritin concentrations to assess iron status in individuals and populations. WFO; 2020: 1-82. www.who.int/publications-detail/9789240000124 [PubMed] [Google Scholar]
- 28. Ooi CL, Lepage N, Nieuwenhuys E, Sharma AP, Filler G. Pediatric reference intervals for soluble transferrin receptor and transferrin receptor-ferritin index. World J Pediatr. 2009;5(2):122-126. doi: 10.1007/s12519-009-0024-3 [DOI] [PubMed] [Google Scholar]
- 29. Ogino J, Wilson ML, Hofstra TC, Chan RY. A novel discriminating tool for microcytic anemia in childhood. Clin Pediatr (Phila). 2024;63(10):1387-1394. doi: 10.1177/00099228231221330 [DOI] [PubMed] [Google Scholar]
- 30. Aldrimer M, Ridefelt P, Rödöö P, Niklasson F, Gustafsson J, Hellberg D. Population-based pediatric reference intervals for hematology, iron and transferrin. Scand J Clin Lab Invest. 2013;73(3):253-2561. doi: 10.3109/00365513.2013.769625 [DOI] [PubMed] [Google Scholar]
- 31. Zeng X, Meng X, Wang Y, et al. A reference interval study of ferritin and transferrin levels in donors from two blood centers. Exp Ther Med. 2023;25(5):218. doi: 10.3892/etm.2023.11916 [DOI] [PMC free article] [PubMed] [Google Scholar]
- 32. Benjamin S, Assounga A. Transferrin levels are associated with malnutrition markers in hemodialysis patients in KwaZulu-Natal, South Africa. Ren Fail. 2024;46(1):2337292. doi: 10.1080/0886022X.2024.2337292 [DOI] [PMC free article] [PubMed] [Google Scholar]
- 33. Wang R, Lan L, Xu L, Zhu B, Huang Y. A retrospective cohort study on red blood cell morphology changes in pre-school age children under nitrous oxide anesthesia. BMC Anesthesiol. 2021;21(1):171. doi: 10.1186/s12871-021-01388-5 [DOI] [PMC free article] [PubMed] [Google Scholar]
- 34. Kagujje M, Nyangu S, Maimbolwa MM, et al. The accuracy of point-of-care C-Reactive Protein as a screening test for tuberculosis in children. PLOS Glob Public Health. 2024;4(10):e0003725. [DOI] [PMC free article] [PubMed] [Google Scholar]
- 35. van der Staaij H, Donker AE, Bakkeren DL, et al. Transferrin saturation/hepcidin ratio discriminates TMPRSS6-related iron refractory iron deficiency anemia from patients with multi-causal iron deficiency anemia. Int J Mol Sci. 2022;23(3):1917. doi: 10.3390/ijms23031917 [DOI] [PMC free article] [PubMed] [Google Scholar]
- 36. Pasricha SR, Rogers L, Branca F, Garcia-Casal MN. Measuring haemoglobin concentration to define anaemia: WHO guidelines. Lancet 2024;403(10440):1963-1966. doi: 10.1016/S0140-6736(24)00502-6 [DOI] [PubMed] [Google Scholar]
- 37. Deschutter EJ, Marczuk RK, Blanco NG, Ramos-Rincón JM. Anemia and intestinal parasites in Mbya Guarani children, Misiones, Argentina. Rev Inst Med Trop Sao Paulo. 2024;66:e47. doi: 10.1590/S1678-9946202466047 [DOI] [PMC free article] [PubMed] [Google Scholar]
- 38. de Paiva Lourenção LF, Suano-Souza FI, Fonseca FLA, Simões TMR, da Silva R, Sarni ROS. Impact of inflammation on anemia in children: a cross-sectional study. BMC Pediatr. 2025;25(1):272. doi: 10.1186/s12887-025-05639-z [DOI] [PMC free article] [PubMed] [Google Scholar]
- 39. Prenzel F, Kaiser T, Willenberg A, et al. Reference intervals and percentiles for soluble transferrin receptor and sTfR/log ferritin index in healthy children and adolescents. Clin Chem Lab Med. 2024;63(1):184-192. doi: 10.1515/cclm-2024-0369 [DOI] [PubMed] [Google Scholar]
- 40. Lang H, Loudermilk EN, Clark WA, et al. Inflammatory markers and body mass index among hispanic children. PLoS One. 2024;19(6):e0289523. doi: 10.1371/journal.pone.0289523 [DOI] [PMC free article] [PubMed] [Google Scholar]
- 41. Nemeth E, Ganz T. Hepcidin-ferroportin interaction controls systemic iron homeostasis. Int J Mol Sci. 2021;22(12):6493. doi: 10.3390/ijms22126493 [DOI] [PMC free article] [PubMed] [Google Scholar]
- 42. Srole DN, Ganz T. Erythroferrone structure, function, and physiology: iron homeostasis and beyond. J Cell Physiol. 2021;236(7):4888-4901. doi: 10.1002/jcp.30247 [DOI] [PMC free article] [PubMed] [Google Scholar]
- 43. Ganz T, Nemeth E. Regulation of iron acquisition and iron distribution in mammals. Biochim Biophys Acta. 2006;1763(7):690-699. doi: 10.1016/j.bbamcr.2006.03.014 [DOI] [PubMed] [Google Scholar]
- 44. Siddappa AM, Rao R, Long JD, Widness JA, Georgieff MK. The assessment of newborn iron stores at birth: a review of the literature and standards for ferritin concentrations. Neonatology. 2007;92(2):73-82. doi: 10.1159/000100805 [DOI] [PMC free article] [PubMed] [Google Scholar]
- 45. Slusarczyk P, Mleczko-Sanecka K. The multiple facets of iron recycling. Genes (Basel). 2021;12(9):1364. doi: 10.3390/genes12091364 [DOI] [PMC free article] [PubMed] [Google Scholar]
- 46. Zhang JY, Wang J, Lu Q, Tan M, Wei R, Lash GE. Iron stores at birth in a full-term normal birth weight birth cohort with a low level of inflammation. Biosci Rep. 2020;40(12):BSR20202853. doi: 10.1042/BSR20202853 [DOI] [PMC free article] [PubMed] [Google Scholar]
- 47. Lakhal-Littleton S, Peyssonnaux C. Hepcidin and tissue-specific iron regulatory networks. Adv Exp Med Biol. 2025;1480:89-102. doi: 10.1007/978-3-031-92033-2_7 [DOI] [PubMed] [Google Scholar]
- 48. Paz-Aparicio VM, Tapia V, Vasquez-Apestegui BV, Steenland K, Gonzales GF. Intrauterine and extrauterine environmental PM2.5 exposure is associated with overweight/obesity (O/O) in children aged 6 to 59 months from Lima, Peru: a case-control study. Toxics. 2022;10(8):487. doi: 10.3390/toxics10080487 [DOI] [PMC free article] [PubMed] [Google Scholar]
- 49. Morales-Ancajima VC, Tapia V, Vu BN, Liu Y, Alarcón-Yaquetto DE, Gonzales GF. Increased Outdoor PM2.5 concentration is associated with moderate/severe anemia in children aged 6-59 months in Lima, Peru. J Environ Public Health. 2019;2019:6127845. doi: 10.1155/2019/6127845 [DOI] [PMC free article] [PubMed] [Google Scholar]
- 50. Sharma AJ, Addo OY, Mei Z, Suchdev PS. Reexamination of hemoglobin adjustments to define anemia: altitude and smoking. Ann N Y Acad Sci. 2019;1450(1):190-203. doi: 10.1111/nyas.14167 [DOI] [PMC free article] [PubMed] [Google Scholar]
- 51. Boulares A, Bragazzi NL, Gonzales GF, et al. Addressing anemia in high-altitude populations: global impact, prevalence, challenges, and potential solutions. Am J Hematol. Published online July 2, 2025. doi: 10.1002/ajh.27761 [DOI] [PMC free article] [PubMed] [Google Scholar]
- 52. Gonzales GF, Tapia V, Vásquez-Velásquez C. Changes in hemoglobin levels with age and altitude in preschool-aged children in Peru: the assessment of two individual-based national databases. Ann N Y Acad Sci. 2021;1488(1):67-82. doi: 10.1111/nyas.14520 [DOI] [PMC free article] [PubMed] [Google Scholar]
- 53. Wu T, Wang X, Wei C, et al. Hemoglobin levels in Qinghai-Tibet: different effects of gender for Tibetans vs. Han. J Appl Physiol (1985). 2005;98(2):598-604. doi: 10.1152/japplphysiol.01034.2002 [DOI] [PubMed] [Google Scholar]
Associated Data
This section collects any data citations, data availability statements, or supplementary materials included in this article.
Supplementary Materials
Supplemental material, sj-docx-1-inq-10.1177_00469580251372827 for The New WHO Cut-off Point for Defining High-altitude Anemia may be Inadequate by Gustavo F. Gonzales, Cinthya Vásquez-Velásquez, Sandra Yucra, Vilma Tapia, Manuel Gasco, Parminder S Suchdev, Chris A. Rees and Julio Aguilar in INQUIRY: The Journal of Health Care Organization, Provision, and Financing
Supplemental material, sj-pdf-2-inq-10.1177_00469580251372827 for The New WHO Cut-off Point for Defining High-altitude Anemia may be Inadequate by Gustavo F. Gonzales, Cinthya Vásquez-Velásquez, Sandra Yucra, Vilma Tapia, Manuel Gasco, Parminder S Suchdev, Chris A. Rees and Julio Aguilar in INQUIRY: The Journal of Health Care Organization, Provision, and Financing