

Abstract
Calyx afferents, a group of morphologically and physiologically distinct afferent fibers innervating the striolar region of vestibular sensory epithelia, are selectively labeled by antibodies to the calcium-binding protein calretinin. In this study, the population of calretinin-stained calyx afferents was used to delineate and quantify the striolar region in six rodent species: mouse, rat, gerbil, guinea pig, chinchilla, and tree squirrel. Morphometric studies and hair cell and calyx afferent counts were done. Numbers of hair cells, area, length, and width of the sensory epithelium increase from mouse to tree squirrel. In the mouse and rat, calretinin is found in 5–9% of all type I hair cells, 20 – 40% of striolar type II hair cells, and 70 – 80% of extrastriolar type II hair cells. Numbers of calyx afferents increase from mouse to squirrel, with more complex calyx afferents in larger species. About 10% of calyx afferents are branched. Based on our counts of total numbers of calyx afferents in chinchilla maculae and in comparison to fiber counts in the literature, the proportion of calyx afferents is greater than previously described, constituting nearly 20% of the total. Because morphometric measures increase with body weight, we obtained additional data on vestibular end organ surface areas from the literature and used this to construct a power law function describing this relationship. The function holds for species with body weights less than ~4 kg. Greater than 4 kg, the surface area of the sensory epithelia remains constant even with increasing body weight.
INTRODUCTION
Vestibular neuroepithelia show a regional variation in their cellular and synaptic architecture (Lysakowski and Goldberg 1997) as well as in the branching patterns of their afferents (Fernández et al. 1988, 1990, 1995; Lorente de Nó 1926). In the case of either the saccular and utricular maculae, there is a narrow striola, running for much of the length of the neuroepithelium and separating two broader, extrastriolar regions (Engström and Wersäll 1958; Lorente de Nó 1926; Werner 1933). Otoconia over the striola are distinctively small (Lorente de Nó 1926; Werner 1933). Compared with the extrastriola, the striola has larger, less densely packed hair cells (Lindeman 1969) with shorter and fatter hair bundles (Denman-Johnson and Forge 1999). Type I hair cells in the striola are more numerous than type II hair cells, whereas in the extrastriola the two kinds of hair cells occur in nearly equal numbers (Engström and Wersäll 1958; Lindeman 1969; Watanuki and Meyer zum Gottesberge 1971). Afferents respect zonal boundaries, so that the striola and extrastriola get largely independent innervations. A reversal line running through the middle of the striola separates hair cells with opposite polarizations (Flock 1964; Spoendlin 1964). Afferents are not observed to cross the reversal line.
Three kinds of afferents are found (Fernández et al. 1990). Calyx afferents supply type I hair cells, bouton afferents innervate type II hair cells, and dimorphic afferents contact both kinds of hair cells. Dimorphic fibers are found throughout the neuroepithelium, whereas calyx afferents are confined to the striola and the relatively small number of bouton fibers to the extrastriola. Calyx endings can be considered simple or complex depending on whether they innervate one or more type I hair cells. Complex calyx endings are much more numerous in the striola, where they preferentially innervate calyx afferents. Even dimorphic fibers show a regional diversity with those running to the striola having fewer branches, smaller terminal fields and fewer bouton endings. There is some suggestion that adjacent to the striola there is a narrow, juxtastriolar region the innervation patterns of which are transitional between the striola and extrastriola (Fernández et al. 1990).
As might have been anticipated, afferents innervating the striola and extrastriola differ in their physiology (Goldberg et al. 1990b). Remarkably, the afferents are also neurochemically distinct. There is a marker protein, calretinin, that labels calyx afferents. Calretinin is a 29-kDa calcium-binding protein expressed in the retina (Rogers 1987), cerebellum (Rogers 1989), and inner ear (Dechesne et al. 1991). In the inner ear of rats, guinea pigs and gerbils, calretinin was immunochemically localized in ganglion cells and inner hair cells of the cochlea and in large vestibular ganglion cells and calyces surrounding type I hair cells (Dechesne et al. 1991; Kevetter and Leonard 2002). Desmadryl and Dechesne (1992) demonstrated that calretinin was found in calyx afferents in guinea pig and chinchilla cristae. Additional studies have used calretinin as a marker for vestibular hair cells during development in the mouse (Bermingham et al. 1999; Dechesne et al. 1994) and rat (Zheng and Gao 1997). Other marker proteins, such as other calcium-binding proteins and the intermediate-filament protein, peripherin, also have distinctive patterns of immunostaining in the vestibular periphery (Leonard and Kevetter 2002; Lysakowski et al. 1999; Sans et al. 2001). Calbindin stains calyx and dimorphic fibers in the striola and juxtastriola, peripherin stains bouton fibers, and parvalbumin stains all afferents. S-100 immunoreactivity has been observed in type I and type II vestibular hair cells and in the nerve calyces surrounding type I hair cells (Foster et al. 1994).
In this study, we used calretinin to stain calyx afferents and, thereby to delimit the boundaries of the striola. We were then in a position to compare the striola and extrastriola in a number of morphological features, including number of hair cells, ratio of type I to type II cells, surface area, and hair-cell density. Some of the measurements were intended to guide the placement of microelectrodes in in vitro epithelial preparations (see, for example, Vollrath and Eatock 2003). The methods were employed in several rodent species, most of whom have been used in vestibular research. We were interested in determining whether morphological trends were similar across species. Although this was the case, there were sufficient cross-species differences such that results from one species can lead to misleading conclusions when applied to another species. We examined the allometric relationship between the morphological features and body weight in an attempt to account for some of the differences. The squirrel has not been used previously in vestibular research. It was included in this study because its arboreal lifestyle suggested that its peripheral vestibular organs might be specialized in some way. Finally, in the mouse and rat, calretinin staining was not confined to calyx afferents but was also found in some type II hair cells. This raised the possibility of cross-reactivity with other proteins. For example, calretinin shares a 58% homology with calbindin (Rogers 1987). We present evidence that our staining was not due to such cross-reactivity.
The material in this publication is based on a thesis presented by S. S. Desai in partial fulfillment of the requirements for a doctoral degree at the Graduate College of the University of Illinois at Chicago. We have presented preliminary data in abstract form (Desai and Lysakowski 2002; Desai et al. 2000; Zeh et al. 1999).
METHODS
Animals
At least three saccular and three utricular maculae were taken from each of six species representing wild-type pigmented adult males and females of the three suborders of Rodentia: Myomorpha: mouse, rat, gerbil; Caviomorpha: guinea pig, chinchilla; and Scuriomorpha: tree squirrel. For all species used in this study except squirrels, animals were anesthetized using pentobarbital sodium (80 mg/kg ip). CBA/J mice (Mus musculus) and Long-Evans rats (Rattus norvegicus) were obtained from Harlan (Indianapolis, IN), Mongolian gerbils (Meriones unguiculatus) from Charles River (Wilmington, MA), guinea pigs (Cavia porcellus) from Elm Hill (Chelmsford, MA), and chinchillas (Chinchilla laniger) from Moulton Chinchilla Ranch (Rochester, MN). Tree squirrels (Sciureus carolinensis) were cage-trapped in the wild (Illinois Department of Natural Resources Scientific Permit W390) and anesthetized by 4% isofluorane gas. Each animal was perfused transcardially with a heparinized (1,000 IU/100 ml) isotonic vascular rinse solution (consisting of 8.6 g NaCl, 0.3 g KCl, 0.2 g NaHCO3 in 1 l distilled water) until the perfusate was clear of blood (~1 min), followed by 10 min of fixative (4% paraformaldehyde, 1% picric acid, 1% CaCl2, and 1% acrolein) made in 0.1 M phosphate buffer (PB). Calcium chloride was added to facilitate antibody binding (Winsky and Kuźnicki 1995). After perfusion, temporal bones were immersed in the same fixative for 20 min. Fixation and postfixation times were halved for the smaller animals, mice and gerbils. Sensory organs were dissected in PB and processed en toto sequentially through 4% Triton X-100 (1 h), Cal-EX decalcifying solution for 10 min (Fisher Scientific, Pittsburgh, PA), and a 1% aqueous solution of sodium borohydride (10 min) with 0.1 M PB rinses between treatments. All animal tissue was harvested in accordance with the University of Illinois at Chicago Institutional Animal Care and Use Committee (IACUC) approved protocols.
Immunohistochemistry
Whole sensory organs were blocked in a solution of 10% normal goat serum (Chemicon, Temecula, CA) in 0.01 M phosphate-buffered saline (PBS) for 1 h, followed by 1:1,000 rabbit anti-guinea pig calretinin IgG (Chemicon) in the same blocking solution (18 –24 h) and 1:1,000 biotinylated goat anti-rabbit IgG (Chemicon) secondary antibody in PBS (2 h). Sensory organs were rinsed, incubated per ABC Elite kit instructions (Vector Laboratories, Burlingame, CA) for 2 h at room temperature or overnight at 4°C, and reacted using 0.5% DAB (Sigma, St. Louis, MO) and 0.003% hydrogen peroxide in PB. The reaction was monitored in the microscope until judged to be complete, meaning that no further reaction occurred. Calyx staining was intense, filling the cytoplasm of the terminal (Fig. 1A), and staining not only the afferent terminal, but also the fiber, the ganglion cell and the central terminations (not shown).
FIG. 1.

Calretinin staining in calyx afferents. A: illustration of the intense calretinin staining in calyx afferents. This example is taken from chinchilla crista ampullaris. Scale bar = 20 μm. B: squirrel utricular macula showing afferent branching. In agreement with Fernández et al. (1990), ~10% of the total afferents branched to contact either 2 simple calyx afferents, 1 single and 1 complex calyx afferent, or 2 complex calyx afferents. Thirty percent of the branched calyx afferents contacted 2 simple calyx afferents, as shown above. C: fifty percent of branched calyx afferents contacted a simple calyx afferent and a double complex calyx afferent (black arrowhead). Ten percent of branched calyx afferents contacted 2 double complex afferents (white arrowhead), and the remaining 10% contacted a simple calyx afferent and a triple complex calyx afferent. Branched afferents were within 20 μm of each other and did not cross the reversal line of the striola. Scale bars for B and C = 50 μm.
After immunostaining, otolith organs were flattened by coverslipping in 0.1 M PB on a clean glass slide. Camera lucida drawings were made of each sensory organ, which was then photographed and digitized for quantitative morphometry. These morphometric measurements are not corrected for shrinkage artifact, which we estimated to range from 5–10%.
Quantitative studies
Three saccular maculae and three utricular maculae from each species were postfixed with 1% osmium tetroxide (Ted Pella, Redding, CA) and embedded in Araldite resin (Fluka, Ronkonkoma, NY). Serial transverse semi-thin (2 μm) sections were cut, mounted on slides, counterstained using Richardson’s stain (Richardson et al. 1960) to visualize type I and type II hair cells, and coverslipped using Permount. The kinocilia and stereocilia on these sections were examined using a ×100 objective to determine the reversal line, the point at which kinocilia have opposite orientations.
The disector method was used to estimate the total number of type I, type II, and supporting cells for each sensory organ (Sterio 1984; see also Fig. 1 of Fernández et al. 1995). Supporting cells could be distinguished by their dense, multinucleolar nuclei located nearest the stroma. Type I hair cells were surrounded by a calyx terminal and their nuclei were generally located just above the supporting cell nuclei. Type II hair cells lacked a calyx ending and generally had their nuclei positioned closest to the apical edge of the sensory epithelium. No nucleus was entirely contained within one 2-μm section. The average of forward and reverse counts (see Fig. 2 legend) gave us a value, “Q” (Sterio 1984). Three Q−s were obtained for each sample: the number of type I and type II hair cells and supporting cells. We conducted these counts every 50 μm throughout the entire sensory epithelium, summed the results, and multiplied by 25 to estimate the total population of each type of cell.
FIG. 2.

The use of the disector method for hair cell counts. Adjacent 2-μm sections were used to estimate the population of type I, type II, and supporting cells (small arrows). Nuclei from each cell type contained in the reference section (A) but not in the lookup section (B) were counted. No nucleus was contained entirely in 1 section. Black dots code for type I and II hair cells found in both sections. White dots indicate hair cells found in only one of the 2 sections. The reference section and lookup section were then reversed to provide an independent set of counts. Averaging the number of each type of hair cell coded by the white dots from these 2 counts was used to determine Q−. Photomicrographs are taken from the rat saccular macula, and the plane of the section is shown in the inset. Black arrowheads indicate type II hair cells that are stained using antibodies to calretinin. Scale bar = 50 μm.
Western blot
Western blots were done to confirm that the hair cell staining found in mouse and rat vestibular end organs was calretinin as had been previously demonstrated in rat and guinea pig spiral ganglia homogenates (Dechesne et al. 1991). Saccular and utricular maculae, vestibular ganglia (positive control), cerebellum (positive control), and kidney (negative control) were harvested from adult mice, rats, and chinchillas within 10 min of euthanasia. Chinchilla tissue was also used as a positive control because it is an animal without calretinin staining in hair cells, so all staining must be due to the staining of afferents, both in the end organs and in the ganglia. All animals were anesthetized [pentobarbital sodium (Nembutal), 80 mg/kg] and decapitated, and tissues were dissected in cold PBS. Tissues were homogenized with pestles for 30 s in homogenizing buffer (50 mM HEPES, 250 mM sucrose, pH 7.4) at 4°C. The protein concentration of each sample was determined using a Bio-Rad DC protein assay kit (Bio-Rad, Hercules, CA). Samples were boiled at 95°C for 5 min, 25 ng was loaded in each lane on a 12% gradient acrylamide gel, and the separation was achieved by SDS-PAGE at 140 V for 45 min at room temperature. The protein was then transferred to ImmobilonP membrane using 110 V for 90 min at 4°C (Amersham ECL detection kit, Piscataway, NJ).
The membrane was blocked for 1 h in 5% nonfat milk made in 0.01 M PBS containing 0.1% Tween (Fisher Scientific, Pittsburgh, PA), incubated in 1:1,000 rabbit anti-guinea pig calretinin IgG (Chemicon) primary antibody overnight at 4°C, washed three times 5 min in PBS-Tween, and incubated in 1:30,000 goat anti-rabbit secondary antibody conjugated to horseradish peroxidase (Chemicon) for 50 min at room temperature. After washing three times 5 min again, the membrane was reacted with a Pierce Illuminator kit (Pierce, Rockford, IL) and peroxidase solutions for 5 min and exposed to Kodak LS film. The film was digitized and labels were added in Adobe Photoshop.
Morphometry
All measurements were done using Sigma Scan Pro (Jandel Scientific, San Rafael, CA). Unless otherwise stated, results are expressed as means ± SE. Comparisons are based on paired one-way ANOVAs with a post hoc Tukey HSD analysis using Igor Pro (Wavemetrics, Lake Oswego, OR). To determine the relationship between body weight and several morphometric traits, a power function was fit to the data, also using Igor Pro. χ2 goodness of fit tests were used to compare distributions; all comparisons were considered significant if P < 0.01. Our morphometric measurements in the saccular and utricular maculae were also compared using gender and the side of the head from where the organs were collected as variables, but no significant correlations were found (r < 0.70).
MACULAR MEASUREMENTS
The areas of the saccular and utricular maculae were measured, as illustrated in Fig. 3 for examples taken from the chinchilla. The area of the striola (AS), delineated as the region containing > 99% of the calretinin-stained calyx afferents, was measured. We also determined the areas of the saccular dorsal extrastriola (ADES), saccular ventral extrastriola (AVES), utricular medial extrastriola (AMES), utricular lateral extrastriola (ALES), the anterior-posterior length of the sensory epithelium (APLSE), dorsal-ventral length of the saccular macula (DVLSE), and medial-lateral length of the utricular macula (MLLSE). The reversal line of the kinocilia was found by examining 2-μm sections every 50 μm; this line was used to measure the length of the striola (LS). The extrapolation of this line to the edges of the neuroepithelium (ELS) separates the dorsal/medial extrastriola from the ventral/lateral extrastriola and allows us to compare the length of the striola relative to the length of the sensory epithelium. The mean width of the striola (
 S) and the distance of the striola (DS) from the lateral edge of the sensory epithelium were measured at 25 μm intervals along lines perpendicular to the reversal line starting from the anteromedial end to the posterior end.
FIG. 3.

Morphometric features of the otolithic organs described in this study. A: schematic of saccular macula with divisions and measurements based on chinchilla. The striola is shaded in light gray, and the sensory epithelium outlined in black. Solid line, length of the striola (LS); dashed line, the extrapolated length of the striola (ELS). The dashed line also separates the dorsal extrastriola (DES) from the ventral extrastriola (VES). The width of the striola (WS) is indicated by the lines within the striola perpendicular to the length of the striola and the distance of the striola (DS) indicated by similar lines outside of the striola. The anterior-posterior and the dorsoventral lengths of the sensory epithelium (APLSE and DVLSE, respectively) are also indicated. For further explanations, see text. B: schematic of chinchilla utricular macula with conventions as in A. Medial extrastriola (MES) and lateral extrastriola (LES) and mediolateral length of the sensory epithelium (MLLSE) replace their counterparts in the saccular macula. Scale bar = 100 μm.
CALYX AFFERENTS
Calretinin-stained calyx afferents were coded by the complexity of their calyx terminals. Simple calyx afferents contact a single type I hair cell. Double complex calyx afferents surround two type I hair cells with a single calyx terminal. Triple complex calyx afferents surround three type I hair cells. Higher orders of complex calyx afferents contact up to five type I hair cells in these rodents. Complex calyces are organized as either a straight line or a cluster.
The location and degree of complexity of each calyx afferent, and the location of every calretinin-labeled type I and II hair cell in the mouse and rat were reconstructed from whole mounts of three organs for each species by means of camera lucida. Three utricular and three saccular maculae from mouse and rat were photographed en face and prepared for computer-assisted morphometric analysis using Adobe Photoshop 6.0 (Adobe, San Jose, CA). The camera lucida drawing for each macula was then used as a template on the photographic image to code individual hair cells with colors corresponding to the complexity of the surrounding calyx unit. Based on the correlation between calyx afferents and the striolar region, the striola in our study was delineated as the portion of the sensory epithelium that contained > 99% (7520/7590) of the darkly stained calyx afferents. Striolar boundaries were smooth, and we did not make an effort to include occasional outliers within these borders. Lines were drawn to delineate the striolar region and the sensory epithelium and verified by examining each specimen in the microscope.
We determined that only calyx afferents were stained by examining the whole-mount and semi-thin-sectioned tissue under a × 100 objective in the light microscope. With one exception, no bouton terminals were stained with calretinin antibody, indicating that calretinin does not stain dimorphic or bouton afferents. We also compared our counts of calretinin-stained calyx afferents with gerbil and chinchilla vestibular ganglion cell counts and peripheral innervation patterns obtained from the literature (see DISCUSSION).
RESULTS
Our calretinin staining was robust, filling the cytoplasm of calyx terminals and giving them a Golgi-like appearance (Fig. 1A). Given this intense staining, one would expect to see boutons and their thin supplying branches if they were present. That we did not see boutons, even with this dense cytoplasmic staining, suggests that we are staining the entire population of calyx afferents.
Striolar boundaries
The borders of the striola were determined in early studies in whole-mount vestibular organs and sections based on the lower density of hair cells, the presence of complex calyx terminals, and as the region encompassing the reversal line where hair cell morphological polarization reverses (Engström and Wersäll 1958; Lindeman 1969; Werner 1933). Combining the region delineated by our calretinin-stained calyx afferents with these morphological criteria (Fig. 4), < 1% of the population of calretinin-labeled calyx afferents are found outside of the striola for each macular organ. Due to this correlation, the presence of calretinin-stained calyx afferents may be considered another criterion to delineate the striolar region in mammals as it is consistent with the definitions proposed in the earlier studies.
FIG. 4.
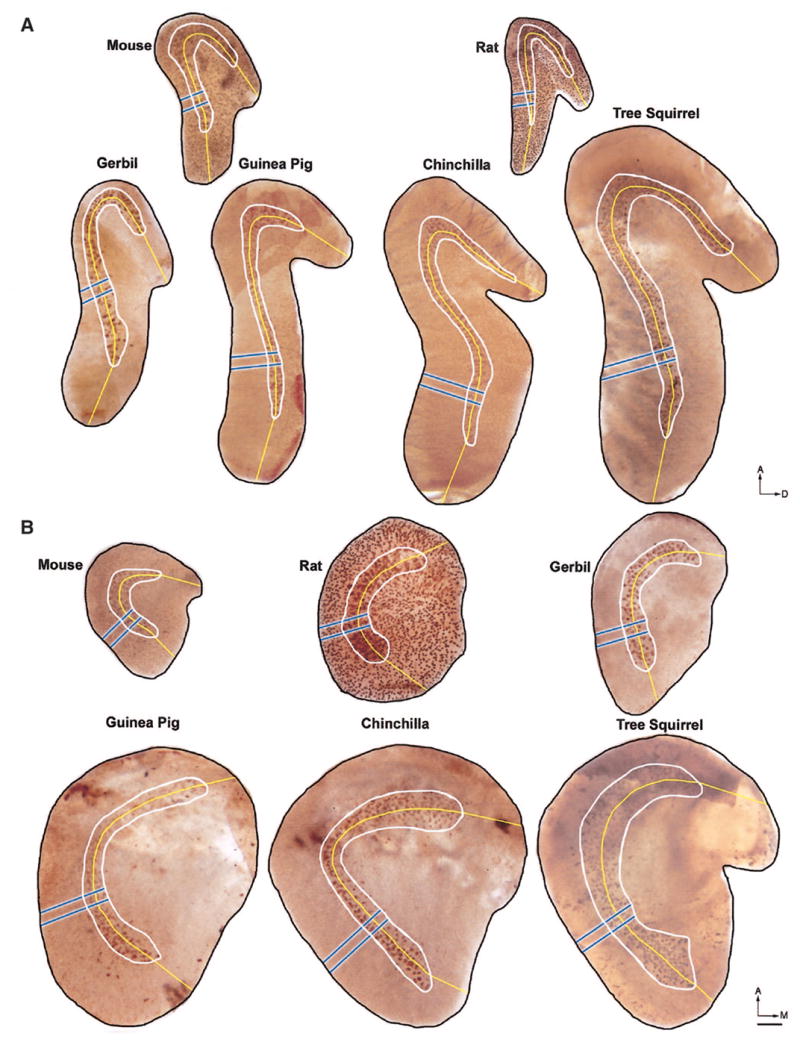
Calretinin immunostaining of otolith organs. Note that, in both organs in the mouse and rat, a large proportion of type II hair cells and a small proportion of type I hair cells also stain with calretinin. A: saccular maculae for 6 rodent species stained using calretinin immunochemistry and photographed en face. B: utricular maculae for 6 rodent species stained using calretinin immunochemistry. Scale bar = 100 μm.
Macular morphometry across species
SACCULAR MACULAE
Saccular maculae in the six species we examined are similar in form (Fig. 4A). They have a question-mark shape that parallels the curvature of the striola. The striolar region is highlighted by the intense staining of calyx afferents. One can also see hair cell staining in the mouse and rat saccular maculae. The posterior limb of the striola is more curved in the chinchilla and tree squirrel, whereas the anterior limb is less curved in the guinea pig. The main innervation to this sensory organ is derived from the inferior vestibular nerve; a smaller branch from the superior vestibular nerve innervates the anterodorsal region (Voit 1907).
UTRICULAR MACULAE
The utricular macula curves dorsally at its anterior end, where the utricular branch of the superior vestibular nerve penetrates the sensory epithelium. Assuming that hair cell orientation is perpendicular to the reversal line, the more circular striolar curvature of the mouse, guinea pig, chinchilla, and tree squirrel orients the polarization vectors of the hair cells in the anterior- and posterior-most parts of the striola parallel to the anterior-posterior axis (Fig. 4B). The hair cells of the more linear rat and gerbil striolae would then be mainly polarized along the medial-lateral axis of the otolith organ. Individual hair cell orientation can vary, however, as we and others have observed in scanning electron microscope studies of mammalian maculae (Denman-Johnson and Forge 1999; Flock 1964; Igarashi et al. 1975; Spoendlin 1964; A. Lysakowski and S. D. Price, unpublished observations).
Morphometric trends in saccular and utricular maculae
The species we considered for this study may be arranged in order of increasing weight as mouse [27 ± 1 (SE) g], gerbil (65 ± 8 g), rat (240 ± 21 g), guinea pig (322 ± 19 g), chinchilla (515 ± 51 g), and tree squirrel (741 ± 46 g). However, gradients in striolar area, hair cell, and supporting cell counts and calyx counts are more ideally reflected in the order: mouse, rat, gerbil, guinea pig, chinchilla, and tree squirrel, which is the convention used throughout this paper. When considering the species in this order, the following morphometric indices generally increase for both maculae (Fig. 4, Table 1): the area of the striola (AS), mean width of the striola (
S), area of the sensory epithelium (ASE), and the anterior-posterior length of the sensory epithelium (APLSE). The remaining indices generally increase with weight, with the exception of the rat. The rat is notable because even though its weight is 3.5 times greater than the gerbil, its sensory epithelia are similar in size to the gerbil. Although the rat value appears to be unusually small, we determined that it was not an outlier using both the maximum normal residual (MNR) test (Snedecor and Cochran 1989; p. 279) and the “test for deviations that look suspiciously large” (Snedecor and Cochran 1989; p. 169).
TABLE 1.
Macular dimensions from six rodent species
| Species | n | Area S, mm2 | Area SE, mm2 | Area DES (MES), mm2 | Area VES (LES), mm2 | Ls, mm | ELs, mm |
s, mm |
Distance*, mm | AP LSE, mm | DV LSE, mm |
|---|---|---|---|---|---|---|---|---|---|---|---|
| A. Saccular Macula Dimensions | |||||||||||
| Mouse | 3 | 0.045 ± 0.001 | 0.184 ± 0.006 | 0.067 ± 0.006 | 0.071 ± 0.003 | 0.712 ± 0.017 | 1.021 ± 0.024 | 0.064 ± 0.002 | 0.059 ± 0.003 | 0.635 ± 0.028 | 0.405 ± 0.043 |
| Rat | 3 | 0.075 ± 0.007 | 0.340 ± 0.023 | 0.142 ± 0.006 | 0.122 ± 0.010 | 1.074 ± 0.087 | 1.590 ± 0.063 | 0.075 ± 0.003 | 0.063 ± 0.002 | 0.978 ± 0.034 | 0.472 ± 0.052 |
| Gerbil | 3 | 0.084 ± 0.011 | 0.348 ± 0.018 | 0.136 ± 0.005 | 0.129 ± 0.007 | 1.054 ± 0.035 | 1.490 ± 0.061 | 0.077 ± 0.005 | 0.074 ± 0.003 | 1.052 ± 0.013 | 0.417 ± 0.058 |
| Guinea pig | 3 | 0.083 ± 0.001 | 0.580 ± 0.016 | 0.220 ± 0.012 | 0.277 ± 0.004 | 1.306 ± 0.041 | 1.893 ± 0.052 | 0.070 ± 0.001 | 0.142 ± 0.007 | 1.377 ± 0.025 | 0.443 ± 0.029 |
| Chinchilla | 3 | 0.119 ± 0.001 | 0.723 ± 0.042 | 0.284 ± 0.022 | 0.320 ± 0.018 | 1.540 ± 0.042 | 1.979 ± 0.047 | 0.085 ± 0.001 | 0.144 ± 0.010 | 1.392 ± 0.090 | 0.583 ± 0.018 |
| Tree squirrel | 3 | 0.188 ± 0.005 | 1.001 ± 0.006 | 0.380 ± 0.008 | 0.433 ± 0.004 | 1.859 ± 0.030 | 2.353 ± 0.047 | 0.108 ± 0.003 | 0.177 ± 0.011 | 1.584 ± 0.040 | 0.721 ± 0.084 |
| B. Utricular macula dimensions | |||||||||||
| Mouse | 3 | 0.032 ± 0.001 | 0.198 ± 0.003 | 0.068 ± 0.002 | 0.098 ± 0.001 | 0.465 ± 0.008 | 0.767 ± 0.009 | 0.072 ± 0.001 | 0.107 ± 0.001 | 0.544 ± 0.019 | 0.437 ± 0.006 |
| Rat | 3 | 0.054 ± 0.002 | 0.352 ± 0.010 | 0.166 ± 0.006 | 0.132 ± 0.004 | 0.581 ± 0.021 | 0.905 ± 0.010 | 0.091 ± 0.001 | 0.129 ± 0.006 | 0.719 ± 0.027 | 0.569 ± 0.023 |
| Gerbil | 4 | 0.071 ± 0.003 | 0.340 ± 0.019 | 0.149 ± 0.006 | 0.120 ± 0.015 | 0.758 ± 0.014 | 1.040 ± 0.026 | 0.094 ± 0.004 | 0.104 ± 0.011 | 0.845 ± 0.013 | 0.482 ± 0.015 |
| Guinea pig | 3 | 0.113 ± 0.010 | 0.857 ± 0.035 | 0.353 ± 0.032 | 0.391 ± 0.010 | 1.140 ± 0.022 | 1.494 ± 0.030 | 0.100 ± 0.005 | 0.231 ± 0.006 | 1.172 ± 0.016 | 0.882 ± 0.016 |
| Chinchilla | 4 | 0.169 ± 0.009 | 1.089 ± 0.045 | 0.395 ± 0.039 | 0.525 ± 0.025 | 1.380 ± 0.049 | 1.852 ± 0.072 | 0.109 ± 0.001 | 0.256 ± 0.004 | 1.288 ± 0.041 | 0.993 ± 0.044 |
| Tree squirrel | 4 | 0.201 ± 0.002 | 1.005 ± 0.037 | 0.438 ± 0.051 | 0.366 ± 0.030 | 1.518 ± 0.034 | 1.892 ± 0.048 | 0.137 ± 0.006 | 0.167 ± 0.011 | 1.333 ± 0.039 | 0.807 ± 0.014 |
All values are means ± SE. MES, LES, and ML refers to utricular macula dimensions; DES, VES, & DV refer to saccular macula dimensions. N = number of sensory organs; S, striola; SE, sensory epithelium; DES, dorsal extrastriola; VES, ventral extrastriola; MES, medial extrastriola; LES, lateral extrastriola; Ls, length of striola; ELs, extrapolated length of striola;
s, mean width of striola;
distance from striola to dorsal edge of sensory epithelium; AP, anterior-posterior; DV, dorsal-ventral; ML, medial-lateral; LSE, length of sensory epithelium.
A power function was used to relate area of the sensory epithelium to body weight in both macular organs (Fig. 5). Similar results were obtained by relating body weight to total number of hair cells, number of supporting cells, numbers of calyx afferents, and area of the striolar region, but we have chosen to present only the correlation between the area of the sensory epithelium and body weight. For this analysis, we used data from mouse, rat, gerbil, guinea pig, chinchilla, and tree squirrel from the present study. In addition, we obtained data from the literature on the common shrew, Daubenton’s bat (Kirkegaard and Jørgensen 2001), common mole rat, blind mole rat (Lindenlaub et al. 1995), squirrel monkey (Igarashi et al. 1975), and human (Merchant et al. 2000; Rosenhall 1972). We also estimated the area of the sensory epithelium using data from the common hare, cat, pig, and cow (Retzius 1884). Body masses, when not given in the study consulted, were obtained from Silva and Downing (1995) and Crile and Quiring (1940). Given the body weight, BW, of an animal, the area of the sensory epithelium is given by a function, A = aBWb. The area of the sensory epithelium of the saccular macula, ASEsac, is given by this function with a = 0.045 ± 0.01 and b = 0.45 ± 0.03. To obtain the area of the utricular macula, ASEutr, a = 0.06 ± 0.02 and b = 0.44 ± 0.04. These equations predict the area of the sensory epithelium for small animals (≤4 kg, χ2 test, P < 0.001). Large animals (> 4 kg) are found on the flat portion of the graph. The slope for the power-law relationship between weight and macular area is 0.45 for the saccular macula and 0.44 for the utricular macula. For species > 4 kg in weight, the area of the sensory epithelium hardly changes with body weight; we speculate that this may be due to either physical limitations on the size of the labyrinth or to the relationship of the afferent projection to the vestibular nuclei (see DISCUSSION in companion paper). In our companion paper (Desai et al. 2005), we show that the area of the utricular and saccular maculae are proportionally similar to each other and to the crista except that the utricular macula is larger for large animals (> 4 kg).
FIG. 5.

The relationship between body weight and the area of the sensory epithelium (ASE) in macular organs. A: saccular maculae (Sac). B: utricular maculae (Utr). Dashed lines in A and B extend this analysis to data taken from other species in the literature (open symbols, see legend). Legend applies to both figures.
Proportions of hair cells and calyx afferents
HAIR CELL AND SUPPORTING CELL COUNTS
The number of type I and II hair cells and supporting cells in the striola and extrastriola were counted for the macular organs of each species (Table 2) using the disector method. For each animal, the total number of hair cells (HCs) is correlated to the area of the sensory epithelium in the saccular macula (r = 0.96) and utricular macula (r = 0.95). We also found a high correlation between the total number of HCs and supporting cells per animal in the saccular (r = 0.99) and utricular maculae (r = 0.98).
TABLE 2.
Type I and type II hair cell counts by region in the macular organs
| Species | Saccular Maculae
|
Utricular Maculae
|
||||||
|---|---|---|---|---|---|---|---|---|
| n | Striola | Extrastriola | Total | n | Striola | Extrastriola | Total | |
| Mouse | ||||||||
| Total number of type I hair cells | 3 | 311 ± 11 | 986 ± 34 | 1297 ± 45 | 3 | 302 ± 38 | 1487 ± 48 | 1789 ± 43 |
| Total number of type II hair cells | 3 | 278 ± 20 | 902 ± 62 | 1180 ± 81 | 3 | 206 ± 18 | 1251 ± 74 | 1457 ± 62 |
| Total number of hair cells | 3 | 589 ± 9 | 1888 ± 28 | 2477 ± 37 | 3 | 508 ± 51 | 2738 ± 61 | 3246 ± 58 |
| Supporting cells | 3 | 544 ± 7 | 1529 ± 12 | 2073 ± 18 | 3 | 535 ± 18 | 2219 ± 52 | 2754 ± 50 |
| Calretinin-stained type I hair cells | 3 | 16 ± 6 | 57 ± 9 | 73 ± 14 | 3 | 19 ± 3 | 74 ± 8 | 93 ± 10 |
| Calretinin-stained type II hair cells | 3 | 54 ± 9 | 662 ± 20 | 716 ± 24 | 3 | 49 ± 3 | 880 ± 20 | 929 ± 20 |
| % calretinin-stained type I HCs | 3 | 5% | 6% | 6% | 3 | 6% | 5% | 5% |
| % calretinin-stained type II HCs | 3 | 19% | 73% | 61% | 3 | 24% | 70% | 64% |
| Rat | ||||||||
| Total number of type I hair cells | 3 | 342 ± 36 | 1245 ± 132 | 1587 ± 168 | 3 | 317 ± 79 | 1638 ± 204 | 1955 ± 278 |
| Total number of type II hair cells | 3 | 307 ± 32 | 1115 ± 115 | 1422 ± 147 | 3 | 183 ± 36 | 1371 ± 248 | 1554 ± 273 |
| Total number of hair cells | 3 | 649 ± 68 | 2360 ± 247 | 3009 ± 315 | 3 | 500 ± 83 | 3009 ± 443 | 3509 ± 525 |
| Supporting cells | 3 | 628 ± 6 | 2211 ± 54 | 2839 ± 16 | 3 | 860 ± 20 | 4682 ± 117 | 5542 ± 26 |
| Calretinin-stained type I hair cells | 3 | 28 ± 4 | 107 ± 22 | 136 ± 24 | 3 | 27 ± 4 | 135 ± 10 | 162 ± 14 |
| Calretinin-stained type II hair cells | 3 | 105 ± 15 | 887 ± 45 | 993 ± 30 | 3 | 70 ± 27 | 1041 ± 41 | 1111 ± 17 |
| % calretinin-stained type I HCs | 3 | 8% | 9% | 9% | 3 | 9% | 8% | 8% |
| % calretinin-stained type II HCs | 3 | 34% | 80% | 70% | 3 | 38% | 76% | 71% |
| Gerbil | ||||||||
| Total number of type I hair cells | 3 | 447 ± 129 | 1908 ± 95 | 2355 ± 188 | 3 | 545 ± 28 | 1788 ± 9 | 2333 ± 33 |
| Total number of type II hair cells | 3 | 372 ± 51 | 1693 ± 219 | 2065 ± 168 | 3 | 406 ± 18 | 1694 ± 41 | 2100 ± 58 |
| Total number of hair cells | 3 | 819 ± 180 | 3601 ± 194 | 4420 ± 20 | 3 | 951 ± 15 | 3482 ± 39 | 4433 ± 33 |
| Supporting cells | 3 | 964 ± 16 | 3914 ± 65 | 4878 ± 37 | 3 | 1135 ± 36 | 4169 ± 76 | 5304 ± 86 |
| Guinea pig | ||||||||
| Total number of type I hair cells | 3 | 440 ± 11 | 2392 ± 62 | 2832 ± 73 | 3 | 610 ± 10 | 3857 ± 88 | 4467 ± 88 |
| Total number of type II hair cells | 3 | 386 ± 20 | 2470 ± 118 | 2856 ± 138 | 3 | 539 ± 49 | 4061 ± 104 | 4600 ± 153 |
| Total number of hair cells | 3 | 826 ± 30 | 4862 ± 178 | 5688 ± 209 | 3 | 1149 ± 46 | 7918 ± 67 | 9067 ± 88 |
| Supporting cells | 3 | 967 ± 169 | 4829 ± 157 | 5796 ± 118 | 3 | 1509 ± 52 | 9587 ± 132 | 11096 ± 184 |
| Chinchilla | ||||||||
| Total number of type I hair cells | 4 | 813 ± 12 | 4302 ± 142 | 5115 ± 77 | 3 | 983 ± 202 | 5488 ± 657 | 6471 ± 859 |
| Total number of type II hair cells | 4 | 714 ± 42 | 3875 ± 97 | 4588 ± 70 | 3 | 775 ± 184 | 5900 ± 227 | 6675 ± 377 |
| Total number of hair cells | 4 | 1527 ± 67 | 8177 ± 331 | 9704 ± 377 | 3 | 1758 ± 384 | 11388 ± 801 | 13146 ± 1180 |
| Supporting cells | 3 | 1717 ± 74 | 7174 ± 239 | 8891 ± 134 | 3 | 1997 ± 92 | 12598 ± 286 | 14595 ± 337 |
| Tree squirrel | ||||||||
| Total number of type I hair cells | 3 | 1432 ± 22 | 6282 ± 170 | 7714 ± 144 | 3 | 2042 ± 234 | 6742 ± 583 | 8784 ± 349 |
| Total number of type II hair cells | 3 | 1160 ± 55 | 6109 ± 176 | 7269 ± 231 | 3 | 1119 ± 137 | 5379 ± 49 | 6498 ± 170 |
| Total number of hair cells | 3 | 2592 ± 64 | 12391 ± 230 | 14983 ± 187 | 3 | 3161 ± 116 | 12121 ± 596 | 15282 ± 497 |
| Supporting cells | 3 | 3344 ± 38 | 12537 ± 257 | 15881 ± 293 | 3 | 3219 ± 35 | 12296 ± 189 | 15515 ± 124 |
All values are means ± SE. n = number of sensory organs; HCs, hair cells.
The density of HCs per 100 μm2 is usually lower in the striolar region than in the extrastriola (Table 3, Fig. 4). The guinea pig saccular macula and the gerbil and tree squirrel utricular maculae are exceptions in that the densities of HCs in the striolar region are slightly more than in the extrastriola, although not significantly so.
TABLE 3.
Hair cell ratios and densities by region in the macular organs
| Species | Saccular Maculae
|
Utricular Maculae
|
||||||
|---|---|---|---|---|---|---|---|---|
| n | Striola | Extrastriola | Total | n | Striola | Extrastriola | Total | |
| Mouse | ||||||||
| Type I HC:Type II HC Ratio | 3 | 1.12 ± 0.01 | 1.09 ± 0.02 | 1.10 ± 0.01 | 3 | 1.47 ± 0.02 | 1.19 ± 0.01 | 1.23 ± 0.02 |
| SC:HC Ratio | 3 | 0.92 ± 0.01 | 0.81 ± 0.01 | 0.84 ± 0.01 | 3 | 1.05 ± 0.00 | 0.81 ± 0.10 | 0.85 ± 0.01 |
| HC density per 100 μm2 | 3 | 1.31 ± 0.04 | 1.36 ± 0.05 | 1.35 ± 0.05 | 3 | 1.59 ± 0.05 | 1.65 ± 0.09 | 1.64 ± 0.08 |
| SC density per 100 μm2 | 3 | 1.21 ± 0.03 | 1.10 ± 0.06 | 1.13 ± 0.06 | 3 | 1.68 ± 0.06 | 1.34 ± 0.06 | 1.39 ± 0.06 |
| Rat | ||||||||
| Type I HC:Type II HC Ratio | 3 | 1.11 ± 0.00 | 1.12 ± 0.01 | 1.12 ± 0.01 | 3 | 1.73 ± 0.03 | 1.19 ± 0.02 | 1.26 ± 0.03 |
| SC:HC Ratio | 3 | 0.97 ± 0.01 | 0.94 ± 0.00 | 0.94 ± 0.01 | 3 | 1.72 ± 0.02 | 1.56 ± 0.01 | 1.58 ± 0.01 |
| HC density per 100 μm2 | 3 | 0.86 ± 0.04 | 0.89 ± 0.04 | 0.89 ± 0.04 | 3 | 0.93 ± 0.03 | 1.01 ± 0.04 | 1.00 ± 0.04 |
| SC density per 100 μm2 | 3 | 0.84 ± 0.03 | 0.84 ± 0.04 | 0.84 ± 0.04 | 3 | 1.59 ± 0.05 | 1.57 ± 0.05 | 1.57 ± 0.05 |
| Gerbil | ||||||||
| Type I HC:Type II HC Ratio | 3 | 1.20 ± 0.01 | 1.13 ± 0.02 | 1.14 ± 0.01 | 3 | 1.34 ± 0.01 | 1.06 ± 0.02 | 1.11 ± 0.01 |
| SC:HC Ratio | 3 | 1.18 ± 0.00 | 1.09 ± 0.01 | 1.10 ± 0.01 | 3 | 1.19 ± 0.00 | 1.20 ± 0.01 | 1.20 ± 0.01 |
| HC density per 100 μm2 | 3 | 0.98 ± 0.08 | 1.36 ± 0.05 | 1.27 ± 0.06 | 3 | 1.34 ± 0.06 | 1.29 ± 0.05 | 1.30 ± 0.05 |
| SC density per 100 μm2 | 3 | 1.15 ± 0.04 | 1.48 ± 0.04 | 1.40 ± 0.04 | 3 | 1.60 ± 0.03 | 1.55 ± 0.05 | 1.56 ± 0.06 |
| Guinea pig | ||||||||
| Type I HC:Type II HC Ratio | 3 | 1.14 ± 0.01 | 0.97 ± 0.01 | 0.99 ± 0.01 | 3 | 1.13 ± 0.01 | 0.95 ± 0.03 | 0.97 ± 0.02 |
| SC:HC Ratio | 3 | 1.17 ± 0.02 | 0.99 ± 0.02 | 1.02 ± 0.02 | 3 | 1.31 ± 0.01 | 1.21 ± 0.01 | 1.22 ± 0.01 |
| HC density per 100 μm2 | 3 | 1.00 ± 0.06 | 0.98 ± 0.05 | 0.98 ± 0.05 | 3 | 1.02 ± 0.08 | 1.06 ± 0.08 | 1.00 ± 0.08 |
| SC density per 100 μm2 | 3 | 1.17 ± 0.03 | 0.97 ± 0.05 | 1.00 ± 0.04 | 3 | 1.34 ± 0.03 | 1.29 ± 0.06 | 1.30 ± 0.05 |
| Chinchilla | ||||||||
| Type I HC:Type II HC Ratio | 4 | 1.14 ± 0.02 | 1.11 ± 0.01 | 1.11 ± 0.01 | 3 | 1.27 ± 0.01 | 0.93 ± 0.00 | 0.97 ± 0.01 |
| SC:HC Ratio | 3 | 1.12 ± 0.01 | 0.88 ± 0.02 | 0.92 ± 0.01 | 3 | 1.14 ± 0.02 | 1.11 ± 0.01 | 1.11 ± 0.02 |
| HC density per 100 μm2 | 4 | 1.28 ± 0.04 | 1.39 ± 0.06 | 1.37 ± 0.05 | 3 | 1.04 ± 0.03 | 1.24 ± 0.06 | 1.21 ± 0.05 |
| SC density per 100 μm2 | 3 | 1.44 ± 0.05 | 1.19 ± 0.05 | 1.23 ± 0.05 | 3 | 1.18 ± 0.04 | 1.37 ± 0.05 | 1.34 ± 0.04 |
| Tree Squirrel | ||||||||
| Type I HC:Type II HC Ratio | 3 | 1.23 ± 0.02 | 1.03 ± 0.01 | 1.06 ± 0.01 | 3 | 1.82 ± 0.03 | 1.25 ± 0.02 | 1.35 ± 0.02 |
| SC:HC Ratio | 3 | 1.29 ± 0.02 | 1.01 ± 0.01 | 1.06 ± 0.02 | 3 | 1.02 ± 0.01 | 1.01 ± 0.00 | 1.02 ± 0.01 |
| HC density per 100 μm2 | 3 | 1.38 ± 0.04 | 1.52 ± 0.06 | 1.50 ± 0.05 | 3 | 1.57 ± 0.07 | 1.51 ± 0.07 | 1.52 ± 0.07 |
| SC density per 100 μm2 | 3 | 1.78 ± 0.05 | 1.54 ± 0.06 | 1.59 ± 0.06 | 3 | 1.60 ± 0.06 | 1.53 ± 0.08 | 1.54 ± 0.08 |
All values are means ± SE. n = number of sensory organs, SC, supporting cell.
CALRETININ STAINING OF HCS
The mouse and rat otolith organs differ from the other species in that a small number of type I HCs and a considerable proportion of type II HCs are labeled by calretinin antibody (Fig. 4, Table 2). This calretinin-labeling of type II HCs in the extrastriola region of the rat utricular macula has been noted previously (Dechesne et al. 1991; Sans et al. 2001). We have found a small number of type I (5–10%) HCs labeled with calretinin antibody in mouse and rat in both the macular organs (Fig. 4) and cristae (companion paper). Type II HCs were more heavily labeled with ~20% labeled in the mouse striola, 35% in the rat striola, and ~70 – 80% in both extrastriolae. Apart from mouse and rat, no other species had calretinin-stained type I or type II HCs (Fig. 4).
Calretinin and calbindin have a 58% amino acid sequence homology (Rogers 1987), and the two are of similar weight (calbindin has a molecular weight of 28 kDa); however, the antibody we used to label the population of calyx afferents is specific to calretinin (Braun et al. 1991; Winsky and Kuźnicki 1995). Such cross-reactivity could have manifested itself as an additional band at a different molecular weight. Our Western blot data show single, darkly-stained bands around 29 kDa, the molecular weight of calretinin (Fig. 6), and there is no cross-reaction with calbindin as seen in the kidney, the negative control, where calretinin is not expressed (Moutairou et al. 1996). This indicates that the protein stained by our antibody in the otolith samples is calretinin not calbindin. Even in the mouse and rat, where type I and II HCs were stained with calretinin immunochemistry, single bands at 29 kDa were found on the Western blot. The single band found at the identical molecular weight in chinchilla indicates to us that the protein in the rat and mouse is the same as that in chinchilla, an animal without HC staining. We therefore conclude that the staining found in a subpopulation of type I and type II HCs in the mouse and rat end organs is calretinin.
FIG. 6.

A Western blot using the same calretinin antibody used in immunochemistry demonstrates staining specificity. This is especially important in the mouse and rat, where type I and II hair cells were also stained using calretinin immunochemistry. For mouse (Ms), rat (Rt), and chinchilla (Ch) otolith organs and vestibular ganglia (VG), only 1 band was found at 29 kDa. Our positive control, rat cerebellum (Cblm), also had a similar band, whereas our negative control, rat kidney (kidney), had no bands.
TRENDS IN CALYX AFFERENTS
The number of calretinin-stained calyx afferents (CA) in the saccular macula ranges from 97 ± 4 (mouse, mean ± SE) to 375 ± 48 (tree squirrel, Table 4) and from 74 ± 5 CA (mouse) to 376 ± 4 CA (tree squirrel, Table 4) in the utricular macula. The numbers of calyx afferents and the type I HCs contacted by calyx afferents increase from mouse to tree squirrel (Table 4).
TABLE 4.
Number of calyx afferents sorted by calyx ending complexity for saccular and utricular maculae of six species
| Species | n | 1-CA | 2-CA | 3-CA | 4-CA | 5-CA | Total CA | Type I HC* | Type I HC/CA† |
|---|---|---|---|---|---|---|---|---|---|
| A. Calyx afferents per species (saccular maculae) | |||||||||
| Mouse | 3 | 48 ± 3 (50%) | 45 ± 1 (46%) | 4 ± 1 (4%) | 1 ± 1 (1%) | 0 ± 0 (0%) | 97 ± 4 | 151 ± 6 | 1.56 ± 0.02 |
| Rat | 3 | 50 ± 4 (39%) | 56 ± 2 (45%) | 18 ± 5 (14%) | 3 ± 2 (2%) | 0 ± 0 (0%) | 127 ± 8 | 226 ± 17 | 1.78 ± 0.03 |
| Gerbil | 3 | 60 ± 5 (42%) | 69 ± 3 (48%) | 13 ± 2 (9%) | 1 ± 1 (1%) | 1 ± 1 (0%) | 144 ± 3 | 244 ± 7 | 1.70 ± 0.05 |
| Guinea pig | 3 | 59 ± 9 (35%) | 75 ± 4 (45%) | 27 ± 4 (17%) | 4 ± 1 (2%) | 0 ± 0 (0%) | 165 ± 9 | 307 ± 6 | 1.87 ± 0.07 |
| Chinchilla | 3 | 114 ± 14 (45%) | 88 ± 12 (34%) | 49 ± 7 (19%) | 5 ± 2 (2%) | 0 ± 0 (0%) | 256 ± 4 | 457 ± 25 | 1.78 ± 0.07 |
| Tree squirrel | 3 | 175 ± 36 (46%) | 135 ± 8 (37%) | 57 ± 9 (15%) | 6 ± 2 (2%) | 1 ± 1 (0%) | 375 ± 48 | 648 ± 64 | 1.74 ± 0.05 |
| B. Calyx afferents per species (utricular maculae) | |||||||||
| Mouse | 3 | 45 ± 8 (59%) | 24 ± 3 (33%) | 6 ± 1 (8%) | 0 ± 0 (0%) | 0 ± 0 (0%) | 74 ± 5 | 110 ± 3 | 1.49 ± 0.07 |
| Rat | 3 | 54 ± 7 (46%) | 43 ± 4 (37%) | 17 ± 1 (15%) | 2 ± 1 (2%) | 0 ± 0 (0%) | 116 ± 5 | 201 ± 6 | 1.73 ± 0.05 |
| Gerbil | 4 | 57 ± 5 (46%) | 60 ± 5 (48%) | 7 ± 1 (6%) | 0 ± 0 (0%) | 0 ± 0 (0%) | 125 ± 8 | 199 ± 14 | 1.60 ± 0.04 |
| Guinea pig | 3 | 78 ± 28 (41%) | 75 ± 5 (44%) | 23 ± 3 (14%) | 2 ± 1 (2%) | 0 ± 0 (0%) | 178 ± 20 | 306 ± 8 | 1.75 ± 0.16 |
| Chinchilla | 3 | 138 ± 35 (42%) | 111 ± 14 (36%) | 58 ± 5 (18%) | 13 ± 7 (4%) | 0 ± 0 (0%) | 320 ± 32 | 587 ± 48 | 1.84 ± 0.05 |
| Tree squirrel | 4 | 165 ± 9 (44%) | 145 ± 4 (39%) | 55 ± 5 (15%) | 9 ± 3 (2%) | 2 ± 0 (0%) | 376 ± 4 | 663 ± 20 | 1.77 ± 0.05 |
All values are means ± SE. Percentages are in parentheses; n = number of sensory organs, CA, calyx afferent;
number of type I hair cells contacted by calyx afferents;
ratio of type I hair cells to calyx afferents.
The numbers of complex calyx afferents, or those calyx terminals that contact more than one type I HC, increase from mouse to tree squirrel to a maximum of five type I HCs per CA (Table 4). Only the gerbil saccular maculae and the tree squirrel saccular and utricular maculae contain quintuple complex CA (5-CA). We determined the overall number of type I HCs per calyx afferent as an index of complexity to gauge the increasing number of complex calyx afferents. This index ranges from 1.49 type I HCs per CA in the mouse utricular macula to 1.87 type I HCs per CA in the guinea pig saccular macula.
Our camera lucida reconstructions of stained calyx afferents allow us to determine the number of each type of calyx afferent (Table 4, Fig. 7). The proportion of simple calyx afferents varied from 35– 60% among species. In our reconstructions of the striolar region, only 70/7590 (0.92%) of all calretinin-stained calyx afferents were found outside of the striola. Those outside included 63 simple calyx afferents (0.82%) and 7 double complex calyx afferents (0.1%); no higher orders of calyx afferents were located outside of the striolar region. A single dimorphic afferent was stained in the extrastriolar region of one chinchilla. Other than this, we did not find any calretinin-stained bouton terminals after re-examining all the whole-mounted tissue and sectioned tissue, meaning that no other dimorphic and no bouton afferents were stained.
FIG. 7.

Level of calyx complexity indicated by colored filled circles on a schematic drawing for each species. A: saccular maculae with stained calyx afferents coded by the complexity of the afferent. Simple calyx afferents (red) contact a single hair cell. Double complex calyx afferents (green) contact 2 hair cells. Triple complex calyx afferents (blue) contact 3 hair cells. Higher levels of complex calyx afferents (yellow) may contact up to 5 type I hair cells. Inset: magnified calyx afferents coded by complexity for the rat. The striolar region for each macula is indicated by a gray background. B: utricular maculae with stained calyx afferents. Conventions are the same as in A. Scale bar = 100 μm.
CALYX AFFERENT BRANCHING
About 10% of calyx afferent axons in all species penetrate the neuroepithelium and branch to form two individual calyx terminals (Fig. 1, B and C). For example, in one squirrel utricular macula, 40/367 calyx afferents were branched. Of these, 12 branched to form two simple calyx terminals, 20 branched to form one simple and one double complex calyx terminal, 4 branched to form a simple and a triple complex calyx terminal, and 4 branched to form two double complex calyx terminals. Branches of afferents never crossed the reversal line of the striola and were always found within 20 μm of each other.
DISCUSSION
Comparative trends among rodents in the present study
The striola holds the key to the organization of the utricular macula. The striolar regions of the mammalian utricular and saccular maculae contain the most sensitive, the most phasic, and the most irregularly discharging vestibular afferents (Fernández and Goldberg 1976; Goldberg et al. 1990b). We were interested to learn more about the morphology of these striolar regions and how they varied among various rodent species commonly used in vestibular research. To our knowledge, no previous study had done total direct counts of calyx afferents in the rodent sensory epithelium. In this study, we did this and compared our counts to what one might expect based on total afferent counts for different species. Broad trends were observed with some morphometric variables increasing with body weight (HC counts, areas of the sensory epithelium and its regional subdivisions, the number and, to a smaller extent, the complexity of calyx afferents), as might be expected, whereas other variables (percentage of calyx afferents) did not. To better appreciate trends that varied according to weight, we examined the allometric relationship between some of these variables and body weight.
We confirmed that calretinin immunostaining can be used to define the striolar region in rodents, as the boundary defined by the stained calyx afferents is indistinguishable from classical definitions of this region. Calretinin also labels a large proportion (70 – 80%) of type II HCs in the extrastriolar region in the adult rat and mouse, and so it can be used as a marker for the extrastriolar region in these two species.
We have presented counts for type I, type II, and supporting cells for the macular organs and shown that the number of cells correlates to the area of the sensory epithelium. Such data can be used for quantitative reconstructions of the afferent innervation in each species. The value of using data appropriate for each species has previously been illustrated. Fernández et al. (1988) used guinea pig cell counts, all that were available at the time, to calculate the proportion of chinchilla vestibular afferents in the crista ampullaris, arriving at 128 for the number of calyx afferents. In a later study (Fernández et al. 1995), chinchilla HC counts were used, and the investigators estimated 250 calyx afferents. Our actual counts of calretinin-labeled calyx afferents (see companion paper) yield an average of 207 ± 4 in the chinchilla crista.
Generally, cell density is slightly lower in the striolar region than in the extrastriola except in the gerbil and tree squirrel utricular maculae. Our data do not support the general notion that there are twice as many type I HCs in the striola compared with the extrastriola (Engström and Wersäll 1958; Lindeman 1969; Watanuki and Meyer zum Gottesberge 1971). Of the six rodent species, only the rat (1.73:1) and tree squirrel (1.82:1) come close to the 2:1 ratio of type I to type II HCs in the striolar region. Another unexpected finding from the morphometric data was that although the rat weighs 3.5 times more than the gerbil, their sensory epithelia are similar in dimensions and the gerbil has more HCs per end organ than the rat.
Calyx afferents can contact up to five type I HCs in some of these six rodent species. All species have double complex and triple complex calyx afferents in similar proportions. A small proportion (10%) of calyx afferents branch beneath the sensory epithelium to terminate as two separate calyx endings located on the same side of the striola.
The area of the sensory epithelium is strongly correlated to body weight in the saccular and utricular maculae. We discuss some possible explanations for this in the companion paper.
Comparisons to the literature on afferent innervation
Approximately 20% of the ganglion cells innervate each of the five vestibular organs in the guinea pig (Gacek and Rasmussen 1961) and chinchilla (Boord and Rasmussen 1958). Given these estimates, we have tried to predict the number of calyx afferents per organ in rodent species in which the total number of vestibular ganglion cells are known. In some cases, our predictions match what we obtained from direct counts of calretinin-labeled afferents, whereas in other cases, the estimates are not as good.
MOUSE AFFERENT INNERVATION
Using data from Bäurle and Guldin (1998) on the total number of ganglion cells in B6CBA and C57BL/6J mice, we would expect ~20% of the 3,400 ganglion cells, or 680 vestibular afferents, to contact each of the five sensory organs. If calyx afferents constituted ~20% of that population, this would lead to an estimate of 137 calyx afferents per sensory organ. We counted 97 ± 4 calyx afferents in the mouse saccular macula and 74 ± 5 calyx afferents in the utricular macula; thus our counts are low compared with predictions. This discrepancy may be due to strain differences as we used CBA/J mice in our study. Alternatively in the mouse, there could be a smaller proportion of calyx afferents, say 11–14%, similar to the 10–13% observed in the guinea pig (following text). The answer will remain uncertain until further studies are done to determine the total number of afferents per vestibular organ in the mouse.
GERBIL AFFERENT INNERVATION OF THE UTRICULAR MACULA
In the gerbil, there are 3,962 ± 358 (SD) ganglion cells, of which 19.5% or 773 ± 18 are calretinin-positive and correspond to the largest ganglion cells, which belong to the thick calyx afferent fibers (Kevetter and Leonard 2002). If the estimates of 20% of afferents innervating each end organ, obtained by the Rasmussen laboratory (see preceding text), are similar in the gerbil, which has fewer afferents, and if calretinin-labeled fibers mimic this trend, one would expect that ≈ 792 afferents innervate each of the macular organs, of which ≈ 155 (20%) are calyx afferents. We found 144 ± 5 calyx afferents in the saccular macula and 125 ± 14 calyx afferents in the utricular macula of the gerbil, counts that are indistinguishable from the estimated population of calyx afferents in the gerbil (F test: P = 0.68 for saccular macula; P = 0.12 for utricular macula). We were also able to measure the length and width of the striola and sensory epithelium from a photomicrograph of a utricular macula presented in the paper of Leonard and Kevetter (2002; see their Fig. 4); these measurements are consistent with, albeit the striola is somewhat thinner (Table 5) than, what we have presented for the gerbil utricular maculae in this paper (Table 2). Our finding that calretinin-stained calyx afferents can contact up to three HCs in the gerbil utricular macula (Table 4) is also consistent with their results.
TABLE 5.
Macular comparisons in gerbil, chinchilla, and guinea pig
| Present Study | Comparison Study | |
|---|---|---|
| Gerbil Utricular Macula | Leonard & Kevetter (2002) | |
| n | 4 | 1 |
| Ws, mm | 0.077 ± 0.005 | 0.060* |
| Chinchilla utricular macula | Fernandez et al. (1990) | |
| n | 4 | 6 |
| Area S, % | 13.7 ± 1.0 | 10.4 ± 0.3 |
| Area MES, % | 39.0 ± 4.6 | 39.7 ± 1.8 |
| Area LES, % | 47.3 ± 2.0 | 50.0 ± 1.6 |
| Area SE, mm | 1.00 ± 0.06 | 0.97 ± 0.07 |
| Ws, mm | 0.105 ± 0.006 | 0.100 |
| ML LSE, mm | 0.99 ± 0.04 | 1.07 ± 0.05 |
| Total Calyx Afferents | 320 ± 32 | 95† |
| Guinea pig saccular macula | Lindeman (1969) | |
| n | 3 | 9 |
| Area S (%) | 14.5 ± 1.0 | 13.0 ± 1.0 |
| Area SE (mm2) | 0.53 ± 0.03 | 0.49 ± 0.02 |
| Total HCs, S | 826 ± 30 | 860 ± 30 |
| Total HCs, SE | 4861 ± 178 | 6700 ± 264 |
| Type I:Type II Ratio, S | 1:1 | 2:1 |
| Utricular Macula | Lindeman (1969) | |
| n | 3 | 9 |
| Area S (%) | 12.4 ± 1.0 | 8.0 ± 0.0 |
| Area SE (mm2) | 0.80 ± 0.03 | 0.54 ± 0.01 |
| Total HCs, S | 1149 ± 46 | 582 ± 26 |
| Total HCs, SE | 9067 ± 88 | 9260 ± 398 |
| Type I:Type II Ratio, S | 1:1 | 2:1 |
Values are means ± SE. n, number of sensory organs. Other abbreviations as in previous table legends.
Corrected (J. M. Goldberg, personal communication).
as measured by us on figures in their paper.
GUINEA PIG AFFERENT INNERVATION AND HC COUNTS IN MACULAE
Gacek and Rasmussen (1961) counted a total of 8,231 vestibular afferents (200 of which may have been efferents), with 1,260 (15%) and 1,703 (21%) afferent fibers for the saccular and utricular maculae, respectively. Our counts of 165 and 178 for calyx fibers, respectively, mean that in the guinea pig, only 10 –13% of the afferents are calyx fibers. We get a similar value of 10% calyx afferents (162/1637) in the guinea pig cristae ampullares (companion paper). Thus the guinea pig differs from the chinchilla and gerbil, but may be similar to the mouse, in having a smaller percentage of vestibular afferents as calyx fibers. There are also significant differences between our measurements of the guinea pig saccular and utricular maculae and those reported by Lindeman (1969); see also Table 5 in the present study. The latter study used guinea pigs of similar age and weight. Differences between the two studies include how the tissue was processed, the method used to delineate the borders of the striola, and the method used to count the number of HCs. For Lindeman’s surface preparations, animals were perfused and stained in 1.5% OsO4 for 3 h, and stored in 70% alcohol for 10 h—reagents conducive to high tissue shrinkage. We minimized tissue shrinkage by using an isotonic buffer for the fixative and dissecting in isotonic phosphate buffer. For the counting method, we used semi-thin cross-sections through the entire epithelium to identify type I HCs, type II HCs, and supporting cells, and we estimated the total number of each type of cell using the disector technique (Table 2).
Both studies found a similar number of HCs in the striolar region of the saccular macula, but we found fewer total HCs when considering the entire sensory epithelium. The overall numbers of HCs in the utricular macula are similar between the two studies, even though the area of the sensory epithelium in our study was ~50% larger. The difference in the total number of HCs in the striolar region is largely due to the difference in area we attributed to this region (Table 5). The difference in type I:type II HC ratios in the striola (2:1 vs. 1:1) is more difficult to understand, although our ratios are more similar to Lindeman’s in the crista ampullaris (companion paper).
CHINCHILLA AFFERENT INNERVATION OF THE UTRICULAR MACULA
Boord and Rasmussen (1958) found 7,772 total afferents in the chinchilla. Based on examination of the utricular branch of the vestibular nerve, they counted 1,608 afferents innervating the utricular macula. We counted 320 calyx afferents in the chinchilla utricular macula; thus 20% of the ~1,600 afferents innervating this sensory organ are calyx afferents. This is consistent with the findings in gerbil (preceding text) from Kevetter and Leonard (2002). If the innervation patterns in the gerbil are consistent with those in the guinea pig and chinchilla and if the calretinin-containing afferents also follow this pattern, our data for the guinea pig and chinchilla maculae confirm the work of previous studies in rodents (Dechesne et al. 1991; Kevetter and Leonard 2002; Raymond et al. 1993; Rogers et al. 1990; Sans et al. 2001) that calretinin labels all calyx afferents and only calyx afferents.
Our measurements of the chinchilla utricular macula are consistent with data from Fernández et al. (1990) (see also Table 5 in the present study). In addition, we can confirm that ~10% of calyx afferents are branched. Branches were located within 20 μm of each other and do not appear to cross the reversal line; thus they innervate HCs with a similar polarization vector. Branched fibers terminate as two simple endings, two complex endings, or one simple and one complex ending. Most (32/40) branched afferents were located in the outer parts of the striola.
Consistent with the number and type of unbranched calyx afferents observed by Fernández et al. (1990) in the chinchilla utricular macula, the most complex ending we observed was a calyx afferent contacting five type I HCs. Complex endings were more common than simple endings in the chinchilla utricular macula [57% complex vs. 43% simple in our study; 79% complex in the study of Fernández et al. (1990)]. In the index of complexity described by their study for calyx afferents, there were ~2.26 type I HCs per calyx afferent. In our study, we found 1.84 type I HCs per calyx afferent due to a higher proportion of simple calyx afferents in our total of 320 calyx afferents. Our total contrasts with the number of calyx afferents in the quantitative reconstruction of Fernández et al. (1990). Their reconstruction not only used guinea pig HC counts (all that was available at the time) but also contained a calculation error such that the number of calyx afferents was about half of what it should have been (J. M. Goldberg, personal communication).
The difference can be reconciled by repeating their reconstruction using our type I HC numbers from the chinchilla utricular striolar zone (983 × 60% in calyx afferents = 590), and their number of type I HCs per calyx afferents in the chinchilla (2.26). Thus the discrepancy between the number of calyx afferents calculated in their study (590/2.26 = 261) compared with those counted in our study (320) is less.
As a final aside on mammalian afferent innervation, ~40% of the 18,500 vestibular afferents in the squirrel monkey cristae (Fernández et al. 1995) are of the calyx variety. Humans have a similar number of vestibular afferents, 15,000 –24,000 (Bergström 1973; Rasmussen 1940; Velázquez-Villaseñor et al. 2000), suggesting that the percentage of calyx afferents in humans may be similar to that found in squirrel monkeys.
Comparing sensory epithelium areas in the present study to published afferent physiology
Our measurements for the areas of the striola and the two divisions of the extrastriola can be compared with previous studies of chinchilla afferent physiology (Goldberg et al. 1990a), the only rodent species in which a large extracellular sample of utricular afferents is available. In the Goldberg study, they recorded from 360 afferents, of which 73% were regularly discharging (probably located in the extrastriola), 5% were intermediate in discharge pattern (located in the juxtastriola), and 22% were irregular (probably striolar or juxtastriolar). The juxtastriola was found to have intermediate and irregular afferents in equal numbers. So the extrastriola should have ~70 –75% of the total area (proportional to the number of afferents), juxtastriola should have 10% (half intermediate and half irregular) and the striola 15–20% (22% irregular minus 5% to match the intermediate contingent). While we did not measure the area of the juxtastriola, one could perhaps do this with calbindin-stained material (see DISCUSSION on Intermediate and juxtastriola zones in the companion paper). Our measurements of the chinchilla striolar region gave 16%, less than the percentage of irregular afferents (22%), whereas we got 84% for the total extrastriola area (MES plus LES), more than the regular and intermediate units combined (78%). However, if we consider that the juxtastriola contains equal numbers of intermediate and irregular units, the areal percentage of the extrastriola comes to 79% (closer to 73% regular) and the percentage irregular becomes 17% (closer to the 16% we found for area of striola).
Similarly, a consideration of morphological polarization vectors and areal percentages yields values that are within 10% of those published in the same Goldberg et al. (1990a) study. By dividing the striolar region in half, the number of ipsilateral tilt-responsive (LED or left ear down) units is roughly 54%, while contralateral tilt-responsive (RED or right ear down) units comprise 45%. Our areal measurements give 44% for the medial extrastriola and half the striola combined (total area of ipsilaterally responding units), and 56% for the contralaterally responding units (lateral extrastriola plus lateral striola). That the percentages do not match, but are within 10% of each other, suggests that some units in the Goldberg study were at variance with the morphological polarization map of Lindeman (1969), as discussed in their paper, or that their sample was not fully representative of the different areas, which they indicated was likely the case in the posterolateral region.
Calretinin-labeled HCs
In the mouse and rat macular organs, the number of type I HCs stained with calretinin antibody is small and does not vary by region; most of the type II HC staining is found in the extrastriolar region (Table 2). Calretinin antibody did not label supporting cells in any of the species. Calretinin expression has been examined in mouse (Dechesne et al. 1994) and in both developing (Zheng and Gao 1997) and adult rat (Sans et al. 2001) inner ear tissue. In the rat, label is first apparent in HCs at embryonic day 15. Afferent labeling with calretinin starts to become more prevalent at postnatal day 4 (PD4). By PD14, the staining patterns in HCs and calyx afferents are similar to the adult.
The continued expression of calretinin in a subpopulation of HCs of the mouse and rat may indicate that it has a functional role in calcium buffering. We have shown that 70 – 80% of the extrastriolar type II HCs in the adult rat and mouse vestibular organs express calretinin. HCs that do not express calretinin in the rat, and thus are most likely type I HCs, and all HCs in the guinea pig, are immunoreactive for the plasmalemmal calcium-ATPase (PMCA) pump (Boyer et al. 2001; Dumont et al. 2001). PMCA pumps, located along the sides of the stereociliar bundle (Boyer et al. 2001; Dumont et al. 2001), are thought to contribute to calcium homeostasis by regulating the efflux of calcium (Yamoah et al. 1998). PMCA is particularly important in hair bundles because they have no organelles, such as mitochondria, to regulate calcium efflux. It is possible that PMCA expression in adult animals obviates the need for calretinin in HCs.
Possible functional significance of calcium binding proteins in the vestibular periphery
Vestibular afferents contain different calcium-binding proteins in different proportions. Calretinin has been localized to the calyx class of afferents (Desmadryl and Dechesne 1992; Leonard and Kevetter 2002; Sans et al. 2001; present study; companion paper), calbindin has been found in both calyx units and in striolar and juxtastriolar dimorphic afferents (Leonard and Kevetter 2002; Raymond et al. 1993; Rogers et al. 1990; Desai and Lysakowski, unpublished results in the chinchilla), and parvalbumin has been found in all vestibular afferents (Kevetter and Leonard 2002; Leonard and Kevetter 2002; Raymond et al. 1993; Sans et al. 2001).
Although the specific functions of calcium-binding proteins are not known for this system, one putative role is to prevent the calcium excitotoxicity that occurs after excessive glutamate release from type I HCs (Baimbridge et al. 1982; Demêmes et al. 1995; Drescher et al. 1987; Edmonds et al. 2000; Mattson et al. 1991; Raymond et al. 1984).
Calcium-binding proteins exhibit differences in their dissociation constants and in the number of calcium ions each can bind. These differences may determine their distinct roles in regulating signal transduction and in shaping synaptic transmission. Hence, calbindin binds five or six calcium ions (Leathers et al. 1990) with the highest affinity (Kd = 0.24 ± 0.04 μM) (Nägerl et al. 2000), followed by calretinin (Kd = 0.38 ± 0.02 μM) (Stevens and Rogers 1997), which binds five calcium ions, and both forms of parvalbumin (Kd = 0.42 ± 0.01 μM, alpha form; Kd = 0.61 ± 0.02 μM, beta form) (Henzl et al. 2003), which bind two calcium ions. Large concentrations of calcium binding proteins may lead to rapid sequestration of Ca2+ ions, limiting their ability to effect change. Thus a larger signal may be necessary for depolarization. On the other hand, having low concentrations of one calcium-binding protein, say calretinin, but high parvalbumin concentrations, such as one finds in extrastriolar, regularly discharging afferents (Sans et al. 2001), may lead to larger concentrations of calcium for longer periods of time, potentiating cell signaling (Chard et al. 1993). Calcium buffers can spatially restrict calcium ions, including those entering through voltage-gated ion channels or intracellular stores.
The function of different concentrations of calcium-binding proteins, as seen by the presence of calretinin in calyx afferents and calbindin in both calyx and central dimorphic afferents, may be similar to the role of differential expression of BK, or calcium-activated, potassium channels found in cochlear HCs (Art et al. 1995; Navaratnam et al. 1997; Rosenblatt et al. 1997). The expression patterns of BK channels in the cochlea imply that they may play a role in preserving the tonotopic map.
To develop this line of reasoning further, we and others have shown that only calyx afferents, which have the most irregular discharge pattern (Baird et al. 1988; Goldberg et al. 1990b), express calretinin. Discharge regularity may reflect the presence of an “afterhyperpolarization current” (IAHP) (Goldberg 2000; Smith and Goldberg 1986). IAHP can flow through calcium-activated K channels of the sK type (Barrett and Barrett 1976). Because sK channels are voltage-independent, they are regulated by levels of intracellular calcium. The Kd for calretinin (380 ± 20 nM) is within the operating range of internal calcium needed for activation of sK channels (50 –900 nM) (Hille 2001; Vergara et al. 1998) and so it is a potential regulator. Preliminary data (Monk and Peterson 1995; A. Lysakowski, J. C. Holt, and J. M. Goldberg, unpublished observations) suggests that in turtle crista ampullares, calretinin stains not only calyx afferents but also some highly irregular bouton and dimorphic afferents. Therefore it is conceivable that calretinin and IAHP channels (a mixture of slow and fast SK isoforms) are together responsible for the very irregular discharge pattern found in mammalian calyx afferents and other afferents in turtle crista. The mechanism may be that calretinin prevents activation of sK channels in irregular afferents, so that spike timing depends on transmitter release more than on postsynaptic channel kinetics (Goldberg 2000). More generally, the distributions of calcium binding proteins and IAHP channels (isoforms of sK channels) may together be responsible for the total range of discharge regularity in afferent discharge patterns.
Conclusions
We have shown that calretinin antibody labels the calyx class of afferents in the saccular and utricular maculae of the mouse, rat, gerbil, guinea pig, chinchilla, and tree squirrel. Our calculations and comparisons with available data from the literature suggest that calretinin labels the entire population of calyx afferents in the gerbil maculae and chinchilla utricular macula; there is little reason to suspect otherwise for the remaining species. Calretinin immunostaining can be used to define the striolar region in rodents, as the boundary defined by the stained calyx afferents is indistinguishable from classical definitions of this region. We have presented counts for type I, type II, and supporting cells for the macular organs, and evidence that the number of cells correlates to the area of the sensory epithelium. Generally, there are fewer HCs per 100 μm2 area in the striolar region than in the extrastriola; this trend is also reflected in the regional density of supporting cells.
Calyx afferents can contact up to five type I HCs in some of these six rodent species. With few exceptions, all species have double complex and triple complex calyx afferents in similar proportions. A subset of calyx afferents branch beneath the sensory epithelium to terminate as two separate calyx endings located on the same side of the striola.
The area of the sensory epithelium is strongly correlated to body weight in the saccular and utricular maculae. We discuss some possible explanations for this in the companion paper.
Acknowledgments
We are grateful for the excellent photographic and technical assistance of S. D. Price and H. Ali and the Western blot assistance by D. Nahey. Dr. James Artwohl assisted us with the tree squirrels. We also thank Drs. Jay M. Goldberg, Ruth Anne Eatock, and J. Christopher Holt for insightful comments on an earlier version of this manuscript, and we especially thank Dr. Jay M. Goldberg for helpful discussions on the allometry portion of the paper.
GRANTS
This work was supported by a National Institute of Deafness and Communication Disorders Grant R01 DC-02521 to A. Lysakowski, a National Aeronautics and Space Administration Grant NAG 2–1358 to A. Lysakowski, and a National Institute of Deafness and Communication Disorders Predoctoral Fellowship NRSA F30 DC-05451 to S. S. Desai.
References
- Art JJ, Wu YC, Fettiplace R. The calcium-activated potassium channels of turtle hair cells. J Gen Physiol. 1995;105:49–72. doi: 10.1085/jgp.105.1.49. [DOI] [PMC free article] [PubMed] [Google Scholar]
- Baimbridge KG, Miller JJ, Parkes CO. Calcium-binding protein distribution in the rat brain. Brain Res. 1982;239(2):519–525. doi: 10.1016/0006-8993(82)90526-1. [DOI] [PubMed] [Google Scholar]
- Baird RA, Desmadryl G, Fernández C, Goldberg JM. The vestibular nerve of the chinchilla. II. Relation between afferent response properties and peripheral innervation patterns in the semicircular canals. J Neurophysiol. 1988;60:182–203. doi: 10.1152/jn.1988.60.1.182. [DOI] [PubMed] [Google Scholar]
- Barrett EF, Barret JN. Separation of two voltage-sensitive potassium currents and demonstration of a tetrodotoxin-resistant calcium current in frog motoneurones. J Physiol. 1976;255:737–774. doi: 10.1113/jphysiol.1976.sp011306. [DOI] [PMC free article] [PubMed] [Google Scholar]
- Bäurle J, Guldin W. Unbiased number of vestibular ganglion neurons in the mouse. Neurosci Lett. 1998;246:89–92. doi: 10.1016/s0304-3940(98)00241-9. [DOI] [PubMed] [Google Scholar]
- Bergström B. Morphology of the vestibular nerve. II. The number of myelinated vestibular nerve fibers in man at various ages. Acta Otolaryngol Stockh. 1973;76:173–179. doi: 10.3109/00016487309121496. [DOI] [PubMed] [Google Scholar]
- Bermingham N, Hassan B, Vollrath M, Price SD, Ben-Arie N, Eatock RA, Bellen HJ, Lysakowski A, Zoghbi HY. Math1: an essential gene for the generation of inner ear hair cells. Science. 1999;284:1837–1841. doi: 10.1126/science.284.5421.1837. [DOI] [PubMed] [Google Scholar]
- Boord RL, Rasmussen GL. Analysis of myelinated fibers of the acoustic nerve of the chinchilla. Anat Rec. 1958;130:394. [Google Scholar]
- Boyer C, Art JJ, Dechesne CJ, Lehouelleur J, Vautrin J, Sans A. Contribution of the plasmalemma to Ca2+ homeostasis in hair cells. J Neurosci. 2001;21:2640–2650. doi: 10.1523/JNEUROSCI.21-08-02640.2001. [DOI] [PMC free article] [PubMed] [Google Scholar]
- Braun K, Scheich H, Braun S, Rogers JH, Heizmann CW. Parvalbumin-, calretinin- and calbindin-D28K-immunoreactivity and GABA in a forebrain region involved in auditory filial imprinting. Brain Res. 1991;539:31–44. doi: 10.1016/0006-8993(91)90683-m. [DOI] [PubMed] [Google Scholar]
- Chard PS, Bleakman D, Christakos S, Fullmer CS, Miller RJ. Calcium buffering properties of calbindin D28K and parvalbumin in rat sensory neurones. J Physiol. 1993;472:341–357. doi: 10.1113/jphysiol.1993.sp019950. [DOI] [PMC free article] [PubMed] [Google Scholar]
- Crile G, Quiring DP. A record of the body weight and certain organ and gland weights of 3690 animals. Ohio J Sci. 1940;40:219–259. [Google Scholar]
- Dechesne CJ, Rabejac D, Desmadryl G. Development of calretinin immunoreactivity in the mouse inner ear. J Comp Neurol. 1994;346:517–529. doi: 10.1002/cne.903460405. [DOI] [PubMed] [Google Scholar]
- Dechesne CJ, Winsky L, Kim HN, Goping G, Vu TD, Wenthold RJ, Jacobowitz DM. Identification and ultrastructural localization of a calretinin-like calcium-binding protein (protein 10) in the guinea pig and rat inner ear. Brain Res. 1991;560:139–148. doi: 10.1016/0006-8993(91)91224-o. [DOI] [PubMed] [Google Scholar]
- Demêmes D, Lleixa A, Dechesne CJ. Cellular and subcellular localization of AMPA-selective glutamate receptors in the mammalian peripheral vestibular system. Brain Res. 1995;671:83–94. doi: 10.1016/0006-8993(94)01322-9. [DOI] [PubMed] [Google Scholar]
- Denman-Johnson K, Forge A. Establishment of hair bundle polarity and orientation in the developing vestibular system of the mouse. J Neurocytol. 1999;28:821–835. doi: 10.1023/a:1007061819934. [DOI] [PubMed] [Google Scholar]
- Desai SS, Ali H, Lysakowski A. Comparative morphology of rodent vestibular periphery. II. Cristae ampullares. J Neurophysiol. 2005;93:267–280. doi: 10.1152/jn.00747.2003. [DOI] [PMC free article] [PubMed] [Google Scholar]
- Desai SS, Lysakowski A. Hair cell and afferent counts in rodent otolith organs. Abstr 25th Midwinter Meeting ARO; 2002. p. 31. [Google Scholar]
- Desai SS, Zeh C, Lysakowski A. A comparative quantitative analysis of the striola in rodent otolith organs. Soc Neurosci Abstr. 2000;26:6. [Google Scholar]
- Desmadryl G, Dechesne CJ. Calretinin immunoreactivity in chinchilla and guinea pig vestibular end organs characterizes the calyx unit subpopulation. Exp Brain Res. 1992;89:105–108. doi: 10.1007/BF00229006. [DOI] [PubMed] [Google Scholar]
- Drescher MJ, Drescher DG, Hatfield JS. Potassium-evoked release of endogenous primary amine-containing compounds from the trout saccular macula and saccular nerve in vitro. Brain Res. 1987;417:39–50. doi: 10.1016/0006-8993(87)90177-6. [DOI] [PubMed] [Google Scholar]
- Dumont RA, Lins U, Filoteo AG, Penniston JT, Kachar B, Gillespie PG. Plasma membrane Ca2+-ATPase isoform 2a is the PMCA of hair bundles. J Neurosci. 2001;21:5066–5078. doi: 10.1523/JNEUROSCI.21-14-05066.2001. [DOI] [PMC free article] [PubMed] [Google Scholar]
- Edmonds B, Reyes R, Schwaller B, Roberts WM. Calretinin modifies presynaptic calcium signaling in frog saccular hair cells. Nat Neurosci. 2000;3:786–790. doi: 10.1038/77687. [DOI] [PubMed] [Google Scholar]
- Engström H, Wersäll J. Structure and innervation of the inner ear sensory epithelia. Int Rev Cytol. 1958;7:535–585. [Google Scholar]
- Fernández C, Baird RA, Goldberg JM. The vestibular nerve of the chinchilla. I. Peripheral innervation patterns in horizontal and superior semicircular canals. J Neurophysiol. 1988;60:167–181. doi: 10.1152/jn.1988.60.1.167. [DOI] [PubMed] [Google Scholar]
- Fernández C, Goldberg JM. Physiology of peripheral neurons innervating otolith organs of the squirrel monkey. III. Response dynamics. J Neurophysiol. 1976;39:996–1008. doi: 10.1152/jn.1976.39.5.996. [DOI] [PubMed] [Google Scholar]
- Fernández C, Goldberg JM, Baird RA. The vestibular nerve of the chinchilla. III. Peripheral innervation patterns in the utricular macula. J Neurophysiol. 1990;63:767–780. doi: 10.1152/jn.1990.63.4.767. [DOI] [PubMed] [Google Scholar]
- Fernández C, Lysakowski A, Goldberg JM. Hair-cell counts and afferent innervation patterns in the cristae ampullares of the squirrel monkey with a comparison to the chinchilla. J Neurophysiol. 1995;73:1253–1269. doi: 10.1152/jn.1995.73.3.1253. [DOI] [PubMed] [Google Scholar]
- Flock Å. Structure of the macula utricle with special reference to the directional interplay of sensory responses as revealed by morphological polarization. J Cell Biol. 1964;22:413–431. doi: 10.1083/jcb.22.2.413. [DOI] [PMC free article] [PubMed] [Google Scholar]
- Foster JD, Drescher MJ, Hatfield JS, Drescher DG. Immunohistochemical localization of S-100 protein in auditory and vestibular end organs of the mouse and hamster. Hear Res. 1994;74:67–76. doi: 10.1016/0378-5955(94)90176-7. [DOI] [PubMed] [Google Scholar]
- Gacek RR, Rasmussen GL. Fiber analysis of statoacoustic nerve of guinea pig, cat and monkey. Anat Rec. 1961;139:455–463. doi: 10.1002/ar.1091390402. [DOI] [PubMed] [Google Scholar]
- Goldberg JM. Afferent diversity and the organization of central vestibular pathways. Exp Brain Res. 2000;130:277–297. doi: 10.1007/s002210050033. [DOI] [PMC free article] [PubMed] [Google Scholar]
- Goldberg JM, Desmadryl G, Baird RA, Fernández C. The vestibular nerve of the chinchilla. IV. Discharge properties of utricular afferents. J Neurophysiol. 1990;63(4):781–790. doi: 10.1152/jn.1990.63.4.781. [DOI] [PubMed] [Google Scholar]
- Goldberg JM, Desmadryl G, Baird RA, Fernández C. The vestibular nerve of the chinchilla. V. Relation between afferent discharge properties and peripheral innervation patterns in the utricular macula. J Neurophysiol. 1990;63(4):791–804. doi: 10.1152/jn.1990.63.4.791. [DOI] [PubMed] [Google Scholar]
- Henzl MT, Agah S, Larson JD. Characterization of the metal ion-binding domains from rat alpha- and beta-parvalbumins. Biochemistry. 2003;42:3594–3607. doi: 10.1021/bi027060x. [DOI] [PubMed] [Google Scholar]
- Hille B. Ion Channels of Excitable Membranes. Sunderland, MA: Sinauer; 2001. p. 144. [Google Scholar]
- Igarashi M, Watanuki K, Miyata H, Alford BR. Vestibular end organ mapping in the squirrel monkey. Arch Otorhinolaryngol. 1975;211:153–161. doi: 10.1007/BF00455279. [DOI] [PubMed] [Google Scholar]
- Kevetter GA, Leonard RB. Molecular probes of the vestibular nerve. II. Characterization of neurons in Scarpa’s ganglion to determine separate populations within the nerve. Brain Res. 2002;928:18–29. doi: 10.1016/s0006-8993(01)03264-4. [DOI] [PubMed] [Google Scholar]
- Kirkegaard M, Jørgensen JM. The inner ear macular sensory epithelia of the Daubenton’s bat. J Comp Neurol. 2001;438:433–444. doi: 10.1002/cne.1326. [DOI] [PubMed] [Google Scholar]
- Leathers VL, Linse S, Forsen S, Norman AW. Calbindin-D28K, a 1α, 25–dihydroxyvitamin D3-induced calcium-binding protein, binds five or six Ca2+ ions with high affinity. J Biol Chem. 1990;265:9838–9841. [PubMed] [Google Scholar]
- Leonard RB, Kevetter GA. Molecular probes of the vestibular nerve. I. Peripheral termination patterns of calretinin, calbindin and peripherin containing fibers. Brain Res. 2002;928:8–17. doi: 10.1016/s0006-8993(01)03268-1. [DOI] [PubMed] [Google Scholar]
- Lindeman HH. Studies on the morphology of the sensory regions of the vestibular apparatus. Ergeb Anat Entwicklungsgesch. 1969;42:1–113. [PubMed] [Google Scholar]
- Lindenlaub T, Burda H, Nevo E. Convergent evolution of the vestibular organ in the subterranean mole-rats, Cryptomys and Spalax, as compared with the aboveground rat, Rattus. J Morphol. 1995;224:303–311. doi: 10.1002/jmor.1052240305. [DOI] [PubMed] [Google Scholar]
- Lorente de Nó R. Études sur l’anatomie et la physiologic du labyrinthe de l’oreille et du VIII e nerf Deuxieme partie. Queldues donnees au sujet de l’anatomie des organes sensoriels du labryrinthe. Trav Lab Rech Biol Univ Madr. 1926;24:53–153. [Google Scholar]
- Lysakowski A, Alonto A, Jacobson J. Peripherin immunoreactivity labels small diameter vestibular “bouton” afferents in rodents. Hear Res. 1999;133:149–154. doi: 10.1016/s0378-5955(99)00065-9. [DOI] [PMC free article] [PubMed] [Google Scholar]
- Lysakowski A, Goldberg JM. A regional ultrastructural analysis of the cellular and synaptic architecture in the chinchilla cristae ampullares. J Comp Neurol. 1997;389:419–443. doi: 10.1002/(sici)1096-9861(19971222)389:3<419::aid-cne5>3.0.co;2-3. [DOI] [PMC free article] [PubMed] [Google Scholar]
- Mattson MP, Rychlik B, Chu C, Christakos S. Evidence for calcium-reducing and excito-protective roles for the calcium-binding protein calbindin-D28K in cultured hippocampal neurons. Neuron. 1991;6:41–51. doi: 10.1016/0896-6273(91)90120-o. [DOI] [PubMed] [Google Scholar]
- Merchant SN, Velázquez-Villaseñor L, Tsuji K, Glynn RJ, Wall C, 3rd, Rauch SD. Temporal bone studies of the human peripheral vestibular system. Normative vestibular hair cell data. Ann Otol Rhinol Laryngol Suppl. 2000;181:3–13. doi: 10.1177/00034894001090s502. [DOI] [PubMed] [Google Scholar]
- Monk G, Peterson EH. Calretinin is not specific for calyceal afferents in the semicircular canals of Pseudemys scripta. Soc Neurosci Abstr. 1995;21:918. [Google Scholar]
- Moutairou K, Hayez N, Pohl V, Pattyn G, Pochet R. Calbindin localization in African giant rat kidney (Cricetomys gambianus) Biochim Biophys Acta. 1996;1313:187–193. doi: 10.1016/0167-4889(96)00088-2. [DOI] [PubMed] [Google Scholar]
- Nagerl UV, Novo D, Mody I, Vergara JL. Binding kinetics of calbindin-D28k determined by flash photolysis of caged Ca2+ Biophys J. 2000;79:3009–3018. doi: 10.1016/S0006-3495(00)76537-4. [DOI] [PMC free article] [PubMed] [Google Scholar]
- Navaratnam DS, Bell TJ, Tu TD, Cohen EL, Oberholtzer JC. Differential distribution of Ca2+-activated K+ channel splice variants among hair cells along the tonotopic axis of the chick cochlea. Neuron. 1997;19:1077–85. doi: 10.1016/s0896-6273(00)80398-0. [DOI] [PubMed] [Google Scholar]
- Rasmussen AT. Studies of the VIIIth cranial nerve of man. Laryngoscope. 1940;50:67–83. [Google Scholar]
- Raymond J, Demêmes D, Nieoullon A. Neurotransmitters in vestibular pathways. In: Pompeiano O, Allum JHJ, editors. Progress in Brain Research. Vestibulospinal Control of Posture and Locomotion. Vol. 76. Amsterdam: Elsevier; 1984. pp. 29–43. [DOI] [PubMed] [Google Scholar]
- Raymond J, Dechesne CJ, Desmadryl G, Dememes D. Different calcium-binding proteins identify subpopulations of vestibular ganglion neurons in the rat. Acta Otolaryngol Suppl. 1993;503:114–118. doi: 10.3109/00016489309128090. [DOI] [PubMed] [Google Scholar]
- Retzius G. Das Gehörorgan der Reptilien, der Vogel und der Saügethiere. Stockholm, Sweden: Samson and Wallin; 1884. Das Gehörorgan der Wirbelthiere. Bd. II. [Google Scholar]
- Richardson KC, Jarett L, Finke EH. Embedding in epoxy resins for ultrathin sectioning in electron microscopy. Stain Technol. 1960;35:313–323. doi: 10.3109/10520296009114754. [DOI] [PubMed] [Google Scholar]
- Rogers JH. Calretinin: a gene for a novel calcium-binding protein expressed principally in neurons. J Cell Biol. 1987;105:1343–1353. doi: 10.1083/jcb.105.3.1343. [Published erratum in J Cell Biol 110: 1845, 1990] [DOI] [PMC free article] [PubMed] [Google Scholar]
- Rogers JH. Two calcium-binding proteins mark many chick sensory neurons. Neuroscience. 1989;31(3):697–709. doi: 10.1016/0306-4522(89)90434-x. [DOI] [PubMed] [Google Scholar]
- Rogers J, Khan M, Ellis J. Calretinin and other CaBPs in the nervous system. Adv Exp Med Biol. 1990;269:195–203. doi: 10.1007/978-1-4684-5754-4_32. [DOI] [PubMed] [Google Scholar]
- Rosenblatt KP, Sun ZP, Heller S, Hudspeth AJ. Distribution of Ca2+-activated K+ channel isoforms along the tonotopic gradient of the chicken’s cochlea. Neuron. 1997;19:1061–75. doi: 10.1016/s0896-6273(00)80397-9. [DOI] [PubMed] [Google Scholar]
- Rosenhall U. Vestibular macular mapping in man. Ann Otol Rhinol Laryng. 1972;81:339–351. doi: 10.1177/000348947208100305. [DOI] [PubMed] [Google Scholar]
- Sans A, Dechesne CJ, Dememes D. The mammalian otolithic receptors: a complex morphological and biochemical organization. Adv Otorhinolaryngol. 2001;58:1–14. doi: 10.1159/000059109. [DOI] [PubMed] [Google Scholar]
- Silva M, Downing JA. CRC Handbook of Mammalian Body Masses. Boca Raton, FL: CRC; 1995. [Google Scholar]
- Smith CE, Goldberg JM. A stochastic afterhyperpolarization model of repetitive activity in vestibular afferents. Biol Cybern. 1986;54:41–51. doi: 10.1007/BF00337114. [DOI] [PubMed] [Google Scholar]
- Snedecor GW, Cochran WG. Statistical Methods. Ames, IA: Iowa State Press; 1989. [Google Scholar]
- Spoendlin H. Organization of the sensory hairs in the gravity receptors in utricle and saccule of the squirrel monkey. Z Zellforsch Mikrosk Anat. 1964;62:701–706. doi: 10.1007/BF00341855. [DOI] [PubMed] [Google Scholar]
- Sterio DC. The unbiased estimation of number and sizes of arbitrary particles using the disector. J Microsc. 1984;134:127–136. doi: 10.1111/j.1365-2818.1984.tb02501.x. [DOI] [PubMed] [Google Scholar]
- Stevens J, Rogers JH. Chick calretinin: purification, composition, and metal binding activity of native and recombinant forms. Protein Expr Purif. 1997;9(2):171–181. doi: 10.1006/prep.1996.0677. [DOI] [PubMed] [Google Scholar]
- Velázquez-Villaseñor L, Merchant SN, Tsuji K, Glynn RJ, Wall C, 3rd, Rauch SD. Temporal bone studies of the human peripheral vestibular system. Normative Scarpa’s ganglion cell data. Ann Otol Rhinol Laryngol Suppl. 2000 May;181:14–9. doi: 10.1177/00034894001090s503. [DOI] [PubMed] [Google Scholar]
- Vergara C, Latorre R, Marrion NV, Adelman JP. Calcium-activated potassium channels. Curr Opin Neurobiol. 1998;8:321–9. doi: 10.1016/s0959-4388(98)80056-1. [DOI] [PubMed] [Google Scholar]
- Voit M. Zur Frage der Verästelung des Nervus acusticus bei den Säugetieren. Anat Anz. 1907;31:635–640. [Google Scholar]
- Vollrath MA, Eatock RA. Time course and extent of mechanotransducer adaptation in mouse utricular hair cells: comparison with frog saccular hair cells. J Neurophysiol. 2003;90:2676–2689. doi: 10.1152/jn.00893.2002. [DOI] [PubMed] [Google Scholar]
- Watanuki K, Gottesberge AM zum. Morphological observations of the sensory epithelium of the macula sacculi and utriculi in the guinea pig. Arch Klin Exp Ohren Nasen Kehlkopfheilkd. 1971;200(2):136–44. doi: 10.1007/BF00418197. [DOI] [PubMed] [Google Scholar]
- Werner CF. Die Differenzierung der Maculae im Labyrinth, insbesondere bei Säugetieren (transl. by A. Lysakowski) Z Anat Entwicklungs. 1933;99:696–709. [Google Scholar]
- Winsky L, Kuźnicki J. Distribution of calretinin, calbindin D28K, and parvalbumin in subcellular fractions of rat cerebellum: effects of calcium. J Neurochem. 1995;65(1):381–388. doi: 10.1046/j.1471-4159.1995.65010381.x. [DOI] [PubMed] [Google Scholar]
- Yamoah EN, Lumpkin EA, Dumont RA, Smith PJ, Hudspeth AJ, Gillespie PG. Plasma membrane Ca2+-ATPase extrudes Ca2+ from hair cell stereocilia. J Neurosci. 1998;18:610–624. doi: 10.1523/JNEUROSCI.18-02-00610.1998. [DOI] [PMC free article] [PubMed] [Google Scholar]
- Zeh C, Desai SS, Lysakowski A. The extent of the striola in the utricular macula has been defined in various rodent species using calretinin immunochemistry. Abstr 22nd Midwinter Meeting ARO; 1999. p. 186. [Google Scholar]
- Zheng JL, Gao WQ. Analysis of rat vestibular hair cell development and regeneration using calretinin as an early marker. J Neurosci. 1997;17:8270–8282. doi: 10.1523/JNEUROSCI.17-21-08270.1997. [DOI] [PMC free article] [PubMed] [Google Scholar]