

ABSTRACT
Intestinal epithelial cells (IECs) serve as both a physical barrier and a source of robust antiviral interferon (IFN) response. As such, they constitute the primary barrier that enteric viruses, such as rotavirus, need to overcome to initiate infection. The gut is characterized by very low oxygen levels (hypoxia) within the lumen, resulting in a unique hypoxic physiological environment in which rotavirus infection occurs. Depending on the tissues or viruses, conflicting results have been described for the role of hypoxia in regulating viral infections, where hypoxia could have either a proviral or antiviral function. Since intestinal epithelial cells naturally exist in a hypoxic environment, it is essential to investigate how these conditions affect rotavirus infection. We found that hypoxia promotes rotavirus infection, resulting in increased virus replication and production of infectious virus particles. We showed that this increased production of rotavirus particles under hypoxia is due to a decreased induction of IFNs, leading to a decreased expression of IFN stimulated genes and antiviral protection. RNA sequencing showed a robust decrease in ISG production in hypoxia for both rotavirus infection and poly I:C transfection, suggesting a conserved inhibition of IECs’ IFN response to viral pathogen challenges under hypoxic conditions. Functional analyses revealed that hypoxia impairs signal transduction leading to IFN expression by negatively regulating the activation of the master signaling molecule TBK1. Mechanistically, we determined that hypoxia induces the expression of the protein phosphatase PP2A which is responsible for the hypoxia-induced impairment of TBK1 activation. Importantly, we confirmed that this hypoxia-mediated dampening of immune response was not restricted to rotavirus infection but dampened the IFN induction of a broad range of viruses and immune stimuli. Together, we propose that hypoxia creates an immune-suppressive environment through downregulation of IFN, representing a novel proviral mechanism for hypoxia in the human gastro-intestinal tract.
KEYWORDS: Intestinal epithelial cells, hypoxia, type III interferon, antiviral response, intestinal organoids, rotavirus
Introduction
The intestinal epithelium is a continuous monolayer of epithelial cells organized within distinct crypt-villi structures. The epithelium serves as an absorptive surface for nutrients, as well as acting as a key barrier to protect against enteric viruses such as rotavirus.1,2 Rotavirus is a double stranded RNA virus which primarily infects the mature enterocytes present in the intestinal epithelium, leading to disruption of the epithelial monolayer.3 Rotavirus infections can lead to life-threatening disease outcomes including dehydration and diarrhea, especially in young children, resulting in upwards of 200,000 deaths annually.4,5
One critical parameter of the intestinal epithelium, which has been mostly overlooked in the context of enteric virus infection, is the fact that the lumen of the gut contains low levels of oxygen (hypoxia). Because of this lumenal hypoxic environment, intestinal epithelial cells (IECs) located within the villi structures are exposed to low oxygen levels (~0.5–2% O2).6 In contrast, cells in the crypts, which are located closer to the more vascularized lamina propria, exist under relatively higher oxygen conditions (or normoxia).7,8 In recent years, hypoxia has emerged as a major regulator of host/pathogen interactions; however, its effects on viral infections vary significantly depending on the virus, cell type, or tissue. For instance, hypoxia-inducible factors have been shown to promote respiratory syncytial virus (RSV) infection in Hep-2 cells, but inhibit infection in Calu-3 cells.9,10 In low oxygen tissues, such as the liver, hypoxia has been reported to enhance dengue virus (DENV) and hepatitis C virus (HCV) replication through shifts in cellular metabolism, albeit by different mechanisms.11,12 For SARS-CoV-2, hypoxia has been reported to decrease ACE2 expression therefore blocking viral entry, as well as decreasing viral replication and limiting disease severity.13,14 However, mice exposed to hypoxic conditions for 48 h have shown increased ACE2 expression in alveolar lung epithelial cells, suggesting hypoxia increases viral susceptibility in a subset of these cells in vivo.15 Hypoxia has been shown to promote lytic reactivation of Epstein–Barr Virus (EBV).16–18 Similarly, we and others have shown that hypoxia supports lytic Kaposi’s sarcoma-associated herpesvirus (KSHV) infection, suggesting a conserved pro-viral effect of hypoxia on herpesvirus infection.19–21 For influenza A virus infection, hypoxia-inducible factors have been shown to play a key role in inducing pro-inflammatory cytokines in response to H1N1 infection, therefore controlling viral replication.22,23 Collectively, these studies demonstrate the importance of hypoxia on host/virus interactions but also highlight that hypoxia can act as a proviral or antiviral environment depending on the virus and/or tissue considered.
Upon rotavirus infection, the pattern recognition receptors RIG-I, MDA-5, and TLR3 detect the virus, leading to a complex signaling cascade which results in the conserved phosphorylation and activation of the key signaling hub TBK1.24–26 Phosphorylated TBK1 subsequently phosphorylates IRF3 leading to its activation, which in turn allows IRF3 to translocate into the nucleus to drive the expression of interferons (IFNs). Secreted IFNs then bind to their receptors, initiating a JAK/STAT-dependent signaling cascade which upregulates IFN stimulated genes (ISGs) to act as antiviral effectors.27 In the case of rotavirus infection, the intestinal epithelium protects itself through the induction of IFNs, specifically type I IFNs (composed of 13 IFNα’s, along with IFNβ, IFNκ, IFNω, and IFNε) and type III IFNs (IFNλ1–4).28,29 Although all cells can produce both type I and type III IFN, only the type I IFN receptor (IFNAR) is ubiquitously expressed, whereas the type III IFN receptor (IFNLR1) is restricted to epithelial and a subset of immune cells, highlighting its essential role in the protection of mucosal surfaces (e.g. intestine, lung, skin).30 Recent work from our lab has shown that type III IFNs are the primary cytokines made by human IECs to protect themselves against rotavirus infection, whereas type I IFNs are dispensable.31 Similarly, studies using murine models have shown that mice lacking the type III IFN receptor (IFNLR) were significantly more susceptible to disease and had significantly higher viral burden than mice depleted of the type I IFN receptor (IFNAR1).28,32,33 However, exogenous treatment with both type I and type III IFN is able to block rotavirus infection, showing that both can be used as therapeutics to protect intestinal cells against rotavirus replication and spread.34 The influence of hypoxia on this protective IFN response is highly cell-type specific. In monocytes and breast cancer cell lines, hypoxia has been reported to downregulate type I IFN, creating an immunosuppressive environment.35,36 Hypoxia has also been shown to decrease ISG expression after Zika virus infection in monocytes due to a decreased induction of type I IFN, without altering receptor expression.37 Conversely, in myocytes, pharmacologically induced hypoxia has been reported to increase expression of RIG-I, resulting in induction of type I IFN in an inflammatory capacity.38 Finally, in kidney cells, hypoxia has been reported to increase IFN induction after vesicular stomatitis virus (VSV) infection, protecting against viral infection.39
Given that hypoxia’s impact on viral infections and IFN responses varies across cell types and tissues, it is essential to study how the physiologically hypoxic environment of the human intestinal tract affects rotavirus infection and the broader antiviral responses of IECs to enteric viruses. To address this, we cultured human IECs in either atmospheric (normoxia, 20% O2) or physiologically gut relevant (hypoxia, 1% O2) oxygen levels. We found that hypoxia rendered cells more permissive to rotavirus infection. We were able to trace this susceptibility to a hypoxia-dependent dampening of TBK1 phosphorylation by the protein phosphatase PP2A. This decrease in TBK1 phosphorylation led to decreased type III IFN production under hypoxia, thereby increasing virus replication and spread. We further confirmed that hypoxia not only dampens the immune response following rotavirus infection but also following infection by mammalian reovirus, as well as immune stimuli such as poly I:C and diABZi. These results suggest an essential role for hypoxia in regulating innate immune responses at intestinal mucosal surfaces during viral infection.
Methods and materials
Cell culture
Human T84 colon carcinoma cells (ATCC, CCL-248) and derivative cell lines were maintained in DMEM:F12 1:1 media (Corning, 10–092-CV) supplemented with 10% fetal bovine serum (FBS) (Summerlin Scientific, SS100), 100 U/mL penicillin and 100 μg/mL streptomycin (Gibco 15,140–122), and plasmocin prophylactic (Invivogen, ant-mpp) at 37°C, 5% CO2. Human HEK 293T embryonic kidney cells (Takara 632180) were maintained in DMEM media (Gibco 10,569,010) supplemented with 10% FBS and 100 U/mL penicillin and 100 μg/mL streptomycin at 37°C, 5% CO2. MA104 African green monkey kidney cells (ATCC, CRL-2378.1) were cultured in MEM (Corning, 10–010-CV) supplemented with 10% FBS and 100 U/mL penicillin and 100 μg/mL streptomycin at 37°C, 5% CO2. T84 cells and derivative cell lines were cultured in rat tail collagen coated flasks (Sigma, C7661). Collagen was prepared in 0.1 M acetic acid at 1 mg/mL, then diluted 1:100 in 60% ethanol before being added to the flask for 24 h at 4°C. Remaining ethanol was removed, and the flask was washed 2x with phosphate buffered saline (PBS) prior to cell seeding.
Human ileum tissue for organoids was received following ileum resections at the University Hospital Heidelberg under the approved study protocol S-024/2003, with two different donors used for all experiments. Organoids were isolated as originally described by Sato et al.40 Briefly, after the tissues were dissociated using 2 mM EDTA (Thermo Fisher Scientific #15575020), crypts were spun 5 min at 450 × g at 4°C, washed in ice-cold PBS, and filtered through 70 µm-filters (Greiner #542070). Fractions enriched in crypts were resuspended in Matrigel (Corning #354230) and maintained in basal culture media (Advanced DMEM/F12 (Gibco 12,634,010), supplemented with 100 U/mL penicillin and 100 μg/mL streptomycin, 10 mM HEPES (Fisher 15,630,080); 60% v/v WNT-3A, R-spondin, Noggin (WRN) conditioned media produced from L-WRN cells (ATCC, CRL 3276); 1× B27 (Fisher 17,504,001), 1 mM Nacetylcysteine (Sigma, A9165), 500 nM A8301 (Sigma, SML0788), 50 ng/mL FGF (Preprotech, 10018B), 25 ng/mL Noggin (Thermo Fisher Scientific 25,038), 100 ng/mL IGF1 (Fisher Scientific 590,908), 10 nM Gastrin, and 50 ng/mL EGF (Gibco, PMG8041). Organoids were passaged with 0.05% trypsin (Gibco 25,300,054) once per week and after each split, the medium was additionally supplemented with 10 μM Y27632 hydrochloride (Cayman Chemical 10,005,583). Media changes were performed three times a week.
Exposure of T84 cells and human intestinal organoids to low oxygen levels (hypoxia) was performed using either a hypoxia cell culture incubator (Eppendorf, C170i) or a hypoxia working station (BioSpherix XVIVO system X3) set to 1% O2, 37°C, 5% CO2. Media was acclimated to hypoxia for at least 24 h prior to use in hypoxic cell culture.
Generation of cell lines and lentivirus production
T84 cells knocked down for the PP2A catalytic subunit (PP2ACa KD) were prepared using lentivirus expressing small hairpin RNA (shRNA). Oligonucleotides targeting PP2Aca (sequences in Table 1)41 were heated for 5 min at 95°C (1.25 μL 100 μM each primer, 2.5 μL NEBuffer2 (B7002S), 20 μL H20), cooled to room temperature to allow to anneal, and ligated overnight at 16°C (following T4 ligase (M0202S) protocol) with AgeI-HF and EcoRI-HF digested pLKO.1 Blasti plasmid (Addgene 26,655). PP2A regulatory subunit 5B knock-out cells (PPP2R5B KO) and T84 IRF3 knock-out cells (IRF3 KO cells) were generated using CRISPR/Cas9 technology. Oligonucleotides encoding the guided RNA targeting PPP2R5B or IRF3 (sequence in Table 1) were ligated with BsmBI digested lentiCRISPRv2.puro (Addgene 98,290). The overexpression construct for PPP2R5B was prepared using the PPP2R5B sequence from V246.pCEP.4 HA.B56β42 (gift from David Virshup, Addgene 14,533). This plasmid consists of a single-point mutation at residue 346 resulting in an isoleucine, which was corrected back to valine by site directed mutagenesis. This construct was then shuttled into the pWPI.puro plasmid using gateway cloning (Invitrogen 11,789,020). Constructs were transformed into DH5α-competent cells, and plasmid DNA was purified using the Xtra Midi kit (Macherey Nagel 740,410).
Table 1.
Oligonucleotide sequences (gene targeting sequences in bold).
| Oligo 1 (5’ to 3’) | Oligo 2 (5’ to 3’) | |
|---|---|---|
| PP2ACa KD | CCGGGAGGGATATAACTGGTGCCATCTCGAG ATGGCACCAGTTATATCCCTCTTTTTG |
AATTCAAAAAGAGGGATATAACTGGTGCCAT CTCGAGATGGCACCAGTTATATCCCTC |
| PPP2R5B KO | CACCGGCTAGTGGGGGTGCTTGCA | AAACTGCAAGCACCCCCACTAGCC |
| IRF3 KO | CACCGGAGGTGACAGCCTTCTACCG | AAACCGGTAGAAGGCTGTCACCTCC |
Lentivirus was produced by transfection of 90% confluent HEK 293T cells (Takara 632,180) with 4 μg of pMD2.G (Addgene 12,259), 4 μg of psPAX2 (Addgene 12,260), and 8 μg of plasmid of interest using PEI transfection reagent at a 1:3 DNA:PEI ratio (Polysciences 23,966–100) per 10 cm plate in a total volume of 10 mL of DMEM without antibiotics. Lentiviruses were harvested by collecting the supernatant containing virus 48 h post-transfection and filtered using a 0.45 µm polyethersulfone (PES) filter (Fisher 99142504). T84 cells were transduced by mixing 8 × 10⁵ T84 cells, 800 μL lentivirus, and 3 μg Polybrene (Sigma, TR-1003-G) in suspension and seeding into a rat tail collagen coated 6-well plate. Successfully transduced cells were selected after 3 d by the addition of blasticidin (Invivogen, ant-bl-1, 0.1 mg/mL) or puromycin (Invivogen, ant-pr-1, 10 μg/mL) depending on the construct.
T84 cells depleted of both the type I and III IFN receptors (IFNAR/IFNLR dKO cells) were previously described.43
Rotavirus infection
We used a rotavirus expressing the fluorescent protein UnaG fused to the NSP3 viral gene (a kind gift from John Patton, Indiana University).44 Given the essential role of IFN in blocking infection, we utilized an SA11 NSP1 mutant rotavirus strain which contains a 17 amino acid deletion in the C’ terminal domain of NSP1, hindering its role as an IFN antagonist, allowing it to be used as a tool to study innate immune regulation of rotavirus infection.45
Rotavirus stock: Rotavirus was amplified and semipurified as previously described.46 Briefly, the virus was amplified by adding rotavirus at MOI 0.03 to three confluent T175 flasks of MA104 cells. 72 h post infection (hpi) cells were lysed by repeated freeze thaw cycles (3×), virus was semipurified by ultracentrifugation (25,000 × g, 1.5 h) through a sucrose cushion, and produced virus stocks were titered by plaque assay in MA104 cells as described below.
Rotavirus infection of T84 cells: Prior to infection, 2.5 × 10⁵ T84 cells were seeded in 48-well plates. Cells were placed immediately into normoxic (20% O2) or hypoxic (1% O2) conditions for 24–48 h depending on the experimental design (see figure legends for details). Cell number was confirmed by cell counting and was shown to be unaffected by hypoxia (data not shown). Rotavirus was activated at indicated MOI in a 37°C water bath for 30 min in FBS-free media containing 2 μg/mL trypsin (Sigma, T1426) and added to cells in a final volume of 200 μL per well. Cells were washed with PBS, and activated-virus containing media was added for 1 h at 37°C. Virus was then removed, and cells were washed 2× with FBS-free media before being replaced with 200 μL of fresh FBS-free media containing 0.5 μg/mL trypsin. Samples collected after 1 h virus incubation are indicated as “input.”
Rotavirus infection of organoids: To assess rotavirus spread in ileum-derived organoids, organoids were seeded as spheroids 6 d prior to infection in basal culture media in a 48-well plate. Two days after seeding, basal medium was removed and replaced by differentiation media (Advanced DMEM/F12, supplemented with 100 U/mL penicillin and 100 μg/mL streptomycin, and 10 mM HEPES; 10% R-Spondin conditioned media produced from HEK R-Spondin cells (kindly provided by S. Kuo, Stanford), 1× B27 (Fisher 17504001), 500 nM A8301 (Sigma, SML0788), 75 ng/mL FGF (Preprotech, 10018B), 50 ng/mL Noggin (Thermo Fisher Scientific 25,038), 100 ng/mL IGF-1 (Fisher Scientific 590,908), 10 nM Gastrin, and 50 ng/mL EGF (Gibco, PMG8041). 24 h before infection, organoids were transferred into normoxic (20% O2) or hypoxic conditions (1% O2). On the day of infection, rotavirus was activated in a 37°C water bath for 30 min in differentiation media containing 2 μg/mL trypsin (Sigma, T1426). Organoids were washed in cold normoxic or hypoxic PBS, centrifuged 5 min at 450 × g at 4°C, and resuspended in 50 μL normoxic or hypoxic differentiation media per well. PBS and media were incubated in hypoxia for at least 24 h before use. Activated rotavirus (in 50 μL/well) was added to obtain a final volume of 100 μL per well. 2 hpi organoids were centrifuged for 5 min at 450 × g at 4°C, and medium was exchanged to fresh normoxic or hypoxic differentiation media containing 0.5 μg/mL trypsin. Rotavirus-infected organoids were plated into 48-well plates (final volume 350 μL per well). Samples collected at 2 hpi were used as input controls. Infected samples were collected at 8 hpi and 24 hpi as indicated.
To determine the IFN response of ileum organoids to rotavirus infection, organoids were seeded into 48-well plates 6 d prior to infection. 48-well-plates were coated with 0.04 mg/mL human collagen (Sigma Aldrich, C5533) diluted in H2O prior to seeding. Two days post-seeding, organoids were differentiated by exchanging the basal media and for differentiation media and 24 h before infection, organoids were transferred into normoxic (20% O2) or hypoxic conditions (1% O2). Before infection, rotavirus was activated in a 37°C water bath for 30 min in differentiation media containing 2 μg/mL trypsin, in a total volume of 50 μL per well. The media on the organoids was replaced for 300 μL normoxic or hypoxic differentiation media and then 50 μL of activated rotavirus containing 2 μg/mL trypsin or 50 μL of 2 μg/mL trypsin containing media (mock samples) were added per well for a total volume of 350 μL. Samples were collected at 8 hpi.
Other viral stimuli and IFN treatment
To determine the response to other viral stimuli and the activation of the IFN signaling pathway, T84 cells were infected with mammalian reovirus (MRV) or treated with STING agonist diABZi, dsRNA mimic poly I:C, IFNβ1, and IFNλ3. Prior to treatment, 1.5x10⁵ T84 cells were seeded in 48-well plates and immediately incubated into normoxic (20% O2) or hypoxic (1% O2) conditions for 24 h. MRV was added at an MOI 1 in a total volume of 200 μL DMEM/F12, with RNA harvested at 16 hpi. For diABZi treatment, cells were treated with 10 μM diABZi (Selleckchem, S8796) or DMSO control in a total volume of 200 μL DMEM/F12, with RNA harvested at 8 hpi. For poly I:C, cells were transfected with 4 μL Lipofectamine 2000 (Invitrogen 11,668,019) and 1 μg of poly I:C in a 1:1 ratio of LMW (Invivogen, tlrl-picw) and HMW (Invivogen, tlrl-pic), in 50 μL Optimem (Gibco 31,985,062) diluted in 200 μL DMEM/F12, with RNA harvested at 8 h post transfection. For IFN treatment, cells were treated with IFNβ1 (R&D, 8499-IF-010) or IFNλ3 (R&D, 5259-IL-025) at the indicated concentrations. Protein was harvested at 1 h post-treatment for pSTAT activation, and RNA was harvested at 24 h post-treatment for ISG expression.
HEK-Blue assay
To detect the secreted IFN, we utilized the Invivogen HEK-Blue reporter cell lines, specifically HEK-Blue IFN-α/β (Invivogen, hkb-ifnab) for type I IFN and HEK-Blue IFN-λ (Invivogen, hkb-ifnl) for type III IFN. These cells allow for the detection of IFN by expressing a secreted embryonic alkaline phosphatase (SEAP) reporter under the control of an IFN-stimulated response element (ISRE). Once IFN is bound to the receptor, it initiates a signaling cascade which leads to the production of SEAP which can be easily detected in the supernatant using QUANTI-Blue solution (Invivogen, rep-qbs). Previously, we have seen that the HEK-Blue IFN-α/β cells are also able to respond to type III IFN, therefore we generated a modified cell line lacking the IFNLR in these reporter cells which can be used to detect type I IFN only.31
To measure the secreted IFN in response to viral stimuli, T84 cells or patient-derived ileum organoids were placed into normoxic (20% O2) or hypoxic (1% O2) conditions and infected (rotavirus or MRV) or treated (poly I:C or diABZi) as described above. Supernatants were collected after 8 h to measure the secreted IFN through the SEAP reporter system. HEK-Blue IFN-α/β IFNLR1-/- and HEK-Blue IFN-λ cells were seeded at 3 × 10⁴ cells per well in 96-well plates 1 d prior to the assay. 50 μL of collected supernatants (from 200 μL total) were diluted 1:1 in DMEM/F12 media containing 10% heat inactivated FBS. To generate a standard curve, HEK-blue cells were treated with 1:4 serial dilutions of IFNβ1 starting at 10,000 IU/mL or IFNλ1–3 starting at 300 ng/mL. Cells were treated with supernatant or standards in a total volume of 100 μL for 24 h. For the colorimetric assay, QUANTI-Blue solution was prepared according to the manufacturer’s instructions. 50 μL of supernatant was taken from each treated well and then transferred to a new 96-well plate along with 150 μL of QUANTI-Blue to measure the amount of secreted embryonic alkaline phosphatase (SEAP). Plates were incubated for 10 min 37°C and read at 620 nm using a plate reader. The amount of secreted IFN was determined by comparison to the standard curve.
Rotavirus plaque assay
Purified rotavirus stocks, supernatants from T84 cells, and organoid cell lysates were titered by plaque assays in MA104 cells. MA104 cells were seeded at 3 × 10⁵ cells per well in 6-well plates until confluent (6–10 d). Virus was activated for 30 min at 37°C in FBS-free MEM containing 0.5 μg/mL trypsin. Cells were washed twice with FBS-free medium, and then serial dilutions of virus (10−3–10−8 for stocks, 10−1–10−6 for experimental samples) were added. Cells were incubated with virus for 1 h with rocking every 15 min to allow a homogenous infection across the MA104 monolayer. After 1 h, virus was removed, and plates were washed once with FBS-free MEM and overlaid with 3 mL of a 1:1 ratio of 2× Modified Eagle Medium (Fisher 11935046) containing 0.5 µg/mL of trypsin and 1.2% agarose. Plates were incubated at 37°C for 2 d, until plaques were clearly visible. As the virus is fluorescently tagged, plaques were visualized using the 488 nm wavelength on Licor Odyssey M, and PFU/mL was calculated.
Immunofluorescent microscopy and live cell imaging
T84 WT and derivative cell lines were infected with UnaG tagged rotavirus as described above. Rotavirus infection was imaged at indicated timepoints (see figure legends) using a Celldiscoverer 7 microscope (Zeiss). UnaG signal was imaged with a 488-nm light-emitting diode (LED) lamp at 50% power and 200-ms exposure time. For experiments monitoring rotavirus infection spread under normoxia and hypoxia, T84 cells were seeded and infected as described above. After the virus was removed and replaced with fresh, trypsin-containing media, cells were placed in the CD7 (Zeiss) at 37°C and 5% CO2, under normoxia (20% O2) or hypoxia (1% O2) conditions. UnaG signal was imaged at 488-nm, 250-ms with 30-min intervals for 72 h. Quantification of infected cells was done using ZEN desk software to identify UnaG signal within a confluent field of view with five images taken per well.
Immunostaining and single molecule fluorescent in-situ hybridization (smFISH)
Rotavirus infected T84 cells or patient-derived ileum organoids were fixed at 24 hpi in 4% paraformaldehyde (PFA) for 20 min at room temperature. Cells were then permeabilized with 0.5% Triton-X-100 for 15 min and blocked in PBS containing 3% bovine serum albumin (BSA) for 30 min. Cells were probed with mouse monoclonal antibody against rotavirus VP6 (Kind gift from Dr. Siyuan Ding, Washington University, 1:500 in PBS containing 1% BSA) for 1 h at room temperature, washed three times with PBS, and then probed with either Alexa Fluor 647 secondary antibody (Molecular Probes, A21236, 1:1000 in PBS containing 1% BSA) or Alexa Fluor 568 secondary antibody (Molecular Probes, A11019, 1:1000 in PBS containing 1% BSA), and 4′,6-diamidino-2-phenylindole (DAPI, BD Bioscience 564,907) for 30 min at room temperature. Alexa Fluor 647 signal was imaged with a 653-nm LED lamp at 50% power and 200-ms exposure time. Alexa Fluor 568 signal was imaged with a 577-nm LED lamp at 50% power and 75-ms exposure time. DAPI was imaged with a 353-nm LED lamp at 30% power and 25-ms exposure time using a Zeiss CD7 microscope. For single-molecule fluorescent in-situ hybridization (smFISH), T84 cells were seeded in normoxia and hypoxia, and transfected with poly I:C on ibidi chambers. IFNλ3 probes were labeled with ATTO-633 (Jena Bioscience, NU-821–633) and hybridized to samples as we previously described.47 Slides were imaged with a 631-nm LED lamp at 50% power and 2-s exposure time.
Bulk RNA-sequencing and analysis
To measure the global impact of hypoxia on the response to viral stimuli, T84 cells were placed into normoxic (20% O2) or hypoxic (1% O2) conditions, and either treated with poly I:C or infected with rotavirus as described above. For each condition, the cells were seeded in 24-well plates with four replicates. Mock, poly I:C, and rotavirus infected samples were harvested at 8 h, with an additional timepoint harvested for rotavirus at 16 hpi. RNA extraction was performed using the RNeasy minikit (Qiagen 74,104) as per manufacturer’s instructions. Samples were sent to Novogene for QC, library preparation, sequencing, and alignment. Briefly, mRNA was isolated from RNA samples using poly-T oligo-attached magnetic beads. Library preparation used random hexamer primers, followed by the second strand cDNA synthesis using dTTP. Sequencing was conducted using the Illumina NovaSeq 6000 platform, with paired-end 150 bp reads. The data generated have been deposited in the NCBI Gene Expression Omnibus (GEO) database under accession number GSE300313.
Sequencing results were aligned with using the human reference genome GRCh38/hg38 to determine gene counts. Differential gene expression between conditions was calculated using DEseq2.48 GO terms associated with rotavirus infection in both normoxia and hypoxia were determined using clusterProfiler,49 with significant data defined as padj < 0.05, abs(log2foldchange) > 0.5, and a basemean cutoff of 10. Principal component analysis was determined using a variance cutoff of 0.1. To evaluate the differential response to viral stimuli between normoxia and hypoxia, the genes associated with the top 15 biological processes (BP) GO terms differentially regulated by rotavirus infection (relative to mock) were used to generate heatmaps for rotavirus infection and poly I:C transfection between normoxia and hypoxia, with a basemean cutoff of 50. GSEA pathways were defined as “INNATE_IFN_RESPONSE” (comprised of GO:0140888, GO: 0034342, GO:0034342, and GO:0140374) and “HYPOXIA_RESPONSE” (comprised of GO:0070482 GO:0070482, and GO:1900037).
Western blot
For western blot of cell lysates, cells were washed once with PBS and lysed using 1X radioimmunoprecipitation assay (RIPA) buffer (150 mM sodium chloride, 1% Triton X-100, 0.5% sodium deoxycholate, 0.1% sodium dodecyl sulfate, 50 mM Tris (pH 8.0) supplemented with phosphatase (Roche 04,906,837,001), and protease inhibitors (Sigma-Aldrich 11,836,170,001)). RIPA buffer containing phosphatase and protease inhibitors is referred to as RIPA++. For detection of pIRF3 and total IRF3, nuclear fractioning was used. Cells were trypsinized and spun down at 600 g for 5 min in ice cold PBS. The cytoplasmic fraction was removed using a 5 min incubation with NP40 lysis buffer (0.1% NP40 in PBS with phosphatase, and protease inhibitors, and the remaining nuclear fraction was spun down at 600 × g and isolated using a 20 min incubation with RIPA++ buffer. Similar volumes of nuclear and cytosolic fractions were boiled with Laemmli buffer (200 mM Tris-HCl (pH 6.8), 40% glycerol, 0.8 g SDS, 20% β-mercaptoethanol, 8 mg bromophenol blue in 10 mL H20) for 10 min at 95°C and run on a 12% polyacrylamide SDS-PAGE gel. Proteins were transferred onto PVDF membrane using the Bio-Rad Tank blot system at 100 V for 100 min, blocked for 1 h at room temperature in tris-buffered saline (TBS) containing 0.1% Tween20 (TBST) and 5% BSA. Primary antibody was added overnight at 4°C in TBST containing 5% BSA. The following morning the antibody was removed, and the membrane was washed three times for 5 min with TBST followed by incubation with HRP-conjugated secondary antibody for 1 h at room temperature in TBST containing 5% BSA. Secondary antibody was removed, the membrane was washed three times for 5 min with TBST (0.1% Tween20) then imaged using SuperSignal Pico ECL (Fisher 34,577) using the ImageQuant LAS 4000 Imager (GE Healthcare).
Primary antibodies include pTBK1 (Cell Signaling, 5483S, 1:1000), TBK1/NAK (Cell Signaling, 3013S, 1:1000), pIRF3 (Cell Signaling, 4947, 1:1000), IRF3 (Cell Signaling, 11904T, 1:1000), PP2ACa (Cell Signaling, 2038S, 1:2000), PPP2R5B (Santa Cruz 515,676, 1:2000), pPAX (Cell Signaling, 2541, 1:1000), STAT1 (BD 610,115, 1:1000), pSTAT1 (BD 612,233, 1:1000), β-actin (Sigma, A5441, 1:2000), α-tubulin (Sigma, T9026, 1:1000), LaminB1 (Santa Cruz 374,015, 1:200). Secondary antibodies include goat anti-mouse HRP (Abcam, ab6789, 1:10,000) and goat anti-rabbit HRP (Abcam, ab97051, 1:10,000). β-Actin and α-tubulin were used as a loading control for total lysates, and LaminB1 was used as a loading control for the nuclear fraction.
RNA extraction, cDNA, and qPCR
Total RNA from lysed T84 cells or intestinal organoids was extracted using RNeasy minikit (Qiagen 74,104) as per manufacturer’s instructions. RNA concentration was measured using a NanoDrop system. 125–250 ng of total RNA was reverse transcribed into cDNA using the iScript cDNA Synthesis Kit (Bio-Rad 1,708,841) (thermic cycle: 25°C 5 min, 46°C 20 min, 95°C 1 min) as per manufacturer’s instructions. Prepared cDNA was diluted 1:1 with RNase/DNase-free H2O and qRT-PCR was performed using 2 μL of cDNA, 3.8 μL of 2 μM forward + reverse primer mix, 1.7 μL water, and 7.5 μL iTAq Universal SYBR green (BioRad 1,725,124) in a final reaction volume of 15 μl (thermic cycle: 95°C 30 s, 40x (95°C 5 s, 60°C 30 s), melting curve: 65°C 5 s, +0.5°C to 95°C) using a Biorad CFX96 real-time PCR system. The expression of target genes was analyzed relative to the housekeeping gene HPRT1 using the formula . Specific primers for genes of interest are listed in Table 2.
Table 2.
Primer sequences for qRT-PCR.
| Forward Primer | Reverse Primer | |
|---|---|---|
| HPRT1 | GCGTCGTGATTAGTGATG | GTCCATGAGGAATAAACACC |
| Rotavirus nsp5 | TGAATCCATAGACACGCC | CTGCTTCAAACGATCCACT |
| IFNβ1 | GCCGCATTGACCATCTAT | GTCTCATTCCAGCCAGTG |
| IFNλ2/3 | GCCACATAGCCCAGTTCAAG | TGGGAGAGGATATGGTGCAG |
| IFIT1 | AAAAGCCCACATTTGAGGTG | GAAATTCCTGAAACCGACCA |
| TLR3 | TTGTCTTCTGCACGAACCTGCGC | AACGCAAGGATTTTATT |
| TLR9 | CCACCCTGGAAGAGCTAAACC | GCCGTCCATGAATAGGAAGC |
| RIGI | GGCATGTTACACAGCTGACG | TTGCAATATCCTCCACCACA |
| MDA5 | GTCTGGGGCATGGAGAATAA | TGCCCATGTTGCTGTTATGT |
| MAVS | AGTTACCCCATGCCTGTCC | CATCTGGATTCCTTGGGATG |
| MyD88 | GGACCCAGCATTGAGGAG | ACAGCGGCCACCTGTAAA |
| PP2ACa | TCAAGAGCCTCTGCGAGAAGGCT | GCCCATGCACATCTCCACAGACA |
| PP2ACb | AGGGCCCAATGTGTGATCTG | GCTGGGTCAAATTGAAGGAAGG |
| PPP2R1A | ACCGCATGACTACGCTCTTCTG | TTGAAGCGGACATTGGCAACCG |
| PPP2R1B | TTGGAATCCGTCAGCTCTCT | CAGCAGCGGCATATACTCAA |
| PPP2R2A | CCACCTTTATCTCCTGTTGC | TTTCTCAGGTGAAAGGAGCAG |
| PPP2R2B | CCGCCGCAGCCTCGCAGAAC | GGGAACCAGAAGCCGGCAGACAAG |
| PPP2R2C | TGCCCACCCCTCTGAGTCGTCTTT | GCTGGGTCTGTTTCCTGGGTTATG |
| PPP2R2D | CGAGTACCTGCGCAGCAAGCT | GACCCGGTCATGATGGCGCTATC |
| PPP2R3A | TTGCGAAGGGTAAAAACTCTAAT | GGGCTCGATCCTCTTCCTCTAT |
| PPP2R3B | CGCGGCCAAGTTCGTCCATCT | CAGCCCCGGGTGCGTGTTC |
| PPP2R3C | AGCCGGCAGCCAGGGAGTGTG | AGGAAGGGACGGCGCTGATGTT |
| PPP2R5A | CCCGTGCCCCCGCCTCAG | GCCCGCCAACGCCTCACG |
| PPP2R5B | CGCAAACAGTGCAACCAC | ACACCATTGAAGTGCTCGAA |
| PPP2R5C | TCAAATACTGGCCAAAGACTCACA | TGCGGTACAAGGAAGGAAACA |
| PPP2R5D | GCTGCCCGAGTCCTCCCCATCAT | AACCGGCCCTTCTGCTTCTCTGC |
| PPP2R5E | TGGATTCTTCCCCAGAAGC | TTCCGAGAAAATCCGTCTACTT |
| PPP2R6A | ACAGCCCCAGCCAAAAAGAGCACT | ATAGGGGTCGATGTTGGGATTAG |
| PPP2R6B | TGGCACAGAATGGGCTGAAC | CTCCAAGGCCCAGTACACTT |
| PPP2R6C | GATCTCACCGTCACCAACGA | GGAACGAATGCCGTCGTAGT |
Statistical analysis
If not specified otherwise, data plotting and all statistical analyses were performed with the GraphPad Prism 5.0 software. To determine the appropriate statistical tests, normality of experimental data was determined using the Shapiro–Wilks test. For normally distributed data, unpaired t-tests were used. For non-normally distributed data, the non-parametric Mann–Whitney test was used, with p-values written in blue in appropriate figures. For all comparisons, the significant threshold was set at p < 0.05 unless otherwise stated in figure legends. All experiments using cell lines were repeated, with multiple wells serving as technical replicates in each experiment. For organoid-based experiments, multiple independent experiments were conducted using ileum-derived organoids from two donors to ensure reproducibility across patients. Unless otherwise noted, individual data points in figures represent single wells. All illustrations generated using biorender.
Results
Hypoxia renders IECs more susceptible to rotavirus infection
To determine whether the low oxygen levels naturally present in the gastrointestinal tract impact rotavirus infection of intestinal epithelial cells (IECs), human colon carcinoma-derived T84 cells were seeded in a confluent monolayer and exposed to normoxia (20% O2) or hypoxia (1% O2) for 48 h before being infected with rotavirus at low multiplicity of infection (MOI of 0.1 as determined in MA104 cells). We utilized a recombinant rotavirus expressing the fluorescent protein UnaG fused to the NSP3 viral gene.44 This recombinant rotavirus expresses fluorescent protein after replication and translation of the viral genome within the host cell, allowing for live tracking of infection.31 Using an UnaG fluorescent protein is essential because, as opposed to a green fluorescent protein (GFP), UnaG does not require oxygen for its fluorophore to mature.50 Immunofluorescent staining of cells infected by the recombinant UnaG rotavirus, using an antibody directed against the rotavirus structural protein VP6, revealed that all UnaG positive cells express the VP6 viral protein (Supplementary Figure S1 (A)), validating that this virus can be used as traceable system to follow infection of cells by rotavirus. 24 and 48 hpi, the number of rotavirus infected (UnaG-positive) cells was determined by fluorescence microscopy. Results revealed an increased number of rotavirus infected cells in cells cultured under hypoxia compared to cells cultured under normoxic conditions (Figure 1(A,B)). Live-cell microscopy of cells infected with the recombinant rotavirus under normoxic (20% O2) or hypoxic (1% O2) conditions confirmed that, despite similar infection levels at early timepoints, hypoxia supports increased rotavirus replication and spread at later timepoints as compared to cells grown under normoxia (Supplementary Figure S1(B-C), Supp movie 1–2). To evaluate the effect of hypoxia on viral genome replication and de novo virus production, T84 cells were infected with rotavirus in normoxia (20% O2) or hypoxia (1% O2) and RNA was harvested at 8, 24, and 48 hpi and evaluated by q-RT-PCR for the rotavirus gene NSP5. Results show that rotavirus genome replication was significantly increased in cells cultured under hypoxia as compared to cells cultured under normoxia (Figure 1(C)). Importantly, cells in normoxia and hypoxia showed similar expression of the NSP5 gene at 8 hpi, suggesting that hypoxia does not impact the initial infection of T84 cells (Figure 1(C)). Consistent with increased spread (Figure 1(A,B) and Supplementary Figure S1(B-C)), T84 cells cultured under hypoxia produced more de novo infectious rotavirus particles than cells cultured under normoxia (Figure 1(D)). These findings suggest a pro-viral role for hypoxia in rotavirus infection of the human colon-derived T84 cells.
Figure 1.

Hypoxia renders IECs more susceptible to rotavirus infection. (A-D) T84 cells were cultured for 48 h in normoxia (20% O2) or hypoxia (1% O2) and mock infected or infected with rotavirus expressing UnaG at MOI 0.1 as determined in MA104 cells. (A) Fluorescence microscopy of infected cells or mock infected cells at 24- and 48- hpi. Representative images showing UnaG positive rotavirus infection (green) and confluent monolayer (brightfield), scale bar = 200 μm. (B) Quantification of A, 5 images per well were averaged for the number of rotavirus positive cells per field of view. (C) qRT-PCR for viral gene NSP5 was performed at 1-, 8-, 24-, and 48-hpi. HPRT1 is used as a house keeping gene. (D) Supernatants were harvested at 1-, 24-, and 48-hpi, and a plaque assay was performed in MA104 cells. Values shown are relative to viral input. (E-F) Differentiated human ileum-derived organoids were incubated in normoxia (20% O2) or hypoxia (1% O2) 24 hours prior to rotavirus infection. (E) q-RT-PCR for viral genome NSP5 at 1-, 8-, and 24-hpi. HPRT1 is used as a housekeeping gene. (F) Supernatant and cell lysate were harvested from infected organoids at 1-, 8-, and 24-hpi and a plaque assay for infectious viral particles was performed in MA104 cells. Values shown are relative to viral input. (A-F) n ≥ 3 replicates. Significance determined by unpaired t test (normal distribution) between normoxic and hypoxic conditions, plaque assay significance from log transformed values, ns = not significant, significant p values shown.
To investigate the effect of hypoxia on rotavirus spread in a more physiologically relevant model, human ileum-derived organoids were differentiated and incubated in either normoxia (20% O2) or hypoxia (1% O2) 24 h before infection. At 8- and 24-hpi, RNA and supernatants were harvested and analyzed by q-RT-PCR for the rotavirus gene NSP5 and by plaque assay for virus production. Results show that, like in T84 cells, hypoxia led to a greater rotavirus genome replication and a larger production of de novo infectious virus particles in hypoxia as compared to normoxia in human ileum-derived organoids (Figure 1(E,F) and Supplementary Figure S1 (D)). Interestingly, while no difference in rotavirus replication was observed between normoxia and hypoxia in T84 cells at 8 hpi (Figure 1(C)), rotavirus replication was already favored under normoxic conditions at 8 hpi in human intestinal organoids (Figure 1(E)). This difference suggests that rotavirus replication might be faster in intestinal organoids, and as such is favored sooner under hypoxia compared to T84 cells. Alternatively, this difference may suggest that intestinal organoids are more responsive to hypoxia compared to T84 cells, in turn impacting early rotavirus replication. Together, these results show that human IECs under hypoxia better support rotavirus infection, resulting in increased viral spread relative to normoxia.
Hypoxia downregulates the innate immune response to rotavirus infection
To broadly investigate the effect of hypoxia on the response to rotavirus infection in IECs, T84 cells were seeded as confluent monolayers and exposed to normoxic (20% O₂) or hypoxic (1% O₂) conditions for 24 h prior to rotavirus infection. RNA sequencing was performed at 8 hpi, as well as 16 hpi (Figure 2(A)). Principal component analysis revealed that samples clustered according to their infected status (mock vs. rotavirus infected) as well as the time under hypoxic conditions (Supplementary Figure S2(A)). While the known hypoxia markers CA9 and VEGFA were increased in hypoxia as expected, the housekeeping gene HPRT1 showed consistent expression across conditions (Supplementary Figure S2B). Differential gene expression analysis revealed that hypoxia markedly altered the transcriptional profile in both mock and rotavirus-infected cells (Figure 2(B), Supplementary Figure S2(C-D)). As expected, in both normoxia and hypoxia, rotavirus infection led to differential expression of many innate immune pathways, indicating an antiviral response in infected IECs (Supplementary Figure S2(E)). However, a comparison of these antiviral genes between normoxic and hypoxic conditions showed a substantial reduction in expression under hypoxia (Figure 2(C,D)), suggesting that hypoxia dampens the antiviral immune response to rotavirus infection. This effect was not attributed to a general transcriptional shutdown of T84 cells under hypoxia, as many genes were upregulated under hypoxia in mock and rotavirus infected samples (Figure 2(B) and Supplementary Figure S2(C-D)). As expected, many of the upregulated genes under hypoxia were genes related to cellular response to hypoxia (Figure 2(B), Supplementary Figure S2(C-D) and data not shown). These findings suggest that hypoxia suppresses the T84 cell innate immune response upon rotavirus infection, which may contribute to increased viral spread observed under low oxygen conditions.
Figure 2.

RNA sequencing shows decreased innate immune response to infection in hypoxia. (A) Schematic showing timeline of rotavirus infection and sample collection (B) Volcano plot showing differentially expressed genes between rotavirus 8hpi in normoxia and hypoxia, with gene upregulated in hypoxia shown in blue (C-D) Heatmap showing top 50 most differentially expressed genes, as determined by log2foldchange, associated with viral response GO terms between normoxia and hypoxia, at (C) 8 hpi and (D) 16 hpi. (A-D) n = 4 replicates per condition, significantly differentially expressed genes determined by DESeq2.
Hypoxia impairs intestinal epithelial cell IFN response upon rotavirus infection
We have previously shown that induction of type III IFN is responsible for protection against rotavirus infection in human IECs.31 To investigate the impact of low oxygen on this induction, T84 cells were cultured under normoxia (20% O2) or hypoxia (1% O2) and infected with rotavirus. RNA was harvested at 8 hpi, where similar levels of the viral genome were observed by q-RT-PCR for the viral gene NSP5 (Figure 3(A)), suggesting similar infectivity of T84 cells under normoxia and hypoxia. Consistent with our previous report,31 the infection of T84 cells with rotavirus did not result in a significant induction of type I IFN as measured by IFNβ1 (Figure 3(B)). However, as expected, cells showed a robust increase in type III IFN expression (IFNλ2/3) upon rotavirus infection (Figure 3(C)). Interestingly, this induction was significantly inhibited in T84 cells cultured under hypoxia (Figure 3(C)), correlating with a significant decrease in the expression of the downstream ISG, IFIT1 (Figure 3(D)). These results show that hypoxia inhibits the type III IFN response to rotavirus infection in T84 cells. This decrease in IFN response to rotavirus infection was confirmed using GSEA enrichment analysis of our normoxia vs. hypoxia rotavirus-infected T84 cell RNA sequencing. While IECs in hypoxia show an expected increase in hypoxia-related gene expression compared to IECs cultured under normoxia (Figure 3(E)), IECs infected with rotavirus in hypoxia show a significant downregulation of IFN-related genes relative to those infected in normoxia (Figure 3(F)).
Figure 3.

Hypoxia inhibits the innate immune response to rotavirus infection in IECs. (A-D) T84 cells were cultured for 24 hours in normoxia (20% O2) or hypoxia (1% O2) and infected with rotavirus expressing UnaG at MOI 0.25 as determined in MA104 cells. RNA was harvested at 8 hpi and qRT-PCR was performed to measure expression of (A) the viral gene NSP5 (B) IFNβ1, (C) IFNλ2/3, and (D) IFIT1. (E-F) GSEA plots for rotavirus 8 hpi showing (E) upregulation of hypoxia response genes in hypoxia and (F) downregulation of innate IFN response in hypoxia. (G-N) Human ileum-derived organoids were incubated in normoxia (20% O2) or hypoxia (1% O2) for 24 hours before rotavirus infection with (G-J) equal inoculum in both normoxia and hypoxia or (K-N) MOI adjusted for similar infection levels between conditions. RNA was harvested at 8 hpi and qRT-PCR was performed to measure expression of (G,K) viral gene NSP5, (H,L) IFNβ1, (I,M) IFNλ2/3, and (J,N) IFIT1. (A-N) Relative expression was normalized to HPRT1. n ≥ 3 replicates. Significance determined by unpaired t test (normal distribution) between normoxic and hypoxic conditions, ns = not significant, significant p values shown.
To confirm that hypoxia mediates an inhibition of the IFN response upon rotavirus infection in a primary intestinal epithelium model, human ileum-derived organoids were similarly cultured under normoxia (20% O2) or hypoxia (1% O2) and infected with rotavirus. Consistent with our previous observation (Figure 1(E)), using the same inoculum of rotavirus between intestinal organoids growing under normoxia and hypoxia resulted in increased infection of organoids in hypoxia as compared to normoxia (Figure 3(G)). Importantly, even with more viral replication (NSP5) under hypoxia, we observed a decrease in both IFNβ1 (Figure 3(H)) and IFNλ2/3 (Figure 3(I)) expression, as well as downstream IFIT1 (Figure 3(J)) expression suggesting that hypoxia downregulates IFN response to rotavirus infection in primary human intestinal epithelial cells. In order to measure the response of organoids to similar rotavirus infection levels, intestinal organoids were infected with different MOIs in normoxia and hypoxia. We found that using 10-fold less rotavirus under hypoxia resulted in similar infection levels as normoxia (Supplementary Figure S3(A)). With similar levels of rotavirus infection measured at 8 hpi (Figure 3(K)), human ileum-derived organoids again showed a robust decrease in expression of both IFNs and IFIT1 in hypoxia as compared to normoxia (Figure 3(L-N)). Similar findings were observed in other ileum organoids derived from a different patient (donor 2) (Supplementary Figure S3(B-E)). To validate that hypoxia also dampened the amount of secreted IFN, we infected T84 cells or organoids with rotavirus and collected supernatants containing IFN 8-h post infection. Secreted type I and type III IFN were then measured using a HEK-Blue reporter assay. We found that rotavirus infected cells in hypoxia showed a significant decrease in both type I and type III IFN secretion relative to cells in normoxia in both T84 and organoid models (Supplementary Figure S3(F-J)). Together, these findings further show that hypoxia results in a decreased IFN response to rotavirus infection in primary human IECs.
Hypoxia decreases IFN response across multiple viral stimuli
To investigate whether decreased IFN response in hypoxia is specific to rotavirus infection or conserved downstream of several different pattern recognition receptors (PRRs), T84 cells were cultured under normoxia (20% O2) or hypoxia (1% O2) and exposed to a variety of distinct innate immune stimuli. These included pathogen associated molecular patterns (PAMPs), poly I:C (viral RNA mimicry stimulating the RIG-I pathway) and diABZi (agonist for the STING pathway), as well as mammalian reovirus (MRV, a double stranded RNA enteric virus) (Figure 4). For all tested stimuli, hypoxia significantly inhibited the induction of type I (Figure 4(A)) and type III (Figure 4(B)) IFN responses, as well as ISG expression (Figure 4(C)). This decrease in IFN expression in hypoxia was validated using single-molecule fluorescent in-situ hybridization (smFISH) for IFNλ3 transcripts. Results showed that following poly I:C stimulation, the mean expression of IFNλ3 transcripts was reduced and that less cells were positive for the IFNλ3 transcripts under hypoxia as compared to normoxia (Supplementary Figure S4(A,B)). Likewise, MRV infection, poly I:C treatment, and diABZi treatment of IECs in hypoxia showed significantly less secreted type I and type III IFN relative to cells in normoxia (Supplementary Figure S3(G-H)). To broadly investigate the effect of hypoxia on the response of IECs to poly I:C treatment, RNA sequencing was performed at 8-h post poly I:C treatment (Supplementary Figure S4(C)). Principal component analysis revealed that samples clustered according to their treatment status (mock vs. poly I:C treated) as well as whether cells were cultured under hypoxic or normoxic conditions (Supplementary Figure S4(D)). Differential gene expression analysis revealed that hypoxia alters the transcriptional response cells treated with poly I:C (Supplemetanry Figure S4(E)) with a significant decrease in expression of anti-viral response genes under hypoxia compared to normoxia (Figure 4(D)). Furthermore, GSEA analysis first validated the response of cells to hypoxia (Figure 4(E)) and confirmed that exposure to hypoxia downregulates the innate IFN response generated by intestinal epithelial cells upon poly I:C treatment compared to cells cultured under normoxic conditions (Figure 4(F)). Together, these findings further support the role of hypoxia in dampening the IFN response in intestinal epithelial cells. These stimuli trigger a variety of different sensing and signaling pathways, suggesting that decreased IFN response is a hallmark of IECs under hypoxia, and is not unique to rotavirus infection. To confirm that the decreased IFN response under hypoxia is not due to a decreased expression of the PRRs responsible for sensing these pathogen triggers, PRR expression levels were measured by q-RT-PCR. Results show that PRRs displayed no significant decrease in expression levels between normoxia and hypoxia (Supplementary Figure S5(A-F)). Together, these findings suggest that hypoxia impairs the IFN response of human IECs downstream of multiple PRRs, independent of PRR expression levels. As RNA sequencing revealed the downregulation of many ISGs (Figure 2(C,D) and 4(D)), we wanted to validate that IECs in hypoxia were still able to respond to IFN. T84 cells cultured were cultured under normoxia (20% O2) or hypoxia (1% O2) for 24 h before being treated with type I and type III IFN. IECs in both oxygen conditions show comparable induction of pSTAT (Supplementary Figure S5(G)), and induction of the ISG IFIT1 (Supplementary Figure S5(H)), suggesting that IECs response to IFN is not impacted by oxygen levels. Together, these findings suggest a model in which the decreased ISG expression observed in hypoxia is in fact due to a decrease in IFN induction after exposure to viral stimuli.
Figure 4.

Downregulation of IFN response in hypoxia is conserved across immune stimuli. T84 cells were cultured for 24 hours in normoxia (20% O2) or hypoxia (1% O2) and subjected to various stimuli. T84 cells were transfected with 1 µg/well poly I:C for 8 hours, treated with 10 μM diAbzi for 8 hours, or infected with MRV for 16 hours. qRT-PCR was used to measure (A) IFNβ1, (B) IFNλ2/3, and (C) IFIT expression. (D) Heatmap showing top 50 most differentially expressed genes associated with viral response GO terms between normoxia and hypoxia (E-F) GSEA plots for poly I:C transfection showing (E) upregulation of hypoxia response genes in hypoxia and (F) downregulation of innate IFN response in hypoxia. (A-C) n ≥ 3 replicates. Significance determined by unpaired t test (normal distribution, in black) or mann-whitney (non-normal distribution, in blue) between normoxic and hypoxic conditions, ns = not significant, significant p values shown.
Hypoxia-mediated decrease of IFN in intestinal epithelial cells is responsible for the increased rotavirus replication and spread
As IFN response is known to be essential to control rotavirus infection spread.31, we hypothesized that the decreased IFN response under hypoxia is responsible for the increased spread of the virus under low oxygen culture conditions. To challenge this hypothesis, we utilized two cell lines deficient for IFN signaling: (1) T84 cells depleted of the IFN regulatory factor 3 (IRF3) which are unable to produce IFNs (IRF3 KO cells) and (2) cells depleted of both the type I and the type III IFN receptors (IFNAR/IFNLR dKO) which are unable to sense IFNs.43 The immune response of these cell lines upon rotavirus infection was evaluated by measuring the upregulation of IFNλ2/3, and IFIT1 transcript levels by q-RT-PCR. As expected, results show that cells lacking IRF3 did not induce IFNλ2/3 following rotavirus infection (Supplementary Figure S6(A)) while IFNAR/IFNLR dKO cells did produce IFNλ2/3 but failed to induce the expression of the downstream ISG IFIT1 (Supplementary Figure S6(B-C)).
To determine whether the differential IFN response under hypoxia is responsible for increased rotavirus spread, WT, IRF3 KO, and IFNAR/IFNLR dKO T84 cells were cultured under normoxia (20% O2) or hypoxia (1% O2) and infected with rotavirus. As expected, quantification of the number of rotavirus infected cells at 24- and 48-hpi revealed that IRF3 KO and IFNAR/IFNLR dKO cell lines were more permissive to infection in normoxia, displaying a higher infection burden compared to WT T84 cells (Figure 5(A-C)). However, while WT T84 cells showed increased infection under hypoxia as compared to normoxia (Figure 5(A,D)), this phenotype was lost in hypoxia both in IRF3 KO cells (Figure 5(B,E)) and in IFNAR/IFNLR dKO cells (Figure 5(C,F)). Similarly, while WT cells in hypoxia show increased viral genome content at 24 and 48 hpi (Figure 5(G)) compared to cells grown under normoxia, IRF3 KO and IFNAR/IFNLR dKO cells show no significant difference in viral genome replication between normoxia and hypoxia (Figure 5(H,I)). To confirm that the loss of hypoxia-mediated increase of rotavirus spread in IFN signaling deficient cells was not the consequence of the cells being overall more susceptible to infection, IRF3 KO and IFNAR/IFNLR dKO cells were infected with rotavirus at decreasing MOIs and viral genome replication was measured at 24 hpi by q-RT-PCR. Results show that even at lower infection levels, comparable to WT cells (Supplementary Figure S6(D)), cells lacking IFN induction (IRF3 KO) and IFN signaling (IFNAR/IFNLR dKO) did not show increased rotavirus replication in hypoxia (Supplementary Figure S6(E-F)). Together, these data support the hypothesis that differential immune response in hypoxia is essential for the increased spread of rotavirus, suggesting that hypoxia renders cells more permissive to infection in an IFN-dependent manner.
Figure 5.

Hypoxia renders IECs more susceptible to rotavirus infection through decreasing IFN induction. (A) T84 WT cells, (B) IRF3 KO T84 cells or (C) IFNAR/IFNLR dKO cells were cultured for 48 hours in normoxia (20% O2) or hypoxia (1% O2) prior to infection with rotavirus expressing UnaG at MOI 0.1 as determined in MA104 cells. (A-C) Infection was imaged in mock infected cells or at 24- and 48-hpi. 5 images per well were averaged for the number of rotavirus positive cells per confluent field of view. Representative images showing UnaG positive rotavirus infection (green), scale bar=200 μm (D-F) Quantification of rotavirus infection from A-C. (G-I) RNA was harvested at 1-, 24-, 48- hpi and qRT-PCR was used to evaluate viral gene replication for rotavirus NSP5. Relative expression was normalized to HPRT1. (A-I) n ≥ 3 replicates. Significance determined by unpaired t test (normal distribution, in black) or mann-whitney (non-normal distribution, in blue) between normoxic and hypoxic conditions, ns = not significant, significant p values shown.
Hypoxia impairs the activation of the signal transduction pathway leading to IFN production
As decreased IFN expression in IECs was observed across different innate immune stimuli under hypoxia compared to normoxia (Figure 4), we hypothesized that hypoxia is impacting a central signaling molecule critical for the production of IFNs. The signaling pathways downstream most PRRs converge on a central kinase, TANK binding kinase 1 (TBK1), that is responsible for the activation of the transcription factor IRF3 and expression of IFNs. To investigate whether the activation kinetics of TBK1 and IRF3 activation were altered under hypoxia, T84 cells were cultured under normoxia (20% O2) or hypoxia (1% O2) and infected with rotavirus. Protein samples were harvested over a time course of 4–8 h and the phosphorylation status of TBK1 and IRF3 was analyzed by western blot. While a clear phosphorylation of TBK1 and IRF3 was observed in cells under normoxic conditions, cells in hypoxia show substantially less pTBK1 and pIRF3 relative to total protein (Figure 6). To control that the loss of pTBK1 and pIRF3 is not the result of a total loss of phosphorylation activity of cells cultured under hypoxia, we measured the phosphorylation status of the focal adhesion protein paxillin (pPAX) which is known to be increased in hypoxia.51 Indeed, results confirmed that T84 cells in hypoxia showed increased phosphorylation of PAX relative to normoxia (Figure 6) suggesting that the loss of pTBK1 and pIRF3 is not the result of a total loss of phosphorylation in hypoxia. Consistent with the conserved inhibition of IFN expression across other viral and innate immune stimuli (Figure 4), decreased phosphorylation of TBK1 and IRF3 under hypoxia compared to normoxia was also observed when cells were infected with MRV (Supplementary Figure S7(A)) or were stimulated with poly I:C either via transfection (Supplementary Figure S7(B)) or electroporation (Supplementary Figure S7(C)). Together, these findings support a model in which hypoxia impacts IFN production by impairing the phosphorylation of the central signaling molecule TBK1.
Figure 6.
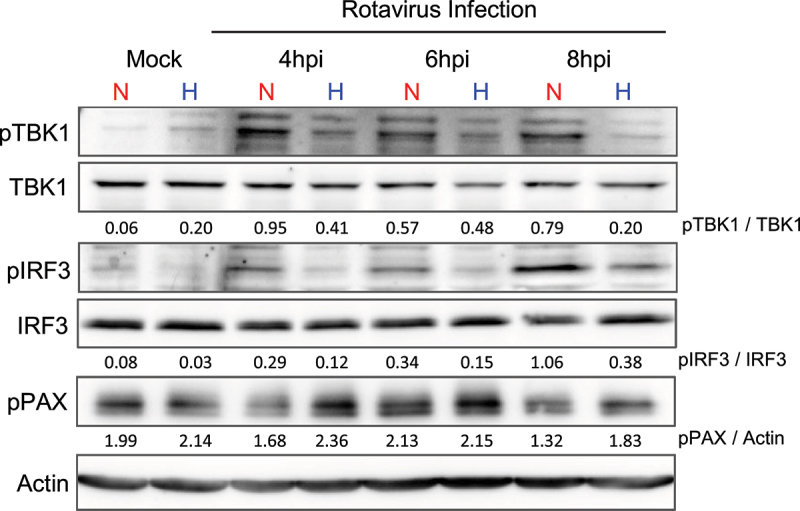
Hypoxia induces a decreased TBK1 and IRF3 activation following rotavirus infection. T84 WT cells were cultured for 24 hours in normoxia (20% O2) or hypoxia (1% O2) and infected with rotavirus expressing UnaG at MOI 0.5 as determined in MA104 cells. Cells were harvested at indicated timepoints post-infection with RIPA buffer and total TBK1, phospho-TBK1 (pTBK1), total IRF3, phospho-IRF3 (pIRF3), and phospho-paxillin (pPAX) levels were assessed by immunoblotting. Ratio of phosphorylated protein to total protein indicated on blots. Actin used as a loading control. n ≥ 3 replicates. Representative image shown. N = normoxia, H = hypoxia.
Protein phosphatase 2A plays an essential role in the hypoxia-mediated inhibition of IFN expression
As we observed a decreased phosphorylation of TBK1 under hypoxia downstream of several distinct activating pathways, we postulated that hypoxia may promote dephosphorylation of this central signaling hub. Protein phosphatase 2A (PP2A) is a broad family of protein phosphatases responsible for the dephosphorylation of a wide range of cellular targets.52 PP2A is not a single protein, but rather a family of heterotrimeric proteins composed of a highly conserved catalytic and structural domains, and one of the 15 unique regulatory subunits which confer different substrate specificity and activity.53 Recent studies have focused on PP2A as a critical regulator of host immune response and viral replication. More specifically, PP2A has been implicated in the regulation of IFN signaling through dephosphorylation of members of the signaling pathway leading to IFN production, such as IRF1 and IRF3.54–56 Similarly, PP2A has also been shown to play a role in tumor immunogenicity, with loss of PP2A resulting in activation of STING-based IFN responses.57,58 However, the role of PP2A in IFN response in hypoxia has not yet been shown. To broadly investigate the role of PP2A in hypoxia mediated inhibition of IFN, T84 cells cultured under normoxia (20% O2) or hypoxia (1% O2) were mock treated (DMSO control) or treated with 10 nM okadaic acid (OA), a well-characterized PP2A inhibitor.59 Induction of type III IFN expression upon rotavirus infection was monitored by q-RT-PCR. As previously observed (Figure 3), hypoxia inhibited IFNλ2/3 expression upon rotavirus infection in the DMSO control treated cells (Figure 7(A)). Treatment of cells with OA resulted in an overall decrease of IFN response upon rotavirus infection (Figure 7(A)). This overall decrease may be the consequence of broadly inhibiting PP2A activity, which is known to regulate a wide range of cellular functions including cell cycles.52,60 Critically, no significant difference between hypoxia and normoxia was observed in IFNλ2/3 expression between cells cultured under normoxia or hypoxia (Figure 7(A)). This suggests that PP2A may play a role in the differential IFN response under hypoxia upon rotavirus infection. To validate these findings, we generated a PP2A catalytic domain (PP2ACa) knock-down (KD) T84 cell line using a lentivirus expressing an shRNA against PP2ACa. Lentiviral transduction resulted in a ~ 50% reduction in PP2ACa expression as validated by western blot (Figure 7(B)) and q-RT-PCR for the PP2ACa gene expression (Figure 7(C)). While hypoxia inhibited IFNλ2/3 expression in the shRNA scramble control cells, PP2ACa KD cells infected with rotavirus failed to inhibit type III IFN expression under hypoxia (Figure 7(D)). Like with OA treatment, knockdown of PP2ACa also resulted in an overall decrease of IFN production in both normoxia and hypoxia. While PP2A has been reported to negatively regulate IFN signaling and therefore inhibition of PP2A could be expected to result in increased IFN levels, we suspect this overall decrease of IFN expression can be attributed to the multifarious roles of PP2A on a broad range of cellular processes, such as the induction of G2/M cell cycle arrest.55,57,58,60, which has been shown to reduce IFN production independent of direct IFN pathway regulation.61 Critically, in both OA treatment and PP2ACa KD, hypoxia failed to further inhibit IFN response relative to normoxia. Together, our findings suggest that PP2A is a critical regulator of IFN production under hypoxic conditions.
Figure 7.

Blocking PP2A activity in hypoxia rescues differential type III IFN response to rotavirus infection. (A) T84 cells were cultured for 24 hours in normoxia (20% O2) or hypoxia (1% O2). Cells were pretreated for 24 hours with DMSO control or 10 nM okadaic acid and infected with rotavirus expressing UnaG at MOI 0.25 as determined in MA104 cells in the presence of DMSO or okadaic acid. RNA was harvested at 8 hpi and qRT-PCR was performed to measure expression of IFNλ2/3. Relative expression was normalized to HPRT1. (B-D) Lentivirus transduction was used to generate a knockdown of PP2A catalytic domain (PP2ACa) in T84 cells. A scrambled (sc) shRNA was used as a control. Knockdown efficiency was measured by (B) Immunoblot for PP2ACa with actin as a loading control (representative image shown, quantification of protein relative to actin below) and (C) qRT-PCR for PP2ACa gene expression. Relative expression was normalized to HPRT1. (D) T84 scramble control and PP2ACa knockdown cells were seeded for 24 hours in normoxia (20% O2) or hypoxia (1% O2) and infected with rotavirus expressing UnaG at MOI 0.25 as determined in MA104 cells. RNA was harvested at 8 hpi and qRT-PCR was performed to measure expression of IFNλ2/3. Relative expression was normalized to HPRT1. (A-D) n ≥ 3 replicates. Significance determined by unpaired t test (normal distribution) between normoxic and hypoxic conditions, ns = not significant, significant p values shown.
PPP2R5B is required for decreased IFN response to rotavirus infection in hypoxia
While addressing the role of PP2A in regulating the immune response to rotavirus infection under hypoxia, we failed to fully knock-down PP2ACa expression in T84 cells. PP2A is a broad-spectrum phosphatase and as such, blocking the catalytic domain has broad consequences on cellular function, including a direct impact on cell cycles.62 Importantly, while blocking the activity of the catalytic domain blocked the hypoxia-mediated inhibition of IFN expression (Figure 7), we did not observe a significant differential expression of the catalytic domain PP2ACa (CA) under hypoxia (Supplementary Figure S8). This suggests that hypoxia might regulate the activity of the holoenzyme PP2A by regulating the expression levels of the regulatory subunits. The catalytic activity of PP2A has been shown to be directly associated with its regulatory subunits as the presence of a particular subunit is critical in determining the function of PP2A. To address whether some PP2A subunits were differentially expressed under hypoxia, T84 cells were cultured under normoxia (20% O2) or hypoxia (1% O2), and regulatory subunits expression was determined by q-RT-PCR (Figure 8(A)). Only the regulatory subunit PPP2R5B was found to be differentially expressed after 48 h exposure to hypoxia. Increased expression of PPP2R5B in hypoxia was confirmed at the protein level by western blot (Figure 8(B)). To investigate the role of PPP2R5B in the hypoxia-mediated reduction of the IFN response, we generated a PPP2R5B knockout in T84 cells using CRISPR/Cas9-based approaches. The loss of PPP2R5B was confirmed by western blot (Figure 8(B)). To evaluate if the loss of PPP2R5B impacts IFN expression upon rotavirus infection under hypoxia, WT T84 cells and PPP2R5B KO T84 cells were cultured under normoxia (20% O2) or hypoxia (1% O2) and infected with rotavirus. While WT T84 cells showed inhibition of IFNλ2/3 expression in hypoxia 8 h post rotavirus infection, PPP2R5B KO cells showed no significant difference in IFNλ2/3 expression between normoxia and hypoxia conditions (Figure 8(C)). While the broad inhibition of PP2A activity through catalytic domain knockdown or OA treatment (Figure 7) impacted IFN response in both normoxia and hypoxia, knockout of PPP2R5B primarily impacted IFN response in hypoxia while maintaining the IFN response in normoxia, suggesting a more specific role for PPP2R5B in IFN regulation in hypoxia. To further confirm the role of PPP2R5B in the regulation of IFN expression in hypoxia, WT and PPP2R5B KO cells were infected with rotavirus and the phosphorylation status of TBK1 was assessed at 8 hpi (Figure 8(D)). While WT T84 cells showed a decrease in pTBK1 under hypoxia as compared to normoxia, PPP2R5B KO cells showed no inhibition of pTBK1 in hypoxia relative to normoxia (Figure 8(D)). To determine whether PPP2R5B was involved in IFN inhibition across viral stimuli, WT T84 cells and PPP2R5B KO T84 cells were cultured under normoxia (20% O2) or hypoxia (1% O2) and infected with another enteric virus, mammalian reovirus (MRV). Again, while WT T84 cells showed inhibition of IFNλ2/3 in hypoxia, PPP2R5B KO cells were able to induce robust IFN responses in both normoxia and hypoxia (Figure 8(E)). Together, this data shows that PPP2R5B is essential for the hypoxia-mediated inhibition of IFN in IECs.
Figure 8.

PPP2R5B is essential for inhibition of IFN response in hypoxia. (A) Expression of PP2A subunits was measured by qRT-PCR in WT T84 cells after 48 hours in normoxia (20% O2) or hypoxia (1% O2). Expression in hypoxia plotted relative to normoxia. (B) Representative western blot of PPP2R5B protein levels in WT or PPP2R5B KO T84 cells following 48 hours of incubation in normoxia (20% O2) or hypoxia (1% O2), actin is used as a loading control and the quantification of protein relative to actin is shown below. (C) T84 WT and PPP2R5B KO cells were seeded for 24 hours in normoxia (20% O2) or hypoxia (1% O2) and infected with rotavirus expressing UnaG at MOI 0.25 as determined in MA104 cells. RNA was harvested at 8 hpi and qRT-PCR was performed to measure expression of IFNλ2/3. Relative expression was normalized to HPRT1. (D) T84 WT and PPP2R5B KO cells were seeded for 24 hours in normoxia (20% O2) or hypoxia (1% O2) prior to infection with rotavirus. Cells were harvested at indicated timepoints post-infection and total TBK1 and phopspho-TBK1 (pTBK1) levels were assessed by immunoblotting. Ratio of pTBK1/TBK1 indicated on blot. Actin is used as a loading control, representative blot shown. (E) WT T84 and PPP2R5B knockout T84 cells were seeded in normoxia (20% O2) or hypoxia (1% O2) and infected with MRV. RNA was harvested at 16 hpi and qRT-PCR was performed to measure expression of IFNλ2/3. Relative expression was normalized to HPRT1. (F) Representative western blot of PPP2R5B expression in WT, PPP2R5B KO, and PPP2R5B KO + PPP2R5B rescue cell lines, actin is used as a loading control and the quantification of protein relative to actin is shown below (G) WT T84, PPP2R5B KO, and PPP2R5B KO + PPP2R5B cells were seeded for 24 hours in normoxia (20% O2) or hypoxia (1% O2) and infected with rotavirus. RNA was harvested at 8 hpi and qRT-PCR was performed to measure expression of IFNλ2/3. Relative expression was normalized to HPRT1. (A-G) n ≥ 3 replicates. Significance determined by unpaired t test (normal distribution, in black) or mann-whitney (non-normal distribution, in blue) between normoxic and hypoxic conditions, ns = not significant, significant p values shown. N = normoxia; H = hypoxia.
To confirm the importance of PPP2R5B expression in hypoxia-mediated inhibition of IFN expression, a PPP2R5B overexpression lentivirus was used to rescue expression in the PPP2R5B KO cells. Expression of PPP2R5B in rescue cell lines (PPP2R5B KO + R5B T84 cells) was confirmed by western blot (Figure 8(F)). WT, PPP2R5B KO, and PPP2R5B KO + R5B T84 cells were cultured under normoxia (20% O2) or hypoxia (1% O2) and infected with rotavirus. Unlike PPP2R5B KO cells, which showed similar induction of IFNλ2/3 in both normoxia and hypoxia, PPP2R5B KO + R5B cells exhibited a robust inhibition of IFNλ2/3 response in hypoxia, comparable to WT T84 cells (Figure 8(G)). These results validate the role of PPP2R5B in IFN regulation in hypoxia, underscoring its role in inhibition of innate immune responses in hypoxia.
Loss of PPP2R5B results in loss of increased rotavirus spread under hypoxia in IECs
As increased rotavirus infection in hypoxia appears to be dependent on decreased IFN response (Figure 5), we hypothesized that loss of PPP2R5B, which in turn results in robust IFN responses in hypoxia, would block the proviral effects of hypoxia on IECs. WT and PPP2R5B KO cells were grown under normoxia (20% O2) or hypoxia (1% O2) prior to infection with rotavirus. Fluorescence microscopy was used to evaluate virus infection at 24- and 48-hpi. While WT T84 cells showed increased rotavirus infection in hypoxia relative to normoxia (Figure 9(A,C)), PPP2R5B KO cells, which lack differential immune responses between normoxia and hypoxia, showed similar rotavirus infection at 24- and 48-hpi (Figure 9(B,D)). Similarly, q-RT-PCR for viral genome showed that WT cells in hypoxia have an increased viral genome content relative to normoxia while PPP2R5B KO cells show no significant difference between the normoxic and hypoxic conditions (Figure 9(E,F)). Interestingly, the PPP2R5B KO cells appeared to be more susceptible to infection in normoxia than WT T84 cells (Figure 9(C,D)). To confirm that the loss of hypoxia-mediated increase of rotavirus spread was not the consequence of this increased susceptibility, PPP2R5B KO cells were infected with multiple MOIs, and viral genome replication was measured at 24 hpi by q-RT-PCR. Results show that even with decreased levels of infection, PPP2R5B KO cells do not show the increased infection in hypoxia observed in WT cells (Figure 9(G)). Finally, supernatants harvested at 48hpi confirm that PPP2R5B KO cells did not produce more de novo infectious rotavirus particles in hypoxia, contrary to what was seen in WT cells (Figure 9(H)). Together, these data show an important role for PPP2R5B in mediating the hypoxia driven dampening of IFN rendering cells more permissive to rotavirus infection.
Figure 9.

Loss of PPP2R5B results in loss of increased rotavirus spread under hypoxia. (A) T84 WT and (B) PPP2R5B KO cells were cultured for 48 hours in normoxia (20% O2) or hypoxia (1% O2) and infected with rotavirus expressing UnaG at MOI 0.1 as determined in MA104 cells. Infection was imaged at 1-, 24-, 48-hpi. 5 images per well were averaged for the number of rotavirus positive cells per confluent field of view. (A-B) Representative images showing UnaG positive rotavirus infection (green), scale bar = 200 μm. (C-D) Quantification of A-B. (E-F) qRT-PCR for viral gene NSP5 was performed at 1-, 8-, 24-, and 48-hpi. HPRT1 is used as a house keeping gene. (G) PPP2R5B KO cells were infected with rotavirus at indicated MOI. RNA was harvested at 24 hpi and q-RT-PCR for viral gene NSP5 was performed. Relative expression was normalized to HPRT1. (H) Supernatants were harvested at 1- and 48-hpi, and a plaque assay was performed in MA104 cells. Values shown are relative to viral input. (A-H) n ≥ 3 replicates. Significance determined by unpaired t test (normal distribution, in black) or mann-whitney (non-normal distribution, in blue) between normoxic and hypoxic conditions, ns = not significant, significant p values shown.
Altogether, our findings show that hypoxia renders IECs more permissive to rotavirus virus infection, replication, and spread by inhibiting the IFN response to virus infection through the activity of the PP2A subunit PPP2R5B. This represents a novel pro-viral mechanism for physiological hypoxia within the context of the gut.
Discussion
Investigating virus infection under physiological conditions is crucial to understanding the specific mechanisms which control host–pathogen interactions. Here, we demonstrate that hypoxia, which is known to be ever present in the intestinal tract, renders IECs more permissive to virus infection, leading to increased rotavirus replication and de novo virus particle production. We determined that hypoxia promoted virus infection due to its dampening of the intrinsic innate immune response, through its upregulation of the protein phosphatase PP2A regulatory subunit PPP25RB. Increase in PPP25RB leads to decreased TBK1 and IRF3 phosphorylation and subsequently decreased IFN production. Together, these results show that hypoxia naturally present in the gastrointestinal tract can act as a pro-viral factor by inducing an immunosuppressive environment (Figure 10).
Figure 10.

Hypoxia renders IECs more permissive to rotavirus infection through PPP2R5B mediated inhibition of IFN. IECs in normoxia produce a robust antiviral IFN response, leading to protection against rotavirus infection, while cells in hypoxia show decreased IFN, and an increase in rotavirus infection and spread. This inhibition is mediated by the increased expression of PPP2R5B in hypoxia, which inhibits production of IFN in hypoxic cells.
Rotavirus has been found to preferentially infect mature enterocytes which are present at the top and middle of the villi structures. Rotavirus infection leads to destruction of these cells causing a decrease in absorptive potential and disease symptoms such as diarrhea.5,63 It has been proposed that the discrete tropism of rotavirus infection to the villus tips could be due to the expression of cellular factors which are required for replication of the virus; however, identification of these specific factors remains elusive.64 Our study shows that hypoxia is a previously undescribed pro-viral factor impacting rotavirus infection in the gut. Given that enterocytes located at the tip of the villi within the intestinal epithelium is unique in their exposure to the low oxygen environment of the gut lumen, it is possible that the spatial restriction of rotavirus infection to the villus tip is mediated by hypoxia and its associated dampening of immune response, creating a more favorable environment for rotavirus replication. As such, incorporating hypoxia into future studies may allow us to disentangle the factors determining the unique spatial tropism of rotavirus infection.
Previous studies of tissues that are commonly exposed to low oxygen levels (e.g. liver, oral cavity) have generally reported hypoxia to be pro-viral, enhancing virus production through mechanisms such as lytic reactivation or changes to cellular metabolism (i.e. increased glycolysis).11,12,20 Our findings are consistent with these observations, indicating that hypoxia promotes rotavirus replication in IECs. While hypoxia is known to shift intestinal cellular metabolism toward glycolysis, our results suggest that the pro-viral effect observed in rotavirus infection of IECs is primarily due to the inhibition of the type III IFN response.65 The lack of increased virus spread in IFN-deficient cell lines (IRF3 KO and IFNAR/IFNLR dKO cells) under hypoxic conditions further supports the key role of IFN in this regulation, rather than metabolic changes alone. Furthermore, RNA sequencing of cells in normoxia and hypoxia shows that hypoxia results in a robust decrease in innate IFN-related genes, suggesting a specific role of hypoxia in regulating anti-viral responses.
We found that hypoxia mediates the inhibition of IFN across multiple viral stimuli, supporting a model in which hypoxia globally impacts the intrinsic innate immune response of IECs. The ability of hypoxia to downregulate innate immune responses has also been reported across other cell types of non-intestinal origin. For example, in proximal tubular cells, hypoxia, or the use of HIF stabilizer CoCl2, suppresses poly I:C induced expression of type I IFN and several key ISGs.66 Likewise, in airway epithelial cells, hypoxia specifically reduced inflammatory cytokine secretion in a HIF-dependent manner downstream of several toll-like receptor pathways.67 In iPSC-derived macrophages, hypoxia decreased antiviral ISG expression after poly I:C treatment or treatment with type I IFN, despite no change in IFN receptor (IFNAR) expression.37 In this study, iPSCs in hypoxia showed increased infection by Zika virus, providing further evidence for hypoxia mediated immune dampening as a pro-viral factor.37 While PP2A-mediated inhibition of TBK1 phosphorylation appears to be the driver of the hypoxia-mediated dampening of immune response in IECs, hypoxia likely impacts IFN responses through distinct mechanisms in different cell types. Together with previous studies, our findings underscore how hypoxia shapes host–pathogen interactions by modulating cellular innate immune responses.
Type III IFNs are known to be essential to control rotavirus infection, and for the protection of mucosal surfaces.29,31,32 However, while IFN is generally known for its antiviral properties, excessive cytokine response to viral infection can be harmful to the host. High levels of type III IFN have been detected in patients with Crohn’s disease, correlated with severe inflammation and shown to decrease the restorative Paneth cells.68 Likewise, exposure to exogenous type III IFN has been shown to impede epithelial repair within the lungs after viral infection.69 However, these damaging effects of type III IFN have been proposed to be due to chronic exposure to the cytokine.70 As such, it is possible that hypoxia may serve as a physiological regulator of immune homeostasis in the gut by attenuating epithelial cell responses to commensal microbiota and other antigens present in the gut lumen. However, this dampened immune state could increase the vulnerability of villus-tip epithelial cells to enteric pathogens. Within the epithelium, intestinal stem cells reside in the highly vascularized crypt regions, which maintain relatively higher oxygen conditions. As these cells proliferate and differentiate, they migrate toward the villus tip, where they encounter progressively hypoxic conditions from the gut lumen. Based on our findings that hypoxia suppresses epithelial immune responses, we propose that this oxygen gradient serves a dual purpose: maintaining robust immune surveillance in the stem cell niche under normoxic conditions while promoting immune tolerance in differentiated cells at the hypoxic villus tip. This oxygen-dependent immune regulation thus represents a double-edged sword: while it prevents chronic inflammation against beneficial microbiota and other luminal contents, it may simultaneously increase susceptibility to enteric pathogens in these terminal enterocytes.
A key finding in our study is the identification of the protein phosphatase subunit PPP2R5B as an essential regulator of hypoxia mediated inhibition of IFN. This adds PPP2R5B to a growing list of PP2A subunits which play essential roles in host–pathogen interactions. Due to the wide substrate specificity of the different PP2A subunits, PP2A has been implicated in the pathogenesis of a variety of different viruses; either being targeted by the virus (e.g. degraded by HIV-1 Vif for cell cycle arrest) or acting directly on the virus (e.g. dephosphorylating VP30 in flavivirus replication).56,62,71,72 Viruses have also been shown to recruit PP2A subunits to dephosphorylate key host antiviral responses. African swine fever virus protein p17 recruits the PP2A subunit PPP2R1A, leading to the dephosphorylation of STING-bound IRF3 and a decrease in type I IFN production.56 On the host side, the PP2A subunit STRN4 targets dephosphorylation of the Hippo kinase MST1/2, antagonizing STING activation and IFN production.55 While PPP2R5B has previously been shown to play a critical role in the development of insulin resistance, our findings extend the role of this subunit into the regulation of TBK1 activation after virus infection in hypoxia.73 We are the first to show that hypoxia upregulates PPP2R5B expression at both the transcriptional and protein levels in IECs. Given that PPP2R5B impacts the host immune response in the presence of hypoxia, this subunit could broadly influence susceptibility to any enteric pathogens controlled by IFN, placing PPP2R5B as an essential player in host–pathogen interactions in the gut.
In conclusion, we demonstrate that hypoxia induces the suppression of IFN responses through the PPP2R5B-mediated regulation of TBK1 activation. Future research to determine how hypoxia induces the increased expression of PPP2R5B found in the current study, and to address the molecular basis for the subsequent dephosphorylation of the signaling hub TBK1, will provide more insight into how hypoxia changes the susceptibility of IECs to viral infection. Importantly, our findings underscore the necessity of including physiological conditions into traditional cell culture models. Continuing to incorporate hypoxia into our models will allow us to elucidate the broader implications of oxygen-dependent immune regulation within IECs when in contact with diverse enteric pathogens.
Supplementary Material
Acknowledgments
We thank the Boulant and Stanifer lab members for their constructive discussions and for proofreading this manuscript.
Funding Statement
SB and MS are supported by the UF College of Medicine start-up package funds. Research reported in this publication was supported by the National Institute of Allergy and Infectious Diseases (NIAID) of the National Institutes of Health [award number 1R01AI185510] as well as the Deutsche Forschungsgemeinschaft (DFG) by the projects SFB 1129 [DFG 240245660]. ZMU was funded by the German Research Foundation [Deutsche Forschungsgemeinschaft, project number 521582111]. SJ was funded by the NIH NIAID [T32AI007110]. The funders had no role in the study design, data collection, analysis, decision to publish or preparation of the manuscript.
Disclosure statement
No potential conflict of interest was reported by the author(s).
Supplemental data
Supplemental data for this article can be accessed online at https://doi.org/10.1080/19490976.2025.2560593
References
- 1.König J, Wells J, Cani PD, García-Ródenas CL, MacDonald T, Mercenier A, Whyte J, Troost F, Brummer R-J.. Human intestinal barrier function in health and disease. Clin Transl Gastroenterol. 2016;7(10):e196. doi: 10.1038/ctg.2016.54. [DOI] [PMC free article] [PubMed] [Google Scholar]
- 2.Soderholm AT, Pedicord VA.. Intestinal epithelial cells: at the interface of the microbiota and mucosal immunity. Immunology. 2019;158(4):267–29. doi: 10.1111/imm.13117. [DOI] [PMC free article] [PubMed] [Google Scholar]
- 3.Ramig RF. Pathogenesis of intestinal and systemic rotavirus infection. J Virol. 2004;78(19):10213–10220. doi: 10.1128/JVI.78.19.10213-10220.2004. [DOI] [PMC free article] [PubMed] [Google Scholar]
- 4.Amimo JO, Raev SA, Chepngeno J, Mainga AO, Guo Y, Saif L, Vlasova AN. Rotavirus interactions with host intestinal epithelial cells. Front Immunol. 2021;12:793841. doi: 10.3389/fimmu.2021.793841. [DOI] [PMC free article] [PubMed] [Google Scholar]
- 5.Crawford SE, Ramani S, Tate JE, Parashar UD, Svensson L, Hagbom M, Franco MA, Greenberg HB, O’Ryan M, Kang G, et al. Rotavirus infection. Nat Rev Dis Primer. 2017;3(1):17083. doi: 10.1038/nrdp.2017.83. [DOI] [PMC free article] [PubMed] [Google Scholar]
- 6.Jalili-Firoozinezhad S, Gazzaniga FS, Calamari EL, Camacho DM, Fadel CW, Bein A, Swenor B, Nestor B, Cronce MJ, Tovaglieri A, et al. A complex human gut microbiome cultured in an anaerobic intestine-on-a-chip. Nat Biomed Eng. 2019;3(7):520–531. doi: 10.1038/s41551-019-0397-0. [DOI] [PMC free article] [PubMed] [Google Scholar]
- 7.Fisher EM, Khan M, Salisbury R, Kuppusamy P. Noninvasive monitoring of small intestinal oxygen in a rat model of chronic mesenteric ischemia. Cell Biochem Biophys. 2013;67(2):451–459. doi: 10.1007/s12013-013-9611-y. [DOI] [PMC free article] [PubMed] [Google Scholar]
- 8.Albenberg L, Esipova TV, Judge CP, Bittinger K, Chen J, Laughlin A, Grunberg S, Baldassano RN, Lewis JD, Li H, et al. Correlation between intraluminal oxygen gradient and radial partitioning of intestinal microbiota. Gastroenterology. 2014;147(5):1055–1063.e8. doi: 10.1053/j.gastro.2014.07.020. [DOI] [PMC free article] [PubMed] [Google Scholar]
- 9.Chen L-F, Cai J-X, Zhang J-J, Tang Y-J, Chen J-Y, Xiong S, Li Y-L, Zhang H, Liu Z, Li M-M, et al. Respiratory syncytial virus co-opts hypoxia-inducible factor-1α-mediated glycolysis to favor the production of infectious virus. mBio. 2023;14(5):e02110–23. doi: 10.1128/mbio.02110-23. [DOI] [PMC free article] [PubMed] [Google Scholar]
- 10.Zhuang X, Gallo G, Sharma P, Ha J, Magri A, Borrmann H, Harris JM, Tsukuda S, Bentley E, Kirby A, et al. Hypoxia inducible factors inhibit respiratory syncytial virus infection by modulation of nucleolin expression. iScience. 2024;27(1):108763. doi: 10.1016/j.isci.2023.108763. [DOI] [PMC free article] [PubMed] [Google Scholar]
- 11.Frakolaki E, Kaimou P, Moraiti M, Kalliampakou KI, Karampetsou K, Dotsika E, Liakos P, Vassilacopoulou D, Mavromara P, Bartenschlager R, et al. The role of tissue oxygen tension in dengue virus replication. Cells. 2018;7(12):241. doi: 10.3390/cells7120241. [DOI] [PMC free article] [PubMed] [Google Scholar]
- 12.Vassilaki N, Kalliampakou KI, Kotta-Loizou I, Befani C, Liakos P, Simos G, Mentis AF, Kalliaropoulos A, Doumba PP, Smirlis D, et al. Low oxygen tension enhances hepatitis C virus replication. J Virol. 2013;87(5):2935–2948. doi: 10.1128/JVI.02534-12. [DOI] [PMC free article] [PubMed] [Google Scholar]
- 13.Wing PAC, Keeley TP, Zhuang X, Lee JY, Prange-Barczynska M, Tsukuda S, Morgan SB, Harding AC, Argles ILA, Kurlekar S, et al. Hypoxic and pharmacological activation of HIF inhibits SARS-CoV-2 infection of lung epithelial cells. Cell Rep. 2021;35(3):109020. doi: 10.1016/j.celrep.2021.109020. [DOI] [PMC free article] [PubMed] [Google Scholar]
- 14.Wing PAC, Prange-Barczynska M, Cross A, Crotta S, Orbegozo Rubio C, Cheng X, Harris JM, Zhuang X, Johnson RL, Ryan KA, et al. Hypoxia inducible factors regulate infectious SARS-CoV-2, epithelial damage and respiratory symptoms in a hamster COVID-19 model. PLOS Pathog. 2022;18(9):e1010807. doi: 10.1371/journal.ppat.1010807. [DOI] [PMC free article] [PubMed] [Google Scholar]
- 15.Sturrock A, Zimmerman E, Helms M, Liou TG, Paine R. Hypoxia induces expression of angiotensin‐converting enzyme II in alveolar epithelial cells: implications for the pathogenesis of acute lung injury in COVID‐19. Physiol Rep. 2021;9(9). doi: 10.14814/phy2.14854. [DOI] [PMC free article] [PubMed] [Google Scholar]
- 16.Jiang J-H, Wang N, Li A, Liao W-T, Pan Z-G, Mai S-J, Li D-J, Zeng M-S, Wen J-M, Zeng Y-X. Hypoxia can contribute to the induction of the Epstein-Barr virus (EBV) lytic cycle. J Clin Virol. 2006;37(2):98–103. doi: 10.1016/j.jcv.2006.06.013. [DOI] [PubMed] [Google Scholar]
- 17.Kondo S, Seo SY, Yoshizaki T, Wakisaka N, Furukawa M, Joab I, Jang KL, Pagano JS. Ebv latent membrane protein 1 up-regulates hypoxia-inducible factor 1α through Siah1-mediated down-regulation of prolyl hydroxylases 1 and 3 in nasopharyngeal epithelial cells. Cancer Res. 2006;66(20):9870–9877. doi: 10.1158/0008-5472.CAN-06-1679. [DOI] [PubMed] [Google Scholar]
- 18.Kraus RJ, Yu X, Cordes BLA, Sathiamoorthi S, Iempridee T, Nawandar DM, Ma S, Romero-Masters JC, McChesney KG, Lin Z, et al. Hypoxia-inducible factor-1α plays roles in Epstein-Barr virus’s natural life cycle and tumorigenesis by inducing lytic infection through direct binding to the immediate-early BZLF1 gene promoter. PLOS Pathog. 2017;13(6):e1006404. doi: 10.1371/journal.ppat.1006404. [DOI] [PMC free article] [PubMed] [Google Scholar]
- 19.Cai Q, Lan K, Verma SC, Si H, Lin D, Robertson ES. Kaposi’s sarcoma-associated herpesvirus latent protein LANA interacts with HIF-1α to upregulate RTA expression during hypoxia: latency control under low oxygen conditions. J Virol. 2006;80(16):7965–7975. doi: 10.1128/JVI.00689-06. [DOI] [PMC free article] [PubMed] [Google Scholar]
- 20.Lee S-C, Naik NG, Tombácz D, Gulyás G, Kakuk B, Boldogkői Z, Hall K, Papp B, Boulant S, Toth Z, et al. Hypoxia and HIF-1α promote lytic de novo KSHV infection. J virol. 2023;97(11):e00972–23. doi: 10.1128/jvi.00972-23. [DOI] [PMC free article] [PubMed] [Google Scholar]
- 21.Carroll PA, Kenerson HL, Yeung RS, Lagunoff M. Latent Kaposi’s sarcoma-associated herpesvirus infection of endothelial cells activates hypoxia-induced factors. J Virol. 2006;80(21):10802–10812. doi: 10.1128/JVI.00673-06. [DOI] [PMC free article] [PubMed] [Google Scholar]
- 22.Guo X, Zhu Z, Zhang W, Meng X, Zhu Y, Han P, Zhou X, Hu Y, Wang R. Nuclear translocation of HIF-1α induced by influenza A (H1N1) infection is critical to the production of proinflammatory cytokines: HIF-1α nuclear translocation induced by H1N1. Emerg Microbes Infect. 2017;6(1):1–8. doi: 10.1038/emi.2017.21. [DOI] [PMC free article] [PubMed] [Google Scholar]
- 23.Zhao C, Chen J, Cheng L, Xu K, Yang Y, Su X. Deficiency of HIF-1α enhances influenza A virus replication by promoting autophagy in alveolar type II epithelial cells. Emerg Microbes Infect. 2020;9(1):691–706. doi: 10.1080/22221751.2020.1742585. [DOI] [PMC free article] [PubMed] [Google Scholar]
- 24.Broquet AH, Hirata Y, McAllister CS, Kagnoff MF. Rig-I/MDA5/MAVS are required to signal a protective IFN response in rotavirus-infected intestinal epithelium. The J Immunol. 2011;186(3):1618–1626. doi: 10.4049/jimmunol.1002862. [DOI] [PubMed] [Google Scholar]
- 25.Sen A, Pruijssers AJ, Dermody TS, García-Sastre A, Greenberg HB. The early interferon response to rotavirus is regulated by PKR and depends on MAVS/IPS-1, RIG-I, MDA-5, and IRF3. J Virol. 2011;85(8):3717–3732. doi: 10.1128/JVI.02634-10. [DOI] [PMC free article] [PubMed] [Google Scholar]
- 26.Pott J, Stockinger S, Torow N, Smoczek A, Lindner C, McInerney G, Bäckhed F, Baumann U, Pabst O, Bleich A, et al. Age-dependent TLR3 expression of the intestinal epithelium contributes to rotavirus susceptibility. PLOS Pathog. 2012;8(5):e1002670. doi: 10.1371/journal.ppat.1002670. [DOI] [PMC free article] [PubMed] [Google Scholar]
- 27.Isaacs A, Lindenmann J. Virus interference. I. The interferon. J Interferon Res. 1987;7(5):429–438. doi: 10.1089/jir.1987.7.429. [DOI] [PubMed] [Google Scholar]
- 28.Lin J-D, Feng N, Sen A, Balan M, Tseng H-C, McElrath C, Smirnov SV, Peng J, Yasukawa LL, Durbin RK, et al. Distinct roles of type I and type III interferons in intestinal immunity to homologous and heterologous rotavirus infections. PLOS Pathog. 2016;12(4):e1005600. doi: 10.1371/journal.ppat.1005600. [DOI] [PMC free article] [PubMed] [Google Scholar]
- 29.Stanifer ML, Guo C, Doldan P, Boulant S. Importance of type I and III interferons at respiratory and intestinal barrier surfaces. Front Immunol. 2020;11:608645. doi: 10.3389/fimmu.2020.608645. [DOI] [PMC free article] [PubMed] [Google Scholar]
- 30.Sommereyns C, Paul S, Staeheli P, Michiels T, Buchmeier MJ. Ifn-lambda (IFN-λ) is expressed in a tissue-dependent fashion and primarily acts on epithelial cells in vivo. PLOS Pathog. 2008;4(3):e1000017. doi: 10.1371/journal.ppat.1000017. [DOI] [PMC free article] [PubMed] [Google Scholar]
- 31.Doldan P, Dai J, Metz-Zumaran C, Patton JT, Stanifer ML, Boulant S. Type III and not type I interferons efficiently prevent the spread of rotavirus in human intestinal epithelial cells. J Virol. 2022;96(17):e00706–22. doi: 10.1128/jvi.00706-22. [DOI] [PMC free article] [PubMed] [Google Scholar]
- 32.Hernández PP, Mahlakõiv T, Yang I, Schwierzeck V, Nguyen N, Guendel F, Gronke K, Ryffel B, Hölscher C, Dumoutier L, et al. Interferon-λ and interleukin 22 act synergistically for the induction of interferon-stimulated genes and control of rotavirus infection. Nat Immunol. 2015;16(7):698–707. doi: 10.1038/ni.3180. [DOI] [PMC free article] [PubMed] [Google Scholar]
- 33.Pott J, Mahlakõiv T, Mordstein M, Duerr CU, Michiels T, Stockinger S, Staeheli P, Hornef MW. Ifn-λ determines the intestinal epithelial antiviral host defense. Proc Natl Acad Sci. 2011;108(19):7944–7949. doi: 10.1073/pnas.1100552108. [DOI] [PMC free article] [PubMed] [Google Scholar]
- 34.Saxena K, Simon LM, Zeng XL, Blutt SE, Crawford SE, Sastri NP, Karandikar UC, Ajami NJ, Zachos NC, Kovbasnjuk O, et al. A paradox of transcriptional and functional innate interferon responses of human intestinal enteroids to enteric virus infection. Proc Natl Acad Sci. 2017;114(4). doi: 10.1073/pnas.1615422114. [DOI] [PMC free article] [PubMed] [Google Scholar]
- 35.Miar A, Arnaiz E, Bridges E, Beedie S, Cribbs AP, Downes DJ, Beagrie RA, Rehwinkel J, Harris AL. Hypoxia induces transcriptional and translational downregulation of the type I IFN pathway in multiple cancer cell types. Cancer Res. 2020;80(23):5245–5256. doi: 10.1158/0008-5472.CAN-19-2306. [DOI] [PMC free article] [PubMed] [Google Scholar]
- 36.Peng T, Du S-Y, Son M, Diamond B. HIF-1α is a negative regulator of interferon regulatory factors: implications for interferon production by hypoxic monocytes. Proc Natl Acad Sci. 2021;118(26):e2106017118. doi: 10.1073/pnas.2106017118. [DOI] [PMC free article] [PubMed] [Google Scholar]
- 37.Schilling M, Vaughan-Jackson A, James W, McKeating JA. Hypoxia dampens innate immune signalling at early time points and increases Zika virus RNA levels in iPSC-derived macrophages. J Gen Virol. 2023;104(8). doi: 10.1099/jgv.0.001885. [DOI] [PMC free article] [PubMed] [Google Scholar]
- 38.De Luna N, Suárez-Calvet X, Lleixà C, Diaz-Manera J, Olivé M, Illa I, Gallardo E. Hypoxia triggers IFN-I production in muscle: implications in dermatomyositis. Sci Rep. 2017;7(1):8595. doi: 10.1038/s41598-017-09309-8. [DOI] [PMC free article] [PubMed] [Google Scholar]
- 39.Hwang IIL, Watson IR, Der SD, Ohh M. Loss of VHL confers hypoxia-inducible factor (HIF)-dependent resistance to vesicular stomatitis virus: role of HIF in antiviral response. J Virol. 2006;80(21):10712. doi: 10.1128/JVI.01014-06. [DOI] [PMC free article] [PubMed] [Google Scholar]
- 40.Sato T, Clevers H. Growing self-organizing mini-guts from a single intestinal stem cell: mechanism and applications. Science. 2013;340(6137):1190–1194. doi: 10.1126/science.1234852. [DOI] [PubMed] [Google Scholar]
- 41.Sablina AA, Hector M, Colpaert N, Hahn WC. Identification of PP2A complexes and pathways involved in cell transformation. Cancer Res. 2010;70(24):10474–10484. doi: 10.1158/0008-5472.CAN-10-2855. [DOI] [PMC free article] [PubMed] [Google Scholar]
- 42.Seeling JM, Miller JR, Gil R, Moon RT, White R, Virshup DM. Regulation of β-catenin signaling by the B56 subunit of protein phosphatase 2A. Science. 1999;283(5410):2089–2091. doi: 10.1126/science.283.5410.2089. [DOI] [PubMed] [Google Scholar]
- 43.Pervolaraki K, Stanifer ML, Münchau S, Renn LA, Albrecht D, Kurzhals S, Senís E, Grimm D, Schröder-Braunstein J, Rabin RL, et al. Type I and type III interferons display different dependency on mitogen-activated protein kinases to mount an antiviral state in the human gut. Front Immunol. 2017;8:459. doi: 10.3389/fimmu.2017.00459. [DOI] [PMC free article] [PubMed] [Google Scholar]
- 44.Philip AA, Perry JL, Eaton HE, Shmulevitz M, Hyser JM, Patton JT. Generation of recombinant rotavirus expressing NSP3-UnaG fusion protein by a simplified reverse genetics system. J Virol. 2019;93(24):e01616. doi: 10.1128/JVI.01616-19. [DOI] [PMC free article] [PubMed] [Google Scholar]
- 45.Arnold MM, Barro M, Patton JT. Rotavirus NSP1 mediates degradation of interferon regulatory factors through targeting of the dimerization domain. J virol. 2013;87(17):9813–9821. doi: 10.1128/JVI.01146-13. [DOI] [PMC free article] [PubMed] [Google Scholar]
- 46.Arnold M, Patton JT, McDonald SM. Culturing, storage, and quantification of rotaviruses. Curr Protoc Microbiol. 2009;15(1):C.15.3.1–C.15.3.24. doi: 10.1002/9780471729259.mc15c03s15. [DOI] [PMC free article] [PubMed] [Google Scholar]
- 47.Cusic R, Watkins JM, Burke JM. Single-cell analysis of RNase L‐mediated mRNA decay. In: Methods in enzymology. Vol. 692. Elsevier; 2023. p. 157–175 doi: 10.1016/bs.mie.2023.04.016. [DOI] [PubMed] [Google Scholar]
- 48.Love MI, Huber W, Anders S. Moderated estimation of fold change and dispersion for RNA-seq data with DESeq2. Genome Biol. 2014;15(12):550. doi: 10.1186/s13059-014-0550-8. [DOI] [PMC free article] [PubMed] [Google Scholar]
- 49.Yu G, Wang L-G, Han Y, He Q-Y. ClusterProfiler: an R package for comparing biological themes among gene clusters. Omics J Integr Biol. 2012;16(5):284–287. doi: 10.1089/omi.2011.0118. [DOI] [PMC free article] [PubMed] [Google Scholar]
- 50.Erapaneedi R, Belousov VV, Schäfers M, Kiefer F. A novel family of fluorescent hypoxia sensors reveal strong heterogeneity in tumor hypoxia at the cellular level. The EMBO J. 2016;35(1):102–113. doi: 10.15252/embj.201592775. [DOI] [PMC free article] [PubMed] [Google Scholar]
- 51.Nguyen TMH, Lai Y-S, Chen Y-C, Lin T-C, Nguyen NT, Chiu W-T. Hypoxia-induced YAP activation and focal adhesion turnover to promote cell migration in mesenchymal TNBC cells. Cancer Med. 2023;12(8):9723–9737. doi: 10.1002/cam4.5680. [DOI] [PMC free article] [PubMed] [Google Scholar]
- 52.Wlodarchak N, Xing Y. Pp2a as a master regulator of the cell cycle. Crit Rev Biochem Mol Biol. 2016;51(3):162–184. doi: 10.3109/10409238.2016.1143913. [DOI] [PMC free article] [PubMed] [Google Scholar]
- 53.Reynhout S, Janssens V. Physiologic functions of PP2A: lessons from genetically modified mice. Biochim Biophys Acta BBA - Mol Cell Res. 2019;1866(1):31–50. doi: 10.1016/j.bbamcr.2018.07.010. [DOI] [PubMed] [Google Scholar]
- 54.Wang J, Li H, Xue B, Deng R, Huang X, Xu Y, Chen S, Tian R, Wang X, Xun Z, et al. Irf1 promotes the innate immune response to viral infection by enhancing the activation of Irf3. J Virol. 2020;94(22):e01231–20. doi: 10.1128/JVI.01231-20. [DOI] [PMC free article] [PubMed] [Google Scholar]
- 55.Long L, Deng Y, Yao F, Guan D, Feng Y, Jiang H, Li X, Hu P, Lu X, Wang H, et al. Recruitment of phosphatase PP2A by RACK1 adaptor protein deactivates transcription factor IRF3 and limits type I interferon signaling. Immunity. 2014;40(4):515–529. doi: 10.1016/j.immuni.2014.01.015. [DOI] [PubMed] [Google Scholar]
- 56.Wang S, Xiang Z, Gao P, Zhang Y, Zhou L, Ge X, Guo X, Han J, Yang H. African swine fever virus structural protein p17 inhibits IRF3 activation by recruiting host protein PR65A and inducing apoptotic degradation of STING. Front Microbiol. 2024;15:1428233. doi: 10.3389/fmicb.2024.1428233. [DOI] [PMC free article] [PubMed] [Google Scholar]
- 57.Ho WS, Mondal I, Xu B, Das O, Sun R, Chiou P, Cai X, Tahmasebinia F, McFadden E, Wu CYJ, et al. Pp2ac/strn4 negatively regulates sting-type I IFN signaling in tumor-associated macrophages. J Clin Invest. 2023;133(6):e162139. doi: 10.1172/JCI162139. [DOI] [PMC free article] [PubMed] [Google Scholar]
- 58.Mondal I, Das O, Sun R, Gao J, Yu B, Diaz A, Behnan J, Dubey A, Meng Z, Eskandar E, et al. Pp2ac deficiency enhances tumor immunogenicity by activating sting-type I interferon signaling in glioblastoma. Cancer Res. 2023;83(15):2527–2542. doi: 10.1158/0008-5472.CAN-22-3382. [DOI] [PMC free article] [PubMed] [Google Scholar]
- 59.Bøe R, Gjertsen BT, Vintermyr OK, Houge G, Lanotte M, Døskeland SO. The protein phosphatase inhibitor okadaic acid induces morphological changes typical of apoptosis in mammalian cells. Exp Cell Res. 1991;195(1):237–246. doi: 10.1016/0014-4827(91)90523-W. [DOI] [PubMed] [Google Scholar]
- 60.Gong F-R, Wu M-Y, Shen M, Zhi Q, Xu Z-K, Wang R, Wang W-J, Zong Y, Li Z-L, Wu Y, et al. Pp2a inhibitors arrest G2/M transition through JNK/Sp1-dependent down-regulation of CDK1 and autophagy-dependent up-regulation of p21. Oncotarget. 2015;6(21):18469–18483. doi: 10.18632/oncotarget.4063. [DOI] [PMC free article] [PubMed] [Google Scholar]
- 61.Bressy C, Droby GN, Maldonado BD, Steuerwald N, Grdzelishvili VZ, Dutch RE. Cell cycle arrest in G2/M phase enhances replication of interferon-sensitive cytoplasmic RNA viruses via inhibition of antiviral gene expression. J Virol. 2019;93(4):e01885–18. doi: 10.1128/JVI.01885-18. [DOI] [PMC free article] [PubMed] [Google Scholar]
- 62.Marelli S, Williamson JC, Protasio AV, Naamati A, Greenwood EJ, Deane JE, Lehner PJ, Matheson NJ. Antagonism of PP2A is an independent and conserved function of HIV-1 Vif and causes cell cycle arrest. eLife. 2020;9:e53036. doi: 10.7554/eLife.53036. [DOI] [PMC free article] [PubMed] [Google Scholar]
- 63.Boshuizen JA, Reimerink JHJ, Korteland-van Male AM, van Ham VJJ, Koopmans MPG, Büller HA, Dekker J, Einerhand AWC. Changes in small intestinal homeostasis, morphology, and gene expression during rotavirus infection of infant mice. J Virol. 2003;77(24):13005–13016. doi: 10.1128/JVI.77.24.13005-13016.2003. [DOI] [PMC free article] [PubMed] [Google Scholar]
- 64.Arias CF, López S. Rotavirus cell entry: not so simple after all. Curr Opin Virol. 2021;48:42–48. doi: 10.1016/j.coviro.2021.03.011. [DOI] [PubMed] [Google Scholar]
- 65.Kierans SJ, Fagundes RR, Malkov MI, Sparkes R, Dillon ET, Smolenski A, Faber KN, Taylor CT. Hypoxia induces a glycolytic complex in intestinal epithelial cells independent of HIF-1-driven glycolytic gene expression. Proc Natl Acad Sci. 2023;120(35):e2208117120. doi: 10.1073/pnas.2208117120. [DOI] [PMC free article] [PubMed] [Google Scholar]
- 66.Nagawa D, Shimada M, Nakata M, Narita-Kinjo I, Fujita T, Murakami R, Nakamura N, Tomita H. Hypoxia-inducible factor-1α suppresses the innate immune response in cultured human proximal tubular cells. Vivo. 2023;37(6):2437–2446. doi: 10.21873/invivo.13349. [DOI] [PMC free article] [PubMed] [Google Scholar]
- 67.Polke M, Seiler F, Lepper PM, Kamyschnikow A, Langer F, Monz D, Herr C, Bals R, Beisswenger C. Hypoxia and the hypoxia-regulated transcription factor HIF-1α suppress the host defence of airway epithelial cells. Innate Immun. 2017;23(4):373–380. doi: 10.1177/1753425917698032. [DOI] [PubMed] [Google Scholar]
- 68.Günther C, Ruder B, Stolzer I, Dorner H, He G-W, Chiriac MT, Aden K, Strigli A, Bittel M, Zeissig S, et al. Interferon lambda promotes Paneth cell death via STAT1 signaling in mice and is increased in inflamed ileal tissues of patients with Crohn’s disease. Gastroenterology. 2019;157(5):1310–1322.e13. doi: 10.1053/j.gastro.2019.07.031. [DOI] [PubMed] [Google Scholar]
- 69.Major J, Crotta S, Llorian M, McCabe TM, Gad HH, Priestnall SL, Hartmann R, Wack A. Type I and III interferons disrupt lung epithelial repair during recovery from viral infection. Science. 2020;369(6504):712–717. doi: 10.1126/science.abc2061. [DOI] [PMC free article] [PubMed] [Google Scholar]
- 70.Broggi A, Ghosh S, Sposito B, Spreafico R, Balzarini F, Lo Cascio A, Clementi N, De Santis M, Mancini N, Granucci F, et al. Type III interferons disrupt the lung epithelial barrier upon viral recognition. Science. 2020;369(6504):706–712. doi: 10.1126/science.abc3545. [DOI] [PMC free article] [PubMed] [Google Scholar]
- 71.Kruse T, Biedenkopf N, Hertz EPT, Dietzel E, Stalmann G, López-Méndez B, Davey NE, Nilsson J, Becker S. The ebola virus nucleoprotein recruits the host PP2A-B56 phosphatase to activate transcriptional support activity of VP30. Mol Cell. 2018;69(1):136–145.e6. doi: 10.1016/j.molcel.2017.11.034. [DOI] [PubMed] [Google Scholar]
- 72.Von Creytz I, Rohde C, Biedenkopf N, Liu S-L. The cellular protein phosphatase 2A is a crucial host factor for Marburg virus transcription. J Virol. 2024;98(9):e01047–24. doi: 10.1128/jvi.01047-24. [DOI] [PMC free article] [PubMed] [Google Scholar]
- 73.Beg M, Srivastava A, Shankar K, Varshney S, Rajan S, Gupta A, Kumar D, Gaikwad AN. Ppp2r5b, a regulatory subunit of pp2a, contributes to adipocyte insulin resistance. Mol Cell Endocrinol. 2016;437:97–107. doi: 10.1016/j.mce.2016.08.016. [DOI] [PubMed] [Google Scholar]
Associated Data
This section collects any data citations, data availability statements, or supplementary materials included in this article.