

Abstract
Disruption of circadian rhythms predisposes shift workers to many chronic conditions, including osteoporosis. However, the effects of disrupted circadian rhythms on bone remodeling remain largely unknown. Here, we show that one of the core circadian regulators PER1 inhibits osteoclastogenesis by upregulating genes involved in inflammation. The conditional knockout of Per1 in osteoclasts and related cells resulted in decreased bone mass in the femurs of mice, along with increased osteoclasts and decreased osteoblasts. Osteoclastogenesis was also promoted by Per1 depletion in vitro with 17 downregulated inflammatory genes. Eight of these genes were known to promote or inhibit osteoclastogenesis depending on the stage of osteoclastogenesis and the presence or absence of infection. The knockdown of three of these genes, which were involved in the inflammasome pathway, promoted osteoclastogenesis, mirroring the effects of Per1 knockout and offering a mechanistic explanation for the Per1-mediated inhibition of osteoclastogenesis. These results were not observed following the depletion of a paralog Per2. Per1 knockout mice maintain general circadian rhythms, unlike arrhythmic Per1/Per2 double knockout mice. This gives credence to Per1 as a selective target for therapeutic interventions without disrupting the circadian rhythms. This study uncovered a link between a circadian regulator and osteoclastogenesis in the broader context of osteoimmunology. Our findings may be mechanistically relevant to inflammatory bone diseases influenced by circadian rhythms, such as rheumatoid arthritis and osteoarthritis, as well as other bone diseases predisposed by chronic circadian disruption.
Keywords: Bone mass, circadian rhythms, inflammasome, inflammation, osteoclast, osteoimmunology, Per1
Lay summary
Disruption of circadian rhythms is a risk factor for many chronic diseases, including osteoporosis, among shift workers; however, the underlying mechanisms remain largely unknown. In this study, the depletion of Per1, a core circadian regulator, resulted in an increase in bone-resorbing osteoclasts and a decrease in bone mass in mice. These changes were accompanied by a decrease in the expression of inflammatory genes that promoted the formation of osteoclasts upon depletion. This study revealed a link between circadian rhythms and bone loss, with inflammatory genes serving as mediators, which could provide a basis for future therapeutic interventions.
Introduction
Disruption of circadian rhythms due to frequent travel, shift work, or excessive exposure to artificial light increases the risk of osteoporosis,1,2 a condition characterized by an imbalance in bone formation by osteoblasts and bone resorption by osteoclasts, both of which are under circadian control3. Mammalian circadian rhythms are regulated by the central clock located in the suprachiasmatic nucleus of the hypothalamus and peripheral clocks, which are ubiquitously expressed throughout the body.4,5 The central clock is entrained by light signals transmitted from the retina and synchronizes peripheral clocks via the autonomic nervous system and various hormones. Peripheral clocks are also entrained by other stimuli, such as food intake and sleep-awake signals. All these clocks are maintained by two feedback loops centered on the CLOCK/BMAL1 transcription factor complex. This heterodimer binds to the E-box in hundreds of target genes and activates their transcription. The target genes include Cry (Cry1 and Cry2) and Per (Per1, Per2, and Per3), which form the CRY-PER heterodimer and inhibit CLOCK/BMAL1 through direct binding. Subsequently, both CRY and PER are degraded via the proteasomal pathway, enabling CLOCK/BMAL1 to resume transcription of the target genes and completing the first feedback loop with a 24-hr period. In the second feedback loop, CLOCK/BMAL1 activates the transcription of the Ror (retinoic acid receptor-related orphan receptor) and Nr1d (Rev-erbs or reverse orientation c-erbA) genes, whose proteins then bind to the Bmal1 promoter and activate (ROR) or inhibit (NR1D) transcription.
Circadian regulation of bone remodeling has been primarily demonstrated through three lines of evidence.3,6 First, serum and urine levels of bone turnover markers representing bone resorption (such as crosslinked C-terminal telopeptide of type I collagen [CTX]) and bone formation (such as procollagen type 1 N-terminal propeptide [P1NP]) exhibit circadian rhythms. Second, RNA-seq and quantitative reverse transcription and PCR (qRT-PCR) demonstrate circadian expression of bone marker genes, such as Runx2, Nfatc1, Ctsk, Tnfrsf11a (Rank), and Tnfrsf11b (Opg) in the mouse calvaria, tibia, and femur. Third, bone cell-specific knockout (KO) of circadian regulators disrupts bone mass. For example, osteoblast-specific KO of Bmal1 decreases bone mass by modulating the RANKL signaling pathway.7 In contrast, osteoclast-specific KO of Bmal1 increases bone mass,8 although another study was unable to replicate this finding.9 However, since the depletion of Bmal1 completely abolishes circadian rhythms, these phenotypes could include general consequences of the lack of circadian rhythms, in addition to the intended Bmal1-specific effects as mentioned earlier.10
We depleted Per1 or Per2 in the osteoclasts of mice in the current study for two reasons. First, singular germline KO mice for either gene can maintain circadian rhythms with a period of approximately 22 hr, unlike arrhythmic double KO mice,11 addressing the problem mentioned above. Although germline KO of Per1 or Per2 does not result in an overt skeletal phenotype,13 this does not exclude hidden roles of the genes in osteoclastogenesis. The roles of non-Bmal1 circadian regulators, including Per, in osteoclastogenesis remain poorly understood. Second, Per1 KO promotes the production of pro-inflammatory cytokines in macrophages under inflammatory conditions as we reported before12, suggesting that Per1 KO might affect osteoclasts as well because of the shared linage between macrophages and osteoclasts.
In this study, we used Cx3cr1 promoter-driven Cre mice to conditionally KO (cKO) Per1 or Per2 in the monocyte/macrophage lineages. We first compared the bone phenotypes of Per1 cKO and Per2 cKO mice using micro-computed tomography (micro-CT) and histology. We then used in vitro osteoclastogenesis to verify the cell-autonomous effects of Per1 cKO. Subsequently, transcriptomics, gene knockdown (KD), and circadian synchronization led us to identify a group of genes that could explain the phenotypes of Per1 cKO. Collectively, these results revealed osteoimmunology as a major link between Per1 and osteoclasts.
Materials and Methods
Generation of Per1 and Per2 cKO mice
Per1 cKO mice were created by crossing the Cx3cr1 promoter-driven Cre mice (B6J.B6N(Cg)-Cx3cr1tm1.1(cre)Jung/J, Jackson Lab, 025524) with the inducible Per1 KO mice Per1fl/fl.14 The resulting Cx3cr1-Cretg/wt;Per1fl/fl and Cx3cr1-Crewt/wt;Per1fl/fl mice were used as Per1 cKO and littermate control mice (Per1 Cont), respectively. Likewise, Cx3cr1-Cre mice and Per2fl/fl mice (Medical Research Council, UK, Per2tm1c(EUCOMM)Hmgu) were crossed to establish Cx3cr1-Cretg/wt;Per2fl/fl and Cx3cr1-Crewt/wt;Per2fl/fl mice as Per2 cKO and littermate control mice (Per2 Cont), respectively. Genotyping primers and the sizes of the PCR products are listed in Supplementary Table 1 based on the protocols provided by the sources of the mice. The mice were housed under a 12 hr light-12 hr dark cycle in an accredited facility with water and food provided ad libitum. All mouse protocols were approved by the Institutional Animal Care and Usage Committee of the University of Minnesota (2410–42491A). All mouse experiments comply with the standards set by the Guide for the Care and Use of Laboratory Animals published by the US National Institute of Health.
Micro-CT scan analysis of the bones
Micro-CT scanning of the femur was performed as previously described.15 Specifically, the femurs prepared from 12-week-old mice were fixed in 10% formalin in phosphate-buffered saline (PBS) for 24 hr and stored in 70% ethanol at 4°C. Mico-CT was performed with an XT H 225 CT scanning system (Nikon Metrology). The scan settings were as follows: 120 kV, 61 μA, 720 projections at two frames per projection with an integration time of 708 ms, an isometric voxel size of 7.11 μm with a 1 mm aluminum filter, and 17 min per scan. Bone morphometric analysis was done with SkyScan CT Analyzer (CTAn, Brucker micro-CT) and the results were described with standard symbols.16 Each scan volume was reconstructed with CT Pro 3D program (Nikon Metrology), converted to bitmap data with VGStudio MAX 3.2 (Volume Graphics), and reoriented with DataViewer (SkyScan, Buker micro-CT) for qualitative analysis. 3D analysis of trabecular bones was done at the distal metaphysis 0.7 mm proximal to the growth plate, extending 1.5 mm toward the bone diaphysis. 3D analysis of the cortical bones was done in a 0.5 mm section in the mid-diaphysis 4 mm from the growth plate.
Histomorphometry of bone sections
The tibiae prepared as described above were decalcified in 15% EDTA for 14 days, embedded in paraffin, and sectioned at 7 μm in thickness. The TRAP staining kit (Sigma Aldrich, 387A-1KT) and Masson’s trichrome staining kit (Polyscience, 25088) were used to detect osteoclasts and osteoblasts, respectively. The numbers of osteoclasts and osteoblasts were counted and the ratios between these cells and bone perimeter were calculated with ImageJ.
Osteoclast differentiation in vitro
Osteoclasts were prepared from bone marrow monocytes and macrophages (BMMs) as previously described with some modifications.17 On day 1, bone marrow cells were flushed from the femur and tibia of 8- to 12-week-old mice with PBS and centrifuged at 190 x g for 5 min. The precipitated cells were resuspended with 1X Red Blood Cell Lysis Buffer (eBioscience, 00-4333-57) and incubated at 25°C for 5 min. After centrifugation under the same conditions, the precipitated cells were resuspended with Monocyte Medium (25 ng/ml M-CSF [Shenandoah, 100–03], 10% heat-treated fetal bovine serum [FBS], and phenol red-free αMEM [Thermo Fisher, 41061–029]). Cells were incubated with 5% CO2 at 37°C overnight. On day 2, non-adherent cells were harvested and cell clusters were removed with a 70 μm cell strainer (Falcon, 352350). The cells were centrifuged, resuspended in Osteoclast Medium (Monocyte Medium with 100 ng/ml RANKL [Cell Signaling Technology, 68495]), and seeded at 8×10⁵ cells/400 μl/well in a 48-well plate. On day 4, 200 μl of the medium was added. On day 5, the medium was replaced with 400 μl of fresh medium. On day 6, the cells were fixed with 4% paraformaldehyde in PBS for TRAP staining. The total number of osteoclasts, defined as TRAP-positive cells with more than two nuclei, in a well were manually counted. The sizes of osteoclasts were measured with ImageJ.
Enzyme-linked immunosorbent assay (ELISA) of IL-1β and lipopolysaccharide (LPS)
Culture supernatant of osteoclasts on day 6 were applied to ELISA of IL-1β (Lumit IL-1β immunoassay, Promega, W7010) and LPS (ToxiSensor chromogenic LAL endotoxin assay kit, GenScript, L00350Y) following each instruction.
Synchronization of circadian rhythms
On day 5 of the differentiation of osteoclasts, the cells were treated with Synchronization Medium (50% heat-inactivated horse serum in Osteoclast Medium instead of FBS) for 1 hr at 37°C with 5% CO2, washed with PBS at 37°C twice, and cultured with fresh Osteoclast Medium.18 The time of the completion of these procedures was defined as 0 hr post-synchronization. The cells were cultured at 37°C with 5% CO2 and harvested for qRT-PCR every 4 hr starting from 24 hr post-synchronization to wait for the recovery from the synchronization as previously recommended.19 Circadian rhythmicity of the qRT-PCR values was evaluated with Cosinor.Online (https://cosinor.online/app/cosinor.php).20
Bone resorption assay
The bone resorption assay followed a published protocol with some modifications.17 On day 2 of the osteoclast differentiation, the cells were seeded on top of a bone slice (Immunodiagnostic Systems, DT-1BON1000–96) at 3.2×10⁵ cells/well in a 48-well plate in Osteoclast Medium to induce osteoclastogenesis as described above. The medium was replaced every 3 days after day 6. On day 14, cells were lysed with 10% bleach and the bone slices were washed with deionized water three times. The bone slices were incubated in 200 μl deionized water for 1 hr at 25°C twice and stained with Toluidine blue for 30 sec. The bone slices were washed with deionized water three times and dried. The resorption area was analyzed with ImageJ.
qRT-PCR
qRT-PCR was performed as previously described.12 RNA was extracted from cells using a Quick RNA Microprep kit (Zymo Research, R1051) and purity was assessed using a microvolume spectrophotometer DS-11 FX+ (Denovix). cDNA was synthesized with ProtoScript II Reverse Transcriptase (New England Biolabs, M0368L). qPCR was performed with the primers listed in Supplementary Table 2 and qPCRBIO SyGreen Blue Mix Lo-ROX (Genesee Scientific, 17–505B) on a Mastercycler realplex2 thermocycler (Eppendorf). PCR conditions were as follows: initial denaturation at 95°C for 2 min, 40 cycles of 95°C for 5 sec - 60°C for 30 sec - 72°C for 30 sec, and a melting curve step to check the specificity of the amplification. mRNA expression levels were analyzed by normalizing expression values to glyceraldehyde 3-phosphate dehydrogenase (Gapdh) expression. Mean ± SEM of biological triplicates with technical triplicates each was calculated.
Gene KD with siRNA
BMMs were transfected with 10 nM siRNA (Supplementary Table 3) with 1 ul DharmaFECT 1 Transfection Reagent (Dharmacon, T-200-01) for 5 hr on day 4 and 5 during osteoclast differentiation described above. The cells were harvested on day 6 for qRT-PCR and TRAP staining.
Transfection of circadian genes into RAW264.7 cells
RAW264.7 cells (ATCC, TIB-71) were transfected with empty vector or plasmids encoding Clock, Bmal1, Per1, and Per2 as follows.21 Cells were seeded at 8×10⁴ cells/well in a 48-well plate on day 1 in 10% FBS in DMEM. On day 2, 1.6 μg of the plasmid was transfected with 2 μl Lipofectamine LTX and 1.5 μl PLUS Reagent (Invitrogen, 15338030) following the instructions. The cells were incubated at 37°C with 5% CO2 and harvested 48 hr later for qRT-PCR.
RNA-seq
RNA-seq and data analysis were also performed as previously described.22 Total RNA was prepared from day 6 osteoclasts and concentration and RNA integrity number were quantified with an Agilent BioAnalyzer 2100. mRNA was purified with poly-T oligo-attached magnetic beads and cDNA was synthesized using random hexamer primers. Non-directional libraries were prepared and completed by end repair, A-tailing, adapter ligation, size selection, amplification, and purification. The quality and quantity of the libraries were checked via real-time PCR and a Bioanalyzer. The libraries were sequenced on an Illumina platform and paired-end reads were generated.
Raw reads of the fastq format were processed through in-house perl scripts. Paired-end clean reads were aligned to the reference genome Mus musculus GRCm38 (ftp://ftp.ensembl.org/pub/release-94/fasta/mus_musculus/dna/Mus_musculus.GRCm38.dna.primary_assembly.fa.gz and ftp://ftp.ensembl.org/pub/release-94/gtf/mus_musculus/Mus_musculus.GRCm38.94.gtf.gz) using Hisat2 v2.0.5 (https://daehwankimlab.github.io/hisat2/). featureCounts v1.5.0-p3 (http://subread.sourceforge.net/) was used to count read numbers mapped to each gene. Differential expression analysis was performed using the DESeq2 R package (1.20.0) (https://www.r-project.org/). Genes with log2 fold change > 0.58 of < –0.58 (> 1.5-fold) and an adjusted p-value < 0.05 were assigned as differentially expressed. Enrichment of specific gene pathways in differentially expressed genes were identified by applying the clusterProfiler R package (https://www.r-project.org/) to the databases of Gene Ontology (http://www.geneontology.org). Adjusted p-value < 0.05 was considered significantly enriched.
Statistical Analysis
Unpaired two-tailed t-tests and two-way ANOVA with Tukey’s method of multiple comparisons were used as stated in the figure legends. Mean ± SEM obtained from biological replicates of the numbers are indicated in each figure. Box plots show median and interquartile range (25th – 75th percentile). GraphPad Prism 10 (GraphPad Software) was used in statistical analysis.
Results
Per1 cKO, but not Per2 cKO, decreased bone mass and increased osteoclasts in male mice
To investigate the roles of Per1 and Per2 in osteoclasts, we prepared Cx3cr1 promoter-driven Per1 KO mice (Per1 cKO) alongside littermate controls (Per1 Cont), as well as Per2 cKO mice with controls (Per2 Cont). qRT-PCR verified significant depletion of Per1 (13.8 ± 3.2% remaining) and Per2 (15.6 ± 4.4% remaining) mRNA in osteoclasts prepared from the femurs of 12-week-old male mice (Figure 1A). Micro-CT analysis of the femoral midshaft revealed a significant reduction in cortical bone volume and cortical thickness in male Per1 cKO mice compared to those in Per1 Cont (Figure 1B–D). Likewise, diminished distal femoral trabecular bone volume and numbers were observed in Per1 cKO mice (Figure 1B, E, and F). In contrast, Per2 cKO mice did not show any of these phenotypes (Figure 1B–F). Trabecular thickness was not affected in Per1 cKO or Per2 cKO mice (Figure 1G). In this study, we focused on male mice because none of the bone mass parameters were decreased in female Per1 cKO and Per2 cKO mice compared to corresponding control mice (Supplementary Figure 1A–E).
Figure 1. Per1 cKO, but not Per2 cKO, decreased bone mass in male femurs.

A. Relative expression levels of Per1 and Per2 in each cKO male osteoclasts in comparison to Cont osteoclasts on day 6 quantified with qRT-PCR. n = 3.
B. Reconstructed 3D micro-CT images of femoral midshafts (top) and distal femurs (bottom) prepared from 12-week-old male mice of the indicated genotypes. Bar, 1 mm.
C-G. Quantification of the cortical bone volume/total volume ratio (C), cortical thickness (D), trabecular bone volume/total volume ratio (E), trabecular number (F), and trabecular thickness (G) comparing 12-week-old male mice. n = 9 or 10.
Mean ± SEM is shown. ** p < 0.01, * p < 0.05, and ns for not significant with two-way ANOVA with Tukey’s method of multiple comparisons.
In bone histomorphometry of the proximal tibia, Per1 cKO increased osteoclasts (Figure 2A and B) and reduced osteoblasts per bone perimeter (Figure 2C and D). The decrease in osteoblasts was likely an indirect effect because Cx3cr1 was not substantially expressed in these cells. In contrast, the numbers of osteoclasts and osteoblasts were not changed following Per2 cKO (Figure 2B and D, and Supplementary Figure 2A and B). The changes in the numbers of osteoclasts and osteoblasts in Per1 cKO mice were consistent with the decreased bone mass in these mice.
Figure 2. Per1 cKO in male mice increased osteoclastogenesis but decreased osteoblastogenesis.
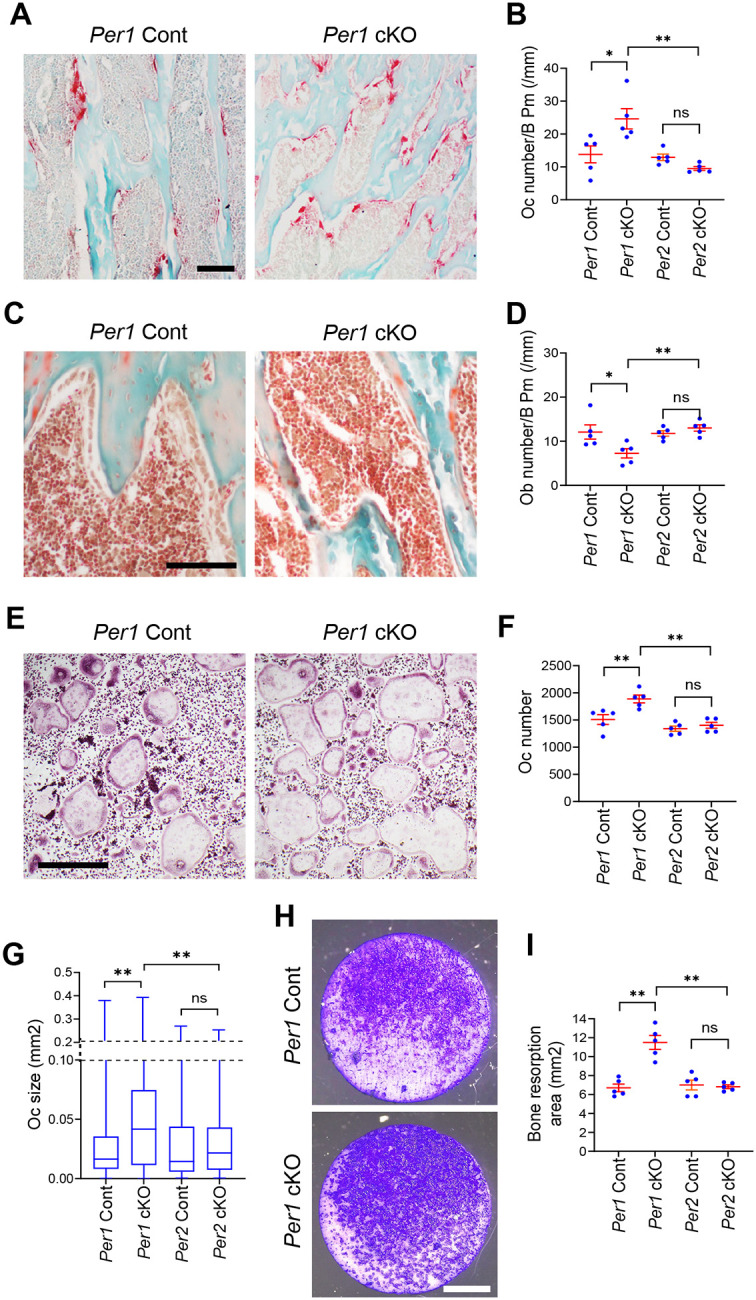
A. TRAP staining of the proximal tibial sections comparing Per1 cKO and Cont mice. Bar, 100 μm.
B. Osteoclast numbers per bone perimeter in the proximal tibiae of the indicated genotypes. n = 5.
C. Masson’s trichrome staining of the proximal tibial sections. Bar, 100 μm.
D. Osteoblast numbers per bone perimeter in proximal tibiae of the indicated genotypes. n = 5.
E. TRAP staining of osteoclasts in vitro on day 6. Bar, 500 μm.
F. The numbers of osteoclasts per well in a 48-well plate on day 6. n = 5.
G. Size distributions of osteoclasts on day 6. n = 3000 osteoclasts (600 osteoclasts/well x 5 wells of biologically independent experiments).
H. Bone resorption assay stained with Toluidine blue. Bar, 2 mm.
I. Areas of resorbed bones stained with Toluidine blue. n = 5.
Histological sections and osteoclasts were prepared from 12-week-old male mice. Mean ± SEM is shown. ** p < 0.01, * p < 0.05, and ns for not significant with two-way ANOVA with Tukey’s method of multiple comparisons.
Per1 cKO promoted osteoclastogenesis in a cell-autonomous manner
We investigated whether Per1 depletion increased osteoclastogenesis in a cell-autonomous manner, as the Cx3cr1 promoter was also active in monocytes and macrophages. We harvested BMMs from the femurs of 12-week-old Per1 cKO and Cont mice and induced osteoclastogenesis with RANKL and M-CSF. Greater numbers of large-sized osteoclasts were obtained from Per1 cKO cells compared to those from Cont cells (Figure 2E–G). Moreover, enhanced pit formation was observed on bovine bone slices caused by Per1 cKO osteoclasts (Figure 2H and I). These phenotypes were not detected with Per2 cKO osteoclasts (Figure 2F, G, and I, and Supplementary Figure 2C and D). These in vitro results align with the observed decrease in bone mass and increase in osteoclasts in vivo.
Inflammatory genes were downregulated by Per 1 cKO osteoclasts
We applied RNA-seq to compare transcriptomes of Per1 KO and Cont osteoclasts; 25 genes were upregulated and 96 were downregulated in the Per1 cKO osteoclasts when cutoff values of > 1.5-fold difference (log2FC > 0.58 or < −0.58) and an adjusted p-value of < 0.05 (−log10(padj) > 1.3) were applied (Figure 3A and B, and Supplementary Figure 3A and B). Per1 and Per2 were not downregulated in each cKO cells because residual exons generated mRNA. Gene ontology (GO) analysis of the upregulated genes did not yield any enriched pathways; however, we observed enrichment of downregulated genes involved in innate and adaptive immunity, as well as inflammatory response (Figure 3C), which included 17 genes shown in Figure 3D (red bars for Per1 cKO). RNA-seq analysis of Per2 cKO osteoclasts identified 2 upregulated and 30 downregulated genes compared to Per2 Cont cells (Supplementary Figure 3C and D, and 4A and B). However, there were no enriched pathways in GO analysis of these genes. In addition, the 17 genes mentioned above were not downregulated in Per2 cKO osteoclasts (Figure 3D, blue bars), except for Cx3cr1, suggesting specific relevance of these genes to the increased osteoclastogenesis associated with Per1 cKO. Cx3cr1 was the most significantly downregulated gene because the single coding exon was replaced by the Cre recombinase cassette in one of the two alleles.
Figure 3. Per1 cKO downregulated inflammatory genes in male osteoclasts.

A. A volcano plot demonstrating differentially expressed genes between Per1 cKO and Cont osteoclasts. FC and padj indicate fold change and adjusted p value, respectively.
B. A heatmap displaying up- or downregulated genes in Per1 cKO osteoclasts compared with Per1 Cont osteoclasts.
C. Gene ontology analysis of downregulated genes in Per1 cKO osteoclasts compared with Per1 Cont osteoclasts. Pathways related to inflammation and immunity are underlined in red.
D. A list of the genes that belong to the four pathways underlined in red in (C). Red and blue bars indicate Per1 cKO and Per2 cKO osteoclasts, respectively.
E. A list of representative osteoclasts marker genes detected with RNA-seq.
F. Relative expression levels of circadian regulators and osteoclasts marker genes in synchronized osteoclasts comparing three genotypes. The value of Per1 Cont cells at 24 hr was defined as 1.0 in each graph.
Male osteoclasts were used in all data. (A) – (E) are based on biological triplicates, whereas (F) is based on biological triplicates with technical triplicated each. The red lines in (D) and (E) indicate FC = 1.5 or 0.67, and padj = 0.05. ** p < 0.01, * p < 0.05, and ns for not significant with the Cosinor analysis of circadian rhythmicity listed next to the gene names in color-coded manners in (F). ** p < 0.01 and * p < 0.05 with unpaired two-tailed t-test comparing peak levels of Per1 cKO and Cont osteoclasts embedded in each graph in (F).
The 17 downregulated genes included eight genes known to affect bone mass and osteoclastogenesis (Figure 3D, highlighted in pink, and Table 1). Although germline KO was reported for some genes (Ccr2, Cd86, Cx3cr1, and Tlr9), none of them have been studied using osteoclast-specific KO mice, making it difficult to compare their mouse phenotypes with those in the current study. In vitro studies of these genes showed that they were not simple inhibitors of osteoclastogenesis, as might be expected from the Per1 cKO phenotypes. While Ccr2 and Cx3cr1 promote osteoclastogenesis, other genes have dual functions (inhibition and promotion) depending on the presence or absence of inflammation (Nlrp3) and whether they were primed with RANKL or not (Il1b and Tlr9). The decreased bone mass and increased osteoclastogenesis observed in our study may have resulted from the cumulative effects of multiple dysregulated genes functioning at different stages of osteoclastogenesis. A case in point is the downregulation of Cx3crl, which was expected to inhibit osteoclastogenesis.23 The downregulation of other genes appeared to have counteracted this effect in Per1 cKO and Per2 cKO cells.
Table 1.
The roles of selected genes in osteoclastogenesis
| Gene | Relevance to osteoclastogenesis | Ref |
|---|---|---|
| Ccr2 | C-C motif chemokine receptor 2. Increased bone mass and decreased osteoclasts in Ccr2−/− mice. Inhibited osteoclastogenesis from Ccr2−/− cells in vitro. | 44,45 |
| Cd86 | Decreased bone mass and increased osteoclasts in Cd80−/−;Cd86−/− mice. Normal osteoclastogenesis by Cd80−/−;Cd86−/− monocytes in vitro. CD80 and CD86 are closely related. | 46 |
| Cnr2 (CB2) | Cannabinoid receptor 2. Uncertain roles. A study showed decreased bone mass and increased osteoclasts in CB −/− mice, while another indicated normal bone mass. | 47,48 |
| Cx3cr1 | Increased bone mass in Cx3cr1−/− mice and impaired osteoclastogenesis in vitro. | 23 |
| Il1b | IL-1β. Generally pro-osteoclastogenesis but can be anti-osteoclastogenesis depending on the culture conditions in vitro. | 25,26 |
| Nlrp3 | NOD-, LRR- and pyrin domain-containing protein 3a. Inhibits osteoclastogenesis under physiological conditions in vitro but promotes it during infection. | 28,29 |
| Tlr8 | Toll-like receptor 8. Binds to bacterial and viral single-stranded RNA. Promotes osteoclastogenesis when stimulated by a ligand in vitro. Stage-specific effect on osteoclastogenesis (below) is not known. | 49 |
| Tlr9 | Recognizes DNA of bacteria and viruses and activates inflammation. Increased osteoclastogenesis and bone resorption in Tlr9−/− mice as a secondary effect of systemic inflammation. Inhibits or promotes osteoclastogenesis depending on the stage of differentiation. | 39,40,50 |
Osteoclast marker genes were upregulated in Per1 cKO cells
RNA-seq did not reveal the expected upregulation of osteoclast marker genes in Per1 cKO cells despite enhanced osteoclastogenesis (Figure 3E). We tested whether this was due to the cells’ circadian rhythms not being synchronized, which masked their temporary upregulation. To test this possibility, we synchronized the circadian rhythms by incubating the cells in 50% horse serum for 1 hr and then harvested them every 4 hr over a 36-hr period. The circadian expression patterns of Bmal1, Per1, and Per2 in Per1 Cont cells were verified using Cosinor analysis (Figure 3F, p < 0.05 for each gene). In addition, the patterns of Bmal1 and Per2 expression were anti-phasic in both Per1 cKO and Cont cells, validating successful synchronization. Moreover, Per1 expression was substantially decreased in Per1 cKO cells, as expected. Importantly, Nfatc1, Ctsk, and Tnfrsf11a exhibited circadian expression, with peak levels upregulated by Per1 cKO, indicating that the transient upregulation of these genes in Per1 cKO cells was obscured by the presence of cells at mixed circadian phases when the cells were not synchronized.
Per1 downregulated the inflammasome pathway genes
Il1b, Tlr8, Tlr9, and Nlrp3 are involved in the inflammasome signaling pathway, which generally promotes osteoclastogenesis.24 However, the consequences of their depletions vary depending on the culture conditions of BMMs (Table 1). To clarify their roles in our in vitro osteoclastogenesis, we applied KD of the four genes using two independent siRNA sequences for each, which reduced each target mRNA to < 50% of the control level obtained with scrambled siRNA (Figure 4A). Il1b is generally pro-osteoclastogenic but it can be anti-osteoclastogenic when added into the culture prior to the addition of RANKL.25,26 Our KD of Il1b did not affect the number or size of osteoclasts (Figure 4B and C), possibly due to the low concentration of IL-1β in the supernatant of osteoclasts. Exogenous IL-1β promotes the osteoclastogenesis of BMMs at > 0.5 ng/ml in vitro.27 However, its concentration in the culture medium of Per1 Cont osteoclasts was < 0.1 ng/ml, as measured by ELISA (Figure 4D); even 0.1 ng/ml was insufficient to promote osteoclastogenesis (Figures 4E and F). The low concentration was consistent with the report by Alam et al., which found no detectable IL-1β in the supernatant.28 Thus, IL-1β appeared to be irrelevant in our assay.
Figure 4. Nlrp3, Tlr8, and Tlr9 inhibited osteoclastogenesis in vitro.

A. Relative expression levels of the indicated genes after KD with two independent siRNA sequences each. Data are based on biological triplicates with technical triplicates each.
B. The numbers of osteoclasts in a well of a 48-well plate after KD of the indicated genes. n = 3.
C. Size distributions of osteoclasts on day 6. n = 3000 osteoclasts (600 osteoclasts/well x 5 wells of biologically independent experiments).
D. Concentrations of IL-1β in the osteoclast supernatant quantified with ELISA. n = 3.
E. The numbers of osteoclasts in a well of a 48-well plate after culture with IL-1β. n = 5.
F. Size distributions of osteoclasts after culture with IL-1β. n = 3000 (600 osteoclasts/per well x 5 wells of biologically independent experiments).
All panels except for (D) used male Per1 Cont osteoclasts. Mean ± SEM is shown. ** p < 0.01, * p < 0.05, and ns for not significant with unpaired two-tailed t-test in comparison to control samples in (A) – (D) and two-way ANOVA with Tukey’s method of multiple comparisons in (E) and (F).
NLRP3 is a component of the inflammasome complex, which activates caspase-1, leading to the cleavage of pro-IL-1β and pro-IL-18 to produce mature IL-1β and IL-18.24 NLRP3 promotes osteoclastogenesis via increased IL-1β and IL-18 levels under inflammatory conditions created with LPS at 100 ng/ml; however, it inhibits osteoclastogenesis via pyroptosis under non-inflammatory conditions.28,29 Since LPS was undetectable (< 0.1 pg/ml) in the culture supernatants of Per1 cKO and Cont cells on days 0 and 5, NLRP3 appears to function as an inhibitor of osteoclastogenesis in the current study. Nlrp3 KD increased the number and size of osteoclasts, promoting osteoclastogenesis in agreement with the interpretation (Figure 4B and C). TLR9 promotes or inhibits osteoclastogenesis depending on the culture conditions, as detailed in the Discussion. In our case, the KD of Tlr8 and Tlr9 increased both the size and number of osteoclasts (Figure 4A–C).
Per1-dependent circadian expression of Nlrp3, Tlr8, and Tlr9
The circadian expressions of Nlrp3, Tlr8, and Tlr9 were known,30 but whether they were dependent on Per1 or Per2 was unclear. qRT-PCR of synchronized cells indicated that Per1 Cont and Per2 cKO cells demonstrated circadian expressions of these genes (p < 0.05), while the rhythmicity was lost in Per1 cKO cells (Figure 5A). This study included two negative control genes that were related to inflammasomes but not differentially expressed between Per1 cKO and Cont cells: Tlr3 (recognizes viral double-stranded RNA, log2(FC) = −0.3, and −log10(padj) = 0.17) and Pycard (a component of inflammasomes, log2(FC) = −0.06, and −log10(padj) = 0.05).31 These genes also exhibited circadian expression, which was not disrupted by Per1 KO, underscoring the specific regulation of Nlrp3, Tlr8, and Tlr9 by Per1. In a complementary experiment, we transduced Clock, Bmal1, Per1, and Per2 in various combinations into the macrophage cell line RAW264.7 because plasmid transfection with osteoclasts was inefficient. The transfection of Clock and Bmal1 did not increase the expression levels of Nlrp3, Tlr8, or Tlr9 compared to that with the empty vector when the same total amount of plasmids was used (Figure 5B). However, these genes were upregulated when Per1, but not Per2, was included. The expression levels of the two control genes (Tlr3 and Pycard) were not affected by the transfections. Collectively, these results supported our interpretation of the Per1-specific upregulation of Nlrp3, Tlr8, or Tlr9.
Figure 5. Per1 controlled circadian expression of Nlrp3, Tlr8, and Tlr9 in osteoclasts.

A. Relative expression levels of the indicated genes in synchronized osteoclasts comparing Per1 cKO, Per2 cKO, Per1 Cont osteoclasts. The value of Per1 Cont cells at 24 hr was defined as 1.0 in each graph.
B. Relative expression levels of the indicated genes after overexpression of circadian regulators in RAW264.7 cells. Abbreviations are as follows. EV: empty vector and CB: Clock and Bmal1.
All experiments used male osteoclasts. Mean ± SEM is shown. ** p < 0.01, * p < 0.05, and ns for not significant with the Cosinor analysis of circadian rhythmicity listed next to the gene names in color-coded manners in (A). ** p < 0.01, * p < 0.05, and ns for not significant with unpaired two-tailed t-test comparing peak levels of Per1 cKO and Cont osteoclasts in (A) and with two-way ANOVA with Tukey’s method of multiple comparisons in (B).
Discussion
This study demonstrated that Per1 was a cell-autonomous inhibitor of osteoclastogenesis in vitro, likely achieved by the upregulation of a group of inflammatory genes known to control osteoclastogenesis in context-dependent manners. These roles could explain the decreased bone mass in Per1 cKO mice, suggesting the presence of the Per1–inflammatory genes–osteoclast axis. This axis appears to be influenced by a sex-based bias since bone mass was not decreased in female Per1 cKO mice, which requires further studies. In contrast to Per1, cKO of Per2 did not affect bone mass or osteoclastogenesis despite sharing a high similarity at the amino acid level (73.4%) with Per1. Our finding is the second example of Per1-specific regulation of inflammatory genes, following an example that we reported in macrophages, although the target inflammatory genes were different.12 The relationship between circadian rhythm disruption and bone loss has been empirically established; however, direct connections between specific circadian regulators and osteoclasts remain unknown in vivo, except for the controversial roles of Bmal1 mentioned earlier. In addition, the involvement of inflammatory genes was not discussed in the studies on Bmal1 KO.
We selected the Cx3cr1 promoter to drive the Cre gene, instead of the Ctsk promoter because Ctsk is also expressed in periosteal mesenchymal stem cells, which can differentiate into osteoblasts,32 thereby compounding the interpretation of our results. However, the Cx3cr1 is also expressed in the cells other than the monocyte/macrophage lineages, such as dendritic cells, natural killer (NK) cells, and some T cell subtypes.33 Depletion of Per1 in these cells is also known to affect bone remodeling via secreted cytokines. For example, Per1 KO in NK cells alters the peak level and timing of the circadian expression of interferon γ (IFN-γ) and cytolytic factors (perforin and granzyme B).34 Per1 KD in helper T cells inhibits the synthesis of IFN-γ, IL-2, and TNF-α.35 These cytokines are involved in bone remodeling and osteoporosis.36–38 Furthermore, Per1 depletion indirectly affected Cx3cr1-negative cells as indicated by the decreased number of osteoblasts in the tibiae. Recent advances in single-cell spatial transcriptomics may enable us to analyze the contributions of each cell type. This approach would also enable us to verify whether the downregulated genes in the RNA-seq were reproducible in vivo, which is particularly significant for the dual-function genes Nlpr3, Tlr9, and potentially Tlr8.
TLR8 and TLR9 belong to the pattern recognition receptors in the innate immune system, which are localized on the membranes of endosomes, lysosomes, and endolysosomes.31 TLR8 binds to single-stranded RNA, including viral RNA, whereas TLR9 binds to unmethylated CpG-containing DNA, which is more abundant in viral and bacterial DNA than in mammalian DNA. Binding to these molecules leads to the production of pro-inflammatory cytokines (such as IL-1β and TNF-α) and type I interferons (such as IFN-α and IFN-β), which are generally pro-osteoclastogenic. TLR9 inhibits osteoclastogenesis when it is activated in the presence of M-CSF and RANKL at the start of culture, but promotes osteoclastogenesis when activated after the cells have been primed by M-CSF and RANKL for three days.39,40 The inhibition of osteoclastogenesis by TLR9 has been explained by the enhanced degradation of the c-fos protein, an essential inducer of osteoclastogenesis.41 However, the relevance of this culture condition-dependent difference in osteoclastogenesis to physiological osteoclastogenesis in vivo remains unclear. In the present study, TLR9 activation was not induced, although the possibility of unintentional activation could not be excluded. RANKL was added to the culture medium from day 2, and Tlr9 siRNA was introduced on day 4, leading to enhanced osteoclastogenesis. This promotion likely reflects the role of TLR9 at the baseline (non-activated) level, which could change once it is activated under an inflammatory condition. Although TLR8 has not been characterized in detail, it likely has similar roles due to the shared downstream signaling pathways.
The involvement of several genes relevant to inflammasomes (Tlr8, Tlr9, Nlrp3, and Il1b) in osteoclastogenesis raises the possibility of a crosstalk between osteoclasts and immune cells (osteoimmunology)42 as a part of the Per1-mediated circadian regulation of bone remodeling. The consequence of crosstalk would become amplified when inflammasomes are activated by microorganisms or cell debris. This may impact inflammatory bone diseases influenced by circadian rhythms, such as rheumatoid arthritis and osteoarthritis, where osteoclast-mediated bone destruction is a significant factor.6,43 Further mechanistic studies on Per1-specific circadian regulation of osteoimmunology could lead to the identification of novel therapeutic options for the inflammatory bone diseases, in addition to non-inflammatory predispositions to osteoporosis caused by circadian disruption, as broader implications of this research.
Supplementary Material
Acknowledgments
We thank Drs. Bryce Binstadt and Michelle L. Gumz for Cx3cr1-Cre mice and Per1fl/fl mice, respectively. We are grateful to the Comparative Pathology Shared Resource and the Minnesota Dental Research Center for Biomaterials and Biomechanics.
Funding Statement:
E.W.B. was supported by the NIH (R21AR084530). N.K was supported by the NIH (R01GM137603) and Regenerative Medicine Minnesota (RMM 072523 DS 002). The content is solely the responsibility of the authors and does not necessarily represent the official views of the NIH.
Funding Statement
E.W.B. was supported by the NIH (R21AR084530). N.K was supported by the NIH (R01GM137603) and Regenerative Medicine Minnesota (RMM 072523 DS 002). The content is solely the responsibility of the authors and does not necessarily represent the official views of the NIH.
Footnotes
Conflict of interest: The authors declare no conflict of interest.
Data Availability:
RNA-seq data have been deposited to Gene Expression Omnibus (GEO) under the accession number of GSE283894 (Per1 cKO and control) and GSE292534 (Per2 cKO and control).
References
- 1.Winter E.M. et al. Chronobiology and Chronotherapy of Osteoporosis. JBMR Plus 5, e10504 (2021). [DOI] [PMC free article] [PubMed] [Google Scholar]
- 2.Tian Y. & Ming J. The role of circadian rhythm in osteoporosis; a review. Front Cell Dev Biol 10, 960456 (2022). [DOI] [PMC free article] [PubMed] [Google Scholar]
- 3.Kikyo N. Circadian Regulation of Bone Remodeling. Int J Mol Sci 25, 4717 (2024). [DOI] [PMC free article] [PubMed] [Google Scholar]
- 4.Koronowski K.B. & Sassone-Corsi P. Communicating clocks shape circadian homeostasis. Science 371(2021). [Google Scholar]
- 5.Patke A., Young M.W. & Axelrod S. Molecular mechanisms and physiological importance of circadian rhythms. Nat Rev Mol Cell Biol 21, 67–84 (2020). [DOI] [PubMed] [Google Scholar]
- 6.Kikyo N. Circadian Regulation of Macrophages and Osteoclasts in Rheumatoid Arthritis. Int J Mol Sci 24, 12307(2023). [DOI] [PMC free article] [PubMed] [Google Scholar]
- 7.Takarada T. et al. Bone Resorption Is Regulated by Circadian Clock in Osteoblasts. J Bone Miner Res 32, 872–881 (2017). [DOI] [PubMed] [Google Scholar]
- 8.Xu C. et al. Circadian Clock Regulates Bone Resorption in Mice. J Bone Miner Res 31, 1344–1355 (2016). [DOI] [PubMed] [Google Scholar]
- 9.Tsang K., Liu H., Yang Y., Charles J.F. & Ermann J. Defective circadian control in mesenchymal cells reduces adult bone mass in mice by promoting osteoclast function. Bone 121, 172–180 (2019). [DOI] [PMC free article] [PubMed] [Google Scholar]
- 10.Wang C., Lutes L.K., Barnoud C. & Scheiermann C. The circadian immune system. Sci Immunol 7, eabm2465 (2022). [DOI] [PubMed] [Google Scholar]
- 11.Lowrey P.L. & Takahashi J.S. Genetics of circadian rhythms in mammalian model organisms. Advances in Genetics 74, 175–230 (2011). [DOI] [PMC free article] [PubMed] [Google Scholar]
- 12.Katoku-Kikyo N. et al. The circadian regulator PER1 promotes cell reprogramming by inhibiting inflammatory signaling from macrophages. PLoS Biol 21, e3002419 (2023). [DOI] [PMC free article] [PubMed] [Google Scholar]
- 13.Fu L., Patel M.S., Bradley A., Wagner E.F. & Karsenty G. The molecular clock mediates leptin-regulated bone formation. Cell 122, 803–815 (2005). [DOI] [PubMed] [Google Scholar]
- 14.Douma L.G. et al. Renal Na-handling defect associated with PER1-dependent nondipping hypertension in male mice. Am J Physiol Renal Physiol 314, F1138–F1144 (2018). [DOI] [PMC free article] [PubMed] [Google Scholar]
- 15.Karkache I.Y., Molstad D.H., Vu E., Jensen E.D. & Bradley E.W. Phlpp1 Expression in Osteoblasts Plays a Modest Role in Bone Homeostasis. JBMR Plus 7, e10806 (2023). [DOI] [PMC free article] [PubMed] [Google Scholar]
- 16.Dempster D.W. et al. Standardized nomenclature, symbols, and units for bone histomorphometry: a 2012 update of the report of the ASBMR Histomorphometry Nomenclature Committee. J Bone Miner Res 28, 2–17 (2013). [DOI] [PMC free article] [PubMed] [Google Scholar]
- 17.Bradley E.W. & Oursler M.J. Osteoclast culture and resorption assays. Methods Mol Biol 455, 19–35 (2008). [DOI] [PubMed] [Google Scholar]
- 18.Pourcet B. et al. Nuclear Receptor Subfamily 1 Group D Member 1 Regulates Circadian Activity of NLRP3 Inflammasome to Reduce the Severity of Fulminant Hepatitis in Mice. Gastroenterology 154, 1449–1464 e1420 (2018). [DOI] [PMC free article] [PubMed] [Google Scholar]
- 19.Hughes M.E. et al. Guidelines for Genome-Scale Analysis of Biological Rhythms. J Biol Rhythms, 748730417728663 (2017). [Google Scholar]
- 20.Molcan L. Time-distributed data analysis by Cosinor. Online application. 805960. bioRxiv (2019). [Google Scholar]
- 21.Katoku-Kikyo N. et al. Per1/Per2-Igf2 axis-mediated circadian regulation of myogenic differentiation. J Cell Biol 220, e202101057 (2021). [DOI] [PMC free article] [PubMed] [Google Scholar]
- 22.Katoku-Kikyo N., Kawakami H., Cantor M., Kawakami Y. & Kikyo N. METTL14 regulates chondrogenesis through the GDF5-RUNX-extracellular matrix gene axis during limb development. Nat Commun 16, 4072 (2025). [DOI] [PMC free article] [PubMed] [Google Scholar]
- 23.Hoshino A. et al. Roles of chemokine receptor CX3CR1 in maintaining murine bone homeostasis through the regulation of both osteoblasts and osteoclasts. J Cell Sci 126, 1032–1045 (2013). [DOI] [PubMed] [Google Scholar]
- 24.Murakami T., Nakaminami Y., Takahata Y., Hata K. & Nishimura R. Activation and Function of NLRP3 Inflammasome in Bone and Joint-Related Diseases. Int J Mol Sci 23(2022). [Google Scholar]
- 25.Xu J., Yu L., Liu F., Wan L. & Deng Z. The effect of cytokines on osteoblasts and osteoclasts in bone remodeling in osteoporosis: a review. Front Immunol 14, 1222129 (2023). [DOI] [PMC free article] [PubMed] [Google Scholar]
- 26.Lee B. et al. Direct inhibition of human RANK+ osteoclast precursors identifies a homeostatic function of IL-1beta. J Immunol 185, 5926–5934 (2010). [DOI] [PMC free article] [PubMed] [Google Scholar]
- 27.Shiratori T. et al. IL-1beta Induces Pathologically Activated Osteoclasts Bearing Extremely High Levels of Resorbing Activity: A Possible Pathological Subpopulation of Osteoclasts, Accompanied by Suppressed Expression of Kindlin-3 and Talin-1. J Immunol 200, 218–228 (2018). [DOI] [PubMed] [Google Scholar]
- 28.Alam M.I. et al. NLRP3 Inflammasome Negatively Regulates RANKL-Induced Osteoclastogenesis of Mouse Bone Marrow Macrophages but Positively Regulates It in the Presence of Lipopolysaccharides. Int J Mol Sci 23(2022). [Google Scholar]
- 29.Chen Y. et al. NLRP3 regulates alveolar bone loss in ligature-induced periodontitis by promoting osteoclastic differentiation. Cell Prolif 54, e12973 (2021). [DOI] [PMC free article] [PubMed] [Google Scholar]
- 30.Pourcet B. & Duez H. Circadian Control of Inflammasome Pathways: Implications for Circadian Medicine. Front Immunol 11, 1630 (2020). [DOI] [PMC free article] [PubMed] [Google Scholar]
- 31.Yim M. The Role of Toll-Like Receptors in Osteoclastogenesis. J Bone Metab 27, 227–235 (2020). [DOI] [PMC free article] [PubMed] [Google Scholar]
- 32.Zou N., Liu R. & Li C. Cathepsin K(+) Non-Osteoclast Cells in the Skeletal System: Function, Models, Identity, and Therapeutic Implications. Front Cell Dev Biol 10, 818462 (2022). [DOI] [PMC free article] [PubMed] [Google Scholar]
- 33.Jung S. et al. Analysis of fractalkine receptor CX(3)CR1 function by targeted deletion and green fluorescent protein reporter gene insertion. Mol Cell Biol 20, 4106–4114 (2000). [DOI] [PMC free article] [PubMed] [Google Scholar]
- 34.Logan R.W., Wynne O., Levitt D., Price D. & Sarkar D.K. Altered circadian expression of cytokines and cytolytic factors in splenic natural killer cells of Per1(−/−) mutant mice. J Interferon Cytokine Res 33, 108–114 (2013). [DOI] [PMC free article] [PubMed] [Google Scholar]
- 35.Capelle C.M. et al. Stress hormone signalling inhibits Th1 polarization in a CD4 T-cell-intrinsic manner via mTORC1 and the circadian gene PER1. Immunology 165, 428–444 (2022). [DOI] [PMC free article] [PubMed] [Google Scholar]
- 36.Yao Q., He L., Bao C., Yan X. & Ao J. The role of TNF-alpha in osteoporosis, bone repair and inflammatory bone diseases: A review. Tissue Cell 89, 102422 (2024). [DOI] [PubMed] [Google Scholar]
- 37.Li S., Liu G. & Hu S. Osteoporosis: interferon-gamma-mediated bone remodeling in osteoimmunology. Front Immunol 15, 1396122 (2024). [DOI] [PMC free article] [PubMed] [Google Scholar]
- 38.Srivastava R.K., Dar H.Y. & Mishra P.K. Immunoporosis: Immunology of Osteoporosis-Role of T Cells. Front Immunol 9, 657 (2018). [DOI] [PMC free article] [PubMed] [Google Scholar]
- 39.Zou W., Schwartz H., Endres S., Hartmann G. & Bar-Shavit Z. CpG oligonucleotides: novel regulators of osteoclast differentiation. FASEB J 16, 274–282 (2002). [DOI] [PubMed] [Google Scholar]
- 40.Zou W., Amcheslavsky A. & Bar-Shavit Z. CpG oligodeoxynucleotides modulate the osteoclastogenic activity of osteoblasts via Toll-like receptor 9. J Biol Chem 278, 16732–16740 (2003). [DOI] [PubMed] [Google Scholar]
- 41.Amcheslavsky A. & Bar-Shavit Z. Toll-like receptor 9 ligand blocks osteoclast differentiation through induction of phosphatase. J Bone Miner Res 22, 1301–1310 (2007). [DOI] [PubMed] [Google Scholar]
- 42.Madel M.B. et al. Immune Function and Diversity of Osteoclasts in Normal and Pathological Conditions. Front Immunol 10, 1408 (2019). [DOI] [PMC free article] [PubMed] [Google Scholar]
- 43.Hossain F.M., Hong Y., Jin Y., Choi J. & Hong Y. Physiological and Pathological Role of Circadian Hormones in Osteoarthritis: Dose-Dependent or Time-Dependent? J Clin Med 8(2019). [Google Scholar]
- 44.Binder N.B. et al. Estrogen-dependent and C-C chemokine receptor-2-dependent pathways determine osteoclast behavior in osteoporosis. Nat Med 15, 417–424 (2009). [DOI] [PubMed] [Google Scholar]
- 45.Khan U.A., Hashimi S.M., Bakr M.M., Forwood M.R. & Morrison N.A. CCL2 and CCR2 are Essential for the Formation of Osteoclasts and Foreign Body Giant Cells. J Cell Biochem 117, 382–389 (2016). [DOI] [PubMed] [Google Scholar]
- 46.Bozec A. et al. T cell costimulation molecules CD80/86 inhibit osteoclast differentiation by inducing the IDO/tryptophan pathway. Sci Transl Med 6, 235ra260 (2014). [Google Scholar]
- 47.Ofek O. et al. Peripheral cannabinoid receptor, CB2, regulates bone mass. Proc Natl Acad Sci U S A 103, 696–701 (2006). [DOI] [PMC free article] [PubMed] [Google Scholar]
- 48.Sophocleous A., Landao-Bassonga E., Van’t Hof R.J., Idris A.I. & Ralston S.H. The type 2 cannabinoid receptor regulates bone mass and ovariectomy-induced bone loss by affecting osteoblast differentiation and bone formation. Endocrinology 152, 2141–2149 (2011). [DOI] [PubMed] [Google Scholar]
- 49.Hegewald A.B. et al. Extracellular miR-574–5p Induces Osteoclast Differentiation via TLR 7/8 in Rheumatoid Arthritis. Front Immunol 11, 585282 (2020). [DOI] [PMC free article] [PubMed] [Google Scholar]
- 50.Ding P. et al. Toll-like receptor 9 deficiency induces osteoclastic bone loss via gut microbiotaassociated systemic chronic inflammation. Bone Res 10, 42 (2022). [DOI] [PMC free article] [PubMed] [Google Scholar]
Associated Data
This section collects any data citations, data availability statements, or supplementary materials included in this article.
Supplementary Materials
Data Availability Statement
RNA-seq data have been deposited to Gene Expression Omnibus (GEO) under the accession number of GSE283894 (Per1 cKO and control) and GSE292534 (Per2 cKO and control).