

Abstract
Recombination occurs at high frequencies in all examined retroviruses. The previously determined homologous recombination rate in one retroviral replication cycle is 4% for markers 1.0 kb apart in spleen necrosis virus (SNV). This has often been used to suggest that approximately 30 to 40% of the replication-competent viruses with 7- to 10-kb genomes undergo recombination. These estimates were based on the untested assumption that a linear relationship exists between recombination rates and marker distances. To delineate this relationship, we constructed three sets of murine leukemia virus (MLV)-based vectors containing the neomycin phosphotransferase gene (neo) and the hygromycin phosphotransferase B gene (hygro). Each set contained one vector with a functional neo and an inactivated hygro and one vector with a functional hygro and an inactivated neo. The two inactivating mutations in the three sets of vectors were separated by 1.0, 1.9, and 7.1 kb. Recombination rates after one round of replication were 4.7, 7.4, and 8.2% with markers 1.0, 1.9, and 7.1 kb apart, respectively. Thus, the rate of homologous recombination with 1.0 kb of marker distance is similar in MLV and SNV. The recombination rate increases when the marker distance increases from 1.0 to 1.9 kb; however, the recombination rates with marker distances of 1.9 and 7.1 kb are not significantly different. These data refute the previous assumption that recombination is proportional to marker distance and define the maximum recombining population in retroviruses.
Retroviruses package two copies of viral RNA into virions (7, 25). During reverse transcription, recombination occurs frequently and generates viral DNAs containing genetic information derived from both copies of RNA (4, 12). Recombination within the viral population increases variation by reassorting mutations; this process can generate viral strains that escape the host immune systems or resist the treatment of antiviral drugs (10, 21, 35). Recombination between related viruses can generate viral strains with a different host range or pathogenicity (24, 27, 36).
High frequencies of recombination have long been observed for many retroviruses (3, 10, 18, 19, 21, 26, 27, 41–43). Most of the earlier studies allowed multiple rounds of viral replication, making it difficult to quantify the recombination events (19, 26, 27). The rate of retroviral recombination in one viral replication cycle was 4% in spleen necrosis virus (SNV) with markers 1.0 kb apart (12). This rate has been used to estimate recombination in the overall genome by assuming that the recombination rate increases linearly with marker distance (6, 11, 39). Although this assumption seems logical, it has become increasingly clear with several current recombination studies that this assumption may not be accurate for two reasons. First, retroviral recombination exhibits high negative interference whereby recombinants with more than one template switch are generated at a higher rate than expected from independent recombination events (2, 13). Experimentally, recombinants are identified by the presence of markers from both parental RNAs. If an odd number of template switches occurs between the two markers, the resulting DNA has markers derived from both parents and would be identified as a recombinant. In contrast, if an even number of template switches occurs between the two markers, the resulting DNA has both markers derived from the same parent and would be identified as a nonrecombinant. It is possible that the opportunity for unobservable recombination increases with larger distances, which may influence the recombination rate. In addition, it has been recently postulated that recombination occurs in a distinct viral population (13); the size of this population is not defined. It is possible that the recombination rate may reach a plateau when the size of the recombining subpopulation is reached, regardless of the distance between markers. Taken together, it is not clear whether the rate of recombination should increase linearly with respect to the distance of the markers.
This study measured recombination rates with marker distances of 1.0, 1.9, and 7.1 kb in murine leukemia virus (MLV). These data were used to determine the relationship of recombination rate and marker distance and to measure the recombining subpopulation.
MATERIALS AND METHODS
Plasmid construction.
pJS30, pJA31-1kb, pJA32-1kb, pJS31, pJS32, pJS39, pJS41, and pJS42 were constructed by standard molecular cloning techniques (28). All plasmids were constructed by using pWH390, a derivative of pLAEN, as a backbone (1, 32). pWH390 was digested to completion with EcoRI, and the resulting 3′ ends were filled in by the Klenow fragment of Escherichia coli DNA polymerase I. To generate pJS30, the digested pWH390 was ligated to a 1.0-kb DNA fragment which contained the hygromycin phosphotransferase B gene (hygro) (9). pJA31-1kb was constructed by partial digestion of pJS30 with SacII, followed by the removal of the protruding 2 bp at the 3′ termini with T4 DNA polymerase and self-ligation; these procedures introduced a NaeI site in hygro. pJA32-1kb was constructed by partial digestion of pJS30 with NarI, an isoschizomer of EheI, followed by fill-in reaction with the Klenow enzyme and self-ligation; these procedures introduced a 4-bp insertion and generated a BssHII site in the neomycin phosphotransferase gene (neo) (16). pJS31 and pJS32 were derived by partially digesting pJS30 with NcoI followed by a Klenow fill-in reaction and self-ligation. These procedures introduced a 4-bp insertion and generated a unique NsiI site in hygro of pJS31 and neo of pJS32. An intermediate plasmid, pJS33, was next constructed by digesting pJS30 to completion with BamHI followed by a Klenow fill-in reaction. To generate pJS33, the digested pJS30 was ligated to a 2.5-kb Klenow enzyme-treated PvuII fragment of the β-galactosidase gene (β-gal) in the forward orientation (17). pJS39 was then constructed by complete digestion of pJS33 with ClaI followed by Klenow fill-in reaction and ligated to a 2.7-kb SmaI fragment of the murine Na+-K+-dependent ATPase gene in the forward orientation (22). pJS42 and pJS41 were derived by partially digesting pJS39 with NcoI followed by a Klenow fill-in reaction and self-ligation. These procedures introduced a 4-bp insertion and generated a unique NsiI site in hygro of pJS42 and neo of pJS41.
Cells, DNA transfections, and virus propagations.
All cells were obtained from the American Type Culture Collection. D17 is a dog osteosarcoma cell line permissive to infection by MLV (37). PG13 is a murine cell line that expresses MLV gag-pol and gibbon ape leukemia virus env (31). PA317 is a murine cell line which expresses MLV gag-pol and env (30).
All cells were grown in Dulbecco’s modified Eagle’s medium supplemented with either 6% calf serum for D17 cells or 10% calf serum for PG13 and PA317 cells. Cells were maintained in a 37°C incubator with 5% CO2. Hygromycin selection was performed at 120 μg/ml for D17 or PA317 cells and 300 μg/ml for PG13 cells. Selection with G418, a neomycin analog, was performed at 400 μg/ml for D17 or PA317 and 600 μg/ml for PG13. Double-drug selection was performed with 96 μg of hygromycin per ml plus 320 μg of G418 per ml for D17 and 240 μg of hygromycin per ml plus 480 μg of G418 per ml for PG13.
DNA transfections were done by the dimethyl sulfoxide-Polybrene or calcium phosphate precipitation method (20, 28). Viral infections were performed immediately following viral harvest. Viruses were collected from helper cells and centrifuged at 3,000 × g for 10 min to remove cellular debris. To determine the viral titers, 10-fold serial dilutions were made from each viral stock and used for infection.
Southern blot analysis.
Genomic DNA purification, digestion, and hybridization were performed by standard techniques (28). DNA transfers were done with a vacuum blotter (Pharmacia). All blots were hybridized with probe generated from a 1.9-kb NcoI fragment of pJS30. The probe was generated by labeling the DNA fragment with [α-32P]dCTP by the random-priming method (specific activity, >109 cpm per μg) (8). Southern hybridization results were obtained by autoradiography or PhosphorImager analysis (Molecular Dynamics).
RESULTS
Retroviral vectors used to determine the rates of homologous recombination.
To measure the frequency of homologous recombination with three different marker distances, three sets of retroviral vectors were constructed (Fig. 1). The first set of vectors (pJS30, pJA31-1kb, and pJA32-1kb) was used to determine the recombination rate with markers 1.0 kb apart. The second (pJS30, pJS31, and pJS32) and third (pJS39, pJS42, and pJS41) sets of vectors were used to determine the recombination rate with markers 1.9 and 7.1 kb apart, respectively (Fig. 1). Vectors within each set were highly homologous to each other. In addition to the cis-acting elements required for retroviral replication, all vectors contained hygro and neo. The viral U3-regulated transcripts expressed both hygro and neo; the translation of neo was directed by an internal ribosomal entry site (IRES) from encephalomyocarditis virus (1, 14, 15). The vector pJS30 contained a functional hygro and a functional neo. The vector pJA31-1kb contained a functional neo and a nonfunctional hygro with a 2-bp frameshift deletion. This deletion also destroyed a SacII site and generated a NaeI site. The vector pJA32-1kb contained a functional hygro and a nonfunctional neo with a 4-bp frameshift insertion. This insertion destroyed an EheI site and generated a BssHII site. The distance between the two inactivating mutations of pJA31-1kb and pJA32-1kb was 1.0 kb. The reversion rates of 4-bp frameshift mutations are less than 10−7 (12).
FIG. 1.
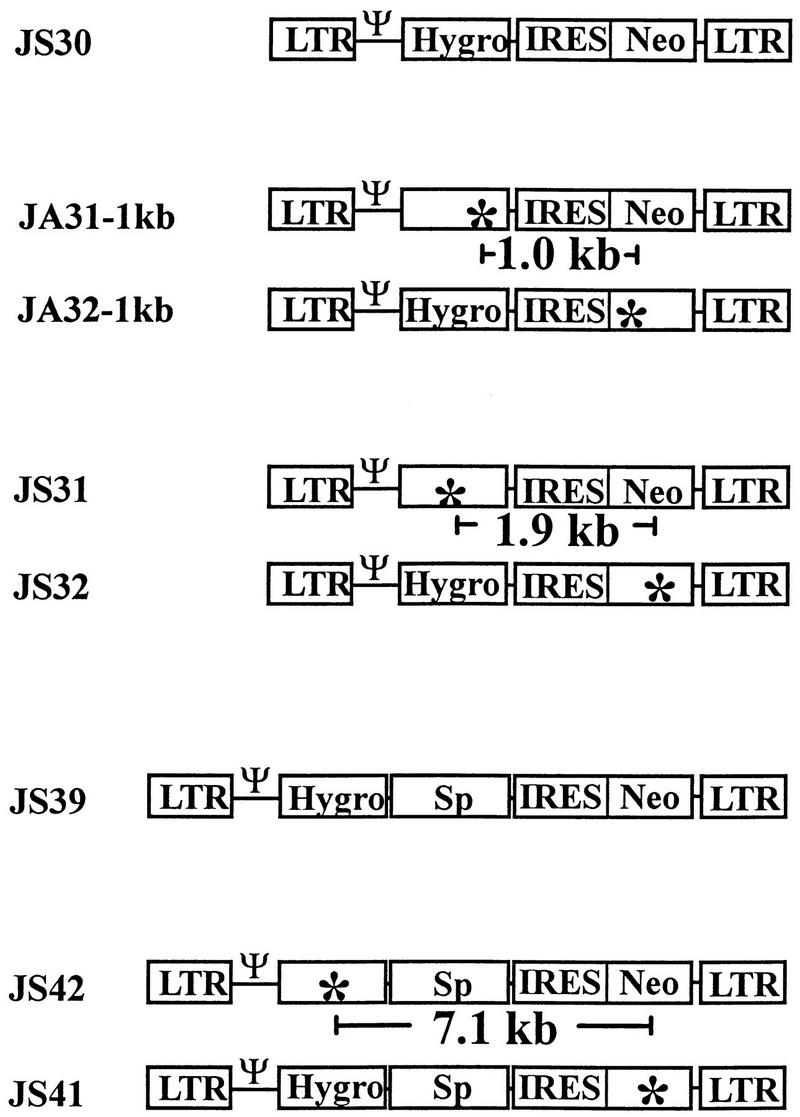
MLV vectors used to measure the recombination rates at marker distances of 1.0, 1.9, and 7.1 kb. Ψ, packaging signal; Hygro, hygromycin phosphotransferase B gene; Neo, neomycin phosphotransferase gene; Sp, spacer DNA; ✻, inactivating frameshift mutation.
The vectors pJS31 and pJS32 contained the same sequences as pJS30, except that pJS31 contained an inactivating mutation in hygro and pJS32 contained an inactivating mutation in neo. Each of these 4-bp insertion mutations destroyed an NcoI site and generated a unique NsiI site. The distance between the two inactivating mutations of pJS31 and pJS32 was 1.9 kb.
Similar to pJS30, pJS39 had a functional hygro and a functional neo. In addition, pJS39 contained a 5.2-kb spacer DNA comprised of a 2.5-kb sequence from β-gal and a 2.7-kb sequence from murine Na+-K+-dependent ATPase gene. The spacer DNA was located between hygro and the IRES; these sequences did not code for selectable genes and only served to increase the distance between hygro and neo. The vector pJS42 had a functional neo, whereas the vector pJS41 contained a functional hygro. The hygro of pJS42 and the neo of pJS41 were inactivated by a 4-bp insertion mutation that destroyed a NcoI site and generated a unique NsiI site. The distance between the two inactivating mutations of pJS42 and pJS41 was 7.1 kb.
Experimental protocol to measure the recombination rates in one round of replication.
The protocol used to determine the rate of homologous recombination at marker distance of 1.0 kb is outlined in Fig. 2. A similar protocol was used to measure recombination rates at marker distances of 1.9 and 7.1 kb. pJA31-1kb and pJA32-1kb were separately transfected into PA317 helper cells. The transfected cells were selected with either G418 or hygromycin, and the resulting colonies were pooled separately. The pool size for each vector was greater than 200 colonies. It has been previously shown that copackaging of two retroviral RNAs in one virion is a prerequisite for recombination (12, 43). Therefore, to allow JA31-1kb RNA and JA32-1kb RNA to package into the same virion, helper cells containing both vectors were generated. Viruses were harvested from the PA317 cell pools and introduced into PG13 cells either simultaneously (coinfection) or sequentially (step infection). Infected helper cells were subjected tohygromycin plus G418 selection to isolate double-drug-resistant cell clones. The proviral structures in these double-drug-resistant cell clones were verified by Southern hybridization analysis. Viruses were harvested from these PG13 cell clones containing an intact copy of JA31-1kb and JA32-1kb and were used to infect D17 target cells. Infected cells were subjected to single- (hygromycin or G418) or double- (hygromycin plus G418) drug selection, and the virus titers were determined. The recombination rates were calculated by comparing the double-drug-resistant colony titers to the single-drug-resistant colony titers (12). In addition, double-drug-resistant D17 cell clones were isolated and Southern hybridization analysis was performed to confirm the recombinant genotype of the proviruses.
FIG. 2.
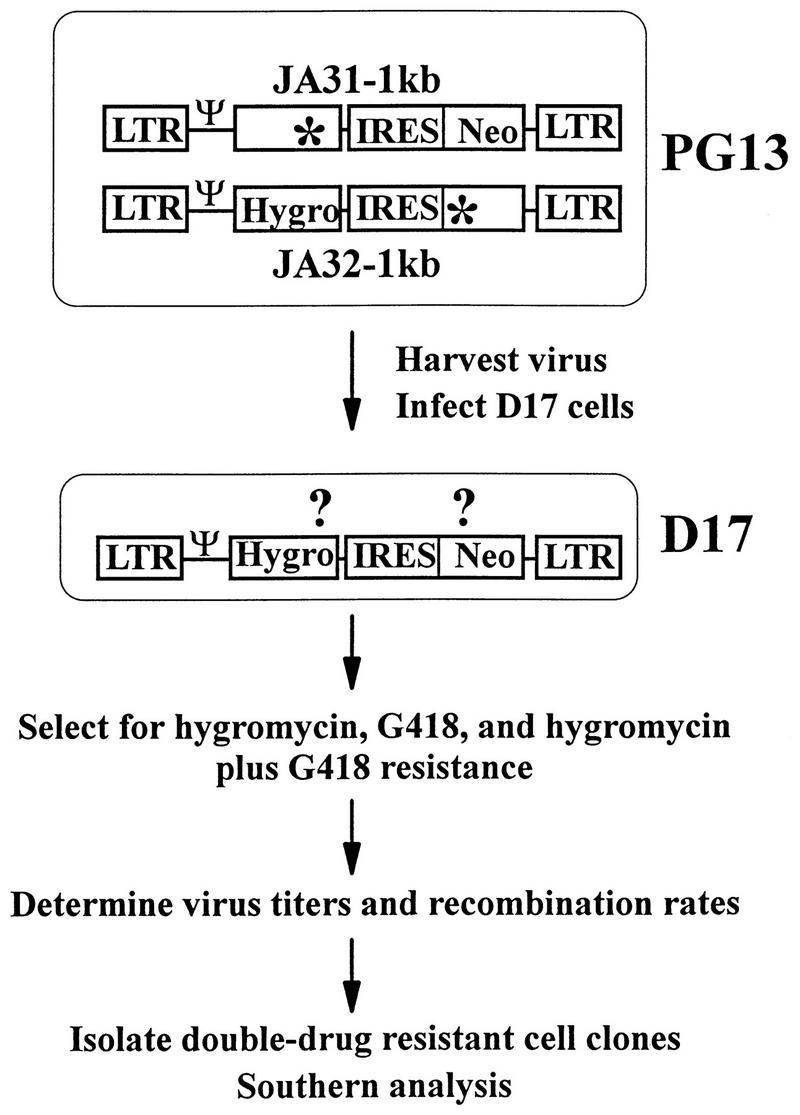
Experimental protocol to measure rates of recombination. Abbreviations and symbols are defined in the legend to Fig. 1.
This system measures recombination rates in a single cycle of retroviral replication, which is defined by the steps required from the provirus in the PG13 helper cells to the provirus in the D17 target cells. Since murine cells do not express the receptor for gibbon ape leukemia virus env, PG13 cells cannot be reinfected by the virus it produces. In addition, viruses cannot be propagated in the D17 cells due to the lack of helper cell function.
The control vectors generate similar single- and double-drug-resistant colony titers.
Since the single- and double-drug-resistant colony titers were used to calculate the recombination rates, it was important to determine whether the three different drug treatments generated similar viral titers in infected cells. The control vector JS30 was structurally similar to the vectors in which the markers were separated by 1.0 kb (JA31-1kb and JA32-1kb) and 1.9 kb (JS31 and JS32); however, JS30 contained a functional hygro and a functional neo. To determine the relative titers with hygromycin, G418, and hygromycin plus G418 selection with JS30, a protocol similar to that shown in Fig. 2 was utilized. Double-drug-resistant PG13 cell clones containing JS30 were isolated, and the proviral structures in these clones were examined by Southern hybridization analysis. Five cell clones were identified to contain one intact JS30 provirus; these cell clones were generated through independent infection events because the proviruses in these cells were integrated at different sites in the helper cell genome (data not shown). Viruses were harvested from these cell clones and used to infect D17 target cells. The virus titers generated from these five cell clones are shown in Table 1. Four of the five cell clones had the following ranges for titers: 3.1 × 10⁵ to 31 × 105 CFU/ml for hygromycin, 1.9 × 10⁵ to 20 × 105 CFU/ml for G418, and 2.9 × 10⁵ to 22 × 105 CFU/ml for hygromycin plus G418. One cell clone (P2C2) had unusually low virus titers (Table 1), most likely due to a lower level of helper cell function. However, within each cell clone, the two single- and the double-drug-resistant colony titers were very similar.
TABLE 1.
Virus titers generated from JS30-or JS39-infected PG13 cell clones
| Vector and clone | Titer (105 CFU/ml)
|
||
|---|---|---|---|
| Hygromycin | G418 | Hygromycin + G418 | |
| JS30 | |||
| P3C1 | 3.1 | 1.9 | 2.9 |
| P3C2 | 31 | 20 | 22 |
| P1C5 | 5.5 | 5.2 | 6.1 |
| P2C4 | 14 | 15 | 17 |
| P2C2 | 0.051 | 0.073 | 0.080 |
| JS39 | |||
| B1 | 1.9 | 2.2 | 3.4 |
| B3 | 3.7 | 4.6 | 4.5 |
| B4 | 5.4 | 5.0 | 6.6 |
| B5 | 1.1 | 0.84 | 1.2 |
| B6 | 2.5 | 1.2 | 2.0 |
The control vector JS39 was structurally similar to the vectors in which the markers were separated by 7.1 kb (JS41 and JS42); however, JS39 contains a functional hygro and a functional neo. Five independent PG13 cell clones containing an intact copy of JS39 were identified by Southern hybridization analysis using a strategy similar to that employed for JS30. Viral titers generated from these five cell clones are shown in Table 1. The hygromycin-resistant colony titers ranged from 1.1 × 10⁵ to 5.4 × 10⁵ CFU/ml, the G418-resistant colony titers ranged from 0.84 × 10⁵ to 5.0 × 10⁵ CFU/ml, and the hygromycin-plus-G418-resistant colony titers ranged from 1.2 × 10⁵ to 6.6 × 10⁵ CFU/ml. Similar to JS30, the titers generated within each cell clone for JS39 were comparable. These results indicate that the titers produced by each drug selection directly reflected the amount of cells infected with the control vectors. Therefore, the frequency of recombinants containing a functional hygro and a functional neo could be measured by comparing the double- and the single-drug-resistant colony titers.
Proviral DNA analysis of PG13 cells infected with JA31-1kb and JA32-1kb.
PG13 cell clones containing JA31-1kb and JA32-1kb were analyzed by Southern hybridization analysis to determine the proviral structures. Partial restriction enzyme maps of JS30, JA31-1kb, and JA32-1kb proviruses are shown in Fig. 3A. JS30 contained four EheI sites: one in each long terminal repeat (LTR), one in hygro, and one in neo. JA31-1kb proviruses had all four of the EheI sites, whereas JA32-1kb proviruses contained only three EheI sites, since one site was destroyed to inactivate neo. A unique SacII site was located in hygro of JS30 and JA32-1kb; this site was destroyed in JA31-1kb to inactivate hygro. When DNAs from cell clones containing a copy of JA31-1kb and a copy of JA32-1kb were digested with EheI and SacII, four bands were expected with a probe generated from a 1.9-kb DNA fragment. This DNA fragment contained the 3′ portion of hygro, IRES, and the 5′ portion of neo. A 1.8- and a 1.2-kb band were expected to be generated from the JA31-1kb provirus, whereas a 0.8- and a 2.2-kb band were expected to be generated from the JA32-1kb provirus (Fig. 3A). A representative Southern blot of three different cell clones (B2, C1, and D1) is shown in Fig. 3B. Each clone contained the expected fragments consistent with the predicted structures of JA31-1kb and JA32-1kb. In addition, DNAs from all cell clones were digested with HindIII to verify that cell clones were generated from independent infection events. A unique HindIII site was located in JS30, JA31-1kb, and JA32-1kb proviruses at the 5′ end of IRES. Therefore, with the aforementioned 1.9-kb probe, each provirus was expected to generate two bands when digested with HindIII. Because retroviruses integrate randomly in the host genome (6), the sizes of these bands should vary according to the site of integration. In the cell clones containing one copy of each vector, four bands of different size were expected to be generated when digested with HindIII. A representative HindIII digestion of DNA from three different PG13 cell clones is shown in Fig. 3B. All cell clones had a different band pattern, indicating that they were derived from independent infection events.
FIG. 3.
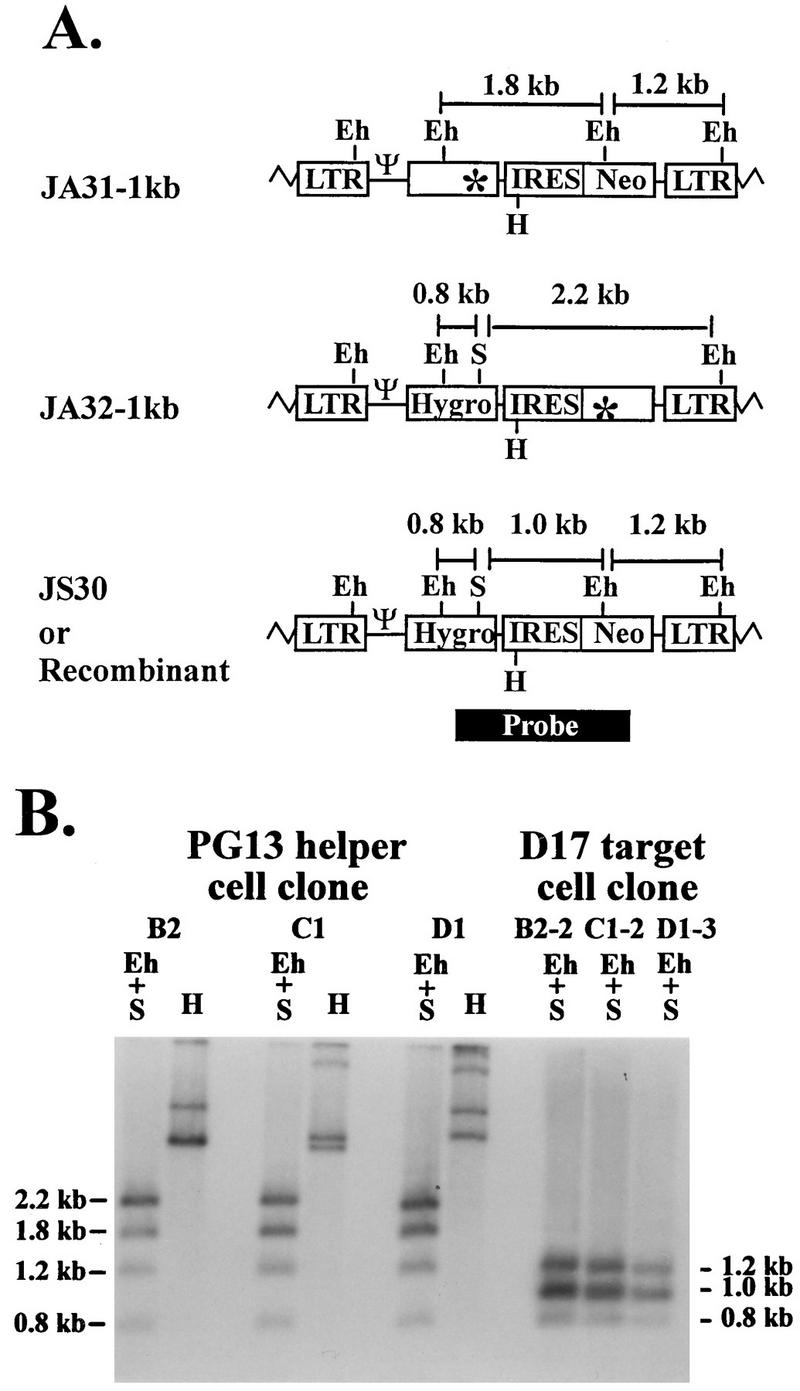
Proviral structures of JA31-1kb, JA32-1kb, and JS30. Recombinants with two functional drug resistance genes have the same structure as JS30 does. (A) Predicted proviral structures. Eh, EheI; S, SacII, H, HindIII. Zigzag lines represent host cell sequences. A 1.9-kb DNA fragment from JS30 (the black box labeled probe) was used for random-priming reaction to generate a probe for Southern hybridization analysis. (B) Southern hybridization analysis of the proviral structures in helper and target cell clones. B2, C1, and D1 are PG13 helper cell clones infected with JA31-1kb and JA32-1kb. B2-2, C1-2, and D1-3 are double-drug-resistant D17 cell clones infected with viruses harvested from B2, C1, and D1, respectively. Other abbreviations and symbols are defined in the legend to Fig. 1.
MLV recombination rate with markers separated by a distance of 1.0 kb.
Viruses harvested from five independent PG13 cell clones that contained a copy of JA31-1kb and a copy of JA32-1kb were used to infect target D17 cells. Infected target cells were subjected to hygromycin, G418, and hygromycin plus G418 selections. Virus titers generated from these five helper cell clones are shown in Table 2. The hygromycin-resistant colony titers ranged from 2.0 × 10⁶ to 5.2 × 10⁶ CFU/ml, the G418-resistant colony titers ranged from 1.4 × 10⁶ to 4.3 × 10⁶ CFU/ml, and the hygromycin-plus-G418-resistant colony titers ranged from 3.3 × 10⁴ to 8.0 × 10⁴ CFU/ml.
TABLE 2.
Virus titers generated from PG13 cell clones coinfected with JA31-1kb and JA32-1kb
| Clone | Titer (CFU/ml)
|
Recombination rate (%) | ||
|---|---|---|---|---|
| Hygromycin (106) | G418 (106) | Hygromycin + G418 (104) | ||
| B2 | 5.2 | 2.9 | 8.0 | 5.5 |
| C1 | 2.7 | 3.4 | 6.6 | 4.9 |
| C2 | 4.4 | 1.4 | 4.2 | 6.0 |
| D1 | 2.3 | 4.3 | 3.6 | 3.1 |
| D2 | 2.0 | 1.7 | 3.3 | 3.9 |
| Avg ± SE | 4.7 ± 0.7 | |||
Cell clones that were resistant to hygromycin and G418 could either contain a copy of each parental virus or contain a recombinant provirus with a functional hygro and a functional neo. Several hygromycin-plus-G418-resistant D17 cell clones were isolated, and proviral structures were analyzed. A representative Southern blot is shown in Fig. 3B of three D17 cell clones (B2-2, C1-2, and D1-3), each derived from a PG13 cell clone, which is also shown. If the double-drug-resistant target cell clones contained a copy of each parental virus, after digestion with EheI plus SacII, a pattern similar to the PG13 helper cell clones would be expected (Fig. 3B). However, when digested with EheI plus SacII, the recombinant proviruses with a functional hygro and a functional neo should generate bands of 0.8, 1.0, and 1.2 kb, using the 1.9-kb probe described above (Fig. 3A). A total of 15 double-drug-resistant D17 cell clones were examined; 13 contained a recombinant genotype, whereas 2 were the result of a double infection (Fig. 3B and data not shown). These results demonstrate that most of the cell clones with hygromycin plus G418 resistance contained recombinant proviruses. Therefore, the double-drug-resistant colony titers were generated by recombinants.
The double-drug-resistant colony titer measured only half of the recombinants, those with a functional hygro and a functional neo. The other recombinants with a nonfunctional hygro and a nonfunctional neo cannot survive drug selection and therefore were not measured in this assay. The recombination rate for each cell clone was calculated by first dividing the double-drug-resistant colony titers by the lower of the two single-drug-resistant colony titers and then multiplying this ratio by 2 (Table 2). The recombination rates for the five cell clones ranged from 3.1 to 6.0%, with an average of 4.7% ± 0.7% (standard error [SE]).
Proviral DNA analysis of PG13 cells infected with JS31 and JS32.
PG13 cell clones containing JS31 and JS32 were generated to measure the recombination rate for markers separated by a distance of 1.9 kb. These cell clones were analyzed by Southern hybridization analysis to determine the proviral structures. Partial restriction enzyme maps of JS30, JS31, and JS32 proviruses are shown in Fig. 4A. JS30 with a functional hygro and a functional neo contained two NcoI sites (one in each drug resistance gene). JS31 and JS32 proviruses contained only one NcoI site each, since this site was destroyed to inactivate hygro in JS31 and neo in JS32. In addition, JS30, JS31, and JS32 contained four EcoRV sites, two in each LTR. When DNAs from cell clones containing a copy of JS31 and a copy of JS32 were digested with NcoI plus EcoRV, two bands were expected with the probe described earlier. A 3.5- and a 2.3-kb band were expected to be generated from JS31 and JS32 proviruses, respectively (Fig. 4A). A representative Southern blot of three different PG13 cell clones (A1, D1, and E5) is shown in Fig. 4B; each cell clone contained the expected bands. In addition, all DNAs were digested with HindIII to confirm that these cell clones were generated through independent infection events (Fig. 4B and data not shown).
FIG. 4.

Proviral structures of JS31, JS32, and JS30 (recombinant). (A) Predicted proviral structures. E, EcoRV; N, NcoI. Although each LTR contains two EcoRV sites, only one site in each LTR is shown for simplicity. (B) Southern hybridization analysis of the proviral structures in helper and target cell clones. A1, D1, and E5 are PG13 helper cell clones infected with JS31 and JS32. A1-1, D1-4, and E5-2 are double-drug-resistant D17 cell clones infected with viruses harvested from A1, D1, and E5, respectively. Other abbreviations and symbols are defined in the legends to Fig. 1 and 3.
MLV recombination rate with markers separated by a distance of 1.9 kb.
Viruses harvested from eight independent PG13 cell clones that contained a copy of JS31 and a copy of JS32 were used to infect D17 target cells. Viral titers are shown in Table 3. The hygromycin-resistant colony titers ranged from 0.43 × 10⁶ to 2.1 × 10⁶ CFU/ml, the G418-resistant colony titers ranged from 0.15 × 10⁶ to 1.2 × 10⁶ CFU/ml, and the hygromycin-plus-G418-resistant colony titers ranged from 0.6 × 10⁴ to 4.4 × 10⁴ CFU/ml. The recombination rate measured from these eight cell clones ranged from 3.3 to 10.5%, with an average of 7.4% ± 0.6% (SE).
TABLE 3.
Virus titers generated from PG13 cell clones coinfected with JS31 and JS32
| Clone | Titer (CFU/ml)
|
Recombination rate (%) | ||
|---|---|---|---|---|
| Hygromycin (106) | G418 (106) | Hygromycin + G418 (104) | ||
| Q2C2 | 2.1 | 1.2 | 4.4 | 7.3 |
| Q2C5 | 1.4 | 0.78 | 4.1 | 10.5 |
| E5 | 0.60 | 0.78 | 1.0 | 3.3 |
| C3 | 0.43 | 0.15 | 0.6 | 8.0 |
| D1 | 0.88 | 0.34 | 1.4 | 8.2 |
| F2 | 0.72 | 0.30 | 1.1 | 7.3 |
| A1 | 0.59 | 0.31 | 1.1 | 7.1 |
| B4 | 0.43 | 0.26 | 1.0 | 7.7 |
| Avg ± SE | 7.4 ± 0.6 | |||
To verify that the double-drug-resistant colony titer was generated by recombinant proviruses, hygromycin-plus-G418-resistant D17 cell clones were isolated, and the proviral structures were analyzed. A representative Southern analysis is shown in Fig. 4B for three D17 cell clones (A1-1, D1-4, and E5-2), each derived from a PG13 cell clone, which is also shown. When digested with EcoRV plus NcoI, the recombinant provirus containing a functional hygro and a functional neo should reveal a single 1.9-kb band (Fig. 4A). A total of nine double-drug-resistant D17 cell clones were examined; all nine had a single 1.9-kb band, indicating that they contained a recombinant provirus (Fig. 4B and data not shown). Therefore, the double-drug-resistant colony titer was an accurate measurement of the number of recombinants.
Proviral DNA analysis of PG13 cell clones infected with JS41 and JS42.
To measure the rate of recombination at 7.1-kb marker distance, PG13 cell clones containing JS41 and JS42 were generated. Southern hybridization analysis was used to determine the proviral structures. Partial restriction enzyme maps of JS39, JS41, and JS42 are shown in Fig. 5A. JS39 proviruses contained two NcoI sites, one in each drug resistance gene. One NcoI site was destroyed to inactivate hygro in JS42, and one NcoI site was destroyed to inactivate neo in JS41. Therefore, JS41 and JS42 each contained only one NcoI site. In addition, JS39, JS41, and JS42 each contained five EcoRV sites: two in each LTR and one in the spacer DNA. When DNAs from these cell clones containing a copy of JS41 and a copy of JS42 were digested with EcoRV plus NcoI, four bands were expected when the probe described above was used. JS41 proviruses should generate a 4.3- and a 3.2-kb band, whereas JS42 proviruses should generate a 5.9- and a 2.8-kb band (Fig. 5A). A representative Southern blot of three different cell clones (U5, U8, and V3) is shown in Fig. 5B; each clone contained the expected fragments consistent with the predicted structures of JS41 and JS42. In addition, all DNAs were digested with HindIII as described earlier to confirm that cell clones were generated through independent infection events (Fig. 5B and data not shown).
FIG. 5.
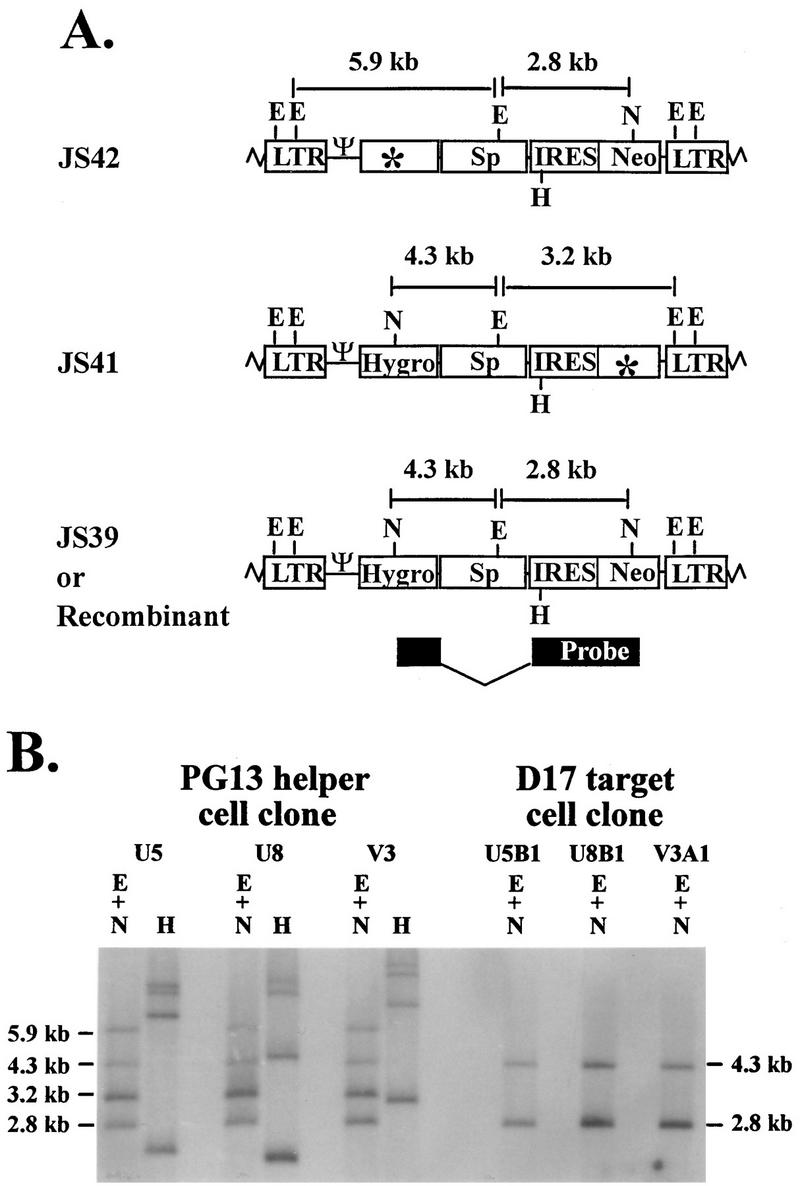
Proviral structures of JS41, JS42, and JS39 (recombinant). (A) Predicted proviral structures. E, EcoRV; N, NcoI. Although each LTR contains two EcoRV sites, only one site in each LTR is shown for simplicity. (B) Southern hybridization analysis of the proviral structures in helper and target cell clones. U5, U8, and V3 are PG13 helper cell clones infected with JS41 and JS42, whereas U5B1, U8B1, and V3A1 are double-drug-resistant D17 cell clones infected with viruses harvested from the above-described helper cell clones, respectively. Other abbreviations and symbols are defined in the legends to Fig. 1 and 3.
MLV recombination rate with markers separated by a distance of 7.1 kb.
Viruses harvested from four independent PG13 cell clones containing a copy of JS41 and a copy of JS42 were used to infect D17 target cells. Viral titers are shown in Table 4. The hygromycin-resistant colony titers ranged from 3.7 × 10⁵ to 14.5 × 10⁵ CFU/ml, the G418-resistant colony titers ranged from 1.2 × 10⁵ to 5.4 × 10⁵ CFU/ml, and the hygromycin-plus-G418-resistant colony titers ranged from 0.47 × 10⁴ to 2.6 × 10⁴ CFU/ml. The recombination rate from these four cell clones ranged from 5.9 to 11.6%, with an average of 8.2% ± 0.8% (SE).
TABLE 4.
Virus titers generated from PG13 cell clones coinfected with JS41 and JS42
| Clone | Titer (CFU/ml)
|
Recombination rate (%) | ||
|---|---|---|---|---|
| Hygromycin (105) | G418 (105) | Hygromycin + G418 (104) | ||
| U4 | 8.4 | 4.2 | 1.6 | 7.6 |
| U5 | 14.5 | 4.5 | 2.6 | 11.6 |
| U8 | 5.9 | 1.2 | 0.47 | 7.8 |
| V3 | 3.7 | 5.4 | 1.1 | 5.9 |
| Avg ± SE | 8.2 ± 0.8 | |||
The proviral structures in double-drug-resistant D17 cells were examined. Figure 5B shows a representative Southern blot of three D17 cell clones (U5B1, U8B1, and V3A1), each derived from a PG13 cell clone, which is also shown. With the earlier-described probe, a 4.3- and a 2.3-kb band should be generated from the recombinant provirus when digested with EcoRV plus NcoI (Fig. 5A). A total of 16 double-drug-resistant D17 cell clones were examined; 15 contained a recombinant provirus, whereas 1 was the result of a double-infection event (Fig. 5B and data not shown). Therefore, the double-drug-resistant colony titers reflected the number of recombinant proviruses with functional hygro and neo.
DISCUSSION
MLV and SNV have similar recombination rates.
In this report, the MLV recombination rate in one round of retroviral replication is 4.7% with a marker distance of 1.0 kb; this rate is not significantly different from the SNV recombination rate (P = 0.13 by two-sample t test). These data are in sharp contrast to the estimated recombination rate of 0.002 to 0.054% with two markers 0.56 kb apart in MLV (38). In the previous MLV study, two vectors with mutations at different regions of neo were used. Recombination was detected by the generation of viruses with a functional neo. Because neither parental virus could confer any drug resistance, their titers could not be measured. Instead, the titer of a structurally similar virus with a functional neo was measured in a separate experiment and was used to derive the parental titer. The recombination rate was estimated from the derived parental titer. In contrast, the current study directly measured both the parental and recombinant titers in each experimental set. Therefore, the current study is more likely to be accurate because the recombination rates were directly determined and not estimated. Although unlikely, an alternate possibility is that both measurements are correct; recombination rates drop 2 to 3 orders of magnitude for marker distances of 1.0 to 0.56 kb.
We demonstrated that the recombination rate is similar between MLV and SNV, two simple retroviruses (5, 40). Currently, the recombination rates of complex retroviruses such as human immunodeficiency virus type 1 (HIV-1) have not been determined. The mutation rates of SNV and HIV-1 are within twofold (23, 29, 33, 34). However, it is not known whether the recombination rates of simple and complex retroviruses are similar.
Nonlinear relationship between marker distances and recombination rates.
Homologous recombination rates at three marker distances in MLV are plotted in Fig. 6; marker distances are indicated on the x axis, and recombination rates are indicated on the y axis. The recombination rates between markers separated by distances of 1.0 kb (4.7%) and 1.9 kb (7.4%) are significantly different (P = 0.018 by two-sample t test). These data indicate that as the distance between markers increases from 1.0 to 1.9 kb, the recombination rate also increases. If the recombination rate increases in linear proportion to marker distance, then by extrapolating the rates at 1.9 or 1.0 kb, the expected recombination rate at 7.1 kb would range from 27.6 to 33.4% (7.4% ÷ 1.9 kb × 7.1 kb = 27.6%; 4.7% ÷ 1.0 kb × 7.1 kb = 33.4%). However, the recombination rate with a marker distance of 7.1 kb is 8.2%, which is not significantly different from the rate with a marker distance of 1.9 kb (7.4%) (P = 0.59 by two-sample t test). This indicates that by the marker distance of 1.9 kb, the recombination rate plateaus and does not increase significantly when the marker distance increases. This is the first demonstration that the relationship between the rate of homologous recombination and marker distance is not always linear.
FIG. 6.

Nonlinear relationship between recombination rate and marker distance. The means ± SE at the three marker distances are indicated.
The mechanism for the plateau of the recombination rate is not clear. It is possible that the probability of the unobservable double-recombination events also increases with larger marker distances. Recent experimental evidence indicates that the majority of retroviral recombination occurs by reverse transcriptase switching templates during minus-strand DNA synthesis (2). When two template switches occur between two markers, the resulting DNA would obtain both markers from the same parent and appear to be a nonrecombinant. After the marker distance reaches a certain point, the probability of the viruses undergoing two template switches also increases. Thus, the observed recombination rate may not be significantly altered even with a larger marker distance and reach a plateau. A second possibility for the plateau is that the size of the recombining viral subpopulation may limit the recombination rate. If only a small percentage of viruses can undergo recombination, then the rate cannot exceed this viral population. Although unlikely, we also cannot exclude the possibility that the spacer sequences in JS39-derived vectors inhibit recombination and thus lead to the appearance of a plateau.
Maximum recombination rate and size of the recombining subpopulation in MLV.
Previously, we postulated that recombination occurs in a distinct viral subpopulation (13). In this report we used the 7.1-kb marker distance to approximate the length of a wild-type MLV (8.3 kb) to determine the maximum recombination rate and the size of the recombining subpopulation.
In an ideal viral population generated from a cell containing two different proviruses, 50% of the viruses will be heterozygotes if the two parents have similar titers and packaging is random (11, 12). If all of the heterozygotes generate recombinant genotypes, then 50% of the recombinants will contain two functional drug resistance genes, and the other 50% of the recombinants will contain two nonfunctional drug resistance genes. Since double-drug selection is used to identify recombinants, only half of the recombinant population, or 25% of the total viral population (50% × 50%), can be measured. Single-drug selection measures the recombinant with two functional drug resistance genes (25%) and the nonrecombinant generated from homozygotic virions (25%). The recombination rate is calculated by doubling the ratio of the double-drug-resistant colony titer to the single-drug-resistant colony titer. Thus, the maximum recombination rate is 100% (2 × 25% ÷ 50%). We observed a rate of 8.2% with approximately the maximum marker distance. Therefore, the minimum estimation of the recombining subpopulation is 8% of the heterozygotes or 4% of the total viral population. Recombinants with an even number of template switches between markers do not have a recombinant phenotype. Recombinants with an even number and odd number of template switches may occur at the same frequency. Therefore, the recombining subpopulation can be as high as 16% of the heterozygotes or 8% of the total viral population. This is the first measurement of the retroviral recombining subpopulation.
Previously, it was thought that all of the heterozygotic population (50%) can undergo observable recombination. Our estimation indicates that the recombining subpopulation is only one-sixth the size of the previously calculated population (8% ÷ 50%). What are the possible mechanisms to cause the smaller recombination population size? We previously proposed that a subpopulation of viruses contains a different structure of the reverse transcription complex. This allows the reverse transcriptase access to the other copackaged RNA and generates recombinant progeny (13). Alternatively, the heterozygotic population may be less than 50%, which would effectively reduce the recombining subpopulation. It should be noted that in each vector set, the two parental vectors produce very similar titers in most cell clones (Tables 2, 3, and 4). In addition, the two parental viral RNAs have extremely high homology (>99.9%); therefore, the viral packaging machinery should not be able to distinguish the two RNAs. Although it is conceivable that mRNA can be transported to different cellular compartments and cause the heterozygotes to form at less than 50%, currently there is little evidence supporting this hypothesis.
If packaging of the two parental RNAs is not random, then it is likely that the heterozygote population size may be reduced and subsequently decrease the recombining subpopulation. One possible scenario is that when the two parental RNAs have different sequences in the coding regions, the viral machinery may not form heterozygotes at 50% frequency. This may account for the lower rate observed in a previous nonhomologous recombination study in MLV (44); recombination occurred at 0.2% when a 830-nucleotide homology was present in the two viruses containing different drug resistance genes. This rate is 1 order of magnitude lower than the rate of homologous recombination with a marker distance of 1.0 kb between the two vectors containing nearly identical sequences. It is possible that the lower frequency of nonhomologous recombination is caused by a factor(s), such as the relative position of the homology or the nature of the sequences. However, it is provocative to postulate that the differences between the two rates are based on the differences in heterozygote formation and the size of the recombining subpopulation.
ACKNOWLEDGMENTS
We thank Gerry Hobbs from the Department of Computer Sciences and Statistics and the Department of Community Medicine for assistance with statistical analysis. We thank John Snyder for assistance with vector construction. We thank Ben Beasley, Jeanine Certo, Que Dang, Krista Delviks, Lou Halvas, and Wen-Hui Zhang for critical readings of the manuscript. A special acknowledgment goes to Vinay Pathak for intellectual input throughout this project and critical reading of the manuscript.
This project is supported by CA-58345 to W.-S.H. J.A.A. and E.H.B. are supported by the Medical Scientist Training Program from the West Virginia University School of Medicine.
REFERENCES
- 1.Adam M A, Ramesh N, Miller A D, Osborne W R A. Internal initiation of translation in retroviral vectors carrying picornavirus 5′ nontranslated regions. J Virol. 1991;65:4985–4990. doi: 10.1128/jvi.65.9.4985-4990.1991. [DOI] [PMC free article] [PubMed] [Google Scholar]
- 2.Anderson J A, Teufel II R J, Yin P D, Hu W-S. Correlated template-switching events during minus-strand DNA synthesis: a mechanism for high negative interference during retroviral recombination. J Virol. 1998;72:1186–1194. doi: 10.1128/jvi.72.2.1186-1194.1998. [DOI] [PMC free article] [PubMed] [Google Scholar]
- 3.Clavel F, Hoggan M D, Willey R L, Strebel K, Martin M A, Repaske R. Genetic recombination of human immunodeficiency virus. J Virol. 1989;63:1455–1459. doi: 10.1128/jvi.63.3.1455-1459.1989. [DOI] [PMC free article] [PubMed] [Google Scholar]
- 4.Coffin J M. Structure, replication, and recombination of retrovirus genomes: some unifying hypotheses. J Gen Virol. 1979;42:1–26. doi: 10.1099/0022-1317-42-1-1. [DOI] [PubMed] [Google Scholar]
- 5.Coffin J M. Structure and classification of retroviruses. In: Levy J A, editor. The retroviridae. New York, N.Y: Plenum Press; 1992. pp. 19–49. [Google Scholar]
- 6.Coffin J M. Retroviridae: the viruses and their replication. In: Fields B N, Knipe D M, Howley P M, editors. Fields virology. Vol. 3. New York, N.Y: Raven Press; 1996. pp. 1767–1848. [Google Scholar]
- 7.Duesberg P H. Physical properties of Rous sarcoma virus RNA. Proc Natl Acad Sci USA. 1968;60:1511–1518. doi: 10.1073/pnas.60.4.1511. [DOI] [PMC free article] [PubMed] [Google Scholar]
- 8.Feinberg A P, Vogelstein B. A technique for radiolabeling DNA restriction endonuclease fragments to high specific activity. Anal Biochem. 1983;132:6–13. doi: 10.1016/0003-2697(83)90418-9. [DOI] [PubMed] [Google Scholar]
- 9.Gritz L, Davies J. Plasmid encoded hygromycin-b resistance: the sequence of hygromycin-b phosphotransferase and its expression. Gene. 1979;25:179–188. doi: 10.1016/0378-1119(83)90223-8. [DOI] [PubMed] [Google Scholar]
- 10.Gu Z, Gao O, Faust E A, Wainberg M A. Possible involvement of cell fusion and viral recombination in generation of human immunodeficiency virus variants that display dual resistance to AZT and 3TC. J Gen Virol. 1995;76:2601–2605. doi: 10.1099/0022-1317-76-10-2601. [DOI] [PubMed] [Google Scholar]
- 11.Hu W-S, Temin H M. Retroviral recombination and reverse transcription. Science. 1990;250:1227–1233. doi: 10.1126/science.1700865. [DOI] [PubMed] [Google Scholar]
- 12.Hu W-S, Temin H M. Genetic consequences of packaging two RNA genomes in one retroviral particle: pseudodiploidy and high rate of genetic recombination. Proc Natl Acad Sci USA. 1990;87:1556–1560. doi: 10.1073/pnas.87.4.1556. [DOI] [PMC free article] [PubMed] [Google Scholar]
- 13.Hu W-S, Bowman E H, Delviks K A, Pathak V K. Homologous recombination occurs in a distinct retroviral subpopulation and exhibits high negative interference. J Virol. 1997;71:6028–6036. doi: 10.1128/jvi.71.8.6028-6036.1997. [DOI] [PMC free article] [PubMed] [Google Scholar]
- 14.Jang S K, Krausslich H G, Nicklin M J H, Duke G M, Palmenberg A C, Wimmer E. A segment of the 5′ nontranslated region of encephalomyocarditis virus RNA directs internal entry of ribosomes during in vitro translation. J Virol. 1988;62:2636–2643. doi: 10.1128/jvi.62.8.2636-2643.1988. [DOI] [PMC free article] [PubMed] [Google Scholar]
- 15.Jang S K, Davies M V, Kaufman R J, Wimmer E. Initiation of protein synthesis by internal entry of ribosomes into the 5′ nontranslated region of encephalomyocarditis virus RNA in vivo. J Virol. 1989;63:1651–1660. doi: 10.1128/jvi.63.4.1651-1660.1989. [DOI] [PMC free article] [PubMed] [Google Scholar]
- 16.Jorgensen R A, Rothstein S J, Reznikoff W J. A restriction enzyme cleavage map of Tn5 and location of a region encoding neomycin resistance. Mol Cell Genet. 1979;117:65–72. doi: 10.1007/BF00267254. [DOI] [PubMed] [Google Scholar]
- 17.Julias J G, Kim T, Arnold G, Pathak V K. The antiretrovirus drug 3′-azido-3′-deoxythymidine increases the retrovirus mutation rate. J Virol. 1997;71:4254–4263. doi: 10.1128/jvi.71.6.4254-4263.1997. [DOI] [PMC free article] [PubMed] [Google Scholar]
- 18.Katz R A, Skalka A M. Genetic diversity in retroviruses. Annu Rev Genet. 1990;24:409–445. doi: 10.1146/annurev.ge.24.120190.002205. [DOI] [PubMed] [Google Scholar]
- 19.Kawai S, Hanafusa H. Genetic recombination with avian tumor virus. Virology. 1972;49:37–44. doi: 10.1016/s0042-6822(72)80005-9. [DOI] [PubMed] [Google Scholar]
- 20.Kawai S, Nishizawa M. New procedure for DNA transfection with polycation and dimethyl sulfoxide. Mol Cell Biol. 1984;4:1172–1174. doi: 10.1128/mcb.4.6.1172. [DOI] [PMC free article] [PubMed] [Google Scholar]
- 21.Kellam P, Larder B A. Retroviral recombination can lead to linkage of reverse transcriptase mutations that confer increased zidovudine resistance. J Virol. 1994;69:669–674. doi: 10.1128/jvi.69.2.669-674.1995. [DOI] [PMC free article] [PubMed] [Google Scholar]
- 22.Kent R B, Emanuel J R, Neriah Y B, Levenson R, Housman D E. Ouabain resistance conferred by expression of the cDNA for a murine Na+-K+-ATPase α subunit. Science. 1987;237:901–903. doi: 10.1126/science.3039660. [DOI] [PubMed] [Google Scholar]
- 23.Kim T, Mudry R A, Jr, Rexrode II C A, Pathak V K. Retroviral mutation rates and A-to-G hypermutations during different stages of retroviral replication. J Virol. 1996;70:7594–7602. doi: 10.1128/jvi.70.11.7594-7602.1996. [DOI] [PMC free article] [PubMed] [Google Scholar]
- 24.Kozak C A, Ruscetti S. Retroviruses in rodents. In: Levy J A, editor. The retroviridae. New York, N.Y: Plenum Press; 1992. pp. 405–481. [Google Scholar]
- 25.Kung H-J, Bailey J M, Davidson N, Vogt P K, Nicolson M O, McAllister R M. Electron microscope studies of tumor virus RNA. Cold Spring Harbor Quant Biol. 1975;39:827–834. doi: 10.1101/sqb.1974.039.01.096. [DOI] [PubMed] [Google Scholar]
- 26.Linial M, Brown S. High frequency of recombination with the gag gene of Rous sarcoma virus. J Virol. 1979;31:257–260. doi: 10.1128/jvi.31.1.257-260.1979. [DOI] [PMC free article] [PubMed] [Google Scholar]
- 27.Linial M, Blair D. Genetics of retroviruses. In: Weiss R, Teich N, Varmus H, Coffin J, editors. RNA tumor viruses. New York, N.Y: Cold Spring Harbor Laboratory; 1985. pp. 147–185. [Google Scholar]
- 28.Maniatis T, Fritsch E F, Sambrook J. Molecular cloning: a laboratory manual. Cold Spring Harbor, N.Y: Cold Spring Harbor Laboratory; 1982. [Google Scholar]
- 29.Mansky L M, Temin H M. Lower in vivo mutation rate of human immunodeficiency virus type 1 than that predicted from the fidelity of purified reverse transcriptase. J Virol. 1995;69:5087–5094. doi: 10.1128/jvi.69.8.5087-5094.1995. [DOI] [PMC free article] [PubMed] [Google Scholar]
- 30.Miller A D, Buttimore C. Redesign of retrovirus packaging cell lines to avoid recombination leading to helper virus production. Mol Cell Biol. 1986;6:2895–2902. doi: 10.1128/mcb.6.8.2895. [DOI] [PMC free article] [PubMed] [Google Scholar]
- 31.Miller A D, Garcia J V, von Suhr N, Lynch C M, Wilson C, Eiden M V. Construction and properties of retrovirus packaging cells based on gibbon ape leukemia virus. J Virol. 1991;65:2220–2224. doi: 10.1128/jvi.65.5.2220-2224.1991. [DOI] [PMC free article] [PubMed] [Google Scholar]
- 32.Miller A D, Rosman G J. Improved retroviral vectors for gene transfer and expression. BioTechniques. 1989;7:980–990. [PMC free article] [PubMed] [Google Scholar]
- 33.Pathak V K, Temin H M. Broad spectrum of in vivo forward mutations, hypermutations, and mutational hotspots in a retroviral shuttle vector after a single replication cycle: substitutions, frameshifts, and hypermutations. Proc Natl Acad Sci USA. 1990;87:6019–6023. doi: 10.1073/pnas.87.16.6019. [DOI] [PMC free article] [PubMed] [Google Scholar]
- 34.Pathak V K, Temin H M. Broad spectrum of in vivo forward mutations, hypermutations, and mutational hotspots in a retroviral shuttle vector after a single replication cycle: deletions and deletions with insertions. Proc Natl Acad Sci USA. 1990;87:6024–6028. doi: 10.1073/pnas.87.16.6024. [DOI] [PMC free article] [PubMed] [Google Scholar]
- 35.Phillips R E, Rowland-Jones S, Nixon D F, Gotch F M, Edwards J P, Ogunlesi A O, Elvin J G, Rothbard J A, Bangham C R M, Rizza C R, McMichael A J. Human immunodeficiency virus genetic variation that can escape cytotoxic T cell recognition. Nature. 1991;354:453–459. doi: 10.1038/354453a0. [DOI] [PubMed] [Google Scholar]
- 36.Purcell D F J, Broscius C M, Vanin E F, Buckler C E, Nienhuis A W, Martin M A. An array of murine leukemia virus-related elements is transmitted and expressed in a primate recipient of retroviral gene transfer. J Virol. 1996;70:887–897. doi: 10.1128/jvi.70.2.887-897.1996. [DOI] [PMC free article] [PubMed] [Google Scholar]
- 37.Riggs J L, McAllister R M, Lennette E H. Immunofluorescent studies of RD-114 virus replication in cell culture. J Gen Virol. 1974;25:21–29. doi: 10.1099/0022-1317-25-1-21. [DOI] [PubMed] [Google Scholar]
- 38.Stuhlmann H, Berg P. Homologous recombination of copackaged retrovirus RNAs during reverse transcription. J Virol. 1992;66:2378–2388. doi: 10.1128/jvi.66.4.2378-2388.1992. [DOI] [PMC free article] [PubMed] [Google Scholar]
- 39.Temin H M. Sex and recombination in retroviruses. Trends Genet. 1991;7:71–74. doi: 10.1016/0168-9525(91)90272-R. [DOI] [PubMed] [Google Scholar]
- 40.Van Beveren C, Coffin J M, Hughes S. Nucleotide sequences complemented with functional and structural analysis. In: Weiss R, Teich N, Varmus H, Coffin J, editors. RNA tumor viruses. Vol. 2. Cold Spring Harbor, N.Y: Cold Spring Harbor Laboratory; 1985. pp. 567–1148. [Google Scholar]
- 41.Varmus H, Swanstrom R. Replication of retroviruses. In: Weiss R, Teich N, Varmus H, Coffin J, editors. RNA tumor viruses. New York, N.Y: Cold Spring Harbor Laboratory; 1985. pp. 75–134. [Google Scholar]
- 42.Vogt P K. Genetically stable reassortment of markers during mixed infection with avian tumor viruses. Virology. 1971;46:947–952. doi: 10.1016/0042-6822(71)90093-6. [DOI] [PubMed] [Google Scholar]
- 43.Weiss R A, Mason W S, Vogt P K. Genetic recombinants and heterozygotes derived from endogenous and exogenous avian RNA tumor viruses. Virology. 1973;52:535–552. doi: 10.1016/0042-6822(73)90349-8. [DOI] [PubMed] [Google Scholar]
- 44.Zhang J, Temin H M. Retrovirus recombination depends on the length of sequence identity and is not error prone. J Virol. 1994;68:2409–2414. doi: 10.1128/jvi.68.4.2409-2414.1994. [DOI] [PMC free article] [PubMed] [Google Scholar]