

Abstract
Aquaculture is vital in ensuring a sustainable protein supply for economic purposes. Timely identification of damage to net pens poses a notable challenge in the aquaculture environment. Detecting damaged net pens in underwater environments using remotely operated vehicles (ROVs) offers a safe and efficient solution, eliminating the need for human divers to face potential dangers. Underwater inspections with optical cameras face challenges due to reduced visibility caused by floating particles and light attenuation. So, selecting the best available robot view is vital for clear images for net inspection. To address this issue, we track the mean gradient feature across partial or entire images and actively control the robot’s pose to get the best available images. To simplify setting the desired set-point for distance control, we train a convolutional neural network (CNN) offline using supervised learning and integrate it with a Proportional Integral Derivative (PID) controller. This combined approach enables the ROV to maintain a consistent relative pose with respect to the fishnet, thereby obtaining clear net images in dynamic marine environments and effectively identifying any damage. Experimental results obtained in both the garden pool and the real fish farm environments validate the efficacy of the proposed method.
Subject terms: Ocean sciences, Engineering
Introduction
Fish is a vital source of various essential micronutrients and constitutes a vital element in the everyday diets of billions of individuals worldwide1. In the United Arab Emirates (UAE), the average fish consumption per person is 22.5 kg, whereas aquaculture contributes a mere 2 per cent to the total annual fish consumption2. This has led to an increasing requirement to establish expansive aquaculture facilities in the UAE’s open sea regions, with the primary goal of addressing the scarcity of fish supply. Notably, the advancement of large-scale aquaculture farms in the UAE’s open sea aligns with the nation’s National Food Security Strategy, and considerable investments are being made toward developing aquaculture initiatives and related infrastructure.
Marine aquaculture, while playing an essential part in meeting the growing demand for high-quality protein and preserving the ocean environment3, also poses certain challenges in terms of fish net safety as well as fish growth. Aquaculture involves the cultivation of fish in large submerged cages or net pens located in open sea environments4. However, the netting used in these facilities is a crucial component that is easily damaged and difficult to detect. These underwater enclosures are susceptible to various forms of damage and negative environmental impacts such as strong currents, extreme weather events, and natural predators can pose threats to the structural integrity of fish cages, leading to breaches or even complete collapse5. Also, in marine environments, several living organisms like bacteria, algae, and hydroids attach themselves to the enclosures, i.e., the bio-fouling phenomenon, which is detrimental to the fish and the structural integrity of the enclosures6. Such incidents can result in fish escapes, disrupting local ecosystems and potentially introducing non-native species. Moreover, concentrated waste and uneaten feed within the cages can contribute to water pollution, affecting the surrounding aquatic environment. To ensure sustainable aquaculture practices, it’s essential to carefully manage and mitigate these potential damages, adopting technologies and strategies that prioritize both fish health and the preservation of the surrounding ecosystem7.
Traditionally, the inspection and maintenance of fish farm enclosures have been carried out by divers, a practice both costly and risky8. These divers are required to endure extended periods of monitoring within fish cages, confronting ever-changing weather conditions, even the most extreme. Furthermore, continuous monitoring of the status of the fish cages in aquaculture needs measurement of all parameters as well as sampling from the seabed and in a water column. Consequently, human labor has been heavily leaned upon for these aquaculture monitoring tasks, which involve repetitious and dangerous tasks. Thus, automation and intelligent control schemes in aquaculture provide great potential as reported in7.
Recently, Remotely Operated Vehicles (ROVs) have emerged as an economical and safe solution for replacing human divers in aquaculture monitoring9. These vehicles are small in size and cost-effective solutions for the aquaculture net inspection tasks and facilitate autonomous operations through the integration of advanced information and communication technology, intelligent control and navigation systems. Various sensors such as sonar, compass and depth sensors are used that help in real-time localization of these vehicles during the operation. Furthermore, the use of cameras and vision-based approaches provide real-time environment recording and interpretation of the imagery data10.
Motivation
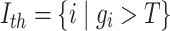
For ROV-based net inspection, it is important to maintain the vehicle pose on the best available view of the fish net in order to get clear net images and inspect the net status. The vehicle is mainly operated manually during the inspection campaign and offers limited automatic functions in depth and heading control. In addition, the ROV control and net monitoring simultaneously is a challenging task, particularly under environmental disturbance e.g., ocean waves. For instance, the study reported several cases where the detection of net holes was compromised during the inspection11. Additionally, avoiding collisions with the net surface is a critical consideration for the ROV, as crashing into the net surface potentially results in net holes and damage. Furthermore, the floating particles and low light significantly reduce the quality of the images for the net inspection. Thus, it is important to obtain the high-resolution camera input while ensuring the ROV is in the best pose with respect to the net12.
Contribution
In this paper, we propose a novel real-time inspection system for aquaculture net pens that integrates learning-based pose control and deep learning-driven defect detection on a commercial ROV platform. The system architecture, shown in Fig. 1, builds upon the gradient-based control concepts introduced by Lee et al12., but significantly extends them in both design and deployment. Unlike prior work, our approach introduces a CNN-based distance classification model that replaces manual gradient thresholding, enabling robust and adaptive pose estimation in dynamic underwater environments. Additionally, we propose a yaw regulation strategy based on bilateral image gradient differences, allowing precise alignment of the ROV with the net plane for improved visibility and safety.
Fig. 1.

The proposed aquaculture net pens inspection system architecture. The ROV utilizes camera input and employs computer vision techniques to extract gradient information from the image. By assessing the distance relative to the net plane based on the obtained gradient information, the ROV adjusts its pose, including heading and yaw angle, to achieve the desired distance from the net plane. Additionally, the system integrates a deep learning module to carry out net defect detection tasks once the ROV is properly aligned at the desired distance.
To ensure high-resolution imagery for detection tasks, our closed-loop control scheme actively adjusts the ROV’s distance and orientation using the classified distance (far, good, close) as a setpoint. We further integrate this with a defect detection module that benchmarks multiple YOLO variants trained on a custom-labeled dataset of aquaculture net anomalies (e.g., net holes, entangled plastic). The system is implemented using a ROS2-based framework and validated in both pool and real fish farm environments, demonstrating its effectiveness in maintaining optimal viewpoints and improving defect detection performance under real-time constraints.
Our contributions are summarized as follows:
A learning-based gradient-aware pose control strategy for ROVs that uses CNN-based distance classification and dual-sided gradient-based yaw regulation, enabling robust alignment with aquaculture nets in dynamic environments.
A viewpoint-optimized defect detection framework, where we evaluate multiple YOLO variants under varying inspection distances, and demonstrate how control-informed image acquisition improves detection accuracy (e.g., mAP improvement from 0.68 to 0.71 at good distance).
A real-time, ROS2-based aquaculture inspection system, integrating control and detection on a commercial ROV platform, and validated in both a controlled pool and a real fish farm environment.
Related Works
In this section, we discuss and review the current state-of-the-art solutions for automatic aquaculture net pen inspection tasks.
Aquaculture inspection using ROVs
Recently, many studies have been done on using ROVs in aquaculture inspections. These ROVs, equipped with sophisticated sensors and navigation systems, enable comprehensive assessments of fish cages, nets, and surrounding infrastructure without requiring direct human interventions in marine dynamic environments13. By using ROVs for aquaculture inspection, operators can enhance efficiency, reduce operational risks, and gain valuable insights into the condition of aquaculture installations, ultimately contributing to improved productivity and sustainability within the industry14. Ongoing research in this field focuses on refining navigation strategies, optimizing sensor integration, and further addressing challenges such as underwater visibility and environmental variability to advance the effectiveness of ROV-based aquaculture inspection methodologies. In the following, we discuss previous work done in aquaculture inspection using ROVs.
Borkovic et al.15 proposed a control framework for a remotely operated vehicle (ROV) in an aquaculture setting. The software enables the ROV to autonomously navigate around fish cages and transmit live video to a computer on the surface. The topside computer utilizes algorithms to detect vertical ropes, and it sends real-time velocity instructions to the ROV to facilitate successful completion of the inspection task. Additionally, the captured images are analyzed using a pre-trained convolutional neural network to assess the extent of net biofouling and identify which nets require cleaning. To facilitate this system, a framework based on the Robot Operating System (ROS) is developed, allowing the topside computer to access the ROV’s video stream, process the images, and provide velocity references necessary for comprehensive fish cage inspection. The inspection procedure involves following recognizable rope segments on the outer structure of the fish cage by controlling the ROV’s yaw, heave, and depth.
Akram et al.8 extended the previous work15 by validating the vision-based inspection of aquaculture net pens both through simulation and real experiments. This study introduced a modular net inspection method that involved object detection, specifically detecting two identifiable parallel ropes attached to the net. The system also included the estimation of the ROV’s pose using a vision triangulation method and employed a closed-loop control law to guide the vehicle in inspecting the net’s condition by traversing from top to bottom along its surface. The study provided an analysis of both simulation and real experiment results. However, it is worth noting that the estimation of the ROV’s angle was not considered in the pose estimation module, which is crucial for maintaining parallel distance control during aquaculture net inspection.
Kapetanovic et al.9 presented an overview and initial findings from the HEKTOR (Heterogeneous Autonomous Robotic System in Viticulture and Mariculture) project16. It presents a survey of the applications of a cooperative and diverse autonomous robotic system, comprising aerial, surface, and underwater vehicles, in mariculture scenarios. The main mariculture applications targeted by the HEKTOR robotic system are the autonomous inspection of fish net cages to detect biofouling and damage, as well as the estimation of biomass. Additionally, a detailed description of the autonomous vehicles employed in the project is provided, including an unmanned aerial vehicle, a remotely operated vehicle, and a catamaran-shaped autonomous surface vehicle developed specifically within the scope of this project17.
Osen et al.18 introduced a newly developed floating mobile platform designed for the inspection and monitoring of aquaculture installations in marine environments. The primary objective of this platform, named “Sea Farm Inspector”19, is to gather essential information regarding the condition and integrity of fish cages, including the structures, nets, and moorings. The system comprises a cost-effective remotely operated vehicle (ROV) and an unmanned surface vehicle (USV). The USV serves as an active, self-stabilizing autonomous carrier, transporting the ROV to the designated operation location. Equipped with a winch, the USV lowers the ROV into the water column and tracks its movements throughout the operation. Upon completion, the winch automatically lifts the ROV out of the water, and the “Sea Farm Inspector” proceeds to the next operation site. To ensure stability and safety during operations, the USV incorporates dynamic position control, autopilot, and manual maneuvering capabilities. The work provides a comprehensive presentation of the system’s design and implementation, along with detailed descriptions of various tests conducted in both controlled tank environments and open sea conditions to validate the concept.
Constantinou et al.20 presented a comprehensive development of a laser vision system, including both the hardware and algorithms. The system is specifically designed for underwater environments and is capable of measuring distances from both solid and mesh-like targets. To accommodate the hemispherical optics commonly found in underwater vehicles, the system utilizes an array of line-lasers to ensure consistent reflections from mesh-like targets. The developed algorithms enable the system to provide raw point cloud data from each laser, as well as high-level information such as distance and relative orientation of the target with respect to the ROV after additional processing. The performance of the system is demonstrated through a series of experiments conducted in controlled laboratory environments and offshore aquaculture installations.
Chalkiadakis et al.21 presented an AUV developed for regular fish net inspection tasks. The proposed AUV system offers the facility to identify net holes and fouling and can be used as a periodic regular inspector. In addition, the system integrates various sensing devices and making use of optical recognition techniques for the AUV autonomous navigation around the net surface in order to scan the net surface for net dysfunctionalities. Moreover, the system was tested in a real-world testing environment and demonstrated a cost-effective and adaptable solution for the aquaculture net inspection tasks.
Livanos et al.22 introduced a smart navigation technique for an AUV to facilitate real-time optical recognition during inspections of aquaculture net pens. The methodology combines multiple sensors, data recording and transmission operations, as well as offline analysis techniques, with a specific emphasis on identifying net holes during routine fish net pen inspections. Furthermore, the proposed vision-based navigation approach that uses a given target attached to the net, was evaluated in a controlled laboratory environment, and the outcomes substantiated the efficacy of the system for conducting inspections of aquaculture nets.
Tao et al.23 have devised an omnidirectional surface vehicle (OSV) dedicated to the inspection of fish net pens. The OSV is constructed with a symmetric multi-hull design, enabling it to maneuver omnidirectionally. To enhance its performance, the vehicle incorporates an overactuated thruster configuration and a camera that can be adjusted for depth. Additionally, the OSV is equipped with an onboard computer that integrates a neural network-based approach for detecting net holes. It is important to note that the platform described in this study is still in its initial phase and further advancements, such as the inclusion of additional sensors and localization techniques, are necessary to achieve precise inspection and detection of net damage23.
Lin et al.24 have expanded upon the previous research conducted by Tao et al.23 in the development of an OSV. In their work, Lin et al. incorporate artificial intelligence (AI) planning methods for the inspection of aquaculture net pens. The primary focus of the study is to detect net holes in large aquaculture sites, which may occur infrequently. To address this objective, the researchers propose a hierarchical task network planner that facilitates the movement of the vehicle. This planner takes into consideration the decision-making process for inspecting the net at both close and far distances. The effectiveness of the net inspection scheme proposed in this study is demonstrated through a simulation analysis. However, it is important to note that the system is still in progress and further efforts are required. These efforts include testing the system in a realistic environment, integrating environmental uncertainty into the planning process, and improving defect localization techniques.
Duecker et al.25 tackled the issue of autonomous robot navigation for close-distance inspection tasks. Their work proposed a path planning and navigation scheme based on a depth camera, enabling an AUV to autonomously navigate and inspect net structures. The navigation scheme follows a plan global, adapt local strategy to fulfill periodic inspection tasks. Initially, the system generates a global path for the entire inspection area and provides an attitude setpoint for the vehicle. Subsequently, a local path planning module utilizes data from the RGB-depth camera to generate a local reference path. This local reference path is then used as a setpoint in the control system, instructing the vehicle to move around the net in a helix shape. The effectiveness of the proposed scheme was demonstrated through both simulation studies and experiments. However, it should be noted that the recognition system does not account for varying visibility conditions, which are crucial factors in real-world environments.
Lee et al.12 presented a pose control strategy for an AUV intended for fish net pens inspection tasks in turbid underwater environments. The approach involved utilizing the mean gradient feature extracted from input images to establish the setpoints for the AUV’s distance and angle relative to the net. To automate the distance control process, a deep learning-based model was employed to autonomously detect whether the AUV should operate at a close distance or a far distance from the net. The detected distance was then utilized as a setpoint for the control module. The proposed method was evaluated in turbid water conditions, and the results showcased the effectiveness of the distance-keeping control strategy introduced in the study. It is worth noting, however, that the detection of damages to the net was not addressed in this work.
Schellewald et al.26 also conducted research on a pose control strategy to enhance the autonomy of ROV operations in challenging aquaculture environments. Their proposed method focuses on enabling the vehicle to accurately measure its distance from the fish net and estimate its orientation relative to the net. The pose estimation approach utilizes the 2D Fast Fourier Transform applied to the camera image on a single mesh geometry. By utilizing the camera parameters and the actual mesh size, the ROV’s pose is estimated accordingly. It is important to note that while the proposed scheme was tested on a sequence of images for pose estimation, it does not provide online control and navigation of the vehicle during net inspection.
Amundsen et al.27 introduced a guiding technique for ROVs in aquaculture inspection tasks using a Doppler Velocity Log (DVL). The method utilizes measurements obtained from a DVL, which is installed on the ROV, and approximates the geometry of a region of interest on the aquaculture net pens that is parallel to the ROV. The approximate relative position and orientation of the ROV are then utilized as inputs for a line-of-sight guidance law, enabling the ROV to follow a continuous path along the surface of the net, even in the presence of ocean currents. However, the results demonstrated that the presence of noise in the DVL sensor hampers the effectiveness of this approach.
From the comparison in Table 1, it is evident that while prior works have contributed valuable insights into ROV navigation, deployment mechanisms, or high-level perception, few have integrated full pose estimation (both distance and yaw) with real-time defect detection. Most systems either lack online control, do not address viewpoint optimization, or focus only on environmental factors like biofouling without considering structural defects such as net holes. Our proposed system uniquely combines real-time gradient-based pose control with deep-learning-based defect detection, and validates the entire pipeline in both controlled and operational aquaculture environments. This comprehensive integration addresses a critical gap in practical, autonomous ROV-based inspection systems for aquaculture applications.
Table 1.
Comparison of the ROV-based aquaculture net inspection methods.
| Study | Platform | Main Method | Pose Estimation | Defect Detection | Environment Tested |
|---|---|---|---|---|---|
| Borkovic et al.15 | ROV | Rope detection, ROS control | Partial (no yaw) | Biofouling (CNN) | Field |
| Akram et al.8 | ROV | Rope-based triangulation | Yes (distance only) | No | Sim + Field |
| Kapetanovic et al.9 | UAV, USV | Multi-agent system | No | Biofouling + biomass | Field |
| Osen et al.18 | ROV, USV | Mobile deployment system | No | Structural integrity | Tank + Sea |
| Chalkiadakis et al.21 | AUV | Optical recognition | Partial | Holes + fouling | Field |
| Lee et al.12 | AUV | Gradient for distance control | Yes (angle, gradient) | No | Turbid tank |
| Schellewald et al.26 | ROV | FFT on mesh geometry | Yes (offline) | No | Image dataset |
| Amundsen et al.11 | ROV, DVL | Line-of-sight, DVL fusion | Yes | No | Simulation |
| Ours | ROV + topside server | Gradient, CNN-based control | Yes (distance + yaw) | Yes (YOLOv5, plastic/holes) | Pool + Real farm |
Aquaculture inspection using Vision-based methods
Aquaculture inspection using vision-based methods has emerged as a promising approach for assessing underwater environments and aquaculture installations. By utilizing cameras and image processing techniques, these methods enable automated analysis of fish cages, nets, and marine structures without direct human intervention. Vision-based systems can detect and quantify biofouling, damage, and other defect of aquaculture net, offering valuable insights to operators28. These methods enhance operational efficiency, reduce labor costs, and contribute to sustainable aquaculture practices. Ongoing research focuses on enhancing the accuracy and reliability of vision-based inspection through advancements in image processing algorithms, sensor technology, and integration with autonomous systems29. In the following, we discuss some of the previous work done on the aquaculture inspection using vision-based methods.
Zhao et al. in30 proposed a net defect detection approach using conventional vision-based methods. The approach involved several steps: firstly, the input image containing a region of interest underwent processing through a bilateral filter. Subsequently, a binary image was generated utilizing the OSTU method, which maximizes inter-class variance. The net’s feature gradient histogram was then computed, and the positions of local peaks in the histogram curve were identified to pinpoint the location of holes in the net. The effectiveness of this proposed approach was demonstrated through experimentation in a controlled laboratory environment, where it exhibited successful performance in detecting net damage. It’s important to note that this method exclusively focused on identifying holes defects in the net, relying on offline image sequences for assessment.
Schellewald et al.31 proposed an attention mechanism based on morphological image processing to identify irregularities in fish nets. Net holes were considered as deviations from the regular net structure. In this work, morphological image processing techniques were employed to establish the expected regular net structure and then search for deviations in neighbouring regions of the image. The effectiveness of the proposed approach was evaluated using videos that depicted the detection of holes in net pens. However, the method’s robustness in accurately identifying net holes was limited, as it could misinterpret irregularities caused by factors like seaweed or patches of other objects obstructing parts of the net, not necessarily indicative of actual holes.
Paraskevas et al.32 proposed an ROV based net hole detection method coupled with deep learning model. In this work, the author proposed a net defect detection system that works by capturing a video from the ROV onboard camera. The obtained image is fed to the trained deep learning model named YOLOv5 for detecting net holes, algae, and dead fish categories. It’s important to note that the model’s effectiveness in detection was assessed using a limited dataset.
Madshaven et al.33 introduced an automated approach for analyzing the integrity of nets, relying on video footage captured within fish cages. This research proposed two distinct schemes for segmenting the net structures within the videos. The initial approach involves employing an attention mechanism to emphasize areas of interest within the images. This is achieved through the utilization of a neural network-based segmentation model that categorizes regions into three classes: dark net, light net, and no net. Subsequently, an adaptive thresholding algorithm was developed to ensure consistent segmentation of the net structure, rendering it as white pixels against a black background. This method integrates attention and binarization into a unified operation, yielding favourable outcomes and mitigating processing time overhead.
Paspalakis et al.34 explored image processing methods designed to identify net holes of various sizes within aquaculture net pens. The developed strategies aim to offer effective solutions for inspecting net holes of various sizes by leveraging either localized or overall image characteristics. The initial stage of the methodology involves preprocessing the images to differentiate the net structure from background color fluctuations. Subsequent phases use effective image processing methods. These techniques are primarily intended to address challenging underwater lighting scenarios.
Paraskevas et al.35 introduced a novel system for detecting damage in fishing nets, which takes into account the presence of small holes. This system was designed to operate effectively under various real-world lighting conditions and camera angles. In this work, a comparison was drawn between the effectiveness of the conventional OpenCV library and the advanced YOLOv5 deep learning model in identifying these holes in images of fish farming nets, which were captured by an ROV. The findings of the study revealed that the traditional vision-based approach, utilizing the OpenCV library, outperformed the YOLOv5 deep learning model in terms of hole detection tasks. This performance differences suggest that a better dataset is required with a greater variety of images taken under different conditions to improve the consistency of the model’s performance.
Zhang et al.36 presented a similar hole detection method where an improved Mask R-CNN deep learning model was employed. In this work, the net holes dataset was created under different conditions and enhanced by using data augmentation. The Mask R-CNN model was enhanced by introducing the Recursive Feature Pyramid (RFP) and Deformable Convolution Network (DCN) layers into the backbone of the network that is capable to extract high-level semantic features from the input image. The obtained results were compared to other well-known deep learning models such as SSD and YOLOv3, where the proposed model performed well in terms of precision and recall.
Liao et al.43 proposed an alternative approach to detect net holes, employing the MobileNet-SSD deep learning model. In this study, the dataset of net hole images was acquired using an ROV in a controlled laboratory setting. They applied an enhanced multiscale fusion algorithm to enhance the denoising and smoothing effects of the original method. Subsequently, the MobileNet-SSD model underwent training for the net hole detection task. The results demonstrated an enhancement in the real-time detection of net damage. Nevertheless, it was noted that smaller net holes were not accurately identified, despite their tendency to evolve into more significant damages over time. This observation pointed to the need for further optimization of the model to enhance its detection accuracy, particularly in relation to smaller net holes.
Labra et al.38 presented a traditional computer vision-based net hole detection method for aquaculture fish cages. In this work, an ROV is used to record the net images dataset in a real salmon fish farm. An image processing method was developed that segments the image frames to separate the net of the fish cage from the other parts. In addition, noise reduction techniques were applied in consideration of the underwater conditions. The damage detection is performed by analyzing outliers in mesh net hole areas. Holes neighbouring to the outliers are further analyzed to reduce perspective error and spatial-temporal criterion using tracking is employed that reduce the false positives detection. Moreover, extensive experiments were performed and showed effectiveness in real-world applications. However, this method is not robust towards distortion and other objects attached to the net.
A similar study on net hole detection is done by Betancourt et al. in39. Here, the authors proposed a comprehensive framework for aquaculture net inspection by considering water quality monitoring and net hole detection method. An ROV is employed that performs real-time monitoring of the net cages and sends the video recording to the surface computer. On the surface computer, computer vision algorithms are applied that process the adaptive segmentation by following the Otsu thresholding method. Subsequently, the Hough transform was used as a feature extraction technique to determine the damages by analyzing the shapes and connections, and finally compute knot-point connections that enabled the identification of net damages. The system was tested in a dam under real conditions and showed better detection accuracy. However, this method gives misleading results where the net patterns seem to be aligned at the near corners of the image.
Qiu et al.40 proposed an aquaculture net pens health estimation scheme, which allows the analysis and detection of the degree of fouling on the net surface via imagery data taken using ROV. This work proposed three module-based net inspection schemes named pre-processing, marine growth segmentation, and net health estimation. First, image dehazing is performed by using the dark channel prior method. Next, the K-means algorithm is used to segment net region, biofouling, and net-opening. A net-opening structure analysis method is proposed to calculate the number of cells, which greatly affected the results of estimation. Finally, we take both segmentation and structure into consideration to estimate the blocking percentage of each cell. This scheme facilitated the end users to decide on the need for cleaning or maintenance plans.
Zacheilas et al.41 introduced a next-generation embedded system designed to identify holes in aquaculture nets in real-time. Unlike previous work34, this project operates on video inputs instead of static images. It successfully addresses challenges arising from varying lighting conditions, water opacity, and diverse hole sizes present within each frame. Guided filtering effectively accomplishes brightness adjustment and edge detection. Subsequently, morphological opening enhances the clarity of the ultimate boundaries and filters.The algorithm’s enhancement has been meticulously modeled and simulated using MATLAB. Subsequently, the system is designed and deployed on a platform centered around a Field Programmable Gate Array (FPGA).
Ubina et al. in42 presented the implementation of digital twin technology in aquaculture inspection activities, utilizing a combination of Internet of Things (IoT), cloud technology, and Artificial Intelligence (AI). This innovative approach involves creating a digital representation of the aquaculture setup, which is continuously updated using data from sensors. Through the training of an artificial neural network with extensive sensor data collected from numerical simulation models of the netting, a digital twin is generated. This twin has the capability to ascertain the net’s condition by analyzing input data such as wave characteristics (height and period) and tension values, effectively determining the presence of damage37.
As summarized in Table 2, many previous vision-based aquaculture inspection approaches either rely on manual features, traditional image processing, or deep learning-based models applied offline. Although some works used deep learning (e.g., YOLO, Mask R-CNN), they often did not consider viewpoint optimization, integrated pose feedback, or control-aware defect detection. Our work bridges this gap by combining learning-based visual servoing with real-time defect detection in a closed-loop manner, ensuring both optimal view acquisition and defect recognition. Furthermore, the proposed framework is validated in both controlled and real-world environments, demonstrating its practical deployment potential.
Table 2.
Comparison of vision-based aquaculture net inspection techniques.
| Study | Platform | Method Type | Defect Focus | Dataset Size | Environment |
|---|---|---|---|---|---|
| Zhao et al.30 | Offline vision | Histogram + OSTU filtering | Holes | Small | Lab |
| Schellewald et al.26 | Morph. vision | Morphological attention | Holes | Medium | Field videos |
| Paraskevas et al.32 | ROV | CNN (YOLOv5) | Holes, algae, fish | Limited | Real data |
| Madshaven et al.33 | Fish cage video | Attention, Segmentation | Net segmentation | Moderate | Fish cages |
| Paspalakis et al.34 | Vision processing | Filtering + binarization | Hole sizing | Small | Variable lighting |
| Zhang et al.36 | Enhanced CNN | Mask R-CNN + RFP, DCN | Holes | Large (augmented) | Lab |
| Liao et al.37 | MobileNet-SSD | Multiscale fusion + SSD | Small holes | Small | Lab |
| Labra et al.38 | ROV | Outlier tracking + noise reduction | Holes | Medium | Real farm |
| Betancourt et al.39 | ROV | Adaptive segmentation + Hough | Holes | Moderate | Dam/Real |
| Qiu et al.40 | ROV | Fouling segmentation + net health estimation | Fouling | Moderate | Real/Sim |
| Zacheilas et al.41 | FPGA-based system | Real-time filtering + opening | Holes (video) | Moderate | Hardware tested |
| Ubina et al.42 | Digital Twin, IoT | Neural net + simulation | Net condition | Large simulated | Cloud-based |
| Ours | ROV + YOLOv5 | Gradient-aware pose, CNN detection | Plastic, holes | Medium (labeled) | Pool + Field |
Proposed approach
Overview
This project aims to transform the local aquaculture industry by incorporating cutting-edge technology to enable monitoring and inspection tasks in aquaculture. Figure 2 illustrates the project’s block diagram, outlining its two primary components: a topside server unit and an ROV. The topside server unit can be a personal computer connected to the ROV via a wireless network. Its primary role is to gather real-time imaging data from the ROV’s onboard camera. Furthermore, this unit integrates and deploys computer vision techniques for both assessing the status of the net and estimating the ROV’s position. Subsequently, a control design module is employed to execute motion control tasks for the ROV during its operation. This control module is responsible for generating commands for depth and yaw control for the ROV, based on the reference and current positions obtained from the computer vision module. On the other hand, the ROV is equipped with an HD camera and a DVL sensor that transmit data to the topside unit and receive depth and yaw control commands in return. Subsequently, the ROV generates the necessary thrust forces to achieve the desired depth and yaw angle relative to the aquaculture net pens.
Fig. 2.

Proposed block diagram of the system. The ROV receives camera input and executes inspection tasks, while the topside server handles net defect detection and control signal generation. Deep learning is employed for defect classification, and pre-defined setpoints for depth and yaw are sent to the ROV for motion control.
In the following, we develop the different components and processes to aquaculture net defect detection that are executed on the topside server unit and ROV.
ROV pose estimation
In this section, we discuss the process for generating the setpoint for the ROV position relative to the net.
The robustness of aquaculture net pens inspection tasks heavily depends on the ROV’s position. The ROV continuously records visual data and transmits it to the surface unit, where deep learning algorithms can be applied to detect defects in the net. Detecting aquaculture net pens defects from images obtained from a distance can be challenging to the detector algorithms, as the defects in the net are barely visible but become more apparent at a close distance. However, being extremely close can also negatively impact the inspection process, as the detector may miss the detection. The objective of pose estimation is to position the ROV sufficiently close to the net structure to obtain a clear image and perform the inspection tasks. To achieve this, we employ the mean gradient feature in the current image frame to locate the ROV and generate setpoint signals to control its pose and movement during the inspection operation.
Figure 3 shows an example of aquaculture net pens taken from both a far distance and a close distance. It becomes evident that the net is hardly visible from a far distance (left-side), whereas the net is visible from a close distance (right-side). The mean gradient value of an image serves as an indicator of its clarity, as it represents the average rate of change in pixel intensity. In other words, a high gradient value indicates substantial intensity changes, typically associated with a large number of edges in the image and yields a higher mean gradient value. In contrast, the image taken from a far distance has low clarity, contains only a few edges, and exhibits minimal pixel intensity change, resulting in a lower gradient value. This observation emphasizes the importance of mean gradient information in a vision-based approach for controlling the ROV’s relative position to a net structure within aquaculture net pens12.
Fig. 3.

Visual comparison of net images captured at different inspection distances and their corresponding gradient maps. The top row shows a net image captured from a far distance, resulting in lower detail and a mean gradient value of 36.83, indicating weaker edge responses. The bottom row displays a net image captured from a closer, optimal distance, showing clearer net structure and a higher mean gradient value of 132.98, suggesting sharper and more defined edges. Gradient maps are computed to quantify image sharpness and are visualized using a color scale (right), where brighter regions correspond to stronger gradients.
Furthermore, in the net dataset, the background that is not part of the net covers most of the image and represents relatively low gradient values compared to the net’s foreground part. Figure 4 shows the histogram of the far and close distance net images along the y-axis. The higher values are noted in the case of close-distance images. Most pixels in the non-net background show a low gradient value, indicating that the mean gradient of the entire image is primarily influenced by the background rather than the object itself. This feature remained the same throughout net image data obtained within aquaculture net pens.
Fig. 4.

Histograms of y-axis gradients for sharp (left) and blurry (right) net images. Higher gradient values in the sharp image reflect stronger edge definition and net visibility. In contrast, the blurry image shows low gradient frequency, indicating reduced clarity.
To develop a robust gradient estimator, we employ the idea of extracting the gradients larger than a threshold value as suggested by the Otsu approach12. The average value of these gradients is named an image’s special mean gradient (SMG). Here, we adopt the gradient values in the y-axis against each pixel in the image. However, the values along the x-axis can also be used as both directions produce a similar gradient magnitude.
To perform the gradient estimation, let’s consider an image I comprised of pixels N; the gradient value of the image in the y-axis is denoted by  using the Sobel operation. Mathematically,
 |
1 |
Similarly, the regular mean gradient  of the image I is obtained by
 |
2 |
Next, the SMG is calculated by grouping and searching for the number of pixels in the image whose gradient values are greater than a threshold T and denoted by
 |
3 |
Here,  shows the
  pixel of
  , corresponding to the gradient value against each pixel i in the image I. Finally, the average of the SMG is obtained by averaging the
  values.
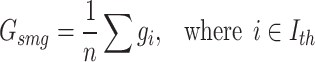 |
4 |
Figure 5 represents the gradients (regular and proposed) for different net images in case of good distance as shown in Fig. 5 (1-5). From the results, it is evident that the difference between the two methods is significantly larger. This is because the regular gradient method is less sensitive to the intensity shift and thus produces large gradient values. More detail can be observed by noticing the Figure where a series of images was taken at similar distances for close distances. Therefore, we use the gradient norm method in the control module.
Fig. 5.

Gradient values for a sequence of net images captured at the same distance. The top row shows five consecutive images, while the plot illustrates their mean gradient values. The higher consistency in gradient-threshold indicates reliable visibility across the image sequence.
Learning-based pose estimation
In the previous section, we discussed extracting gradient values for different distance classes, such as far, close, and desired. These gradient values are input for the control module to manipulate the ROV’s position. These values are labeled as  ,
,  , and
, and  , representing the gradient values associated with the far, near, and desired distances, respectively. However, these values are derived manually through the remote control of the ROV to distinct positions while maintaining a constant yaw angle of zero. This manual extraction process is time-consuming and demanding in terms of effort. To avoid the laborious task of manually obtaining these gradient values for each distance class (far, close, and desired), we employ a CNN model. This CNN model calculates the probability of each class by undertaking a distance classification task. The output of the CNN model is given to the control module that generates the required distance command to ROV for collecting clear aquaculture net pens images. In such a way, when the motion of the ROV converges, the controller obtains the
  .
.
To build this classifier, we used a transfer learning approach. We employed various state-of-the-art CNN models, including MobileNetV2, Vgg-16, EfficientNet, and InceptionV3, to determine the most suitable model for the distance classification problem. To achieve this, we implemented all these models in Pytorch, utilizing pre-trained weights, and subsequently fine-tuned them on our custom dataset of net images. This dataset was acquired in a Pool setup, as illustrated in Fig. 6, and then manually annotated and categorized into (far, close, and desired classes). Additionally, we adjusted the number of neurons in the final fully connected layer to match the three classes in our dataset. Furthermore, we employed the SoftMax function for classification, which provides the probability for each class given an input image. Mathematically, the probability for each class is calculated as follows:
 |
5 |
where  shows the output result for each class in the last layer of the network.
Fig. 6.

Sample images from the aquaculture net pens Dataset representing different inspection distances. (A) Close distance: high clarity with fine net details, (B) Good distance: optimal visibility with minimal distortion, (C) Far distance: reduced net visibility due to blurring and underwater attenuation.
The training of the employed models follows a supervised approach, utilizing a categorical cross-entropy loss function for each model. During the training process, hyperparameters were used, such as a batch size of 32 and 50 epochs. The training optimizer was Adam Delta, with a learning rate set to 0.001. The dataset consisted of 1050 images categorized into far, close, and desired classes, with 70% used for training and 30% for validation. This split was chosen as it is a widely adopted practice that balances model training and evaluation, especially suitable for datasets of this size. A comprehensive analysis of the results was conducted to identify the most suitable model, which was then employed in subsequent experiments. Furthermore, the performance of the best-trained model was assessed in a pool setup with unseen data to demonstrate its applicability and generalizability for the intended application. We acknowledge potential dataset biases due to limited variation in lighting, viewpoints, and environments, as most data were collected in controlled settings. To mitigate this, we applied standard data augmentation and maintained balanced class distributions to improve generalizability. The dataset used for training and evaluation, along with all associated code and models, is publicly available at (https://github.com/drwa92/rov_gradiant_control)
The output generated by the CNN model was subsequently fed into the control module to calculate the ROV’s movement commands. The CNN model classifies each input image into one of three distance categories with respect to the net: Class 1 (Far), Class 2 (Too Close), and Class 3 (Desired Distance). Instead of hard classification, the CNN outputs a softmax-based probability distribution over these three classes, enabling smooth control even in ambiguous or transitional scenarios.
To determine the forward or backward movement of the ROV, the following velocity control equation is used:
 |
6 |
This expression computes the difference between the probability of being at the desired distance and the probability of being too close, scaled by a proportional gain k.
When  is greater than
  , the resulting velocity is positive, indicating that the ROV is either at or approaching the optimal distance, and a forward command is issued. Conversely, when
  dominates, the resulting velocity is negative, signaling that the ROV is too close to the net, prompting a backward motion. This feedback loop drives the ROV toward the desired inspection distance.
It is worth noting that in scenarios where the ROV is far from the net, the CNN typically assigns a high probability to Class 1, and lower values to Class 2 and 3. While Class 1 is not explicitly included in the control equation, the system relies on the trained behavior of the CNN-such that as the ROV approaches the net, the probability of Class 3 gradually increases. This shift naturally drives a positive velocity response, encouraging forward motion until the ROV enters the stable, desired range.
Therefore, even when  and
and  are both near zero, the controller remains valid. The design exploits the gradual change in class probabilities to ensure smooth convergence toward the optimal inspection pose. This probability-based formulation provides control actions for the ROV navigation within aquaculture net pens inspection task.
ROV control design
In this section, the proposed control design is presented. The control design aims to develop a speed controller for net-following. As such, the ROV pose-keeping and guidance law was designed to provide a reference speed to the controller to maintain the desired position as well as the angle of the ROV during the net inspection operation.
The control problem is defined as giving the reference positions, instructing the vehicle to follow the desired position with zero yaw angle in the presence of external disturbances.
In the previous section, we discussed setting up the reference positions using gradient values in the image. Gradient values are extracted through a learning-based model rather than a manual extraction process. Once we get the gradient values for the reference position of the required setpoint, we give them to the control module to generate appropriate movement commands for the yaw and heading control.
Figure 7 shows the ROV coordinates and relative positions with respect to the net. The ROV has 4 degrees of freedom (DOF): forward x, lateral y, throttle zm, and yawing  . In the image plane,
  shows the yaw angle between the average vector of the net plane and the ROVs heading toward the net. Using the 4-DOF, the controller can generate the motion forces for x, y, z, and yaw directions.
Fig. 7.

(A) ROV coordinate system. (B) ROV relative distance and yaw angle with respect to the net plane, and (C) An image divided into left and right part.
We use the proportional integral derivative (PID) control law to generate the required motion commands for the ROV. The PID controller is widely used in many control applications for the regulation and stabilization of various systems by continuously adjusting the control input based on error, history, and prediction of future behavior of the system. Mathematically, we can write as follows:
 |
7 |
where  is the output for x and yaw directions. e(t) is the error, which is the difference between the desired setpoint and the current setpoint for both heading and yaw positions, and
  its time derivate. The terms
  are the controller’s proportional, integral, and derivative gains. To establish the desired distance between ROV and the net plane,
  is derived as the difference between the target value
  and current value
  obtained in the previous steps.
 |
8 |
Where  shows the gradient values for the target position where the net is clear and visible, and
  shows the gradient values of the current positions extracted from the current image obtained via ROV on-board camera. In such a way, the controller generates the forward command for ROV by minimizing the
  .
.
Controlling the ROV yaw angle is also necessary for precise and stable results. The effect of external disturbances such as tidal current is dynamic, and the ROV direction may change due to the external force causing the loss of the desired view of the net. Once ROV is aligned parallel to the net, the angle  becomes zero, e.g.
  . This implies that the gradient values are the same if we divide the image into the left and right sides. Similarly, the heading changes also change the gradient values on the left and right sides of the image. To regulate the ROV heading, the gradient values from the left and right sides are considered in the yaw angle control law. The target value is set to zero for the yaw angle, while the current yaw angle is derived by taking the difference of the gradient values from the left and right sides in the current image. Mathematically,
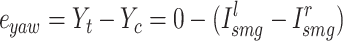 |
9 |
where  shows the gradient values of left side and
  gradient values of the right side in the current image frame respectively.
By using the equation 7, the yaw angle control law is used to generate the velocity commands for bringing the ROV angle to zero considering the error in equation 9. The controller’s tuning process involves manual adjustment of the gains kp, ki, and kd for both the distance and yaw angle control.
Net defect detection
As discussed in the previous section, the net inspection operation is tailored using imagery data from the ROV’s onboard camera. The proposed control module ensures the ROV stays in the desired position with respect to the net plane. The following section discusses the net defect detection module in the proposed framework. This module has been developed to employ a detection algorithm to identify anomalies such as net holes and plastic debris.
Deep learning models have proven highly effective in detecting and precisely locating the affected region within an input image. Numerous cutting-edge models have been introduced in the research literature to address this task. In our study, we conducted tests and evaluations on several widely employed detection models, namely YOLOv444, YOLOv545, YOLOv746, and YOLOv847, to identify and localize vegetation, plastic, and holes using the aquaculture net pens detection method. Based on a comparative evaluation, YOLOv5 was selected for deployment due to its balance between accuracy and inference speed in our real-time inspection setup.
The training dataset consisted of 2090 images, manually labeled using the open-source tool LabelImg. Each image was annotated with bounding boxes for one or more of the following classes: hole, plastic. The annotation process was conducted by trained annotators and reviewed for consistency. The model was trained for 50 epochs with a batch size of 16 using an NVIDIA RTX 3080 GPU. Training took approximately 1 hour. The best-performing weights were selected based on validation mAP@0.5.
Experimental setup
We conducted experiments in both a pool setup and a real-world aquaculture environment to show the proposed scheme’s effectiveness and applicability. The pool utilized for the experiments resembled a spacious garden pool, measuring 5 m x 10 m, with net pens placed on one side. The second phase of the experiment took place at Cromaris Fishery’s fish farming sites15, a prominent company known for producing and processing high-quality Mediterranean fish in Zadar, Croatia, as depicted in Fig. 8.
Fig. 8.

Description of experimental environments used in aquaculture net pens data collection. (A–D) Indoor pool setups with net pens and the Blueye ROV for controlled inspection experiments. (E–F) Real-world aquaculture net pens in open sea conditions for testing generalization and robustness.
We used the Blueye Pro ROV X during the experiments, as illustrated in Fig. 7. This ROV represents the latest version developed by Blueye Robotics Company, featuring dimensions of 48.5 x 25.7 x 35.4 cm in length, width, and height, respectively. Weighing 9 kg, the ROV can dive to depths of 300 m, supported by a 300 m tethering cable. Its autonomy is sustained by a battery, providing up to 5 hours of operation. The ROV is adaptable to various water types, including saltwater, brackish, or freshwater. The drone maneuvers effectively and is facilitated by four thrusters with a power of 350 W each. The ROV has a forward-looking full HD camera featuring a tilt angle of [ ,
,  ] and an imaging capability of 25-30 fps. Additionally, a power light ensures well-lit imagery in low-light conditions. Various sensors, such as DVL, IMU, accelerometer, compass, and temperature sensors, are integrated into the ROV. For control and communication, the ROV enables interaction with a topside user on the surface via WiFi and Ethernet cables in a wireless environment. Notably, it comes with an open-source Python-SDK9,48, allowing the development of a ROS2 interface. This interface facilitates seamless communication between the topside computer and the ROV, incorporating various ROS2 nodes for publishing/subscribing to ROV input/output data, including camera images, DVL data, thruster forces, and more.
The experimental results were evaluated from several aspects, including the imaging capability of the ROV, the distance keeping between the ROV and the net pens, and the stability of ROV control via the learning-based method. Numerous experiments were conducted to assess imaging quality at various distances between the ROV and the net pens. Subsequently, the ROV’s ability to maintain a good distance, utilizing gradient information from real-time captured images, was evaluated. Additionally, experiments and analysis were conducted from the perspective of net defect detection, focusing on analyzing the performance in identifying net holes and plastic debris.
Results
This section presents the experimental evaluation of the proposed active vision-based inspection framework for aquaculture net pens using an ROV. The results are organized into two main parts. First, we provide obtained results on the distance control for aquaculture net pens inspection. Second, we analyses the performance of the proposed distance control method on the net defect detection.
Distance control
This section discusses the results of implementing the proposed control scheme for distance and yaw angle control to inspect aquaculture net pens. The results of distance control in a garden pool setup are depicted in Fig. 9. Initially, the ROV is positioned at a considerable distance from the aqua net, making the net not visible. As it moves towards the net, the corresponding gradient values remain low, as demonstrated in Fig. 9, bottom left plot, with the curve closely aligned to a gradient value of approximately 50 for a particular duration. After activating the distance controller and steering the ROV towards the net plane, the gradient values rise and approach the targeted values. Eventually, the controller minimizes the error between the current and target values, and the gradient values converge to the desired value. This convergence occurs when the net becomes distinctly visible in the obtained image sequences, as illustrated in Fig. 9 (B). Moreover, Fig. 9, bottom right plot shows the results of the yaw angle controller for inspecting the net pens. The controller responds to the deviation and actively reduces the error after approximately 20 seconds. Finally, the heading angle becomes zero, and the ROV aligns itself parallel to the net.
Fig. 9.

Distance and yaw control performance in the garden pool setup. (A) Initial view showing the ROV at a far distance from the net; (B) adjusted view after active control to maintain an optimal inspection distance and alignment. The left plot shows the evolution of mean gradient values over time, indicating that the ROV successfully adjusted its distance to match the target gradient threshold (red line), ensuring clear net visibility. The right plot presents the mean gradient error over time, demonstrating stable yaw control and consistent alignment with the net, highlighting effective visual servoing.
We have conducted another experiment where the ROV is initially positioned too close to the aquaculture net, resulting in unclear net visibility. The controller then adjusts the ROV’s position by reversing until a better viewing distance is achieved. The corresponding results, including image frames and gradient-based plots, are now presented in Fig. 10. These results clearly demonstrate the system’s capability to recover from a suboptimal pose and maintain the desired inspection distance, thereby validating the robustness and completeness of the proposed method.
Fig. 10.

Demonstration of the ROV adjusting from a close distance (A) with unclear net visibility to a good distance (B) with a clear net view. The bottom-left plot shows the mean gradient decreasing as the ROV moves back, while the bottom-right plot illustrates the reduction in gradient error toward the target. This experiment confirms the controller’s ability to correct the ROV’s pose when starting too close to the net.
Additional experiments were conducted in an aquaculture environment to demonstrate the efficacy of the proposed scheme for aquaculture net pens inspection tasks. Figure 11 shows the results of the distance and yaw angle controllers in a real aquaculture net pen environment. The top panel (images 1–18) presents a sequence of images captured by the ROV during the experiment. The bottom left plot shows the net gradient error over time for the distance controller, and the bottom right plot shows the yaw angle error for the heading controller. In the top panel, the first row of images (1–11) appears unclear, indicating low gradient values due to the ROV being far from the net. As the ROV approaches the net plane under the influence of the distance controller, the net becomes increasingly visible, as seen in images 13–18. Correspondingly, the gradient values in the bottom left plot increase and stabilize near the target. The orange-shaded region highlights the initial phase when the ROV is far from the net, while the gray region indicates a brief period of instability due to environmental disturbance. The bottom right plot tracks the yaw angle error, showing that the controller maintains a smooth trajectory overall. A minor deviation occurs due to visual noise caused by particles in the water, which temporarily increases the gradient error. Nevertheless, the controller successfully reorients the ROV’s heading to align with the net structure, as confirmed by the final set of clear images (13–18) in the top panel.
Fig. 11.

Distance and yaw angle control in the aquaculture net environment. (1)–(18) Sequential image frames captured by the ROV during a navigation run along the aquaculture net, illustrating variations in net visibility and alignment due to underwater turbidity and lighting. The left plot shows the net gradient error over time, with shaded regions indicating stability conditions: the orange area represents the initial unstable phase where the ROV is far from the net and has not yet aligned, and the gray area marks a temporary instability due to environmental disturbance (e.g., lighting or water flow). The right plot tracks yaw angle error, indicating the effectiveness of the controller in maintaining visual alignment with the net structure under real aquaculture conditions.
Detection method
In this section, we discuss the analysis of the net defect detection method to validate the significance of the proposed gradient-based pose-keeping control scheme for ROV in aquaculture net inspection operations. Initially, we obtained a dataset comprising images of aquaculture net pens holes and plastic debris entangled in the net. The collected images were annotated/labeled via LabelImg tool. The images with annotated data were then fed into the deep-learning models for training purposes. This module aimed to study aquaculture net pens defect detection in an aquaculture environment. In the following, the performance of the various YOLO variants is compared, and the most suitable model was chosen for our understudy problem and integrated into a real-time aquaculture net pens defect detection system, with data acquired by the ROV and processed on a topside server.
In this work, we have trained different YOLO variants and tested their performance in aquaculture net pens defect detection using unseen data. The results showed that all YOLO variants successfully detected different net defects in the input images. We used metrics such as mean Average Precision (mAP), loss, precision, recall, and F1 score to evaluate the performance. The dataset was divided into training and validation sets in an 80:20 ratio, with an image size of 416x416 for both training and validation. Following a transfer learning approach, the models utilized original pre-trained weights files for training on our custom dataset. Throughout the training process, the performance of the models was continuously monitored, and the best training model was selected to prevent overfitting problems. While the dataset yielded strong results, we acknowledge potential biases due to its collection in controlled environments with limited lighting and viewpoint variability. To mitigate this, we applied standard data augmentation techniques to enhance diversity and robustness. The complete dataset, trained model, and testing script are publicly available at (https://github.com/drwa92/rov_gradiant_control).
The experimental results of the different YOLO variants are shown in Table 3. It is reported that all YOLO variants achieved better results for the aquaculture net pens defect including plastic and net holes detection tasks. In particular, YOLOv5 achieved a better mAP score of 0.9840 as compared with other models. In terms of precision score, the YOLOv8 model performed better and achieved a 0.9701 score. In addition, YOLOv5 showed higher recall and F1 scores of 0.9502 and 0.9604 respectively.
Table 3.
Comparative analysis of YOLO model variants on our aquaculture net pens defect dataset, including model complexity in terms of variant type and parameter count.
| Model | Params (M) | AP (Plastic) | AP (Hole) | mAP | Precision | Recall | F1 Score |
|---|---|---|---|---|---|---|---|
| YOLOv4 | 63.9 | 0.9461 | 0.9726 | 0.9593 | 0.9201 | 0.9602 | 0.9401 |
| YOLOv5s | 7.2 | 0.9641 | 0.9740 | 0.9840 | 0.9691 | 0.9520 | 0.9604 |
| YOLOv6n | 4.7 | 0.4601 | 0.5604 | 0.4656 | 0.5740 | 0.5730 | 0.5901 |
| YOLOv7-tiny | 6.2 | 0.9550 | 0.9830 | 0.9690 | 0.9570 | 0.9230 | 0.9403 |
| YOLOv8n | 3.2 | 0.9701 | 0.9820 | 0.9760 | 0.9701 | 0.9380 | 0.9502 |
The training loss results of the YOLOv5 model are shown in Fig. 12. This metric assesses the relationship between the provided data and the expected outcomes. The lower the loss, the better the performance of the model, and vice versa. The training loss was evaluated during the model training at each epoch, and the testing loss was determined. It is noticed that from epoch 0-40, the model parameters were oscillated significantly. As the training proceeded, the performance of the model was getting improved. After the 20 epoch, stability in the model was achieved, with a precision value of 0.95. Upon completion, the model showcased a precision score of 0.98 and an mAP score of 0.95.
Fig. 12.

Training and validation loss curves along with evaluation metrics for the YOLOv5 model trained on the aquaculture net pens defect (plastic and holes) detection dataset. Top row shows training performance for bounding box loss, objectness loss, classification loss, and evaluation metrics including precision, recall, and mAP. Bottom row displays corresponding validation losses and metrics, indicating good convergence and improved model generalization over epochs.
Figure 13 shows an example of successful aquaculture net pens defect detection using the trained YOLOv5 model. The model successfully detected net holes and plastic debris after the training completion. The unseen images were used to test the model, and the adopted YOLOv5 model predicted the aquaculture net pens defect correctly and efficiently with a higher confidence score than other YOLO variants. The threshold value was set to 0.3, which means if the confidence score is greater or equal to 30%, then the model categorizes it into the relevant class. It is noticed that the aquaculture net pens defects, including net holes and plastic debris, were detected with a higher confidence score of 90%.
Fig. 13.

Validation results for the aquaculture net pens defect detection task using the YOLOv5 model. The figure shows sample predictions with bounding boxes and confidence scores for two defect classes: hole (net damage) and plastic (debris entanglement). The model demonstrates reliable performance in identifying multiple instances of defects with varying sizes, positions, and lighting conditions across diverse underwater scenes.
To validate our work further, we deployed the best-trained YOLOv5 model as part of a real-time inspection setup, where the ROV streamed image data to a topside server for defect detection during the experiments. Table 4 reports the experimental results obtained on different datasets. We tested the net defect detection at different datasets, including far, closed, and good distance of the ROV with respect to the net plane. The idea is to elaborate further and validate the gradient-based ROV pose-keeping control scheme proposed in this study. Here, we emphasize that the proposed pose-keeping approach stabilizes the ROV at a good distance while aligning the net plane at the best field of view. This is evident from the table where the detector algorithm demonstrated better detection performance on the good distance dataset than the far and close distance datasets. In particular, the YOLOv5 model showed 0.71, 0.69, and 0.69 mAP, precision, and recall scores, respectively.
Table 4.
Validation results of YOLOv5 model for aquaculture net pens defect at different distances during the experiment in the pool setup.
| Dataset | mAP | Precsion | Recall | Gradient-range |
|---|---|---|---|---|
| Far | 0.68 | 0.52 | 0.62 | 25-30 |
| Close | 0.57 | 0.50 | 0.47 | 80-110 |
| Good | 0.71 | 0.69 | 0.69 | 50-60 |
Figures 14, 15, and 16 also visualize the detection of the aquaculture net pens on good, close, and far distance image sequences. The first and second columns show the good/close/far distance images and the corresponding aquaculture net pens defect detection. The third column shows the corresponding gradient information results. Here, it can be observed that the results obtained on the good distance image sequences showed better net view along with more aquaculture net pens defect detection rate in the range of 50-60 mean gradient. Although defect detection at a close distance (mean gradient in the range of 80-110) is also reported with high accuracy, the plane is not entirely covered in the camera view. On the other hand, when the ROV is far away from the plane (mean gradient in the range of 25-30), the net plane is not visible in the camera view. In far-distance images, the detector also showed very poor detection performance. These experimental results of the aquaculture net pens defect implied that the proposed gradient-based pose-keeping control scheme, which allows the ROV to stabilize itself at a good distance, is suitable for performing net inspection operations.
Fig. 14.

Qualitative evaluation of the YOLOv5 model for aquaculture net pens defect detection on good-distance dataset. The first two columns show the input and the corresponding detection results for a good-distance dataset. The third column shows the corresponding gradient information of the input image.
Fig. 15.

Qualitative evaluation of the YOLOv5 model for aquaculture net pens defect detection on close-distance dataset. The first two columns show the input and the corresponding detection results for a close-distance dataset. The third column shows the corresponding gradient information of the input image.
Fig. 16.

Qualitative evaluation of the YOLOv5 model for aquaculture net pens defect detection on far-distance dataset. The first two columns show the input and the corresponding detection results for a far-distance dataset. The third column shows the corresponding gradient information of the input image.
This work validated the effectiveness of our active vision-based approach for aquaculture net inspection. We demonstrated the net inspection system in the garden pool and the real marine fish farm. The results showed that our approach enabled the acquisition of high-resolution net images for the net inspection tasks. This is demonstrated by analyzing the performance of the YOLO variants on the three different distance classes, i.e., good/far/close. It was observed that the proposed scheme worked well and showed improved detection performance at good distances, while in the other two classes, the detector’s performance was decreased. We also demonstrated that the proposed method can produce a smooth curve of gradient values for a sequence of images at the same distance. This feature allowed us to design a closed-loop control law for the ROV forward/backward motion during the inspection tasks. The integration of net defect detection and controlling the ROV pose into the best field of view offer active real-time net inspection within the aquaculture environment.
Following common practices in marine robotic systems for net inspection12,41, we adopted lightweight CNN models and ensured our closed-loop latency is within the 60-100 ms range, validating the real-time feasibility of our system. The ROV system operated in a closed-loop with the topside computer over a wired Ethernet connection, receiving control commands and transmitting video streams in real time. In the following Table, we provide a detailed latency analysis of each module involved in the proposed framework for aquaculture net inspection system.
Table 5 summarizes the average computational time per frame for each component. The system operates at an effective frame rate of approximately 30 FPS, sufficient for maintaining closed-loop control with low-latency feedback. This meets the practical requirements for real-time inspection in dynamic marine environments, in line with prior real-time robotic inspection works8,15. These results confirm that the proposed system is capable of operating in real time, with a total latency of 68 milliseconds per frame, well within the constraints required for responsive underwater navigation and inspection. Furthermore, the YOLO-based detection runs selectively rather than on every frame, further optimizing runtime performance in practical deployment.
Table 5.
Average per-frame processing time of the core system components.
| Component | Avg. Time (ms) | Description |
|---|---|---|
| Distance Classification (MobileNetV2) | 22 | Lightweight inference on 416 x 416 image for estimating ROV distance to net. |
| Gradient Estimation | 8 | Mean gradient computation using Sobel filtering and thresholding. |
| PID Control Computation | 3 | Closed-loop error computation for distance and yaw angle setpoint. |
| YOLOv5 (Net Defect Detection) | 35 | Per-frame detection of net holes and plastic debris (optional for every frame). |
| Total System Latency | 68 | End-to-end frame processing time for control and perception. |
Discussion
The experimental results presented in the previous sections validate the effectiveness and robustness of the proposed active vision-based aquaculture net pen inspection framework. The system was rigorously evaluated across multiple modules in both a controlled garden pool setup and a real aquaculture environment to ensure generalizability and practical applicability.
For the control module, we assessed the ROV’s distance and yaw angle regulation capabilities under two distinct conditions. The garden pool provided a controlled setting with stable lighting and clear visibility, whereas the aquaculture environment introduced real-world complexities, such as water turbidity, biofouling, and dynamic flow disturbances. Across both environments, the controller demonstrated reliable performance by effectively minimizing gradient errors and maintaining the ROV’s position and orientation relative to the net plane, thereby confirming its adaptability and robustness.
For the defect detection module, various YOLO model variants were trained and evaluated on datasets captured under different ROV-to-net distance conditions-categorized as far, close, and good. The quantitative results reveal that detection performance is closely tied to the ROV’s pose. Notably, the good-distance dataset consistently yielded the highest mAP, precision, and recall scores, highlighting the importance of effective pose stabilization for high-quality visual inspection.
Furthermore, we presented a comprehensive evaluation combining both quantitative metrics (e.g., loss curves, detection accuracy, and system latency) and qualitative outcomes (e.g., visual detection results and gradient analysis). The experiments encompassed variations in environmental conditions, camera perspectives, vehicle alignment, and types of net defects, thereby showing applicability of the proposed system for aquaculture net pens inspection task.
Despite the promising results, several challenges remain. First, underwater lighting variability and suspended particulate matter can affect image quality, occasionally leading to false detections or unstable gradient responses. Second, the gradient-based control strategy, while effective in planar net scenarios, may require adaptation for more complex 3D structures or environments with dynamic obstacles. Additionally, the use of a topside server for detection introduces dependency on communication stability, which may be affected in harsher offshore environments.
Future work will focus on expanding the system’s autonomy by integrating onboard deep learning inference capabilities, enabling real-time inspection without reliance on external processing. Moreover, incorporating multimodal sensor fusion (e.g., sonar, depth, and inertial data) may improve robustness in visually degraded environments. Extending the framework to handle 3D net geometries, long-term inspections, and cooperative multi-ROV operations are also promising aspects for further research.
Conclusion
This paper presented an active vision-based approach for maintaining the pose of an ROV during aquaculture net inspection tasks. The proposed method utilizes gradient information from camera images to guide the ROV to the best pose relative to the net plane, ensuring high-resolution, clear net images are acquired for practical net inspection. A CNN-gradient-estimation-based controller is designed to achieve the desired distance and angle of the ROV relative to the aquaculture net pens structure. Additionally, the scheme incorporates a deep learning-based net defect detector, enabling the identification of net defects such as net holes and entangled plastic debris within the net structure. Experimental results from both a garden pool and a real aquaculture facility validate the effectiveness of the proposed approach, demonstrating its feasibility and potential for practical application. The CNN-based ROV motion controller exhibits robust performance in real environments, accommodating variations in lighting conditions and environmental disturbances for both forward/backward movement and heading adjustments. Furthermore, the scheme showcases improved net defect detection capabilities by employing the deep learning YOLO model. Future research will focus on path planning and convergence paths for the entire net structure to enhance system autonomy, enabling obstacle avoidance. Additionally, exploring the extension of the proposed scheme for inspecting other marine assets, such as ship hulls, will be considered.
Acknowledgements
The authors would like to thank the research team from LABUST, University of Zagreb, Croatia for providing contributions to the sea trails and collecting dataset.
Author contributions
W.A: Project conceptualization, methodology, experimentation, manuscript drafting, visualization. M.D: Detection model conceptualization, methodology, computer vision experimentation, drafting of computer vision section, visualization. M.H: Methodology, experimentation, manuscript review and editing. A.C: Manuscript review, editing, and final proofreading. L.S: Supervision, project administration. I.H: Supervision, project administration, funding acquisition.
Funding
This publication is based upon work supported by the Khalifa University of Science and Technology under Award No. RC1-2018-KUCARS-8474000136, CIRA-2021-085,MBZIRC-8434000194.
Data availability
The data presented in this study are available at:https://github.com/drwa92/rov_gradiant_control.
Code availability
The custom code and algorithms used in this study, including the distance classification, defect detection, and distance control, are publicly available at (https://github.com/drwa92/rov_gradiant_control). There are no restrictions on access or reuse.
Declarations
Competing interests
The authors declare no competing interests.
Footnotes
Publisher’s note
Springer Nature remains neutral with regard to jurisdictional claims in published maps and institutional affiliations.
Contributor Information
Waseem Akram, Email: waseem.akram@ku.ac.ae.
Irfan Hussain, Email: Irfan.Hussain@ku.ac.ae.
References
- 1.The World Bank. World bank data topics. https://datatopics.worldbank.org/ (2024). Accessed 4 May 2025.
- 2.UAE Food Security Office. Uae food security portal. https://www.foodsecurity.gov.ae/ (2025). Accessed: 2025-05-04.
- 3.Gui, F., Zhu, H. & Feng, D. Research progress on hydrodynamic characteristics of marine aquaculture netting. Fish. Mod46, 9–14 (2019). [Google Scholar]
- 4.Yan, G., Ni, X. & Mo, J. Research status and development tendency of deep sea aquaculture equipments: a review. J. Dalian Ocean. Univ.33, 123–129 (2018). [Google Scholar]
- 5.Zhou, W. et al. Current situation and development trend of marine seine culture in china. Fish. Inf. Strategy33, 259–266 (2018). [Google Scholar]
- 6.Comas Morte, J. Fouling management in cage aquaculture: New strategies on nets, fish health and economic impact (2018).
- 7.Wei, Y., Wei, Q. & An, D. Intelligent monitoring and control technologies of open sea cage culture: A review. Comput. electronics agriculture169, (2020).
- 8.Akram, W., Casavola, A., Kapetanović, N. & Miškovic, N. A visual servoing scheme for autonomous aquaculture net pens inspection using rov. Sensors22, 3525 (2022). [DOI] [PMC free article] [PubMed] [Google Scholar]
- 9.Kapetanović, N., Nad, D. & Mišković, N. Towards a heterogeneous robotic system for autonomous inspection in mariculture. In OCEANS 2021: San Diego–Porto, 1–6 (IEEE, 2021).
- 10.Wu, Y., Duan, Y., Wei, Y., An, D. & Liu, J. Application of intelligent and unmanned equipment in aquaculture: A review. Comput. Electron. Agric.199, 10.1016/j.compag.2022.107201 (2022).
- 11.Ohrem, S. J., Evjemo, L. D., Haugaløkken, B. O. A., Amundsen, H. B. & Kelasidi, E. Adaptive speed control of rovs with experimental results from an aquaculture net pen inspection operation. In 2023 31st Mediterranean Conference on Control and Automation (MED), 868–875 (IEEE, 2023).
- 12.Lee, H., Jeong, D., Yu, H. & Ryu, J. Autonomous underwater vehicle control for fishnet inspection in turbid water environments. Int. J. Control. Autom. Syst.20, 3383–3392 (2022). [Google Scholar]
- 13.Akram, W., Ahmed, M., Seneviratne, L. & Hussain, I. Autonomous underwater robotic system for aquaculture applications. arXiv preprint arXiv:2308.14762 (2023).
- 14.Akram, W. et al. Aquaculture defects recognition via multi-scale semantic segmentation. Expert systems with applications237, 121197 (2024). [Google Scholar]
- 15.Borković, G. et al. Underwater rov software for fish cage inspection. In 2021 44th International Convention on Information, Communication and Electronic Technology (MIPRO), 1747–1752 (IEEE, 2021).
- 16.Goričanec, J. et al. Heterogeneous autonomous robotic system in viticulture and mariculture-project overview. In 2021 16th International Conference on Telecommunications (ConTEL), 181–188 (IEEE, 2021).
- 17.Kapetanović, N. et al. Heterogeneous autonomous robotic system in viticulture and mariculture: Vehicles development and systems integration. Sensors22, 2961 (2022). [DOI] [PMC free article] [PubMed] [Google Scholar]
- 18.Osen, O. L. et al. A novel sea farm inspection platform for norwegian aquaculture application. In OCEANS 2018 MTS/IEEE Charleston, 1–8 (IEEE, 2018).
- 19.Osen, O. L., Sandvik, R.-I., Rogne, V., Zhang, H. et al. A novel low cost rov for aquaculture application. In OCEANS 2017-Anchorage, 1–7 (IEEE, 2017).
- 20.Constantinou, C. C., Loizou, S. G. & Georgiades, G. P. An underwater laser vision system for relative 3-d posture estimation to mesh-like targets. In 2016 IEEE/RSJ International Conference on Intelligent Robots and Systems (IROS), 2036–2041 (IEEE, 2016).
- 21.Chalkiadakis, V. et al. Designing a small-sized autonomous underwater vehicle architecture for regular periodic fish-cage net inspection. In 2017 IEEE International Conference on Imaging Systems and Techniques (IST), 1–6 (IEEE, 2017).
- 22.Livanos, G. et al. Intelligent navigation and control of a prototype autonomous underwater vehicle for automated inspection of aquaculture net pen cages. In 2018 IEEE International Conference on Imaging Systems and Techniques (IST), 1–6 (IEEE, 2018).
- 23.Tao, Q. et al. Omnidirectional surface vehicle for fish cage inspection. In OCEANS 2018 MTS/IEEE Charleston, 1–6 (IEEE, 2018).
- 24.Lin, T. X., Tao, Q. & Zhang, F. Planning for fish net inspection with an autonomous osv. In 2020 International Conference on System Science and Engineering (ICSSE), 1–5 (IEEE, 2020).
- 25.Duecker, D. A., Hansen, T. & Kreuzer, E. Rgb-d camera-based navigation for autonomous underwater inspection using low-cost micro auvs. In 2020 IEEE/OES Autonomous Underwater Vehicles Symposium (AUV), 1–7 (IEEE, 2020).
- 26.Schellewald, C., Stahl, A. & Kelasidi, E. Vision-based pose estimation for autonomous operations in aquacultural fish farms. IFAC-PapersOnLine54, 438–443 (2021). [Google Scholar]
- 27.Amundsen, H. B., Caharija, W. & Pettersen, K. Y. Autonomous rov inspections of aquaculture net pens using dvl. IEEE J. Ocean. Eng.47, 1–19 (2021). [Google Scholar]
- 28.Akram, W., Ahmed, M., Seneviratne, L. & Hussain, I. Evaluating deep learning assisted automated aquaculture net pens inspection using rov. arXiv preprint arXiv:2308.13826 (2023).
- 29.Akram, W., Bakht, A. B., Din, M. U. & Seneviratne, L. & Hussain, I (A benchmark study on detection and semantic segmentation. IEEE Access, 2024). [Google Scholar]
- 30.Zhao, Y.-P., Niu, L.-J., Du, H. & Bi, C.-W. An adaptive method of damage detection for fishing nets based on image processing technology. Aquac. engineering90, (2020).
- 31.Schellewald, C. & Stahl, A. Irregularity detection in net pens exploiting computer vision. IFAC-PapersOnLine55, 415–420 (2022). [Google Scholar]
- 32.Paraskevas, K. & Kavallieratou, E. Detecting holes in fishery nets using an rov. In 2022 International Conference on Electrical, Computer, Communications and Mechatronics Engineering (ICECCME), 1–5 (IEEE, 2022).
- 33.Madshaven, A., Schellewald, C. & Stahl, A. Hole detection in aquaculture net cages from video footage. In Fourteenth International Conference on Machine Vision (ICMV 2021), vol. 12084, 258–267 (SPIE, 2022).
- 34.Paspalakis, S., Moirogiorgou, K., Papandroulakis, N., Giakos, G. & Zervakis, M. Automated fish cage net inspection using image processing techniques. IET Image Process.14, 2028–2034 (2020). [Google Scholar]
- 35.Paraskevas, K. & Kavallieratou, E. Detecting holes in fish farming nets: A two–method approach. In 2023 International Conference on Control, Automation and Diagnosis (ICCAD), 1–7 (IEEE, 2023).
- 36.Zhang, Z., Gui, F., Qu, X. & Feng, D. Netting damage detection for marine aquaculture facilities based on improved mask r-cnn. J. Mar. Sci. Eng.10, 996 (2022). [Google Scholar]
- 37.Lian, L., Zhao, Y., Bi, C., Xu, Z. & Du, H. Research on the damage detection method of the plane fishing net based on the digital twin technology. prog. Fish. Sci43, 1–8 (2022). [Google Scholar]
- 38.Labra, J. et al. Robust automatic net damage detection and tracking on real aquaculture environment using computer vision. Aquac. Eng.101, (2023).
- 39.Betancourt, J., Coral, W. & Colorado, J. An integrated rov solution for underwater net-cage inspection in fish farms using computer vision. SN Appl. Sci.2, 1–15 (2020). [Google Scholar]
- 40.Qiu, W., Pakrashi, V. & Ghosh, B. Fishing net health state estimation using underwater imaging. J. Mar. Sci. Eng.8, 707 (2020). [Google Scholar]
- 41.Zacheilas, T. et al. An fpga-based system for video processing to detect holes in aquaculture nets. In 2021 IEEE 21st International Conference on Bioinformatics and Bioengineering (BIBE), 1–6 (IEEE, 2021).
- 42.Ubina, N. A. et al. Digital twin-based intelligent fish farming with artificial intelligence internet of things (aiot). Smart Agric. Technol.5, (2023).
- 43.Liao, W., Zhang, S., Wu, Y., An, D. & Wei, Y. Research on intelligent damage detection of far-sea cage based on machine vision and deep learning. Aquac. Eng.96 (2022).
- 44.Bochkovskiy, A., Wang, C.-Y. & Liao, H.-Y. M. YOLOv4: Optimal Speed and Accuracy of Object Detection (2020). ArXiv, 2020.
- 45.Jocher, G. et al. ultralytics/yolov5: v7.0 - YOLOv5 SOTA Realtime Instance Segmentation, 10.5281/zenodo.7347926 (2022).
- 46.Wang, C.-Y., Bochkovskiy, A. & Liao, H.-Y. M. Yolov7: Trainable bag-of-freebies sets new state-of-the-art for real-time object detectors. In Proceedings of the IEEE/CVF Conference on Computer Vision and Pattern Recognition, 7464–7475 (2023).
- 47.Jocher, G., Chaurasia, A. & Qiu, J. Yolo by ultralytics (2023).
- 48.Kapetanovic, N. & Vukovic, J. Blueye SDK-ROS2 interface. https://github.com/labust/blueye-ros2-pkg.git (2021). [Online; accessed 22-July-2021].
Associated Data
This section collects any data citations, data availability statements, or supplementary materials included in this article.
Data Availability Statement
The data presented in this study are available at:https://github.com/drwa92/rov_gradiant_control.
The custom code and algorithms used in this study, including the distance classification, defect detection, and distance control, are publicly available at (https://github.com/drwa92/rov_gradiant_control). There are no restrictions on access or reuse.