

Abstract
Transfer RNAs (tRNAs) play critical roles in the process of protein synthesis by decoding messenger RNA codons into amino acids, which is essential for cellular function across various biological pathways and for maintaining metabolic homeostasis. Available evidence implicates that tRNAs are involved in the progression of diverse diseases, underscoring the importance of accurately predicting tRNA–disease associations to understand disease mechanisms and support precision medicine. However, existing methods often struggle with the complexity and heterogeneity inherent in these associations. To address these challenges, we introduce contrastive hypergraph collaborative filtering (CoHGCL), a prediction framework that integrates hypergraph contrastive learning with collaborative filtering. CoHGCL employs graph attention networks to capture local structural features and random walk with restart algorithms to encode global topological patterns. Subsequently, a node-level contrastive learning mechanism alternates between standard graph and hypergraph representations to enhance multiview feature embeddings. These enriched representations are integrated by a collaborative filtering approach through the utilization of generalized matrix factorization for modeling linear associations and multilayer perceptrons for capturing nonlinear interactions. Extensive experimental results on five-fold cross-validation demonstrate that CoHGCL achieves superior performance compared to existing methods, with an area under the receiver operating characteristic curve of 0.9623, area under the precision-recall curve of 0.9430, outperforming all baselines across all metrics. Furthermore, case studies further confirm CoHGCL’s effectiveness in discovering novel and biologically meaningful tRNA–disease associations. The source code and datasets are publicly available at https://github.com/Ouyang-cmd/CoHGCL.
Keywords: tRNA-disease association, node-level contrastive learning, hypergraph, neural collaborative filtering
Introduction
DNA, RNA, and proteins play fundamental roles in the regulation of genetic information and cellular function. DNA serves as the repository of genetic codes, RNA transcribes and regulates this information, and proteins execute essential biological processes. Dysregulations in any of these biomolecules have been strongly associated with a wide spectrum of human diseases, including genetic disorders, neurodegenerative diseases, and various types of cancer [1–3]. Among these, cancer represents one of the most complex and dynamic disease categories, arising from uncontrolled cellular proliferation and influenced by numerous physical, chemical, and biological carcinogens [4]. Recent studies have further highlighted the etiological roles of pathogenic microorganisms, such as viruses and bacteria, in promoting tumorigenesis through host–microbe molecular interactions and immune disruption mechanisms [5–9]. According to projections by the World Health Organization (WHO), the global mortality rate due to cancer is expected to increase significantly, reaching an estimated 11.4 million deaths annually by the year 2030 [2, 3]. These alarming trends underscore the urgent need to explore disease mechanisms at the molecular level and to identify novel biomarkers for early diagnosis, prognosis, and therapeutic targeting.
In this context, transfer RNA (tRNA) is an essential noncoding RNA molecule that plays a fundamental role in protein synthesis [10]. By recognizing specific codons on messenger RNA (mRNA) and delivering corresponding amino acids [11], tRNAs ensure the accurate assembly of polypeptides, thereby maintaining cellular homeostasis and metabolic functions [12, 13]. Beyond their canonical role in translation, recent evidence indicates that tRNAs are involved in diverse biological processes, including gene expression regulation, cellular stress responses, and signal transduction [14]. Importantly, dysregulated expression and impaired function of tRNAs have been strongly associated with various diseases, including cancers, neurodegenerative disorders, and cardiovascular conditions [15, 16]. Consequently, investigating tRNA–disease associations is crucial not only for elucidating underlying molecular mechanisms [17] but also for identifying novel biomarkers and therapeutic targets, thereby advancing precision medicine [18].
Accurately predicting tRNA–disease associations is critical for understanding disease pathology, discovering biomarkers, and improving diagnostic and prognostic capabilities [19, 20]. Traditional experimental validation methods, however, are often time-consuming, costly, and inefficient, significantly limiting research progress [21, 22]. To address these limitations, comprehensive databases and computational tools have been developed for systematically collecting and analyzing RNA–disease association data, such as MNDR v3.0 [23] and RNADisease v4.0 [24]. Despite these advances, computational methods specifically designed for tRNA–disease associations remain scarce, primarily due to the complexity and heterogeneity of relevant biological datasets. Traditional models often rely on singular similarity metrics or simplistic feature representations, inadequately capturing the intricate multilayered relationships inherent in biological networks [25, 26].
In response, advanced computational methods, particularly those utilizing machine learning, have emerged as powerful tools. Recent approaches encompass similarity-based methods [27], graph convolutional networks (GCNs) [28], multiview learning [29], graph contrastive learning (GCL) [30], and hypergraph learning [31]. Early computational strategies operated under the assumption that noncoding RNAs (ncRNAs) with similar functions likely associate with similar diseases [32, 33]. However, these approaches often rely heavily on handcrafted similarity features, limiting their capability to model hierarchical and complex relationships between ncRNAs and diseases [34]. Recently, graph neural network (GNN)-based models, which effectively exploit node dependencies and network topology, have gained prominence. For example, Wang et al. [35] introduced iSG-PDA (incorporating sequence multi-source information with graph convolutional networks for piRNA–disease association), which employs GCNs to extract latent features from multimodal datasets, while iPiDA-GCN [36] enhances prediction performance by incorporating prior biological knowledge into unified graph representations.
Nevertheless, conventional GNNs still face challenges such as information loss and limited generalization capacity [37]. To address these issues, graph contrastive learning methods have been developed, comparing graph structures or node embeddings to preserve structural information and reduce data noise [38, 39]. For instance, GDCL-NcDA (identifying non-coding RNA–disease associations via contrastive learning between deep graph learning and deep matrix factorization) [40] uses contrastive learning to improve generalization, and ACLNDA (asymmetric graph contrastive learning for predicting noncoding RNA–disease associations in heterogeneous graphs) [41] minimizes computational overhead without heavy dependence on augmentation techniques. Additionally, hypergraph learning methods have been proposed to capture higher order dependencies and complex relationships among nodes, thereby enhancing prediction accuracy [42, 43]. Models such as HFHLMDA [44] and HCGCCDA [45] have demonstrated substantial improvements by integrating hypergraph structures and convolutional operations.
In this study, we introduce CoHGCL, a novel framework integrating hypergraph contrastive learning and collaborative filtering to predict tRNA–disease associations effectively. CoHGCL utilizes graph attention networks (GAT) to extract local, low-order node features and the random walk with restart (RWR) algorithm to capture global, high-order topological patterns. A node-level contrastive learning mechanism alternates between standard graphs and hypergraphs, enriching multiview node representations. Finally, these enriched embeddings are fused using collaborative filtering techniques, specifically generalized matrix factorization for linear interactions and multilayer perceptrons (MLP) for modeling nonlinear associations, significantly enhancing predictive accuracy.
Materials and methods
Dataset
The dataset employed in this study was obtained from RNADisease v4.0, an expanded and enhanced version of the MNDR v3.0 database. RNADisease v4.0 provides comprehensive RNA-disease association records across multiple RNA types, including miRNAs, lncRNAs, and tRNAs, linked to 4090 distinct diseases. For the current analysis, we extracted a subset containing 1067 tRNAs, 91 diseases, and 1168 experimentally validated associations. From this subset, we constructed an adjacency matrix  , where
  and
and  represent the numbers of tRNAs and diseases, respectively. Each element
  is set to 1 if an association between tRNA
  and disease
  exists, and 0 otherwise.
Overview of CoHGCL
The overall architecture of CoHGCL is depicted in Fig. 1. CoHGCL introduces a novel methodology for tRNA–disease association prediction, leveraging end-to-end learning from randomly initialized node features. It jointly captures local and global graph structures, wherein the GAT component models local neighborhood interactions, and the RWR algorithm incorporates global topological context into the learned representations.
Figure 1.

Overview of the CoHGCL architecture. (1) Latent representation learning: initializes node features randomly, and leverages graph attention networks to capture local, low-order node features, while employing random walk with restart for global, high-order topological features, thereby enabling comprehensive node representations. (2) Node-level contrastive learning: alternates between standard GCN and HGCN to generate dual-view node embeddings. Embeddings from the same node across views form positive pairs, while embeddings from different nodes constitute negative pairs, enhancing node representations via contrastive learning. (3) Prediction and optimization: the refined node embeddings are fed into a collaborative filtering module, integrating GMF for linear relationships and MLP for nonlinear interactions, facilitating accurate prediction of tRNA–disease associations.
To further enhance the quality of node embeddings, CoHGCL utilizes a dual-view contrastive learning mechanism, alternating between standard GCN and hypergraph convolutional networks (HGCN). Embeddings from the same node across these two views are treated as positive pairs, whereas embeddings from different nodes constitute negative pairs. This strategy effectively leverages both graph-based and hypergraph-based structures, significantly enriching node feature representations.
In the final prediction phase, optimized node embeddings are input into a collaborative filtering module. By combining generalized matrix factorization and multilayer perceptron models, CoHGCL effectively captures both linear and nonlinear interactions between tRNAs and diseases, enhancing the accuracy and robustness of association predictions.
Latent representation learning
Extraction of low-order localized features
To precisely characterize the latent relationships between tRNA and diseases, we develop a synergistic node representation framework combining low-order neighborhood information with high-order global structures.
Initially, we apply a graph attention network [46] to capture local low-order features for each node. Specifically, the low-order embedding  of node
  is calculated as follows:
 |
(1) |
where  represents attention coefficients from node
  to node
  ,
,  denotes immediate neighbors of node
  ,
,  is a learnable weight matrix, and
  denotes the activation function.
Extraction of high-order global features
Subsequently, to capture global high-order information, we introduce the random walk with restart algorithm. The steady-state high-order feature  for node
  is calculated as:
 |
(2) |
where  is the normalized adjacency matrix derived from comprehensive node similarities,
  represents the low-order feature vector of node
  , and
, and  is the restart probability set to 0.4.
 |
(3) |
After iterative convergence, the resulting steady-state distribution z_i captures high-order topological characteristics, succinctly denoted as  for tRNA nodes and
  for disease nodes. These high-order features
  are subsequently integrated with the low-order features
  to generate comprehensive node representations
  .
.
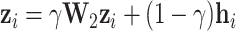
Node-level contrastive learning for multiview feature enhancement
To further enrich node feature representations, we introduce a node-level contrastive learning framework designed to leverage multiview feature enhancement. Inspired by Wu et al. [38], we construct two distinct view representations for both tRNA and disease nodes: a standard graph view using GCN and an HGCN. We implement a three-layer collaborative graph neural network that alternately fuses node representations from these standard and hypergraph views, effectively capturing hierarchical feature information.
To promote consistent and discriminative node embeddings, we adopt contrastive learning based on the InfoNCE loss function. Specifically, representations from the standard and hypergraph views of the same node are treated as positive pairs, whereas representations from different nodes are considered negative pairs. This strategy aims to maximize the similarity between cross-view embeddings of the same node while minimizing the similarity between embeddings of different nodes, significantly enhancing the robustness of the resulting node representations.
Standard graph-guided hypergraph feature enhancement
In this module, we utilize the standard graph view to guide the enhancement of hypergraph-based node representations. Starting with node embeddings derived from the standard graph view, denoted as  , we introduce cross-view augmentation to enrich the hypergraph structure’s feature representations. The augmented features obtained from
  are employed to enhance the hypergraph node representations
  .
.
Formally, the feature augmentation process is defined as follows:
 |
(4) |
where  denotes a nonlinear activation function. The hypergraph is represented by an incidence matrix
  , where
  and
and  correspond to the number of nodes and hyperedges, respectively. The diagonal matrix
  contains the weights of hyperedges.
  and
and  are diagonal matrices representing the degrees of nodes and hyperedges. The learnable parameters at the
  -th layer of HGCN are denoted by
  .
.
To enforce consistency between the standard graph and hypergraph representations for the same node, and simultaneously increase the divergence between different nodes, we adopt a node-level contrastive learning objective based on the InfoNCE loss. The contrastive loss function can be formulated as:
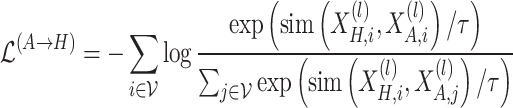 |
(5) |
where  denotes the similarity function, typically implemented as cosine similarity.
  is the temperature parameter. The positive pairs
  correspond to the representations of the same node across different views, while the negative pairs
 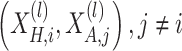 , enforce inter-node discrimination.
Hypergraph-guided standard graph feature enhancement
Next, based on the augmented feature views, the hypergraph-guided standard graph enhancement is used to refine the feature representations. The feature enhancement process of the standard graph node  is expressed as:
 |
(6) |
where  is the trainable weight matrix. Here,
  represents the adjacency matrix of the standard graph, and
  is the diagonal degree matrix with
  .
.
The corresponding contrastive loss for this process is:
 |
(7) |
This process iteratively applies mutual enhancement by refining the cross-view augmentations. The final objective is to optimize the mutual enhancement between the standard graph and hypergraph features, with the contrastive learning loss across views being defined as:
 |
(8) |
Prediction and optimization
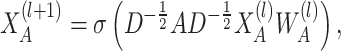
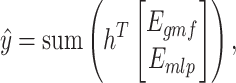
After obtaining the node representations  , we utilize a neural collaborative filtering framework to predict potential associations between tRNAs and diseases. Specifically, we adopt a joint modeling approach that integrates generalized matrix factorization and a multilayer perceptron to capture both linear and nonlinear interactions between node pairs.
The generalized matrix factorization (GMF) component models the element-wise interactions between the tRNA and disease node embeddings, while the MLP component learns complex nonlinear relationships based on their concatenated features. Formally, the representations are computed as follows:
 |
(9) |
where  denotes the element-wise product.
Subsequently, we combine the outputs of GMF and MLP through a weighted summation, followed by an aggregation function to obtain the final prediction score:
 |
(10) |
where  denotes a trainable weight vector that balances the contributions of the GMF and MLP components.
The overall objective function jointly optimizes the collaborative filtering loss and the contrastive learning loss. The prediction loss is defined as a cross-entropy loss between the predicted labels  and the ground-truth labels
  , while the contrastive loss enforces consistency and discrimination among the learned node embeddings. The resulting loss formulation is given by:
 |
(11) |
where  regulates the trade-off between the collaborative filtering loss and the contrastive learning loss.
Results
Experiment setting
To rigorously assess the efficacy of the CoHGCL model in predicting latent associations between tRNA and disease, we implemented five-fold cross-validation on the experimental dataset. Additionally, the data were partitioned in an 8:1:1 ratio into training, validation, and test sets to further evaluate model performance. The model architecture was systematically optimized, with the number of hyperedges selected from 32, 64, 128, 256 and the feature embedding dimensions from 16, 32, 64, 128, 256, to evaluate their influence on model performance. To enhance nonlinearity representation and ensure stable gradient propagation, we employed the ReLU activation function, while the Adam optimizer facilitated efficient convergence.
For performance evaluation, we benchmarked CoHGCL against state-of-the-art models using AUC (area under the receiver operating characteristic curve), AUPR (area under the precision–recall curve), recall, precision, and F1-score. Notably, the top-ranked disease-associated tRNAs identified via computational inference offer valuable insights for subsequent biological validation, potentially advancing mechanistic understanding and translational applications.
Comparison with other methods
This section provides a comparative analysis between the proposed CoHGCL method and several existing representative models:
PTDA-SWGCL [47]: Integrates Gaussian kernel, sequence, and semantic similarities to create initial node embeddings, optimized through weighted graph-based contrastive learning. Final predictions are obtained by inner product between embeddings.
GAEMDA [48]: Employs a graph autoencoder architecture to uncover miRNA–disease relationships, using a GNN encoder with aggregators and MLP layers, followed by a bilinear decoder for interaction prediction.
AMHMDA [49]: Combines attention mechanisms with multiview similarity graphs and hypergraph learning, leveraging GCNs to integrate similarity data and hypernodes to enhance connectivity.
MSHGANMDA [50]: Utilizes heterogeneous graph frameworks and attention mechanisms, organizing data into metasubgraphs and employing metalevel and semantic attention, with final predictions generated via a dense layer.
NSAMDA [51]: Uses a GAT-based architecture for miRNA–disease associations, employing dynamic neighbor selection and attention mechanisms, with predictions derived from an inner product decoder.
We evaluated these models using both five-fold cross-validation and an 8:1:1 train-validation-test split. As demonstrated in Tables 1 and 2, CoHGCL consistently outperformed baseline methods across all evaluation metrics. Particularly, CoHGCL showed significant improvements in predictive accuracy and generalization capability, indicating robust performance in practical scenarios.
Table 1.
The results of five-fold cross-validation. The table reports five key evaluation metrics: AUC, AUPR, F1-score, Recall, and Precision, where CoHGCL achieves superior performance across all metrics
| Models | AUC | AUPR | F1-score | Recall | Precision |
|---|---|---|---|---|---|
| PTDA-SWGCL | 0.8799 | 0.8843 | 0.8142 | 0.8938 | 0.7485 |
| GAEMDA | 0.9354 | 0.9330 | 0.8592 | 0.9113 | 0.8134 |
| AMHMDA | 0.9444 | 0.9413 | 0.8766 | 0.9006 | 0.8543 |
| MSHGANMDA | 0.9345 | 0.9311 | 0.8595 | 0.8596 | 0.8601 |
| NSAMDA | 0.9345 | 0.9317 | 0.8576 | 0.8698 | 0.8460 |
| CoHGCL | 0.9623 | 0.9430 | 0.9201 | 0.9286 | 0.9143 |
Bold values denote the best result per metric.
Table 2.
Comparison results with the other five models on the test set
| Models | AUC | AUPR | F1-score | Recall | Precision |
|---|---|---|---|---|---|
| PTDA-SWGCL | 0.8820 | 0.8875 | 0.7916 | 0.8793 | 0.7144 |
| GAEMDA | 0.9478 | 0.9442 | 0.8679 | 0.9106 | 0.8292 |
| AMHMDA | 0.9415 | 0.9375 | 0.8720 | 0.8992 | 0.8474 |
| MSHGANMDA | 0.9253 | 0.9186 | 0.8478 | 0.8547 | 0.8412 |
| NSAMDA | 0.9396 | 0.9368 | 0.8715 | 0.8889 | 0.8562 |
| CoHGCL | 0.9584 | 0.9547 | 0.9284 | 0.9267 | 0.9301 |
Bold values denote the best result per metric.
The ROC and PR curves in Fig. 2 further validate these findings. CoHGCL maintained higher sensitivity and precision, achieving an optimal balance between true-positive identification and false-positive control. Unlike other models that typically demonstrate trade-offs between recall and precision, CoHGCL consistently produced balanced results, demonstrating its capability to model both global and fine-grained relationships effectively.
Figure 2.

Performance comparison of ROC curves and PR curves between CoHGCL and baselines under five-fold CV.
Ablation study
As detailed in Table 3 and visualized in Fig. 3, each component of CoHGCL plays an essential role in the model’s overall performance. We designed three ablated variants—CoHGCL-NR, CoHGCL-NCL, and CoHGCL-NCF—by systematically removing the node representation module, contrastive learning module, and collaborative filtering module, respectively. The performance of each variant was evaluated across five metrics: AUC, AUPR, F1, Recall, and Precision.
Table 3.
The results of ablation study
| Models | AUC | AUPR | F1-score | Recall | Precision |
|---|---|---|---|---|---|
| CoHGCL-NR | 0.947 | 0.919 | 0.901 | 0.909 | 0.895 |
| CoHGCL-NCL | 0.950 | 0.926 | 0.903 | 0.913 | 0.900 |
| CoHGCL-NCF | 0.955 | 0.932 | 0.911 | 0.919 | 0.906 |
| CoHGCL | 0.962 | 0.943 | 0.920 | 0.928 | 0.914 |
Bold values denote the best result per metric.
Figure 3.

Ablation analysis of CoHGCL, visualized as a radar plot across five evaluation metrics. The plot shows performance changes after removing key components (NR: node representation, NCL: node-level contrastive learning, NCF: neural collaborative filtering) compared to the full CoHGCL model.
CoHGCL-NR: Removes the node representation module, effectively eliminating both the extraction of low-order localized features via GAT and high-order global features via RWR.
CoHGCL-NCL: Removes the node-level contrastive learning strategy, omitting feature refinement through multiview representation alignment.
CoHGCL-NCF: Excludes the collaborative filtering module, thereby removing the capacity to model linear and nonlinear interactions through GMF and MLP.
Among the ablations, CoHGCL-NR resulted in the greatest performance degradation (AUC: 0.947, AUPR: 0.919), demonstrating the fundamental importance of structural representation learning. Removing this module deprives the model of both local neighborhood encoding and global topological awareness, forcing reliance on uninformative raw node attributes.
CoHGCL-NCL also showed a notable decline in all metrics, confirming that contrastive learning across graph and hypergraph views enhances the discriminative capacity of node embeddings. Meanwhile, CoHGCL-NCF, though slightly better than the other ablations, still underperformed relative to the full model, highlighting the value of explicitly modeling interaction patterns for final prediction. Collectively, these results indicate that each component meaningfully contributes to CoHGCL’s predictive power. The full model, which integrates structural encoding, contrastive learning, and collaborative filtering, achieves the best balance across all evaluation metrics.
Parameter sensitivity analysis
To systematically evaluate the influence of key factors, we conducted a series of experiments focusing on the number of hyperedges and the embedding dimension. The analysis was carried out on the benchmark dataset using five-fold cross-validation. This analysis aimed to understand how these hyperparameters influence model generalization, with all other parameters held constant to ensure robustness and reproducibility. Additionally, we monitored the training dynamics by tracking the loss function over epochs. As illustrated in Fig. 4, the loss decreased rapidly during the early phase of training and gradually stabilized as training progressed. Both training and validation loss curves converged smoothly without significant divergence, indicating stable optimization and minimal overfitting. This pattern reflects effective parameter initialization and a properly tuned learning schedule, contributing to the model’s generalization capability.
Figure 4.

The change curve of the loss function under different epochs.
Influence of embedding dimension
We evaluated the influence of embedding size by varying the dimensions across a set of values (16, 32, 64, 128, and 256) while keeping other parameters fixed. Model performance was measured using the AUC and AUPR, key metrics for evaluating classification performance, particularly with imbalanced datasets.
Figure 5a shows the performance results as a function of embedding dimension. The model’s performance improved steadily with increasing embedding dimension, achieving an optimal balance at a dimension of 64. Further increasing the embedding size beyond 64 led to performance deterioration, suggesting diminishing returns and potential overfitting at higher dimensions.
Figure 5.

Parameter sensitivity visualization.
Influence of hyperedge number
In the second phase of our parameter sensitivity analysis, we systematically investigated the effect of varying the number of hyperedges in the hypergraph construction process. Specifically, we evaluated model performance using 32, 64, 128, and 256 hyperedges. The number of hyperedges directly influences the model’s ability to capture high-order relationships among nodes, thereby affecting the expressiveness and granularity of the learned structural information.
As shown in Fig. 5b, the model achieved its best performance when using 64 hyperedges, with the highest AUC (0.9623) and AUPR (0.9430) values. Interestingly, both fewer (32) and more (128 and 256) hyperedges resulted in performance degradation. In particular, using only 32 hyperedges may lead to insufficient structural coverage, while an excessive number of hyperedges can introduce redundant or noisy connections, weakening the discriminative power of node representations and ultimately impairing predictive accuracy.
Embedding visualization
The distributions of tRNA–disease pairs before and after training with the CoHGCL model are visualized using t-distributed stochastic neighbor embedding (t-SNE) in Fig. 6. In the left panel (before training), the embeddings of positive and negative pairs are randomly scattered across the space, indicating an absence of meaningful relational structure between the two classes.
Figure 6.

t-SNE visualization of tRNA–disease pair embeddings before and after training with the CoHGCL model. The left panel (a) shows a random and unstructured distribution of positive and negative pairs prior to training, reflecting the absence of meaningful relational signals. The right panel (b) illustrates that after training, the embeddings of positive and negative pairs form well-separated and coherent clusters, indicating that CoHGCL effectively learns to distinguish true associations from nonassociations based on underlying structural patterns.
In contrast, after training with CoHGCL (right panel), the embeddings of positive and negative pairs form clearly distinguishable patterns, with improved separation and clustering. This structured distribution demonstrates that CoHGCL effectively captures the underlying interaction patterns between tRNA and disease entities. The emergence of these meaningful clusters reflects the model’s capability to differentiate biologically plausible associations from irrelevant ones, thereby enhancing representational quality and predictive accuracy. This pairwise-level t-SNE visualization [52] further highlights the benefits of contrastive learning over heterogeneous graphs in guiding the model to learn discriminative embeddings that encode association likelihood, rather than simply separating node types.
Case study
To comprehensively evaluate the real-world applicability of CoHGCL, we conducted case studies focusing on three diseases with distinct clinical and biological significance: breast cancer [53], colorectal cancer [54], and COVID-19 [55]. These diseases were selected for their epidemiological importance, varying pathological mechanisms, and representative value within oncology and infectious disease research. Breast and colorectal cancers are among the most commonly diagnosed malignancies globally, each characterized by well-studied molecular networks, whereas COVID-19 represents an emerging infectious disease, enabling the assessment of CoHGCL’s ability to identify regulatory RNA interactions under pathogenic conditions [56].
In the case of breast cancer, CoHGCL leveraged known tRNA–disease associations to prioritize candidate tRNAs potentially involved in disease regulation. As shown in Table 4, the top 20 predicted candidates include both previously validated and novel tRNAs. Notably, tRF-LeuAAG/TAG (PMID: 39659673), tiRNA-Val-CAC-001 (PMID: 35958946), and tRNA-Val-AAC-2 (PMID: 33092114) have been implicated in cancer-related processes. Additionally, tRF-03358 (PMID: 39247588) and tsRNA-Leu (PMID: 34858784) were supported by recent studies on tumor biology. Among the 20 candidates, 15 are supported by literature, demonstrating the model’s ability to uncover biologically relevant associations. The remaining three, such as tRF-3-tRNA-Ala-TGC-4-1 and tsRNA-Ala, represent promising targets for further experimental validation.
Table 4.
The top 20 tRNA candidates of breast neoplasms-correlated
| tRNA | PMID | tRNA | PMID |
|---|---|---|---|
| tRF-LeuAAG/TAG | 39659673 | tRF-3-tRNA-Ala-TGC-4-1 | Unconfirmed |
| tRF-Gly-CCC-036 | 31136199 | tiRNA-Val-CAC-001 | 35958946 |
| tRF-Val-AAC-027 | 31136199 | tRNA-Val-AAC-2 | 33092114 |
| tRF-Met-CAT-007 | 31136199 | tRNA-Val-TAC-2 | 33092114 |
| tiRNA-Met-CAT-001 | 33723340 | tRNA-Val-TAC-1 | 34937946 |
| tRF-Glu-CTC-016 | 31136199 | tsRNA-Ala | Unconfirmed |
| tRF-Cys-GCA-02 | Unconfirmed | tRF-03358 | 39247588 |
| tRF-Arg-TCT-007 | 31136199 | tsRNA-Leu | 34858784 |
| tRNALeu | 35143945 | tRNA-Gly-TCC-2 | Unconfirmed |
| tRF-3-tRNA-Asp-GTC-2-7 | Unconfirmed | tRNA-Gly-CCC-2 | 37767630 |
For colorectal cancer, CoHGCL identified a distinct set of tRNA candidates, with partial overlap with those associated with breast cancer. As listed in Table 5, key validated candidates include tRF-LeuAAG/TAG (PMID: 37259935), tRNALeu (PMID: 26189042), and tRNA-Gly-CCC-2 (PMID: 36755335), all of which have been associated with gastrointestinal tract function or colorectal tumor development. Other supported tRNAs include tsRNA-MetCAT-37 (PMID: 39247588) and tsRNA-Asn (PMID: 39572775), further confirming the model’s ability to identify relevant regulatory signals. Of the 20 top-ranked predictions, 15 were corroborated by existing studies, while 5—including tRNA-Gly-TCC-2 and tRNA-Val-TAC-2—emerge as novel candidates worthy of future investigation.
Table 5.
The top 20 tRNA candidates of colorectal neoplasms-correlated
| tRNA | PMID | tRNA | PMID |
|---|---|---|---|
| tRF-LeuAAG/TAG | 37259935 | tRNA-Gly-TCC-2 | Unconfirmed |
| tRNALeu | 26189042 | tRNA-Gly-CCC-2 | 36755335 |
| tRF-22-8XF6RE98N | 40140670 | tRNA-Glu-TTC-4 | Unconfirmed |
| tRF-Arg-TCT-007 | 31136199 | tRNA-Gln-TTG-2 | Unconfirmed |
| tRF-Val-AAC-027 | 31136199 | tsRNA-Ala | 33388834 |
| tRF-Cys-GCA-02 | Unconfirmed | tsRNA-MetCAT-37 | 39247588 |
| tRF-20-S998LO9D | 40261523 | tsRNA-Asn | 39572775 |
| tRF-Met-CAT-007 | 31136199 | tsRNA-Lys | 40295511 |
| tRF-Pro-CGG | 26694924 | tRNA-Val-TAC-2 | Unconfirmed |
| tRNA-Val-AAC-2 | 40627844 | tsRNA-Tyr | 33388834 |
In the context of COVID-19, where the roles of noncoding RNAs are still under active exploration, CoHGCL was applied to infer tRNAs potentially involved in SARS-CoV-2-associated pathways. As presented in Table 6, top-ranked predictions such as i-tRF-GlyGCC (PMID: 35645336), tRNA-Leu-CAG-2 (PMID: 38889150), and tsRNA-Lys (PMID: 35337020) have been linked to immune modulation or viral response mechanisms. Additionally, tRF3008A (PMID: 39744232) and tiRNA-Gly (also PMID: 39744232) have demonstrated regulatory effects on virus–host interactions. Among the 20 predictions, 12 had literature support, while 8—such as tDR-0009, tsRNA-Tyr, and tRNA-Val-TAC-2—have not yet been experimentally confirmed, offering new directions for understanding RNA-based regulation in viral pathogenesis.
Table 6.
The top 20 tRNA candidates of COVID-19-correlated
| tRNA | PMID | tRNA | PMID |
|---|---|---|---|
| i-tRF-GlyGCC | 35645336 | tRNA-Leu-CAG-2 | 38889150 |
| tRNALeu | 8358788 | tRNA-Val-AAC-2 | Unconfirmed |
| tRNA-Glu-TTC-4 | Unconfirmed | tRNA-Val-TAC-1 | Unconfirmed |
| tsRNA-Tyr | Unconfirmed | tRNA-Val-TAC-2 | Unconfirmed |
| tsRNA-Lys | 35337020 | tRNA-Gln-TTG-2 | Unconfirmed |
| tsRNA-Leu | 39744232 | tiRNA-Gly | 39744232 |
| tsRNA-Asn | 37023748 | tRFLys-CTT-010 | 35742999 |
| tsRNA-Ala | 40294208 | tRNAGlu | 16330750 |
| tRNA-Gly-CCC-2 | 33581077 | tDR-0009 | Unconfirmed |
| tRNA-Gly-TCC-2 | Unconfirmed | tRF3008A | 39744232 |
Collectively, these case studies demonstrate CoHGCL’s robust performance in accurately identifying known tRNA–disease associations across diverse disease contexts, encompassing both oncological and infectious diseases. Furthermore, the identification of multiple novel yet high-confidence candidates emphasizes the model’s potential to facilitate the discovery of new biological insights, warranting future experimental validation.
Conclusion and discussion
In this study, we introduced CoHGCL, a novel computational framework designed for accurately predicting tRNA–disease associations by addressing the inherent complexity and high-dimensionality of these interactions. CoHGCL uniquely integrates hypergraph contrastive learning with collaborative filtering, overcoming limitations commonly observed in traditional methods, particularly their inability to effectively handle multiview and heterogeneous biological data. To robustly model their hidden associations, CoHGCL exploits both local neighborhood dependencies and global structural patterns. Moreover, the framework employs alternating contrastive learning between standard graphs and hypergraphs, significantly refining node embeddings and enhancing the model’s capacity to discern complex biological relationships. By incorporating multiview representations via collaborative filtering—specifically combining generalized matrix factorization and multilayer perceptron—CoHGCL effectively identifies both linear and nonlinear interaction patterns.
Experimental results demonstrated that CoHGCL consistently surpasses existing state-of-the-art approaches, achieving superior accuracy and predictive capability in identifying tRNA–disease associations. Specifically, we now report that CoHGCL achieved an AUC of 0.9623, AUPR of 0.9430 under five-fold cross-validation, outperforming all baseline models across all metrics. Furthermore, ablation results show that each component is essential, as their removal leads to notable performance drops. Finally, we briefly mention that case studies on breast cancer, colorectal cancer, and COVID-19 demonstrate CoHGCL’s ability to identify both known and novel tRNA–disease associations, validating its practical utility.
Despite these significant advancements, challenges persist, particularly in terms of scalability and generalization to more complex or imbalanced datasets. Future research directions should prioritize the integration of diverse biological data types, such as gene expression profiles, epigenetic modifications, and tissue-specific annotations, to enhance biological fidelity. Additionally, CoHGCL can be extended to predict associations involving other noncoding RNAs, including lncRNAs, circRNAs, and piRNAs, enabling broader applicability across RNA types. Transfer learning techniques could further improve performance in data-sparse conditions, especially for rare diseases. Moreover, introducing explainable learning modules may help uncover biologically meaningful patterns and improve transparency. By extending contrastive learning beyond the output layer to incorporate multilayer features, CoHGCL provides deeper insights into biological associations, presenting valuable avenues for further computational biology and precision medicine developments.
Key Points
We introduce CoHGCL, a novel framework for accurately predicting tRNA–disease associations, designed to effectively manage multiview data and heterogeneous biological information.
CoHGCL constructs synergistic node representations by integrating low-order neighborhood features with high-order global topological structures, enabling comprehensive modeling of tRNA and disease entities.
The framework combines hypergraph-based contrastive learning with collaborative filtering, effectively capturing both linear and nonlinear interaction patterns between tRNAs and diseases.
Extensive experimental evaluations demonstrate that CoHGCL significantly outperforms existing methods in both predictive accuracy and computational efficiency, while also addressing key limitations of traditional contrastive learning approaches.
Acknowledgements
The authors acknowledge the High-Performance Computing Center of Central South University for providing computational resources.
Contributor Information
Tianxiang Ouyang, School of Computer Science and Engineering, Central South University, 932 Lushan South Road, Yuelu District, Changsha, Hunan 410083, China.
Yuanpeng Zhang, School of Software, Xinjiang University, 666 Shengli Road, Tianshan District, Urumqi, Xinjiang 830046, China.
Zhijian Huang, School of Computer Science and Engineering, Central South University, 932 Lushan South Road, Yuelu District, Changsha, Hunan 410083, China.
Lei Deng, School of Computer Science and Engineering, Central South University, 932 Lushan South Road, Yuelu District, Changsha, Hunan 410083, China.
Author contributions
T.O. and L.D. jointly conceived the main idea and designed the overall framework. T.O. conducted the experiments, including setup, execution, data collection, and result analysis. L.D. revised the manuscript and provided funding support. All authors contributed to writing, revising, and approving the final version.
Funding
This research was supported by the National Natural Science Foundation of China (Grant Nos U23A20321 and 62272490) and the Natural Science Foundation of Hunan Province of China (Grant No. 2025JJ20062).
References
- 1. Ames BN, Gold LS. Natural chemicals, synthetic chemicals, risk assessment, and cancer. Princess Takamatsu Symp 1990;21:303–14. [PubMed] [Google Scholar]
- 2. Khan S. Potential role of Escherichia coli DNA mismatch repair proteins in colon cancer. Crit Rev Oncol Hematol 2015;96:475–82. 10.1016/j.critrevonc.2015.05.002 [DOI] [PubMed] [Google Scholar]
- 3. Shahanavaj Khan S, Mosvi N, Vohra S. et al. Implication of calcium supplementations in health and diseases with special focus on colorectal cancer. Crit Rev Clin Lab Sci 2024;61:496–509. 10.1080/10408363.2024.2322565 [DOI] [PubMed] [Google Scholar]
- 4. Khan S, Zakariah M, Rolfo C. et al. Prediction of mycoplasma hominis proteins targeting in mitochondria and cytoplasm of host cells and their implication in prostate cancer etiology. Oncotarget 2016;8:30830–43. 10.18632/oncotarget.8306 [DOI] [PMC free article] [PubMed] [Google Scholar]
- 5. Khan S, Zakariah M, Palaniappan S. Computational prediction of mycoplasma hominis proteins targeting in nucleus of host cell and their implication in prostate cancer etiology. Tumor Biol 2016;37:10805–13. 10.1007/s13277-016-4970-9 [DOI] [PubMed] [Google Scholar]
- 6. Khan S, Imran A, Khan AA. et al. Systems biology approaches for the prediction of possible role of Chlamydia pneumoniae proteins in the etiology of lung cancer. PloS One 2016;11:e0148530. 10.1371/journal.pone.0148530 [DOI] [PMC free article] [PubMed] [Google Scholar]
- 7. Wang Y, Imran A, Shami A. et al. Decipher the Helicobacter pylori protein targeting in the nucleus of host cell and their implications in gallbladder cancer: an insilico approach. J Cancer 2021;12:7214–22. 10.7150/jca.63517 [DOI] [PMC free article] [PubMed] [Google Scholar]
- 8. Khan S, Zaidi S, Alouffi AS. et al. Computational proteome-wide study for the prediction of Escherichia coli protein targeting in host cell organelles and their implication in development of colon cancer. ACS Omega 2020;5:7254–61. 10.1021/acsomega.9b04042 [DOI] [PMC free article] [PubMed] [Google Scholar]
- 9. Zakariah M, Khan S, Chaudhary AA. et al. To decipher the mycoplasma hominis proteins targeting into the endoplasmic reticulum and their implications in prostate cancer etiology using next-generation sequencing data. Molecules 2018;23:994. 10.3390/molecules23050994 [DOI] [PMC free article] [PubMed] [Google Scholar]
- 10. Suzuki T. The expanding world of tRNA modifications and their disease relevance. Nat Rev Mol Cell Biol 2021;22:375–92. 10.1038/s41580-021-00342-0 [DOI] [PubMed] [Google Scholar]
- 11. Kirchner S, Ignatova Z. Emerging roles of tRNA in adaptive translation, signalling dynamics and disease. Nat Rev Genet 2015;16:98–112. 10.1038/nrg3861 [DOI] [PubMed] [Google Scholar]
- 12. Szathmáry E. The origin of the genetic code: amino acids as cofactors in an RNA world. Trends Genet 1999;15:223–9. 10.1016/S0168-9525(99)01730-8 [DOI] [PubMed] [Google Scholar]
- 13. Rodin AS, Szathmáry E, Rodin SN. On origin of genetic code and tRNA before translation. Biol Direct 2011;6:14–24. 10.1186/1745-6150-6-14 [DOI] [PMC free article] [PubMed] [Google Scholar]
- 14. Giegé R. Toward a more complete view of tRNA biology. Nat Struct Mol Biol 2008;15:1007–14. 10.1038/nsmb.1498 [DOI] [PubMed] [Google Scholar]
- 15. Orellana EA, Siegal E, Gregory RI. TRNA dysregulation and disease. Nat Rev Genet 2022;23:651–64. 10.1038/s41576-022-00501-9 [DOI] [PMC free article] [PubMed] [Google Scholar]
- 16. Zhu L, Ge J, Li T. et al. TRNA-derived fragments and tRNA halves: the new players in cancers. Cancer Lett 2019;452:31–7. 10.1016/j.canlet.2019.03.012 [DOI] [PubMed] [Google Scholar]
- 17. Richter U, McFarland R, Taylor RW. et al. The molecular pathology of pathogenic mitochondrial tRNA variants. FEBS Lett 2021;595:1003–24. 10.1002/1873-3468.14049 [DOI] [PMC free article] [PubMed] [Google Scholar]
- 18. Tian H, Zhenyu H, Wang C. The therapeutic potential of tRNA-derived small RNAs in neurodegenerative disorders. Aging Dis 2022;13:389–401. 10.14336/AD.2021.0903 [DOI] [PMC free article] [PubMed] [Google Scholar]
- 19. Torres AG, Batlle E, Ribas L. et al. Role of tRNA modifications in human diseases. Trends Mol Med 2014;20:306–14. 10.1016/j.molmed.2014.01.008 [DOI] [PubMed] [Google Scholar]
- 20. Pereira M, Francisco S, Varanda AS. et al. Impact of tRNA modifications and tRNA-modifying enzymes on proteostasis and human disease. Int J Mol Sci 2018;19:E3738. 10.3390/ijms19123738 [DOI] [PMC free article] [PubMed] [Google Scholar]
- 21. Chen X, Xie D, Zhao Q. et al. MicroRNAs and complex diseases: from experimental results to computational models. Brief Bioinform 2019;20:515–39. 10.1093/bib/bbx130 [DOI] [PubMed] [Google Scholar]
- 22. Watts JK, Corey DR. Silencing disease genes in the laboratory and the clinic. J Pathol 2012;226:365–79. 10.1002/path.2993 [DOI] [PMC free article] [PubMed] [Google Scholar]
- 23. Ning L, Cui T, Zheng B. et al. Mndr v3. 0: mammal ncRNA–disease repository with increased coverage and annotation. Nucleic Acids Res 2021;49:D160–4. 10.1093/nar/gkaa707 [DOI] [PMC free article] [PubMed] [Google Scholar]
- 24. Chen J, Lin J, Yongfei H. et al. RNAdisease v4. 0: an updated resource of RNA-associated diseases, providing RNA-disease analysis, enrichment and prediction. Nucleic Acids Res 2023;51:D1397–404. 10.1093/nar/gkac814 [DOI] [PMC free article] [PubMed] [Google Scholar]
- 25. Sheng N, Xie X, Wang Y. et al. A survey of deep learning for detecting mirna-disease associations: databases, computational methods, challenges, and future directions. IEEE/ACM Trans Comput Biol Bioinform 2024;21:328–47. 10.1109/TCBB.2024.3351752 [DOI] [PubMed] [Google Scholar]
- 26. Chen CLP, Zhang C-Y. Data-intensive applications, challenges, techniques and technologies: a survey on big data. Inform Sci 2014;275:314–47. 10.1016/j.ins.2014.01.015 [DOI] [Google Scholar]
- 27. Mathisen BM, Aamodt A, Bach K. et al. Learning similarity measures from data. Prog Artif Intell 2020;9:129–43. 10.1007/s13748-019-00201-2 [DOI] [Google Scholar]
- 28. Zhang S, Tong H, Jiejun X. et al. Graph convolutional networks: a comprehensive review. Comput Soc Netw 2019;6:1–23. [DOI] [PMC free article] [PubMed] [Google Scholar]
- 29. Xu C, Tao D, Xu C. A survey on multi-view learning. 2013. Preprint at https://arxiv.org/abs/1304.5634
- 30. You Y, Chen T, Sui Y. et al. Graph contrastive learning with augmentations. Adv Neural Inform Process Syst 2020;33:5812–23. [Google Scholar]
- 31. Feng Y, You H, Zhang Z. et al. Hypergraph neural networks. Proc AAAI Conf Artif Intell 2019;33:3558–65. 10.1609/aaai.v33i01.33013558 [DOI] [Google Scholar]
- 32. Yang H, Zhou M, Shi H. et al. Measuring disease similarity and predicting disease-related ncRNAs by a novel method. BMC Med Genomics 2017;10:67–74. 10.1186/s12920-017-0315-9 [DOI] [PMC free article] [PubMed] [Google Scholar]
- 33. Huang Z, Chen K, Xiao X. et al. Deepheterocda: CircRNA–drug sensitivity associations prediction via multi-scale heterogeneous network and graph attention mechanism. Brief Bioinform 2025;26:bbaf159. 10.1093/bib/bbaf159 [DOI] [PMC free article] [PubMed] [Google Scholar]
- 34. Zhang W, Yao G, Wang J. et al. Ncrpheno: a comprehensive database platform for identification and validation of disease related noncoding RNAs. RNA Biol 2020;17:943–55. 10.1080/15476286.2020.1737441 [DOI] [PMC free article] [PubMed] [Google Scholar]
- 35. Wang L, Li Z-W, Jing H. et al. A PiRNA-disease association model incorporating sequence multi-source information with graph convolutional networks. Appl Soft Comput 2024;157:111523. 10.1016/j.asoc.2024.111523 [DOI] [Google Scholar]
- 36. Hou J, Wei H, Liu B. Ipida-gcn: identification of PiRNA-disease associations based on graph convolutional network. PLoS Comput Biol 2022;18:e1010671. 10.1371/journal.pcbi.1010671 [DOI] [PMC free article] [PubMed] [Google Scholar]
- 37. Ju W, Yi S, Wang Y. et al. A survey of graph neural networks in real world: imbalance, noise, privacy and OOD challenges. arXiv preprint, arXiv:2403.04468. 2024. Preprint at 10.48550/arXiv.2403.04468 [DOI]
- 38. Hanrui W, Li N, Zhang J. et al. Collaborative contrastive learning for hypergraph node classification. Patt Recogn 2024;146:109995. 10.1016/j.patcog.2023.109995 [DOI] [Google Scholar]
- 39. Ding K, Wang Y, Yang Y. et al. Eliciting structural and semantic global knowledge in unsupervised graph contrastive learning. Proc AAAI Conf Artif Intell 2023;37:7378–86. 10.1609/aaai.v37i6.25898 [DOI] [Google Scholar]
- 40. Ai N, Liang Y, Yuan H. et al. Gdcl-ncda: identifying non-coding RNA-disease associations via contrastive learning between deep graph learning and deep matrix factorization. BMC Genomics 2023;24:424. 10.1186/s12864-023-09501-3 [DOI] [PMC free article] [PubMed] [Google Scholar]
- 41. Laiyi F, Yao ZY, Zhou Y. et al. Aclnda: an asymmetric graph contrastive learning framework for predicting noncoding RNA–disease associations in heterogeneous graphs. Brief Bioinform 2024;25:bbae533. [DOI] [PMC free article] [PubMed] [Google Scholar]
- 42. Xiaowen H, Dong Y, Zhang J. et al. Hgclmda: predicting mRNA–drug sensitivity associations via hypergraph contrastive learning. J Chem Inf Model 2023;63:5936–46. [DOI] [PubMed] [Google Scholar]
- 43. Fan Y, Zhang C, Xiaowen H. et al. Sgcldga: unveiling drug–gene associations through simple graph contrastive learning. Brief Bioinform 2024;25:bbae231. 10.1093/bib/bbae231 [DOI] [PMC free article] [PubMed] [Google Scholar]
- 44. Wang Y-T, Qing-Wen W, Gao Z. et al. MiRNA-disease association prediction via hypergraph learning based on high-dimensionality features. BMC Med Inform Decis Mak 2021;21:1–13. 10.1186/s12911-020-01320-w [DOI] [PMC free article] [PubMed] [Google Scholar]
- 45. Pengli L, Jinkai W, Zhang W. Hcgccda: prediction of circRNA-disease associations based on the combination of hypergraph convolution and graph convolution. J Comput Sci 2023;74:102176. [Google Scholar]
- 46. Veličković P, Cucurull G, Casanova A. et al. Graph attention networks. arXiv preprint, arXiv:1710.10903. 2017. Preprint at 10.48550/arXiv.1710.10903 [DOI]
- 47. Zhang Y, Qian Y, Xiao X. et al. PTDA-SWGCL: predicting tRNA–disease associations using supplementarily weighted graph contrastive learning. In: Jiang X, Wang H, Alhajj R, Hu X, Engel F, Mahmud M, Pisanti N, Cui X, Song H (eds.), Proceedings of the 2023 IEEE International Conference on Bioinformatics and Biomedicine (BIBM). Piscataway, NJ: IEEE; 2023: 209–14. 10.1109/BIBM58861.2023.10386000 [DOI]
- 48. Li Z, Li J, Nie R. et al. A graph auto-encoder model for miRNA-disease associations prediction. Brief Bioinform 2020;22:bbaa240. 10.1093/bib/bbaa240 [DOI] [PubMed] [Google Scholar]
- 49. Ning Q, Zhao Y, Gao J. et al. Amhmda: attention aware multi-view similarity networks and hypergraph learning for miRNA–disease associations identification. Brief Bioinform 2023;24:bbad094. [DOI] [PubMed] [Google Scholar]
- 50. Wang S, Wang F, Sibo Qiao Y. et al. Mshganmda: meta-subgraphs heterogeneous graph attention network for miRNA-disease association prediction. IEEE J Biomed Health Inform 2022;27:4639–48. [DOI] [PubMed] [Google Scholar]
- 51. Zhao H, Li Z, You Z-H. et al. Predicting miRNA-disease associations based on neighbor selection graph attention networks. IEEE/ACM Trans Comput Biol Bioinform 2022;20:1298–307. 10.1109/TCBB.2022.3204726 [DOI] [PubMed] [Google Scholar]
- 52. Van der Maaten L, Hinton G. Visualizing data using t-SNE. J Mach Learn Res 2008;9:2579–2605. [Google Scholar]
- 53. Xiong X, Le-Wei Zheng Y, Ding Y-FC. et al. Breast cancer: pathogenesis and treatments. Signal Transduct Target Ther 2025;10:49. 10.1038/s41392-024-02108-4 [DOI] [PMC free article] [PubMed] [Google Scholar]
- 54. Ionescu VA, Gheorghe G, Bacalbasa N. et al. Colorectal cancer: from risk factors to oncogenesis. Medicina 2023;59:1646. [DOI] [PMC free article] [PubMed] [Google Scholar]
- 55. Yuan Y, Jiao B, Lili Q. et al. The development of Covid-19 treatment. Front Immunol 2023;14:1125246. 10.3389/fimmu.2023.1125246 [DOI] [PMC free article] [PubMed] [Google Scholar]
- 56. Imirowicz I, Saifee A, Henry L. et al. Unique tRNA fragment upregulation with SARS-Cov-2 but not with SARS-Cov infection. Int J Mol Sci 2023;25:399. 10.3390/ijms25010399 [DOI] [PMC free article] [PubMed] [Google Scholar]