

Abstract
Background
Fetuin-A is a glycoprotein with high affinity for calcium-phosphates, with a role in cartilage and bone metabolism, and an anti-inflammatory role in injury. Studies have shown decreasing serum fetuin-A levels in patients with severe osteoarthritis (OA), and lower amounts of fetuin-A in OA sclerotic osteoblasts. Therefore, decreasing fetuin-A during OA might be responsible for increased inflammation, cartilage mineralization and subchondral bone thickness. To assess the therapeutic potential of fetuin-A in post-traumatic OA (PTOA), we used micrometric hyaluronic-acid particles (µHA) to achieve a sustained intra-articular release of fetuin-A into diseased joint knees and followed PTOA progression over time. Because OA progression may lead to muscle degeneration, we also assessed muscle strength.
Methods
Shape-defined hyaluronic-acid microparticles were fabricated and associated with fetuin-A, generating a fetuin-A µHA complex (Fet-µHA). After physicochemical characterization and biocompatibility studies on chondrocytes, the release profile of fetuin-A from Fet-µHA was established. The therapeutic efficacy of Fet-µHA on PTOA was assessed using the destabilization of the medial meniscus (DMM) model. We intra-articularly injected Fet-µHA (20 mg/kg, every 3wks), empty-µHA, or saline into DMM knees of C57BL/6 J mice, following OA outcomes at early and severe PTOA (4 weeks and 12 weeks post-DMM). Outcomes included cartilage structure (ACS score, H&E), matrix loss (Safranin-O score), articular cartilage (AC) thinning, osteophyte development, bone histomorphometry, synovial hyperplasia and maximal tetanic force. All group analyses were performed with ordinary two-way ANOVA (cell viability) or one-way ANOVA (in vivo studies), followed by Tukey’s post-hoc test for multiple comparisons (statistical significance at P < 0.05).
Results
The in vitro studies confirmed the biocompatibility of Fet-µHA and established a release profile up to 45 days. In vivo intra-articular administration of the Fet-µHA into DMM knees was beneficial for OA cartilage,bone damage and synovial hyperplasia. Furthermore, Fet-µHA treatment led to a significative improvement of tetanic max contraction force at the severe stage.
Conclusions
This pre-clinical study not only opens new perspectives for the potential use of fetuin-A in OA treatment but confirms µHA as a promising drug carrier in OA.
Supplementary Information
The online version contains supplementary material available at 10.1186/s13075-025-03636-2.
Keywords: Fetuin-A, Osteoarthritis, Drug delivery, Polymeric microparticles, Murine osteoarthritis model, Muscle degeneration
Background
Osteoarthritis (OA) is a leading cause of disability in the industrialized world and nearly half of patients sustaining significant joint damage will develop post traumatic OA (PTOA) [1] within 10 years [2, 3]. OA is a disease of the entire joint, involving synovial inflammation, cartilage/bone damage and damage to other soft tissues leading to pain and disability.
When administering systemic drug treatments in OA, it is critical to consider the potential differential response by multiple tissue components over time. A drug that might be useful for cartilage repair may affect distant target cells differently and lose efficacy. In this scenario, it is highly desirable to develop strategies that would exert their efficacy on multiple targets [4]. Fetuin-A/α2-Heremans-Schmid-glycoprotein (Ahsg) is a liver secreted glycoprotein with high affinity for calcium-phosphate crystals; it is a BMP-antagonist and a mineralization inhibitor, it has been shown to inhibit chondrocyte hypertrophy, regulate bone formation and mitigate inflammation in injury [5–10]. Therefore, in the efforts to identify PTOA treatments targeting simultaneously cartilage, bone and inflammation, fetuin-A represents a promising therapeutic.
Although the role of fetuin-A in arthritis is still not clear, its clinical relevance has been reported by several investigators: decreased fetuin-A serum levels were found in patients with OA and correlated with disease severity [11]. Likewise, compared to healthy controls, decreased fetuin-A serum levels were detected in patients with knee OA and correlated to greater Kellgren-Lawrence grades as well as pain scores [12]. As reviewed by Pappa et al., the therapeutic potential of fetuin-A could be based on both the ability to lower inflammation and limit tissue destruction in degenerative bone and joint diseases [13]. In line with this premise, initial animal studies in a surgical PTOA model showed that single fetuin-A delivery into OA knees significantly reduced inflammation; however, although decreased articular cartilage damage was observed in fetuin-A treated knees, differences did not reach statistical significance [14]. The authors acknowledged that the study was mainly focused on fetuin-A anti-inflammatory action, that deeper studies on tissue damage would be needed and argued that a single injection was probably not sufficient to inhibit progression of joint degeneration over time [14]. Recently, Van den Akker et al. obtained significant improvement in the cartilage histopathological OA score by intra-articularly injecting the N-terminal peptide (30 AA long) of the mature fetuin-A in PTOA rats; injections were carried every three days and analyses were conducted up to 28 days post-surgery [15]. In the effort to achieve optimal therapeutic strategies for long-term OA, we should improve the delivery of the chosen pharmaceutical compound to the target tissue, diminishing the frequency of the injections while protecting it from degradation and guaranteeing a sustained release along the entire course of the disease, up to severe stage [4].
In this study, we have used polymeric, biodegradable micrometric particles with defined shapes to test whether a sustained release of fetuin-A into PTOA mouse knee joints could ameliorate cartilage, bone and synovial damage, up to the stage of severe disease. Specifically, hydrogel-like hyaluronic-acid microparticles (µHA) were associated with fetuin-A to form a fetuin-A-μHA complex (Fet-µHA). This system permits a sustained, slow release of the glycoprotein into the intra-articular space over time, while protecting its biological activity. In the present work, we conducted in vitro studies where we performed a chemical-physical characterization and biocompatibility of the Fet-µHA and established the release-time of the fetuin-A from the complex. Most importantly, we then used a mouse model of post-traumatic OA (DMM, destabilization of medial meniscus) to determine in vivo the therapeutic efficacy of Fet-µHA intra-articular delivery (every 3 weeks post-trauma) on long-term cartilage and bone damage, as well as on synovial hyperplasia (up to 12 weeks).
The joint is not the only target in OA pathogenesis. Muscles are situated in proximity to articular joints and provide joint movement and stability. Muscle weakness is one of the earliest OA findings and quadriceps (Quad) strength is reduced by 50% in patients with knee OA [16]; therefore, we also determined whether Fet-µHA joint treatment was able to reduce the DMM-induced muscle weakness.
Materials and methods
Materials
Polydimethylsiloxane (PDMS) (Sylgard 184) and elastomer were obtained from Dow Corning (Midland, Michigan, USA). Poly(vinyl alcohol) (PVA, Mw 31,000 − 50,000), poly(D,L‐lactide‐co‐glycolide), Fetuin-A (from fetal bovine serum), glycidyl methacrylate, lithium phenyl(2,4,6-trimethylbenzoyl)phosphinate (LAP), and (3-(4,5-Dimethylthiazol-2-yl)-2,5-diphenyltetrazolium bromide) (MTT) were purchased from Sigma‐Aldrich (Saint Louis, Missouri, USA). Hyaluronic acid (10 kDa) was obtained from Creative Pegworks (Durham, North Carolina, USA). Bradford protein assay was obtained from Bio-Rad (Milan, Italy). High-glucose Dulbecco’s modified Eagle’s minimal essential medium (DMEM)/F-12 GlutaMAX, DMEM penicillin, streptomycin, and heat-inactivated fetal bovine serum (FBS) were purchased from Gibco (Invitrogen Corporation, Giuliano Milanese, Milan, Italy). Human chondrocytes (HC) and chondrocyte medium were purchased from Innoprot (Bizkaia, Spain). Tissues were fixed in 4% paraformaldehyde (in PBS) (Electron Microscopy Sciences, Hatfield, PA, USA). Tissues were stained with Safranin-O 1.5% (Sigma; St. Louis MO, USA), Fast Green 0.04% (Sigma; St. Louis, MO, USA), Hematoxylin-modified Harris (Ricca; Arlington, TX, USA), and Eosin Y 0.25% (Ricca; Arlington, TX, USA). All other solvents and reagents were used as purchased.
Methods
Fabrication and characterization of Fet-μHA
Fet-μHA hydrogel-like microparticles were obtained via a charge-based post manufacturing loading method. First, empty μHA were fabricated through the photo-polymerization of hyaluronic-acid methacrylate chains (HA-MA) (10 kDa, 25% degree of methacrylation) within a sacrificial template made of PVA presenting an array of square based wells with an edge length of 20 μm and a depth of 5 μm. Briefly, HA-MA chains were dissolved in a water-glycerol (60:40) solution containing 0.1% w/v of the photo-initiator LAP, carefully spread over the wells of the PVA template, and crosslinked in four steps with UV light as described by the authors. Subsequently, the PVA template was dissolved in water to allow the μHA release. The resulting solution was purified using polycarbonate membrane filters (40 μm) and μHA were collected through sequential centrifugations (2,500 g for 5 min).
About 500,000 μHA were then incubated in 1 mL of aqueous fetuin-A solution (2 mg) (acetate buffer 25 mM, pH 4) and mixed for 2 h at room temperature. Following the incubation time, the microparticles were centrifuged (2,500 g, 4 °C, 5 min): the supernatant was analyzed via the bicinchoninic acid (BCA) assay to indirectly evaluate the Fetuin amount entrapped into μHA (loading – LE%) using the formula:
| 1 |
where Fetuini is the initial protein amount used for the Fet-μHA fabrication and Fetuins is the protein amount detected in the supernatant. Therefore, the loading is defined as the ratio between the amount of fetuin-A associated with the μHA and the total amount of fetuin-A initially incubated with the μHA. Particles in the pellet were resuspended in water and characterized.
Number and size distribution of both μHA and Fet-μHA were investigated by using the Multisizer 4 COULTER particle counter; all the analyses were performed in triplicate.
Additionally, their morphology was evaluated via scanning electron microscopy (SEM, Elios Nanolab 650, FEI). Samples were prepared by dropping 10 µL of Fet-μHA on a silicon template and sputtered with 10 nm of gold and analyzed operating at an acceleration voltage of 5 − 10 keV.
Fetuin release from Fet-μHA was investigated under confined conditions: particles (tallying at 564 μg of Fetuin) were resuspended in 500 μL of PBS 1X, pH = 7.4 at 37 °C and incubated under gentle rotation for 1, 2, 3, 5, 6, 13, 15, 16, 30, or 45 days. At the end of each time point, samples were centrifuged (2,500 g, 4 °C, 5 min): supernatants were analyzed via BCA assay in order to quantify the fetuin amount released while, Fet-μHA into the pellets were stained with the Bradford reagent (acidified Coomassie Brilliant Blue G-250) (1 μL of dye solution was added to 10 μL of the Fet-μHA) and then analyzed via optical microscopy (automated Leica DM5500 B research microscope). Results were expressed as mean fetuin release percentage ± SD (experiments were carried out in triplicate).
Cell culture conditions
Primary human chondrocytes (HC) from healthy articular cartilage were obtained from Innoprot (Bizkaia – Spain) and were cultured by carefully following all the indications and reccomendations provided by the vendor. To guarantee a good cell adhesion, a T‐75 (2 μg/cm2) flask was coated with poly‐L‐lysine as indicated by the company. Cells (5 × 10⁵) were resuspended in complete chondrocytes media made of 500 mL of chondrocyte basal medium, 25 mL of FBS, 5 mL of chondrocyte growth supplement, and 5 mL of penicillin/streptomycin solution (Innoprot, Bizkaia—Spain). Cells were cultured under controlled environmental conditions (37 °C in 5% CO2) and used when the culture was approximately 70% confluent.
Fluorescence microscopy
Cells (5 × 10³) were seeded into a µ-Slide 8 Well (IBIDI—Gräfelfing, Germany). The same culturing conditions described above were followed. Cells were treated 48 h after seeding with Fet-μHA (1:1) for 24 h. After treatment, the wells were washed with PBS twice and the sample was fixed with 4% paraformaldehyde (PFA) for 10 min. The wells were washed 3 times before proceeding with the staining by using Alexa Fluor™ 560-phalloidin, Alexa Fluor™ 488-WGA and DAPI (Thermo Fisher Scientific—Waltham, USA) according to vendor’s protocol. Images were acquired with a Leica DM5500 B research microscope (Leica Microsystems—Wetzlar, Germany).
Evaluation of Fet-µHA biocompatibility
Fet-µHA biocompatibility was evaluated via MTT (3-(4,5-dimethylthiazol-2-yl)-2,5-diphenyltetrazolium bromide) assay. Briefly, HC (5 × 10³) were seeded into each well of a 96-well plate (coated with poly‐L‐lysine). The day after, cells were treated using different ratios of Fet-µHA / HC (1:10, 1:5, 1:4, 1:2, 1:1) and incubated for 24, 48 and 72 h (37 °C, 5% CO2). At the end of the predetermined time point, cells were washed with sterile PBS and incubated with MTT (0.25 mg/mL) for 4 h. The resulting Formazan crystals were solubilized in ethanol and the absorbance was measured at 570 nm using a Tecan Spark plate reader (Tecan Group LTD, Männedorf—Switzerland).
In vivo studies – animal model
Experiments were conducted in C57BL/6 male mice housed in the same room (5 mice/cage). At the time of the surgery, mice were between 14- and 16-weeks-old and weighted between 24 and 28 g. Animal use protocols were approved by the Institutional Animal Care and Use Committee of the University of North Carolina at Chapel Hill NC (IACUC # 23–039.0).
To induce PTOA, we used the DMM model, as previously described [17–19]. Briefly, a vertical incision was made in the frontal part of the knee to open the joint capsule. The meniscotibial ligament was transected, leading to meniscus laxity. The surgeon documented the ACL integrity and checked for patellar luxation. No problems were found in any of the animals subjected to DMM surgery and no animals were excluded from the study. In the sham (Control) group, the ligament was visualized but left untouched. The DMM-induced OA produces injuries consistent with the human disorder, allowing loading during the slow progression of cartilage and bone changes. DMM lesions progress in stages from early (4 weeks post-DMM) to mild-moderate (8 weeks) and then to severe OA (12–16 weeks) [19]. All surgeries were performed by the same surgeon, with a maximum of 10 surgeries/day. For each experimental group, DMM and relative sham controls were made the same day. To limit variability, each litter was equally divided between DMM and sham, as well as among the different experimental groups (saline, emtpy-μHA or Fet-μHA), by an investigator different from the surgeon prior to surgery; the surgeon was notified only after the joint capsule was opened. For anesthesia, isoflurane (1.5 to 3% by inhalation) was used, and postoperative analgesia (Buprenex, 0.05–0.1 mg/kg) was administered following UNC IACUC guidelines. Mice were monitored daily for the first week and then every other day. No sign of distress or limited ambulation following to DMM/Sham surgery or IA injection were detected in any of the animals included in the analysis.
In vivo studies – treatment
Free fetuin-A, Fet-μHA, empty-μHA or saline (10 µL) were administered intra-articularly 3 days after surgery. After the skin around the knee joint is wiped with a 70% ethanol swab, the mouse is positioned with the belly up and the leg is held at the ankle with the knee in a slightly bent position. To locate the point of injection, the side of a 30 gage needle is bounced along the patellar tendon until it hits the femur and then falls into a space and then hits the tibia. The space with a soft spot or 'groove' between the femur and tibia is the proper location for the injection through the patellar tendon into the joint space. The joint is injected using a 30 g removable needle attached to a 10ul Hamilton syringe. The needle is inserted from the front through the patellar tendon (with the needle perpendicular to the front of the knee) about 2–2.5 mm depth. When the needle has entered the articular space a slight ‘give’ or pop is felt rather than hitting bone which would indicate repositioning of the needle is needed. For studies on early OA (4wk post-DMM) injections were repeated at 3 weeks; for severe-OA (12 weeks post-DMM), injections were repeated at 3, 6 and 9 weeks post-DMM). Doses of free fetuin-A or Fet-μHA were determined based on published literature [14, 20, 21]. Because local delivery allows more efficient transport of the drug into the joint region, we used 20 mg/kg every 3 weeks (a fivefold reduction compared to IP injections). Knees from DMM/sham mice were dissected at 4 weeks or 12 weeks post-surgery to achieve early-stage or severe-stage OA, respectively.
In vivo studies – measures of muscle strength
In vivo analyses of muscle strength were performed with the 3-in-1 whole Animal System (Aurora Scientific, Aurora, Ontario, Canada) at the severe PTOA stage (12w). In vivo force measurements were made by plantarflexion of the mouse hindfoot attached to a footplate and force transducer. Animals were anesthetized using an isoflurane chamber and subsequent isoflurane vaporizer mask (1 to 3% isoflurane). After removing the animal’s fur with fine clippers, the knee was clamped into position and the foot attached to the footplate. The tibial nerve was located, and stimulating electrodes were placed. Following nerve stimulation, we measured the maximum tetanic force of gastrocnemius and soleus complex. Resting tension, muscle length and stimulation current are adjusted for each muscle to obtain optimal twitch force (pulse width at 0.2 ms). At the end of the protocol, electrodes are removed, the mouse was removed from the force transducer and followed by terminal dissection of knee joint for histologic processing.
Histopathologic assessment of arthritis (cartilage and bone damage)
After fixation in 4% PFA (overnight at RT), knees were rinsed in PBS and decalcified with Immunocal (StatLab, McKinney, TX) for 5–7 days. Following embedding in paraffin, 6 µm frontal sections were cut through the entire joint. Two sections per sample (midcoronal and posterior joint) were stained with hematoxylin and eosin (H&E) or Safranin O/Fast Green. To standardize the medial and posterior location of the sections, we defined the medial tibial cartilage width ~ 800–900 µm as our anatomical criteria for section alignment. Considering that sections are 6 µm apart, posterior sections were chosen between 72 and 90 µm after the middle sections. An Olympus BX51 microscope and a DP71 camera were used for images. For OA grading, we used 2 different semiquantitative scoring systems, described by McNulty et al. 2007, the Articular Cartilage Structure (ACS) score and the Safranin-O staining score (Saf-O) [22]. Compared to the OARSI score system, designed to rapidly identify the site within the joint that contains the most severe lesions, the combination of ACS and Saf-O scores provide in-depth information regarding changes within the lesions, for both articular cartilage structure and extracellular matrix integrity. The ACS focuses on AC structure, identifying fibrillations and cleft in the structure, while the Saf-O is more tailored at identifying changes within the cell compartment and/or in the extracellular matrix For both scoring systems, two adjacent midcoronal and posterior sections were stained with H & E (for ACS) or Safranin-O and lesions were identified within the 4 compartments (medial and lateral tibial plateau and femoral condyles). In both ACS and Saf-O scores, lesions were scored on a 0–12 scale as described by McNulty et al., where zero is defined as normal, reflecting a smooth articular surface (ACS) or uniform staining throughout the articular cartilage (Saf-O), while 12 reflects fibrillation/cleft/loss of cartilage (ACS) or complete loss of staining in both cells and matrix (Saf-O) involving the full thickness of articular cartilage with an extension higher than two third of the plateau/condyle [22]. Results were expressed as averages of scores in all quadrants in all sections.
As previously described, sections stained with H&E or Safranin O/Fast Green, were also used to perform histomorphometric analyses to quantify the articular cartilage area, the subchondral bone area and the percentage of bone volume/total volume (BV/TV) in the medial tibia, using ImageJ software [22–25]. Specifically, to quantify the uncalcified articular cartilage, the specific area of each slide stained with H&E from all groups was encircled and measured. For bone assessment, Saf-O slides from all groups were used. Specifically, for subchondral bone measures, we circled the area corresponding to the bone tissue between the calcified cartilage and the trabecular bone that surrounds the bone marrow regions. For BV/TV measurements, we included both the subchondral and trabecular bone, excluding the bone marrow regions (BV) and express it as percentage vs the total area, including the bone marrow regions (TV). Data were reported in square micrometers (sq µm) as the average of 4 sections for each mouse.
Semiquantitative measures of osteophyte formation were performed on Safranin-O/Fast-Green sections using the semiquantitative score system initially described by Little et al. [26], and as we previously reported [23, 25, 27, 28]. The method is developed for both osteophyte size (scale 0–3, by comparison with the thickness of the adjacent AC) and maturity, which reflects the osteophyte tissue composition (scale 0–3, with 3 defining bone predominance) [26]. Because osteophytes usually form close to areas of cartilage degradation, in the DMM they are predominately localized on the medial tibial plateau, therefore only sections from this region were used for osteophyte grading. Briefly, an osteophyte size score is obtained on assigning a score based on the size of osteophytes compared to adjacent cartilage (0 = none, 1 = small ~ the same thickness as the adjacent cartilage, 2 = medium ~ 1 – 3 × the thickness as the adjacent cartilage, 3 = large > 3 × the thickness as the adjacent cartilage). The osteophyte maturity score reflects the tissue composition of osteophytes and is assessed by assigning a score as following: 0 = none, 1 = predominantly cartilaginous, 2 = mixed cartilage and bone with active vascular invasion and endochondral ossification, 3 = predominantly bone [26]. Both osteophyte size and maturity scores were obtained from coded digital images of the same location of the anterior-medial tibia in each animal.
Assessment of synovial hyperplasia
One H&E-stained section/mouse from the posterior joint compartment was scored for synovial hyperplasia based on the scoring system described by Rowe et al. (scale of 0–3) [29]. The posterior region was used to avoid the area with the incision from the DMM. The scores define the number of cell layers visualized in the synovium, with higher grades when multiple layers are present (2–3 layers = score 1; 4–5 layers = score 2; 5 or more layers = score 3). Measures are expressed as an average of medial and lateral joint compartments.
All histological evaluations of cartilage, bone and synovium were acquired in a blinded manner by two independent investigators, and the results are expressed as averages. Supplemental Figure S1 and Supplemental Table S1 show no differences in cartilage, bone and synovium parameters among naïve and sham groups with or without IA saline injection, at both the early and severe OA stages. These results indicate that the wound caused by the surgical incision, the opening of the capsule and/or the IA injection, did not influence joint tissue structure or synovitis at the time analyzed in the study.
Quantitative RT-PCR
mRNA was isolated from quadricep tissue using Purelink RNA mini kit from Thermo-Fisher (Waltham, MA; #12182018A). cDNA was synthesized using Superscript IV Vilo Master Mix Kit with ezDNAse from Thermo-Fisher (#11,766,050). Quantitative RT-PCR was performed using TaqMan® Gene Expression Assays from Thermo-Fisher. Target primer/probe was Atp2a1 (Mm01275320 mATP2a1) and the housekeeping gene was B2m (Mm00437762 m1B2m). Assays were combined with TaqMan Fast Advance Master Mix (Thermo-Fisher, #4,444,557) and run for Real-Time PCR on the QuantStudio™ 6 Flex Real-Time PCR System (Thermo-Fisher, #4,485,689). Data was analyzed using QuantStudio Real Time Software v1.3.
Statistics and sample size
For cell viability, three replicates were used for each experimental condition. For in vivo experiments with free fetuin-A (Supplemental Figure S2), 6 mice were used for each experimental group, while for the experiments with Fet-μHA, at least 8 mice were included in each experimental group. Based on previous experiments, a sample size of 6 achieves 95% power to detect a difference of at least 30% ± 10% using the pairwise multiple comparison test at 0.05 significance [27]. No animals were excluded from the analysis; however, after processing, some joint regions on the histological section were occasionally missing and were not included in the specific OA score. All outcomes were approximately normally distributed, and all group analyses were performed with ordinary two-way ANOVA (cell viability) or one-way ANOVA (in vivo studies), followed by Tukey’s post-hoc test for multiple comparisons. Tables 2, 3 and 4 report mean value, adjusted P value, mean difference and standard error of the difference between means for all the outcomes. For experiments with free fetuin-A, Student’s unpaired t tests were used; Supplemental Table S2 reports mean value, P value, difference between means ± Standard Error of the mean. Statistical analyses were performed using GraphPad Prism Software (9.1.0). Statistical significance was set at P < 0.05.
Table 2.
Effect of Fet-µHA administration in DMM knees on PTOA outcomes compared to empty-µHA and saline injections, at the time point reported

The data presented show sample size for each experimental group, mean value, adjusted P value, mean difference and standard error of the difference between means for all the outcomes. Group analyses were performed with ordinary one-way ANOVA, followed by Tukey’s post-hoc test for multiple comparisons. Significant P-values (≤ 0.05) are indicated in bold
Table 3.
Atp2a1 gene expression in quadriceps and tibialis anterior of DMM/Sham knees, operated and contralateral limbs, at the time-points indicated. Results represent the percentage of the lowest sham value of the 4wk group

The data presented show sample size for each experimental group, mean value, adjusted P value, mean difference and standard error of the difference between means. Group analyses were performed with ordinary one-way ANOVA, followed by Tukey’s post-hoc test for multiple comparisons. Significant P-values (≤ 0.05) are indicated in bold
Table 4.
Effect of Fet-µHA administration in DMM/Sham knees on Maximal tetanic force compared to empty-µHA and saline injections, at the severe OA stage (12 wk)

The data presented show sample size for each experimental group, mean value, adjusted P value, mean difference and standard error of the difference between means. Group analyses were performed with ordinary one-way ANOVA, followed by Tukey’s post-hoc test for multiple comparisons. Significant P-values (≤ 0.05) are indicated in bold
Results
Fet-μHA and physicochemical and biopharmaceutical properties
We fabricated Fet-μHA as schematically shown in Fig. 1A. Morphological analyses conducted of the microparticles using a Multisizer Coulter Counter system revealed a noticeable shift in the peak from approximatively 10 μm for the empty-μHA to 15 μm for the Fet-μHA (Fig. 1B). This observation was visually confirmed through SEM analysis (Fig. 1C), which displayed a shift in particle morphology towards a distinctive ‘ravioli’-like structure, with fetuin-A completely coating the microparticles and forming a visible rim around them.
Fig. 1.

Physicochemical and biopharmaceutical characterizations of fetuin-A associated hyaluronic-acid microparticles (Fet-μHA). A Schematic representation of Fet-μHA preparation. B-C Multisizer analysis and SEM images of empty-μHA and Fet-μHA. D Visualization of the progressive Fetuin-A release from Fet-μHA under confined conditions (500 μL of PBS 1X, pH = 7.4 at 37 °C) via BCA assay and morphological analysis at the Optical microscopy (automated Leica DM5500 B research microscope) (Fetuin-A: 564 µg; n = 3 samples for each time point). E Fluorescence microscopy image of a chondrocyte and a Fet-μHA (red signal: F-actin; blue signal: DAPI; green signal: Hyaluronic Acid. F. MTT assay of chondrocytes treated with Fet-μHA for 24 h, 48 h, and 72 h (different cell vs Fet-μHA ratio were used). All scale bar = 10 µm
The release profile of fetuin-A from Fet-μHA was determined under confined conditions. Specifically, the release profile of fetuin-A was investigated in 500 μL of PBS (37 °C, pH 7.4) for 30 days. As indicated in Table 1, the protein was released constantly into the medium reaching almost 100% release after 45 days, matching a zero-order kinetic model (R2 > 0.98). To visualize the release dynamics, Fet-μHA were stained with the Bradford reagent (acidified Coomassie Brilliant Blue G-250) at different time points. The presence of fetuin-A is associated with a bluish coloration of the μHA (Fig. 1D). This staining showed that the fetuin in the Fet-μHA rim was the first to be released, followed by the fetuin incorporated in the hydrogel-like structure of μHA.
Table 1.
In vitro fetuin-A release profile from the Fet-μHA up to 45 days

Fetuin release profile from Fetuin-μHA was investigated under confined conditions (500 μL of PBS 1X, pH = 7.4 at 37 °C). At the end of each time point, samples were centrifuged, and supernatants were analyzed via BCA assay to quantify the fetuin amount released. Results are expressed as mean fetuin release percentage ± SD (N=3)
Fet-μHA biocompatibility was established in human chondrocytes (HC); Fig. 1E gives a fluorescent microscopy image of a human chondrocyte interacting with a Fet-μHA (red signal: F-actin; blue signal: DAPI; green signal: Hyaluronic Acid in the μHA), demonstrating how microparticles and chondrocytes are comparable in size. Cell viability was assessed after incubating HC and Fet-μHA at predetermined times and at different cell/Fet-μHA ratios, ranging from 1:10 to 1:1 (Fig. 1F): no significant statistical differences was detected comparing cells exposed to μHA and not treated cells (CTRL), for all tested conditions.
Fet-μHA decreases cartilage and bone damage in PTOA joints
Our initial studies in the DMM model, showed that intra-articular administration of free fetuin-A was not able to diminish cartilage damage compared to saline injection (ACS Score, 2.83 and 3.46 respectively at 4wks; 9.04 and 9.42 respectively at 12 wks; Supplemental Figure S2 and Supplemental Table S2). To determine whether a sustained, slow release of fetuin-A in the injured knees would improve PTOA outcomes, we administered Fet-μHA, empty-μHA or saline into DMM knees. In addition to allowing a slow release of fetuin-A into the joint, the hyaluronic acid matrix of the μHA may also protect the fetuin-A biological activity. Our in vitro release studies showed approximately a 75% release of fetuin-A from Fet-μHA after 30 days (Fig. 1D and Table 1). Building on this encouraging result, we proceeded with an intra-articular administration of Fet-μHA starting perioperatively (3 days after surgery) and every 3 weeks until euthanasia, as summarized in Supplemental Figure S3. We followed different OA outcomes on both early and severe disease stages, respectively at 4 and 12 weeks post-DMM. Figure 2A-B show that Fet-μHA treatment significantly decreased ACS scores at both the early and severe OA stages compared with empty-μHA or saline (Table 2). Similarly, Fet-μHA injections decreased Saf-O scores at both OA stages compared with empty-μHA or saline (Fig. 2C-D and Table 2). Supplemental Figure S4 shows all four quadrants of the DMM knees represented in Fig. 2. We also evaluated cartilage loss by histo-morphometric quantification. We found that Fet-μHA administration in DMM knees was able to reduce cartilage thinning at the most severe stage, compared to Saline but not effective at the earlier stage (Fig. 2E and Table 2). In general, although empty-μHA tends to perform better than saline alone by reducing ACS and Saf-O scores, the differences are not statistically significant. However, the injection of the empty-μHA showed an improvement in articular cartilage area when compared to saline, at the most severe stage (Fig. 2E, 12 weeks).
Fig. 2.

Histopathological evaluation of DMM-induced cartilage damage following intra-articular administration of saline, empty-μHA or Fet-μHA. A Representative images of DMM knees (H&E staining) injected intra-articularly with saline, empty-μHA or Fet-μHA, at the indicated times following surgery. B ACS semiquantitative score (0–12 scale) of DMM knees at the time-points indicated reflecting the structure of the articular surface (red arrows indicate a cleft/fibrillation in the lamina). The results are expressed as the average of medial tibial plateau and medial femoral condyles. C Representative images of DMM knees (Safranin O/Fast green staining) injected intra-articularly with saline, empty-μHA or Fet-μHA, at the indicated times following surgery. D Safranin-O semiquantitative score (0–12 scale) of DMM knees at the time point indicated, reflecting loss of matrix (red arrows); the grading accounts for both the depth and extension of the damage. The results are expressed as the average of the medial tibial plateau and the medial femoral condyles. E Quantification of the Articular cartilage (AC) area (sq µm) of the medial plateau of DMM knees by histomorphometric analyses at the time-points indicated. The graphs represent the mean ± standard deviation. *p ≤ 0.05, **p p ≤ 0.01, ***p ≤ 0.001, ****p ≤ 0.0001. ns = not significant. # indicates one-way ANOVA at each time point; multiple comparison values by Tukey’s post-hoc test are indicated in each graph. Scale bars of the images are 50 µm
As we and others previously reported, in addition to cartilage modification, the OA damage following DMM surgery extends to bone damage; specifically, starting from early stage, DMM knees develop osteophytes, thickening of the subchondral bone and in general display a greater percentage of bone above the growth plate [19, 23, 25, 27, 28]. Therefore, we also evaluated these bone-related changes in DMM-induced OA, with or without fetuin-A treatment. We found that Fet-μHA delivery reduced osteophyte size (Fig. 3A-B) and slowed their ossification (Fig. 3C), compared to Empty-μHA or saline, at the early 2 week time point (Table 2). As OA progressed to a more severe stage, differences in osteophyte size were not evident among the considered treatment conditions; however, a delay in the osteophyte ossification was detected in Fet-μHA compared to both Empty-μHA and saline, although the latter did not reach statistical significance (Fig. 3B-C and Table 2). The semiquantitative score for the osteophyte size was validated by histomorphometry, measuring the osteophyte area at both the early and severe stages (Fig. 3D). Fet-μHA administration was also able to decrease the DMM-induced subchondral thickness at both the early and severe OA stage, compared to saline injected knees (Fig. 4A and Table 2); however, when measuring the percentage of total bone volume above the growth plate, including the trabeculae, a significant decrease was detected only at the early stage, while no differences among different treatments were observed at the severe stage (Fig. 4B and Table 2). Of note, similarly to articular cartilage quantification measures, empty-μHA administration led to a slight decrease of the subchondral bone area when compared to saline injections, although only at the most severe stage (Fig. 4A and Table 2).
Fig. 3.

Osteophyte assessment of DMM mouse knees following intra-articular administration of saline, empty-μHA or Fet-μHA. A Representative images of osteophyte formations (Safranin O/Fast green staining) in the medial tibial compartment of DMM mice injected intra-articularly with saline, empty-μHA or Fet-μHA, at the indicated times following surgery; osteophytes are circled in the images (yellow/orange line), representing new cartilage/bone formations emerging at the level of the lateral tibia. B The osteophyte size score at the time points indicated represents a semiquantitative grading of the size of the newly formed osteophytes (scale 0–3). For each sample, the graph reports the highest score of 4 quadrants (medial and lateral tibial plateau, medial and lateral femoral condyles). C The osteophyte maturity score (scale 0–3) at the time-point indicated represents a semiquantitative grading of the amount of bone tissue in the osteophyte with the highest score. D Quantification of the osteophyte area (sq/µm) of DMM knees by histomorphometric analysis at the time point indicated. The graphs represent the mean ± standard deviation. *p ≤ 0.05, **p p ≤ 0.01, ***p ≤ 0.001, ****p ≤ 0.0001. ns = not significant. # indicates one-way ANOVA at each time point; multiple comparison values by Tukey’s post-hoc test are indicated in each graph. Scale bars of the images are 100 µm
Fig. 4.

Histopathological evaluation of DMM-induced subchondral bone damage following intra-articular administration of saline, empty-μHA or Fet-μHA. A Quantification of the subchondral plate area (sq/µm) of the tibia medial plateau of DMM knees by histomorphometric analysis at the time point indicated; anatomically, the subchondral bone is defined between the calcified cartilage and the trabecular bone that surrounds the bone marrow regions. B Percentage of bone tissue (Bone Volume, BV) vs the Total Volume (TV, defined as the whole compartment comprised between the AC and the growth plate) of medial DMM knees, measured by histo-morphometric analyses at the time-points indicated. The graphs represent the mean ± standard deviation. *p ≤ 0.05, **p p ≤ 0.01, ***p ≤ 0.001, ****p ≤ 0.0001. ns = not significant. # indicates one-way ANOVA at each time point; multiple comparison values by Tukey’s post-hoc test are indicated in each graph
In the DMM model, a synovial hyperplasia is detected during OA progression, where the synovium becomes thicker, and multilayers cells are visible [25, 27, 28]. Since fetuin-A has an anti-inflammatory role during injury, we next analyzed whether DMM-induced synovial hyperplasia could be affected by local fetuin-A released into injured knees injury [9]. We found improvement between Fet-μHA knees and saline-injected knees at both OA stages, although differences were significant only at the severe OA stage (Fig. 5A-B and Table 2). No differences were detected among sham groups (with or without saline injection) compared to naïve mice at both the early and severe stages (Supplemental Figure S1 and Supplemental Table S1).
Fig. 5.

Synovial hyperplasia assessment of DMM mouse knees following intra-articular administration of saline, empty-μHA or Fet-μHA. A Representative images of the synovial lining cells (H&E staining) of DMM mice injected intra-articularly with saline, empty-μHA or Fet-μHA, at the indicated times following surgery (red arrows indicate points of cell thickening in the synovium). B Synovial hyperplasia scores (scale 0–3) at the time point indicated reflecting the thickness of the synovium (number of cell layers in the thickest point). Scores reflect the highest grade of the medial and lateral tibial plateau, medial and lateral femoral condyles. The graphs represent the mean ± standard deviation. *p ≤ 0.05, **p p ≤ 0.01, ***p ≤ 0.001, ****p ≤ 0.0001. ns = not significant. # indicates one-way ANOVA at each time point; multiple comparison values by Tukey’s post-hoc test are indicated in each graph. Scale bars of the images are 100 µm
Intraarticular administration of Fet-μHA improved muscle strength in PTOA mice
Muscles are critical to absorb joint loads; fifty percent of patients with knee OA have reduced quad strength OA [16]. Studies from literature in the DMM model77, demonstrated an impaired muscle function during OA progression [30]. In line with this evidence, we also found that DMM muscles had a reduced gene expression of Atp2a1, a Ca2 + transporter required in muscular excitation/contraction, starting at early OA stages (Fig. 6). Interestingly, such Atp2a1 downregulation was present in both the muscles involved in the knee motion (Quad) and in muscles not affected by DMM (tibialis anterior, TA), in both the operated and the contralateral legs, suggesting that muscle damage may be independent from muscle wasting (Fig. 6 and Table 3). Most notably, our in vivo studies of muscle strength, revealed that the maximal tetanic contraction measured at the gastrocnemius soleus decreases in DMM knees at the severe stage, compared to sham surgery (Fig. 7 and Table 4). Therefore, we used this parameter to investigate whether the amelioration of the joint structure following Fet-μHA intraarticular administration resulted in an improved muscle strength. Our DMM data show that Fet-μHA delivery every 3 weeks was able to rescue the maximal tetanic contraction at the gastrocnemius soleus at the most severe stage, compared to saline injections (12 weeks post-DMM, Fig. 7 and Table 4). As observed for some OA outcomes, the empty-μHA delivery seemed to have some protective effect on tetanic contraction, but the difference vs the saline injections was not significant. No differences were detected among shams with different treatments (Supplemental Figure S5 and Supplemental Table 3), therefore all sham values have been grouped together in Fig. 7 and Table 4.
Fig. 6.

Atp2a1 gene expression in quadriceps and tibialis anterior of DMM/Sham knees, operated and contralateral limbs. Atp2a1 gene expressions are measured by qRT-PCR analyses in quadriceps (Quad) and tibialis anterior (TA) muscles at the indicated time points, following DMM or sham surgery, in both the operated and the contralateral limb. In each graph, results are reported as percentage of the lowest sham value of the 4wk group. The graphs represent the mean ± standard deviation. *p ≤ 0.05, **p p ≤ 0.01, ***p ≤ 0.001, ****p ≤ 0.0001. # indicates one-way ANOVA at each time point; multiple comparison values by Tukey’s post-hoc test are indicated in each graph
Fig. 7.
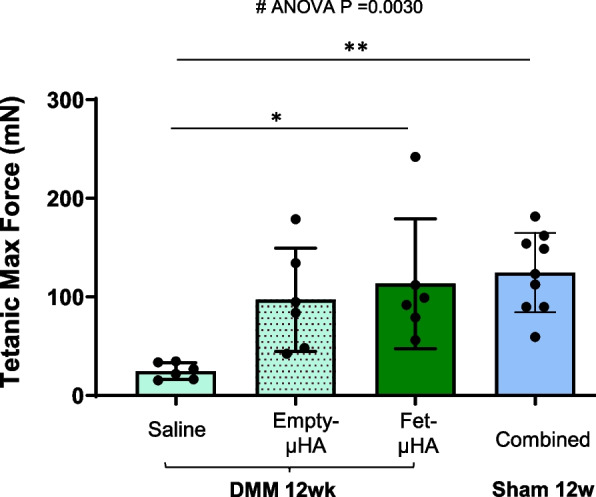
Muscle strength assessment of DMM/Sham mouse knees following intra-articular administration of saline, empty-μHA or Fet-μHA. The maximum tetanic force of the gastrocnemius and soleus complex (mN) was measured in DMM mice injected intra-articularly with saline, empty-μHA or Fet-μHA, at 12 week following surgery (DMM or sham). Because no differences were found among all shams of all treatment groups (Supplemental Fig. S3), sham samples were combined. The graph represents the mean ± standard deviation. *p ≤ 0.05, **p p ≤ 0.01, ***p ≤ 0.001, ****p ≤ 0.0001. ns = not significant. # indicates one-way ANOVA at each time point; multiple comparison values by Tukey’s post-hoc test are indicated in each graph
Discussion
In the last decade, growing evidence in clinical and animal studies has corroborated the premise that fetuin-A may be far more than a systemic mineral carrier protein complementing local tissue mineralization inhibitors [31]. In the context of OA, fetuin-A might play an important role in structural joint tissue changes, local and systemic inflammation and muscle integrity [15, 32–35]. Fetuin-A is synthesized mainly in the liver, is released into the circulation, and accumulates in mineralized bone and dentin, suggesting a critical role in bone metabolism [5]. As mentioned above, different studies have reported its clinical relevance in OA, with lower serum concentrations correlating to a more severe disease stage and more pain [11, 12]. However, the role of fetuin-A in different joint tissues during OA has not been previously demonstrated.
In this study, we tested whether a constant local delivery of fetuin-A into PTOA joints had beneficial effects on long-term cartilage degeneration. Initial studies determined that intra-articular administration of free fetuin-A every 3 weeks was not able to improve the articular cartilage damage, at any of the stage tested (early and severe OA, Supplemental Figure S2). We attributed this failure to the rapid fetuin-A clearance from the synovium as well as to loss of protein bioactivity in physiological conditions, affecting the efficacy of the treatment, and making long term studies impossible. Therefore, for the present study we reformulated the fetuin-A into hyaluronic-acid microparticles and demonstrated the ability of the resulting complex (Fet-µHA) to fully release the glycoprotein over 45 days in a constant manner under physiological conditions. Our subsequent in vivo results demonstrated that Fet-µHA delivery into mouse knees during PTOA protected the articular cartilage structure, at both early and severe OA stages. Surprisingly, quantitative analyses of the whole AC area did not correlate with the other semiquantitative cartilage scores (ACS and Saf-O), and showed significant improvement only on severe OA, but no effect at the early disease stage. This difference might reflect a specific timeline in tissue degeneration during knee injury. A recent study on rat meniscal transection using micro computed tomography (µ-CT) techniques, revealed that the initial steps of the cartilage degeneration involve a temporary thickening of the whole layer, corresponding to increased AC lesions and hypertrophy, and that the thinning of the articular cartilage layer becomes evident only at later time-points [36]. As disease progresses, the AC layer becomes thinner while the calcified cartilage and subchondral bone becomes thicker.. Therefore, the preventive action of fetuin-A on AC loss becomes more evident at a late stage (Fig. 2C and 2E). Further studies in larger animal models and using more sensitive methods (i.e. contrast agent µ-CT scan) would allow deeper cartilage analyses to better understand the fetuin-A contribution to each step of cartilage deterioration over time.
Commonly, chondrocyte hypertrophy is an important hallmark of articular cartilage destruction in OA and is associated with abnormal mineralization and crystal formation [37]. It has been shown that fetuin-A null mice have a decreased number of growth plate chondrocytes and increased hypertrophy [8]. It has been proposed that in chondrocytes, fetuin-A forms a complex with matrix Gla protein (MGP), and the complex exerts an inhibitory action on mineralization by binding BMP2 and BMP4 [34]. In support of this hypothesis, OA chondrocytes have decreased levels of MGP-Fetuin-A complex [34]. Therefore, during OA, a reduced MGP-Fetuin-A could lead to chondrocyte hypertrophy, with consequent damage of the articular surface and ECM.
As a BMP antagonist, it is not surprising that fetuin-A has a critical role in bone formation [5]. In humans, fetuin-A polymorphisms are associated with differences in bone mineral density and stature [38]. Fetuin-A null mice display increased cortical thickness in the femora [39] and are hyper-responsive to BMP-2 induced osteogenesis [6]. Therefore, loss of the BMP inhibitory mechanism due to the absence of fetuin-A during OA might lead to increased bone sclerosis and osteophytes. In support of this hypothesis, a study using subchondral bones from late-stage OA showed that sclerotic osteoblasts have significantly lower fetuin-A levels than non-sclerotic [40]. Our results show decreased bone damage (diminished osteophyte size, delayed osteophyte ossification, decreased subchondral bone area and an overall reduced percentage of bone volume over total volume) when PTOA knees are treated with Fet-µHA, compared to the saline control. Although the subchondral bone reduction is evident at all stages, the osteophyte phenotype is more evident in early OA; at the most severe stage there is more variability among replicates, and differences did not reach statistical significance. Accordingly, the total bone volume reflected these results.
Using the DMM model, Su et al. report that OA joints are stimulated very early vs an aberrant bone angiogenesis with coupled osteogenesis, that is responsible for early bone damage; they reported an early increased ossification of the subchondral bone, that precedes the destruction of the above cartilage layer [41]. Similarly, our previous DMM studies using µ-CT analyses, showed that osteophytes were detected as early as 2 weeks post-surgery [23]. In this scenario, it is not surprising that the inhibitory action of fetuin-A on mineralization and bone formation is more pronounced at the early OA stage. Although aberrant angiogenesis/bone formation has been demonstrated in the osteochondral junction, menisci and osteophytes, the mechanism of action of these pathological events are still not completely understood, and the specific temporal sequence is slightly different at distinct OA sites [42]. Therefore, multiple factors might be involved and the contribution of fetuin-A to the whole mineralization process could be variable at each joint location along PTOA stages. We also need to acknowledge that although histological analyses have been validated in OA murine models for the evaluation of bone changes, more sensitive techniques (µ-CT) would allow a more accurate quantification of bone damage, and this constitutes a limitation of the study [24].
Of note, empty-µHA administration appeared to slightly prevent the loss of AC and limit the subchondral bone thickness at the severe stage, compared with saline injections, suggesting a modest protective action on joints of the µHA alone. HA is present in the synovial fluid contributing to the lubrication of articular cartilage [43, 44], disrupted during OA [45, 46]. In this scenario, the natural biocompatible properties of HA might represent a more attractive carrier for drug delivery. Further studies will be needed to verify this hypothesis and eventually identify the potential mechanism of action.
Increasing numbers of studies have acknowledged that OA exhibits inflammation-mediated symptoms, with inflammatory mediators infiltrating the synovium, cartilage and subchondral bone [47]. Commonly, the synovium of OA patients is infiltrated with macrophages, T cells, B cells, mast cells, NK cells and other innate immune components, such as complements, cytokines and chemokines, that are also involved in OA development (reviewed by Wen et al. [48]). The ability of fetuin-A to bind several receptors, results in its involvement in both pro-inflammatory and anti-inflammatory effects [49]. Among them, several reports have addressed its critical anti-inflammatory role in injury and infection [9], opening its potential use in clinical practice [50]. In a previous report in a rat ACL transection model, Pappa et al. demonstrated a therapeutic effect of one single intra-articular injection of fetuin-A on PTOA inflammation, measuring serum levels of different interleukins [14]. In accordance with Pappa et al., we determined that local fetuin-A administration was able to reduce synovial hyperplasia during OA progression at both stages, with a more pronounced effect on severe PTOA. Although in the DMM an OA-associated synovitis is detected around 4 weeks post-surgery, the model is considered low inflammatory compared to other more severe traumatic models [51], and not ideal to dissect the role of fetuin-A in the complex inflammatory response induced by trauma. Thus, our result is only the tip of the iceberg and highlights the need for deeper studies in larger and more inflammatory models to shed light on the potential use for fetuin-A as an anti-inflammatory therapeutic in PTOA.
Muscles are critical to absorb joint loads; fifty percent of patients with knee OA have reduced quad strength [16] and muscle damage may actually occur before cartilage damage or can expedite cartilage deterioration [52]. It has been reported that neuromuscular stimulation could not restore muscle function in OA patients, indicating a reduced muscle quality [53]. Furthermore, clinical studies in OA have shown that increased muscle size was associated with less joint structural damage and less pain [54], while quadricep weakness was associated to more pain and impaired physical function [55–59]. Clinical studies reported that reduced vastus lateralis cross-sectional area was positively correlated with knee joint abnormalities and a higher degree of cartilage degeneration [60]. Therefore, in this study, we analyzed whether the reduced cartilage and bone damage resulted from constant delivery of fetuin-A in injured knees was able to ameliorate muscle strength. Studies from literature in the DMM model by van der Poel et al., demonstrated that compared to controls, DMM muscles (Tibialis Anterior, TA) had a 40% slower relaxation rate and reduced gene expression of sarcoplasmic/endoplasmic reticulum Ca2 + ATPase pump mRNA (Atp2a1), a Ca2 + transporter required in muscular excitation/contraction literature [30]. In line with this finding, we not only confirmed a reduced expression of Atp2a1 in TA from DMM limbs but detected a Atp2a1 downregulation in quadriceps, that are more involved in the knee motion; in addition, similar results were obtained in non-operated limbs, suggesting that muscle damage may be independent from muscle wasting. Importantly, our initial in vivo studies in DMM knees, show a diminished maximal tetanic contraction at the gastrocnemius soleus at the severe stage compared to sham (12wks post-DMM) that was rescued when Fet-µHA was administered intraarticular every 3 weeks. Further in vivo studies on different muscle parameters (Twitch, Force frequency), as well as ex-vivo analyses where the strength of a single muscle is compared to its morphology and size, will be critical to improve our knowledge on the impact that PTOA has on muscle weakness and, ultimately, pain.
Conclusion
Although some studies have addressed the beneficial action of fetuin-A treatment on PTOA inflammation or cartilage degradation, to the authors’ knowledge, this is the first study that analyzes the impact of constant local delivery of fetuin-A on multiple tissues (cartilage, bone, synovium and muscle) on long term PTOA. In order to develop strategies for PTOA therapy, it is critical to establish the action of a potential therapeutic on each tissue involved in PTOA and follow its outcome on OA development and progression. In this respect, we fabricated a unique HA microcarrier for fetuin-A (Fet-µHA) capable of releasing the glycoprotein slowly and in a sustained fashion into saline buffer over a period of 45 days. In addition to allowing a constant protein delivery in the knee, this system allows the use of lower drug doses compared to systemic administrations of free compound and protects the biological activity of the protein. Fet-µHA administration demonstrated beneficial effects on multiple tissues impacted by PTOA, improving the structure of the AC lamina and extracellular matrix, preventing AC loss, limiting osteophyte formation/ossification, decreasing bone damage and improving muscle function; a decreased synovial hyperplasia suggests an anti-inflammatory action along disease progression.
Our pre-clinical study not only validates the potential use of fetuin-A in PTOA treatment but confirms the µHA as a successful drug carrier in osteoarthritis.
Supplementary Information
Acknowledgements
We thank the Animal Histopathology Core at the University of North Carolina at Chapel Hill for the technical assistance as well as the staff of the Clean Room Facility, the Nikon Center, and the Material Characterization Facility of the Italian Institute of Technology.
Abbreviations
- µHA
Hydrogel-like hyaluronic-acid microparticles
- AC
Articular cartilage
- ACS
Articular Cartilage Structure
- BV/TV
Bone Volume/Total Volume
- DMEM
High-glucose Dulbecco’s modified Eagle’s minimal essential medium
- DMM
Destabilization of medial meniscus
- FBS
Fetal bovine serum
- Fet-µHA
Fetuin-A-μHA complex
- H&E
Hematoxylin and eosin
- HC
Human chondrocytes
- LAP
Lithium phenyl(2,4,6-trimethylbenzoyl)phosphinate
- MA
Methacrylate chains
- MTT
3-(4,5-Dimethylthiazol-2-yl)-2,5-diphenyltetrazolium bromide
- PFA
4% Paraformaldehyde
- PTOA
Post-traumatic osteoarthritis
- PVA
Poly(vinyl alcohol)
- Quad
Quadriceps
- Saf-O
Safranin-O
- TA
Tibialis anterior
Authors’ contributions
Study conception and design was performed by H.W., A.G., A.F., R.P., H.O., R.F.L., P.D. and L.L. Material preparation, data collection and analysis were performed by H.W., A.G., A.F., R.P., K.K., H.O., S.T.B., P.D., L.L. The first draft of the manuscript was written by L.L., and all authors commented on previous versions of the manuscript. All authors have read and approved the final manuscript.
Funding
This work was sponsored by the National Institute of Health, National Institute of Arthritis and Musculoskeletal and Skin Diseases (NIH-NIAMS R21 AR078398 – Dr. Longobardi) and the European Union's Horizon 2020 Research and Innovation Program MSCA RISE 2019 (MEPHOS grant agreement no. 872648 – Dr. Decuzzi).
Data availability
No datasets were generated or analysed during the current study.
Declarations
Ethics approval and consent to participate
All institutional and national guidelines for the care and use of laboratory animals were followed. Animal use protocols were approved by the Animal Care and Use Committee of the University of North Carolina at Chapel Hill NC (IACUC # 20–075.0-C).
Consent for publication
Not applicable.
Competing interests
The authors declare no competing interests.
Footnotes
Publisher’s Note
Springer Nature remains neutral with regard to jurisdictional claims in published maps and institutional affiliations.
Paolo Decuzzi and Lara Longobardi share senior authorship.
References
- 1.Brown TD, Johnston RC, Saltzman CL, Marsh JL, Buckwalter JA. Posttraumatic osteoarthritis: a first estimate of incidence, prevalence, and burden of disease. J Orthop Trauma. 2006;20(10):739–44. [DOI] [PubMed] [Google Scholar]
- 2.Chalmers PN, Mall NA, Moric M, Sherman SL, Paletta GP, Cole BJ, et al. Does ACL reconstruction alter natural history?: A systematic literature review of long-term outcomes. J Bone Joint Surg Am. 2014;96(4):292–300. [DOI] [PubMed] [Google Scholar]
- 3.Lien-Iversen T, Morgan DB, Jensen C, Risberg MA, Engebretsen L, Viberg B. Does surgery reduce knee osteoarthritis, meniscal injury and subsequent complications compared with non-surgery after ACL rupture with at least 10 years follow-up? A systematic review and meta-analysis. Br J Sports Med. 2020;54(10):592–8. [DOI] [PubMed] [Google Scholar]
- 4.Lin J, Zhang W, Jones A, Doherty M. Efficacy of topical non-steroidal anti-inflammatory drugs in the treatment of osteoarthritis: meta-analysis of randomised controlled trials. BMJ. 2004;329(7461):324. [DOI] [PMC free article] [PubMed] [Google Scholar]
- 5.Brylka LJ, Koppert S, Babler A, Kratz B, Denecke B, Yorgan TA, et al. Post-weaning epiphysiolysis causes distal femur dysplasia and foreshortened hindlimbs in fetuin-A-deficient mice. PLoS ONE. 2017;12(10):e0187030. [DOI] [PMC free article] [PubMed] [Google Scholar]
- 6.Rittenberg B, Partridge E, Baker G, Clokie C, Zohar R, Dennis JW, et al. Regulation of BMP-induced ectopic bone formation by Ahsg. J Orthop Res. 2005;23(3):653–62. [DOI] [PubMed] [Google Scholar]
- 7.Shu B, Zhang M, Xie R, Wang M, Jin H, Hou W, et al. BMP2, but not BMP4, is crucial for chondrocyte proliferation and maturation during endochondral bone development. J Cell Sci. 2011;124(Pt 20):3428–40. [DOI] [PMC free article] [PubMed] [Google Scholar]
- 8.Szweras M, Liu D, Partridge EA, Pawling J, Sukhu B, Clokie C, et al. alpha 2-HS glycoprotein/fetuin, a transforming growth factor-beta/bone morphogenetic protein antagonist, regulates postnatal bone growth and remodeling. J Biol Chem. 2002;277(22):19991–7. [DOI] [PubMed] [Google Scholar]
- 9.Wang H, Sama AE. Anti-inflammatory role of fetuin-A in injury and infection. Curr Mol Med. 2012;12(5):625–33. [DOI] [PMC free article] [PubMed] [Google Scholar]
- 10.Sidheeque Hassan V, Hanifa M, Navik U, Bali A. Exogenous fetuin-A protects against sepsis-induced myocardial injury by inhibiting oxidative stress and inflammation in mice. Fundam Clin Pharmacol. 2023;37(3):607–17. [DOI] [PubMed] [Google Scholar]
- 11.Albilia JB, Tenenbaum HC, Clokie CM, Walt DR, Baker GI, Psutka DJ, et al. Serum levels of BMP-2, 4, 7 and AHSG in patients with degenerative joint disease requiring total arthroplasty of the hip and temporomandibular joints. J Orthop Res. 2013;31(1):44–52. [DOI] [PubMed] [Google Scholar]
- 12.Xiao J, Wang XR, Hu KZ, Li MQ, Chen JW, Ma T, et al. Serum fetuin-A levels are inversely associated with clinical severity in patients with primary knee osteoarthritis. Biomarkers. 2013;18(1):51–4. [DOI] [PubMed] [Google Scholar]
- 13.Pappa E, Perrea DS, Pneumaticos S, Nikolaou VS. Role of fetuin A in the diagnosis and treatment of joint arthritis. World J Orthop. 2017;8(6):461–4. [DOI] [PMC free article] [PubMed] [Google Scholar]
- 14.Pappa E, Papadopoulos S, Korou LM, Perrea DN, Pneumaticos S, Nikolaou VS. The role of intra-articular administration of Fetuin-A in post-traumatic knee osteoarthritis: an experimental study in a rat model. J Exp Orthop. 2019;6(1):25. [DOI] [PMC free article] [PubMed] [Google Scholar]
- 15.van den Akker GGH, Steijns J, Stassen R, Wasilewski GB, Peeters LCW, Wijnands KAP, et al. Development of a cyclic-inverso AHSG/Fetuin A-based peptide for inhibition of calcification in osteoarthritis. Osteoarthritis Cartilage. 2023;31(6):727–40. [DOI] [PubMed] [Google Scholar]
- 16.Al-Johani AH, Kachanathu SJ, Ramadan Hafez A, Al-Ahaideb A, Algarni AD, Meshari Alroumi A, et al. Comparative study of hamstring and quadriceps strengthening treatments in the management of knee osteoarthritis. J Phys Ther Sci. 2014;26(6):817–20. [DOI] [PMC free article] [PubMed] [Google Scholar]
- 17.Glasson SS, Askew R, Sheppard B, Carito B, Blanchet T, Ma HL, et al. Deletion of active ADAMTS5 prevents cartilage degradation in a murine model of osteoarthritis. Nature. 2005;434(7033):644–8. [DOI] [PubMed] [Google Scholar]
- 18.Glasson SS, Askew R, Sheppard B, Carito BA, Blanchet T, Ma HL, et al. Characterization of and osteoarthritis susceptibility in ADAMTS-4-knockout mice. Arthritis Rheum. 2004;50(8):2547–58. [DOI] [PubMed] [Google Scholar]
- 19.Glasson SS, Blanchet TJ, Morris EA. The surgical destabilization of the medial meniscus (DMM) model of osteoarthritis in the 129/SvEv mouse. Osteoarthritis Cartilage. 2007;15(9):1061–9. [DOI] [PubMed] [Google Scholar]
- 20.Zhang P, Shen H, Huang J, Wang H, Zhang B, Zhou R, et al. Intraperitoneal administration of fetuin-A attenuates D-galactosamine/lipopolysaccharide-induced liver failure in mouse. Dig Dis Sci. 2014;59(8):1789–97. [DOI] [PMC free article] [PubMed] [Google Scholar]
- 21.Zhao P, Wei Y, Sun G, Xu L, Wang T, Tian Y, et al. Fetuin-A alleviates neuroinflammation against traumatic brain injury-induced microglial necroptosis by regulating Nrf-2/HO-1 pathway. J Neuroinflammation. 2022;19(1):269. [DOI] [PMC free article] [PubMed] [Google Scholar]
- 22.McNulty MA, Loeser RF, Davey C, Callahan MF, Ferguson CM, Carlson CS. A comprehensive histological assessment of osteoarthritis lesions in mice. Cartilage. 2011;2(4):354–63. [DOI] [PMC free article] [PubMed] [Google Scholar]
- 23.Longobardi L, Temple JD, Tagliafierro L, Willcockson H, Esposito A, D’Onofrio N, et al. Role of the C-C chemokine receptor-2 in a murine model of injury-induced osteoarthritis. Osteoarthritis Cartilage. 2017;25(6):914–25. [DOI] [PMC free article] [PubMed] [Google Scholar]
- 24.Nagira K, Ikuta Y, Shinohara M, Sanada Y, Omoto T, Kanaya H, et al. Histological scoring system for subchondral bone changes in murine models of joint aging and osteoarthritis. Sci Rep. 2020;10(1):10077. [DOI] [PMC free article] [PubMed] [Google Scholar]
- 25.Willcockson H, Ozkan H, Valdes-Fernandez J, Arbeeva L, Mucahit E, Musawwir L, et al. CC-chemokine receptor-2 expression in osteoblasts contributes to cartilage and bone damage during post-traumatic osteoarthritis. Biomolecules. 2023;13(6):891. [DOI] [PMC free article] [PubMed] [Google Scholar]
- 26.Little CB, Barai A, Burkhardt D, Smith SM, Fosang AJ, Werb Z, et al. Matrix metalloproteinase 13-deficient mice are resistant to osteoarthritic cartilage erosion but not chondrocyte hypertrophy or osteophyte development. Arthritis Rheum. 2009;60(12):3723–33. [DOI] [PMC free article] [PubMed] [Google Scholar]
- 27.Ozkan H, Di Francesco M, Willcockson H, Valdés-Fernández J, Di Francesco V, Granero-Moltó F, Prósper F, Decuzzi P, Longobardi L. Sustained inhibition of CC-chemokine receptor-2 via intraarticular deposition of polymeric microplates in post-traumatic osteoarthritis. Drug Deliv Transl Res. 2023;13(2):689-701. 10.1007/s13346-022-01235-1. Epub 15 Sep 2022. PMID:36109442 [DOI] [PMC free article] [PubMed]
- 28.Willcockson H, Ozkan H, Arbeeva L, Mucahit E, Musawwir L, Longobardi L. Early ablation of Ccr2 in aggrecan-expressing cells following knee injury ameliorates joint damage and pain during post-traumatic osteoarthritis. Osteoarthritis Cartilage. 2022;30(12):1616–30. [DOI] [PMC free article] [PubMed] [Google Scholar]
- 29.Rowe MA, Harper LR, McNulty MA, Lau AG, Carlson CS, Leng L, et al. Reduced osteoarthritis severity in aged mice with deletion of macrophage migration inhibitory factor. Arthritis Rheumatol. 2017;69(2):352–61. [DOI] [PMC free article] [PubMed] [Google Scholar]
- 30.van der Poel C, Levinger P, Tonkin BA, Levinger I, Walsh NC. Impaired muscle function in a mouse surgical model of post-traumatic osteoarthritis. Osteoarthritis Cartilage. 2016;24(6):1047–53. [DOI] [PubMed] [Google Scholar]
- 31.Jahnen-Dechent W, Heiss A, Schafer C, Ketteler M. Fetuin-A regulation of calcified matrix metabolism. Circ Res. 2011;108(12):1494–509. [DOI] [PubMed] [Google Scholar]
- 32.Chatterjee P, Seal S, Mukherjee S, Kundu R, Mukherjee S, Ray S, et al. Adipocyte fetuin-A contributes to macrophage migration into adipose tissue and polarization of macrophages. J Biol Chem. 2013;288(39):28324–30. [DOI] [PMC free article] [PubMed] [Google Scholar]
- 33.Song J, Wu J, Poulet B, Liang J, Bai C, Dang X, et al. Proteomics analysis of hip articular cartilage identifies differentially expressed proteins associated with osteonecrosis of the femoral head. Osteoarthritis Cartilage. 2021;29(7):1081–92. [DOI] [PubMed] [Google Scholar]
- 34.Wallin R, Schurgers LJ, Loeser RF. Biosynthesis of the vitamin K-dependent matrix Gla protein (MGP) in chondrocytes: a fetuin-MGP protein complex is assembled in vesicles shed from normal but not from osteoarthritic chondrocytes. Osteoarthritis Cartilage. 2010;18(8):1096–103. [DOI] [PubMed] [Google Scholar]
- 35.Yang F, Schwartz Z, Swain LD, Lee CC, Bowman BH, Boyan BD. Alpha 2-HS-glycoprotein: expression in chondrocytes and augmentation of alkaline phosphatase and phospholipase A2 activity. Bone. 1991;12(1):7–15. [DOI] [PubMed] [Google Scholar]
- 36.McKinney JM, Pucha KA, Bernard FC, Brandon Dixon J, Doan TN, Willett NJ. Osteoarthritis early-, mid- and late-stage progression in the rat medial meniscus transection model. J Orthop Res. 2025;43(1):102–16. [DOI] [PMC free article] [PubMed] [Google Scholar]
- 37.Fuerst M, Bertrand J, Lammers L, Dreier R, Echtermeyer F, Nitschke Y, et al. Calcification of articular cartilage in human osteoarthritis. Arthritis Rheum. 2009;60(9):2694–703. [DOI] [PubMed] [Google Scholar]
- 38.Zmuda JM, Eichner JE, Ferrell RE, Bauer DC, Kuller LH, Cauley JA. Genetic variation in alpha 2HS-glycoprotein is related to calcaneal broadband ultrasound attenuation in older women. Calcif Tissue Int. 1998;63(1):5–8. [DOI] [PubMed] [Google Scholar]
- 39.Seto J, Busse B, Gupta HS, Schafer C, Krauss S, Dunlop JW, et al. Accelerated growth plate mineralization and foreshortened proximal limb bones in fetuin-A knockout mice. PLoS One. 2012;7(10):e47338. [DOI] [PMC free article] [PubMed] [Google Scholar]
- 40.Sanchez C, Mazzucchelli G, Lambert C, Comblain F, DePauw E, Henrotin Y. Comparison of secretome from osteoblasts derived from sclerotic versus non-sclerotic subchondral bone in OA: a pilot study. PLoS One. 2018;13(3):e0194591. [DOI] [PMC free article] [PubMed] [Google Scholar]
- 41.Su W, Liu G, Liu X, Zhou Y, Sun Q, Zhen G, et al. Angiogenesis stimulated by elevated PDGF-BB in subchondral bone contributes to osteoarthritis development. JCI Insight. 2020;5(8):e135446. [DOI] [PMC free article] [PubMed] [Google Scholar]
- 42.Mapp PI, Walsh DA. Mechanisms and targets of angiogenesis and nerve growth in osteoarthritis. Nat Rev Rheumatol. 2012;8(7):390–8. [DOI] [PubMed] [Google Scholar]
- 43.Lin W, Klein J. Hydration lubrication in biomedical applications: from cartilage to hydrogels. Acc Mater Res. 2022;3(2):213–23. [DOI] [PMC free article] [PubMed] [Google Scholar]
- 44.Link JM, Salinas EY, Hu JC, Athanasiou KA. The tribology of cartilage: mechanisms, experimental techniques, and relevance to translational tissue engineering. Clin Biomech (Bristol, Avon). 2020;79:104880. [DOI] [PMC free article] [PubMed] [Google Scholar]
- 45.Lepetsos P, Papavassiliou AG. ROS/oxidative stress signaling in osteoarthritis. Biochim Biophys Acta. 2016;1862(4):576–91. [DOI] [PubMed] [Google Scholar]
- 46.Neu CP, Reddi AH, Komvopoulos K, Schmid TM, Di Cesare PE. Increased friction coefficient and superficial zone protein expression in patients with advanced osteoarthritis. Arthritis Rheum. 2010;62(9):2680–7. [DOI] [PMC free article] [PubMed] [Google Scholar]
- 47.Motta F, Barone E, Sica A, Selmi C. Inflammaging and osteoarthritis. Clin Rev Allergy Immunol. 2023;64(2):222–38. [DOI] [PubMed] [Google Scholar]
- 48.Wen Z, Qiu L, Ye Z, Tan X, Xu X, Lu M, et al. The role of Th/Treg immune cells in osteoarthritis. Front Immunol. 2024;15:1393418. [DOI] [PMC free article] [PubMed] [Google Scholar]
- 49.Yetim E, Eren MA, Karaaslan H, Sabuncu T. Higher levels of plasma Fetuin-A, Nrf2, and Cytokeratin 18 in patients with Hashimoto’s disease. Sisli Etfal Hastan Tip Bul. 2023;57(4):473–8. [DOI] [PMC free article] [PubMed] [Google Scholar]
- 50.Chekol Abebe E, Tilahun Muche Z, Behaile TMA, Mengie Ayele T, Mekonnen Agidew M, Teshome Azezew M, et al. Role of fetuin-A in the pathogenesis of psoriasis and its potential clinical applications. Clin Cosmet Investig Dermatol. 2022;15:595–607. [DOI] [PMC free article] [PubMed] [Google Scholar]
- 51.Jackson MT, Moradi B, Zaki S, Smith MM, McCracken S, Smith SM, et al. Depletion of protease-activated receptor 2 but not protease-activated receptor 1 may confer protection against osteoarthritis in mice through extracartilaginous mechanisms. Arthritis Rheumatol. 2014;66(12):3337–48. [DOI] [PubMed] [Google Scholar]
- 52.Bennell KL, Hunt MA, Wrigley TV, Lim BW, Hinman RS. Role of muscle in the genesis and management of knee osteoarthritis. Rheum Dis Clin North Am. 2008;34(3):731–54. [DOI] [PubMed] [Google Scholar]
- 53.Palmieri-Smith RM, Thomas AC, Karvonen-Gutierrez C, Sowers M. A clinical trial of neuromuscular electrical stimulation in improving quadriceps muscle strength and activation among women with mild and moderate osteoarthritis. Phys Ther. 2010;90(10):1441–52. [DOI] [PubMed] [Google Scholar]
- 54.Wang Y, Wluka AE, Berry PA, Siew T, Teichtahl AJ, Urquhart DM, et al. Increase in vastus medialis cross-sectional area is associated with reduced pain, cartilage loss, and joint replacement risk in knee osteoarthritis. Arthritis Rheum. 2012;64(12):3917–25. [DOI] [PubMed] [Google Scholar]
- 55.Hurley MV, Scott DL, Rees J, Newham DJ. Sensorimotor changes and functional performance in patients with knee osteoarthritis. Ann Rheum Dis. 1997;56(11):641–8. [DOI] [PMC free article] [PubMed] [Google Scholar]
- 56.McAlindon TE, Cooper C, Kirwan JR, Dieppe PA. Determinants of disability in osteoarthritis of the knee. Ann Rheum Dis. 1993;52(4):258–62. [DOI] [PMC free article] [PubMed] [Google Scholar]
- 57.Slemenda C, Brandt KD, Heilman DK, Mazzuca S, Braunstein EM, Katz BP, et al. Quadriceps weakness and osteoarthritis of the knee. Ann Intern Med. 1997;127(2):97–104. [DOI] [PubMed] [Google Scholar]
- 58.van Baar ME, Dekker J, Lemmens JA, Oostendorp RA, Bijlsma JW. Pain and disability in patients with osteoarthritis of hip or knee: the relationship with articular, kinesiological, and psychological characteristics. J Rheumatol. 1998;25(1):125–33. [PubMed] [Google Scholar]
- 59.Zhai G, Blizzard L, Srikanth V, Ding C, Cooley H, Cicuttini F, et al. Correlates of knee pain in older adults: Tasmanian Older Adult Cohort Study. Arthritis Rheum. 2006;55(2):264–71. [DOI] [PubMed] [Google Scholar]
- 60.Pan J, Stehling C, Muller-Hocker C, Schwaiger BJ, Lynch J, McCulloch CE, et al. Vastus lateralis/vastus medialis cross-sectional area ratio impacts presence and degree of knee joint abnormalities and cartilage T2 determined with 3T MRI - an analysis from the incidence cohort of the Osteoarthritis Initiative. Osteoarthritis Cartilage. 2011;19(1):65–73. [DOI] [PMC free article] [PubMed] [Google Scholar]
Associated Data
This section collects any data citations, data availability statements, or supplementary materials included in this article.
Supplementary Materials
Data Availability Statement
No datasets were generated or analysed during the current study.