

Abstract
Epigenomic dysregulation is widespread in cancer. However, the specific epigenomic regulators and the processes they control to drive cancer phenotypes are poorly understood. We employed a novel high-throughput in vivo method to perform iterative functional screens of >250 epigenomic regulators within autochthonous oncogenic KRAS-driven lung tumors. We identified many previously unappreciated epigenomic tumor-suppressor and tumor-dependency genes. We show that a specific HBO1 complex and MLL1 complex are robust tumor suppressors in lung adenocarcinoma. Histone modifications generated by HBO1 complex are frequently reduced in human lung adenocarcinomas and are associated with worse clinical features. HBO1 and MLL1 complexes co-occupy shared genomic regions, impact chromatin accessibility, and control the expression of canonical tumor suppressor genes and lineage fidelity. The HBO1 complex is epistatic with the MLL1 complex and other tumor suppressor genes in lung adenocarcinoma development. Collectively, these results provide a phenotypic roadmap of epigenomic regulators in lung tumorigenesis in vivo.
INTRODUCTION
Epigenomic alterations are a hallmark of cancer (1). Defined as the molecular entities closely linked to DNA that impact gene expression (2), critical features of the epigenome, including DNA methylation (3), chromatin accessibility (4), and histone modifications (5), are all altered during tumorigenesis. Despite increasingly detailed profiling of the tumor epigenome, these characterizations rarely point to the drivers of epigenomic changes and the functional impact of most epigenomic regulatory genes in tumorigenesis remains unknown. The specific epigenomic modifications that influence tumor phenotypes are unclear as well. Therefore, systematic identification of functional epigenomic regulators and insights into the molecular programs they regulate are essential to better understand tumor biology and develop more effective therapeutics.
The epigenome is controlled by the activity of hundreds of genes and protein complexes with overlapping, specific, and coordinated functions. Epigenomic regulators are often members of large families with potential functional redundancy (6). Conversely, individual complexes can have interchangeable subunits that dictate specific functions (6,7). Epigenomic regulators can also interact with one another to control molecular programs and thus cellular phenotypes(6). Despite these layers of complexity, cancer studies have largely focused on individual epigenomic regulators. Moving from single-gene studies to mapping the network of epigenomic regulation in tumorigenesis would provide a more comprehensive understanding of how the cancer epigenome shapes cancer phenotypes.
A pressing challenge in studying the cancer epigenome is disentangling the impact of every epigenomic family, complexes, and their individual members on cancer phenotypes. While CRISPR-Cas9-mediated functional genomics screens have provided important insights into cancer driver genes, they primarily utilize cell lines that represent the most advanced cancer cells and systems that are unable to recapitulate the physiological tumor environment. In contrast, genetically engineered mouse models of cancer allow functional investigation of defined genetic alterations on phenotypes throughout tumor development (8). Tumors in these models are initiated from normal somatic cells within their natural environment, and recapitulate the histological, transcriptional and epigenomic profiles of their corresponding human cancers (9). However, only a small number of epigenomic regulators have been investigated individually using autochthonous cancer models (10,11).
Multiplexed somatic CRISPR-mediated gene editing has been performed in genetically engineered mouse models (12,13). Nonetheless, previous methods yielded low resolution data analyzing only the largest dissectible tumors (12) or combining the growth effects of target genes from all tumors (14). Incorporating genetic barcodes into in vitro and in vivo CRISPR screens overcomes these limitations by providing clonal resolution to phenotypic readouts, which drastically improves both the sensitivity to detect effects and the breadth of phenotypes that can be measured (13,15). However, previous barcode-based in vivo methods are unable to dissect complex cellular processes such as epigenomic regulation due to their scale constraints.
In this study, we developed a scalable and quantitative method to perform high-throughput functional screens on large panels of genes in autochthonous cancer models with clonal resolution. Across iterative in vivo screens, we systematically dissected the functional impacts of >250 epigenomic regulatory genes on multiple aspects of lung tumorigenesis. Coupling this functional map with molecular analyses highlighted the HBO1 and MLL1 complexes as key interconnected tumor-suppressive epigenomic regulatory complexes in lung tumors.
RESULTS
U6-barcoding enables CRISPR screening with clonal resolution
To enable scalable and high-throughput functional analysis of genetic perturbations on cellular growth, we designed a system that encodes a clonal barcode within the 20-nucleotide region at the 3’ end of the U6 promoter directly adjacent to the sgRNA (Figure 1A, Supplemental Figure 1A, Materials and Methods). This system ensures proper coupling between genetic perturbation and diversified clonal barcodes, which can otherwise be uncoupled by template switching during lentiviral reverse transcription as well as by PCR during library preparation (16,17). U6-barcoding allows pooled cloning and viral packaging of large scale barcoded CRISPR libraries, thus drastically increasing the scale and throughput of CRISPR screens with clonal resolution, with immediate applications in a variety of CRISPR screening approaches (Supplemental Figure 1B) (8,15,18,19)
Figure 1. High-throughput analyses uncover the functional landscape of epigenomic regulation during autochthonous lung tumorigenesis.
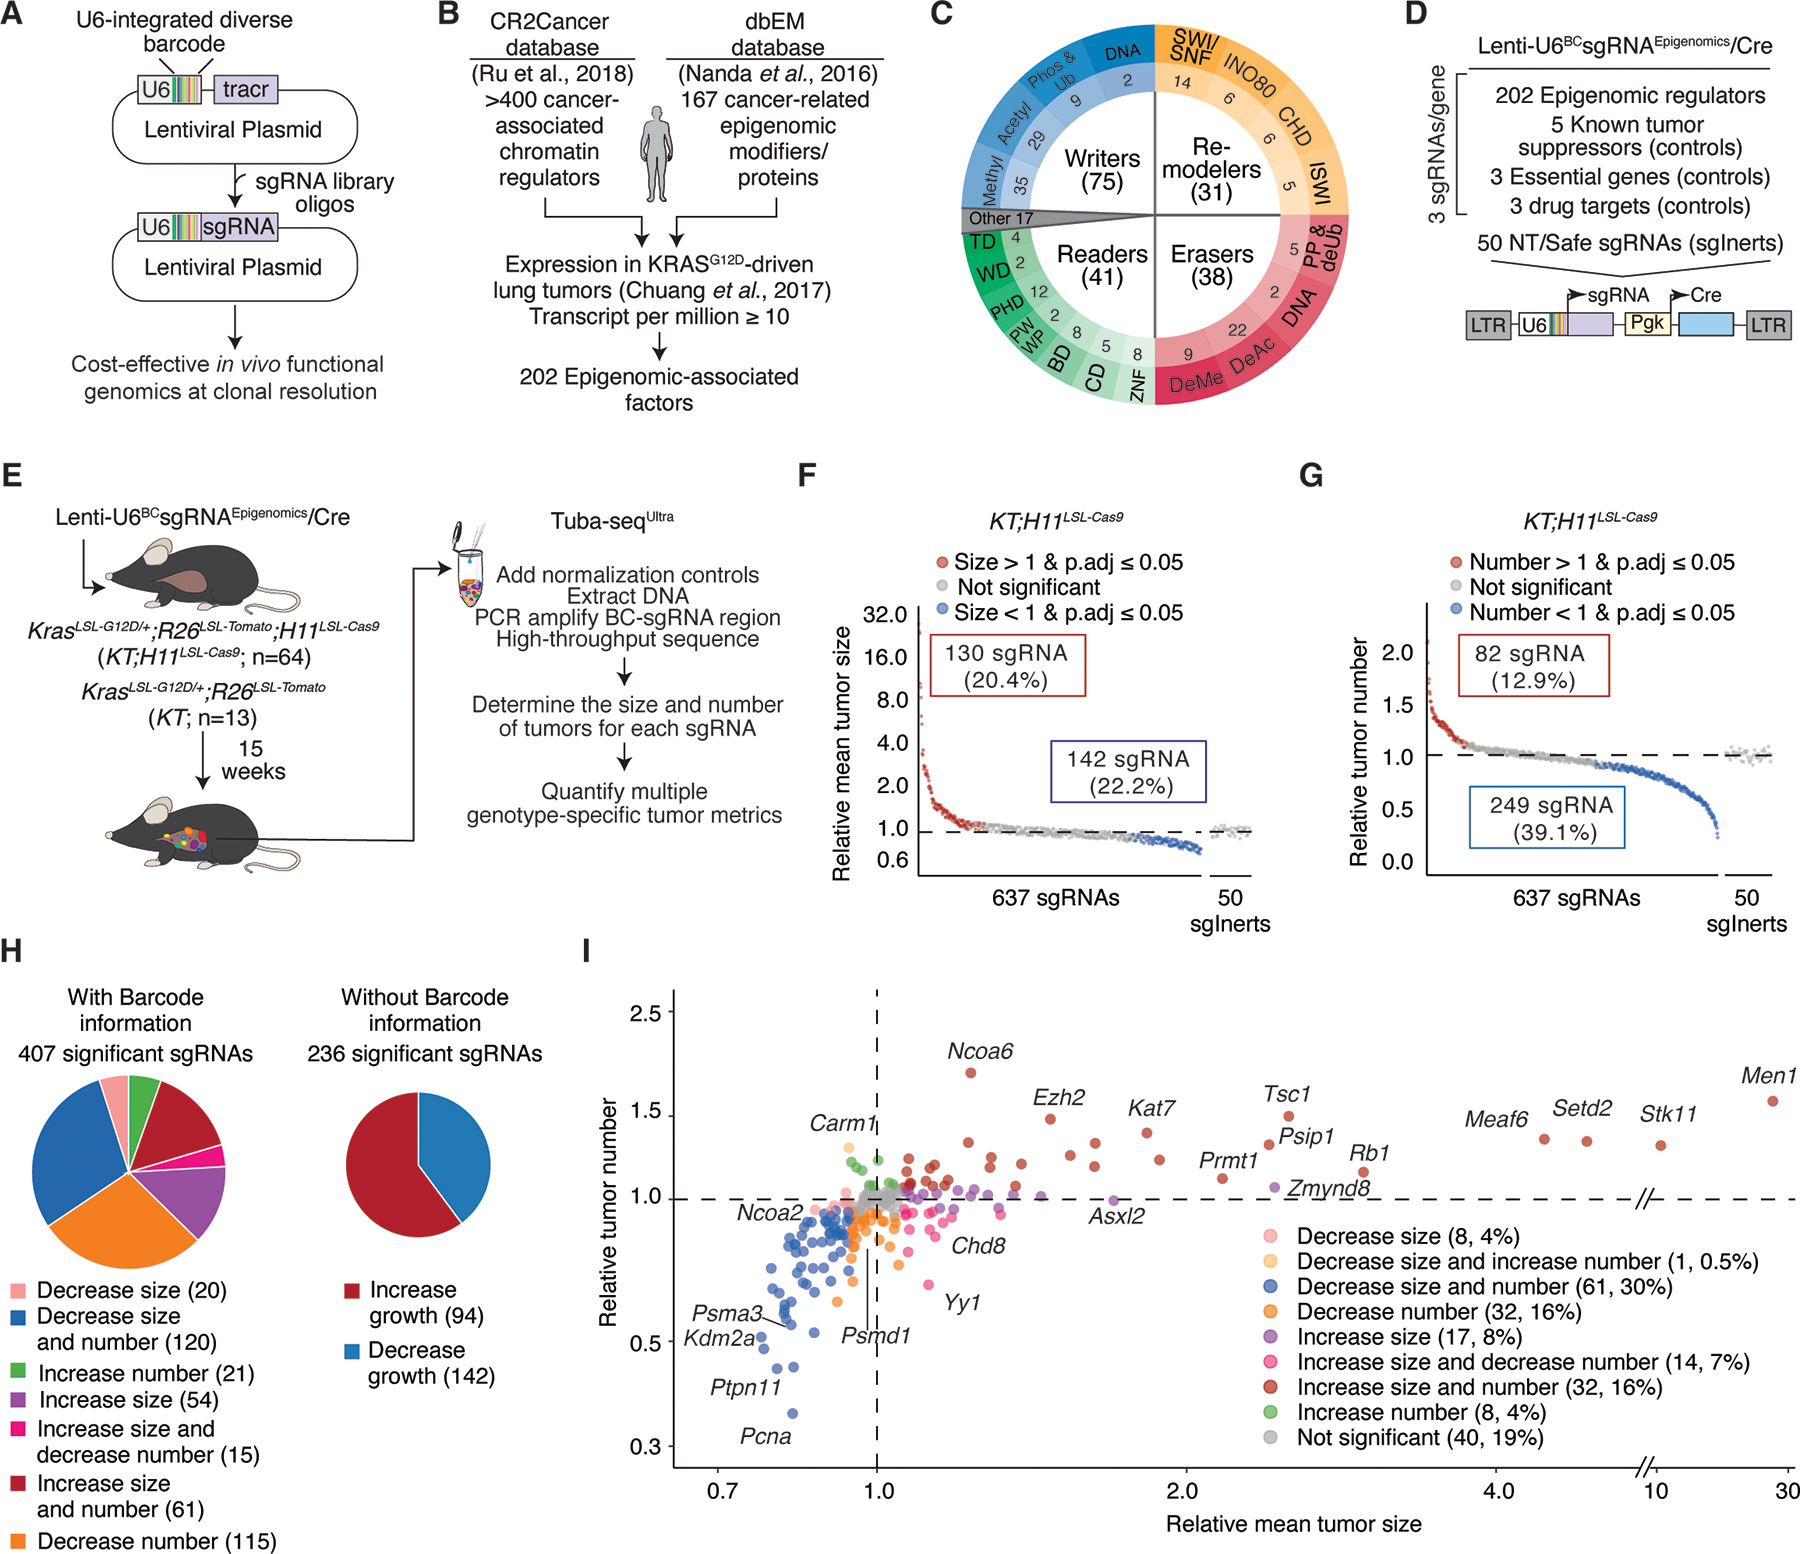
A. Integration of diverse barcodes into the U6 promoter enables scalable, in vivo functional genomics with clonal resolution.
B. Genes from broad classes of epigenomic regulators were prioritized for selection based on cancer-associated human databases and expression in KRASG12D-driven lung adenocarcinoma cells from analogous genetically engineered mouse model.
C. Selected genes encompass all major categories of epigenomic regulators, including Writers, Readers, Remodelers, and Erasers, along with other genes associated with epigenomic regulation
D. Generation of Tuba-seqUltra (U6 barcode Labeling with per-Tumor Resolution Analysis) lentiviral library. The Lenti-U6BCsgRNAEpigenomics/Cre library targets epigenomic regulators (3 sgRNAs/gene), known tumor suppressor genes, drug targets, essential genes, and includes non-targeting (NT) and safe-targeting (sgSafe) control sgRNAs (collectively referred to as sgInerts). sgSafe sgRNAs target genomic loci without known biological function.
E. Tumors were initiated with the Lenti-U6BCsgRNAEpigenomics/Cre library in the indicated numbers of KrasLSL-G12D/+;R26LSL-TdTomato;H11LSL-Cas9 (KT;H11LSL-Cas9) and KT mice. KT mice, which lack Cas9, were used as controls to quantify the relative representation of each sgRNA in the library and to assess tumor growth effects. Tumors developed for 15 weeks before Tuba-seqUltra analysis.
F-G. Impact of each sgRNA on tumor growth (Relative mean tumor size; log-normal mean tumor size relative to sgInert tumors) and tumor initiation/early growth (Relative tumor number) in KT;H11LSL-Cas9 mice. Each dot represents an sgRNA. Statistical significance was determined by bootstrap resampling with 10,000 iterations. Significant sgRNAs are colored as indicated.
H. Clonal-level analyses deconvolute the effects of different sgRNAs on tumor size and number, uncovering many more effects than sgRNA-level analyses without barcode-level information (computed here as relative tumor burden).
I. Gene-level analysis of tumor growth (relative mean tumor size) and tumor initiation/early growth (relative tumor number). Each dot represents a gene. Established tumor suppressors, essential genes, top novel epigenomic tumor suppressors, and representative genes in other categories are labeled. Note the split x-axis.
We previously developed a method that allows parallel analysis of gene function in autochthonous cancer models using tumor barcoding coupled with high-throughput barcode sequencing (Tuba-seq) (15). This method uniquely labels each lentiviral-induced clonal tumor and barcode sequencing of bulk tumor-bearing tissue accurately measure the size of each tumor. Integrating barcodes with somatic genome editing allows the impact of different genetic perturbations on tumor size and number to be quantified (Supplemental Figure 1C–D) (13,15). Incorporating U6-barcoding with Tuba-seq dramatically reduces the cost and effort required to perform barcode based CRISPR screens, making large-scale functional genomics with clonal resolution feasible (Supplemental Figure 1E–F). This Tuba-seqUltra (U6 barcode Labeling with per-Tumor Resolution Analysis) approach provides high-throughput, quantitative, and highly sensitive analysis of large numbers of genetic perturbations on clonal growth in parallel within autochthonous mouse models.
Chromatin regulators broadly impact lung tumorigenesis in vivo
Epigenomic dysregulation is a fundamental yet poorly understood hallmark of cancer (1); thus, we sought to investigate the role of epigenomic regulators from all major categories during lung adenocarcinoma initiation and growth in vivo. Genes were selected by integrating databases of epigenomic regulators that may be disrupted in human cancers based on criteria such as mutational status, structural alterations, expression levels and/or proteomic data (20,21) and further selected based on their expression in mouse KRAS-driven lung cancer cells (Figure 1B) (22). We generated a Tuba-seqUltra library containing 3 sgRNAs targeting each of the >200 epigenomic regulators, 5 canonical tumor suppressor genes, 3 known drug targets, and 3 essential genes, as well as 50 non-targeting and safe-targeting sgRNAs (sgSafes) that targets genomic regions without known function (Lenti-U6BCsgRNAEpigenomics/Cre library; Figure 1C–D and Supplemental Table 1).
We initiated tumors with the Lenti-U6BCsgRNAEpigenomics/Cre library in KrasLSL-G12D/+;R26LSL-Tomato;H11LSL-Cas9 (KT;H11LSL-Cas9; n=64) and Cas9-negative KrasLSL-G12D/+;R26LSL-Tomato (KT; n=13) control mice via intratracheal injection (Figure 1E). Cas9-negative KT mice were used to determine the representation of each sgRNA in the pool and whether expression of any sgRNAs affect tumorigenesis in the absence of Cas9 (Supplemental Figure 2A–C). Fifteen weeks after tumor initiation, all mice had a high tumor burden based on lung weight (Supplemental Figure 3A). We extracted DNA from bulk tumor-bearing lungs, PCR-amplified the barcode-sgRNA regions, and used Tuba-seqUltra to quantify the effects of inactivating each epigenomic regulator on tumor initiation and growth (Supplemental Figure 2A–C). We quantified the size of > 3 million clonal tumors, with a median of ~2,800 tumors per sgRNA (Supplemental Figure 3B–D).
Many sgRNAs significantly increased or decreased the size and number of tumors, underscoring the broad and bidirectional impact of perturbing epigenomic regulators on lung tumorigenesis (Figure 1F–G, Supplemental Figure 3E–J, Supplemental Table 2, 3). Inert sgRNAs in KT;H11LSL-Cas9 mice did not affect tumorigenesis, and no sgRNAs exhibited effects in KT control mice (Figure 1F–G, Supplemental Figure 3E–J). With per-tumor resolution, we identified 40% more statistically significant sgRNAs than we would have in a conventional CRISPR screen without barcodes (Figure 1H). These data show the sensitivity and fidelity of Tuba-seqUltra for highly multiplexed somatic gene-perturbation analyses.
Gene level analysis uncovered that inactivating >70% of epigenomic regulators had significant functional impacts on at least one facet of lung tumorigenesis (Figure 1I). Furthermore, quantifying the size and number of tumors generated by each gene distinguished diverse functional phenotypes of the targeted genes (Figure 1H–I). Inactivating different epigenomic regulators can positively and/or negatively affect tumor size and/or number (Figure 1H–I).
The HBO1 and MLL1 complexes are novel suppressors of lung cancer
We identified multiple novel tumor-suppressive and tumor-dependency genes, many of which have never been implicated in lung tumors (Figure 2A–D, Supplemental Table 4). Inactivation of all control canonical tumor suppressor genes, including Stk11, Setd2, Rb1, Rasa1, and Tsc1, increased tumor growth (relative tumor size) and/or initiation (relative tumor number) at magnitudes consistent with previous studies (Figure 2A–B) (13). Meanwhile, inactivation of known essential genes and drug targets significantly decreased tumor initiation and/or growth (Figure 2C–D). Most of the top epigenomic tumor suppressor genes increased both tumor size and number. However, inactivating Epc1 and Epc2 specifically increased tumor number but not tumor size, suggesting that they primarily affect tumor initiation (Figure 2B, Supplemental Table 4). Interestingly, EZH2 and PRMT1, which are oncogenic and candidate drug targets in other cancer types (23,24), are tumor suppressors in autochthonous lung tumors (Figure 2A, Supplemental Figure 4A). Finally, we identified many tumor-dependency genes, several of which have not previously been shown to affect tumor growth, such as Chd2, Dhx30, and Gtf3c1 (Figure 2C–D).
Figure 2. Top tumor-suppressive and tumor-dependency epigenomic regulators in lung tumorigenesis.

A-B. Top 30 tumor-suppressive genes from the Lenti-U6BCsgRNAEpigenomics/Cre library that impact tumor size (A) and/or tumor number (B). Bars represent the relative log-normal mean tumor size (A) or relative tumor number (B), aggregated across sgRNAs for each gene. Statistical significance was determined by bootstrap resampling with 10,000 iterations. Error bars represent 95% confidence intervals. Setd2 is a known tumor suppressor in lung cancer and an epigenomic regulator.
C-D. Top 30 tumor-dependency genes from the Lenti-U6BCsgRNAEpigenomics/Cre library that impact tumor size (C) and/or tumor number (D). Bars represent the relative log-normal mean tumor size (C) or relative tumor number (D), aggregated across sgRNAs for each gene. Statistical significance was determined by bootstrap resampling with 10,000 iterations. Error bars represent 95% confidence intervals.
E. Gene Ontology annotation of tumor suppressive epigenomic regulators. Gene hits for each functional category are shown in brackets. Statistical significance was determined by Fisher’s exact test with Benjamini-Hochberg correction.
F. Tumor-suppressive subunits in HBO1 and MLL1/2 complexes. Numbers in brackets indicate gene rank by effect size (tumor size, tumor number).
G-J. Kaplan-Meier survival curves for the indicated mouse genotypes with inactivation of Kat7 (G), Meaf6 (H), Kmt2a (I), and Psip1 (J) in lung tumors. sgRNAs targeting genomic loci with no known biological function (sgSafe) in KT;H11LSL-Cas9 were used as controls for sgPsip. Mice transduced with sgSafes have no significant difference in survival compared to KT mice (Supplemental Figure 4F) and were included to control for any potential growth effects arising from non-specific genome cleavage. Dashed lines indicate median survival, and statistical significance was determined by log-rank test. Note the split x-axes.
Tumor-suppressive epigenomic regulators were enriched for histone 3 lysine 14 acetylation (H3K14ac) and histone 3 lysine 4 methylation (H3K4me) activity (Figure 2E and Supplemental Table 5). Five of the top ten genes with the largest effects on tumor growth are in protein complexes linked to H3K14ac and H3K4me (Figure 2F). The lysine acetyltransferase Kat7 and Meaf6 are members of the HBO1 complex that mediates H3K14ac (25), and inactivation of either gene significantly increased tumor size and number (Figure 2A–B, F, Supplemental Figure 4B). Furthermore, inactivating Hdac3 or Sirt1, which can deacetylate H3K14ac (26,27), decreased tumor size and number (Figure 2C, Supplemental Figure 4C, Supplemental Table 4). Inactivation of several genes in the MLL1/2 complexes, including Kmt2a, Men1, and Psip1, which are primarily involved in H3K4me3 (28), also increased lung tumor growth (Figure 2A–B, F, Supplemental Figure 4D). Tumor-dependency genes were involved in H4K16ac and H3K9me, as well as chromatin remodeling, histone deacetylation, and histone demethylation (Supplemental Figure 4E, Supplemental Table 6).
By inactivating genes in parallel in the same animals, our approach removes confounding variability that arises from differences between animals and allows direct comparison of effect sizes across genes. We elected to focus further on novel tumor-suppressive epigenomic regulators because their magnitudes of effect are similar to or exceed those of canonical tumor suppressor genes like Rb1 and Tsc1 (Figure 2A), and their molecular roles in lung tumorigenesis are entirely unknown.
To validate the tumor-suppressive effects of the catalytic and structural subunits of the HBO1 and MLL1/2 complexes outside of a pooled setting, as well as to generate material for subsequent molecular analyses, we inactivated genes individually in KT;H11LSL-Cas9 and KT mice. Inactivation of Kat7, Meaf6, Kmt2a or Psip1 all significantly reduced survival, consistent with their function as tumor suppressors (Figure 2G–J, Supplemental Figure 4F). Immunohistochemistry for NKX2.1 and P63 confirmed that these tumors were lung adenomas/adenocarcinomas (Supplemental Figure 4G). Taken together, our unbiased quantitative in vivo screening and subsequent single-gene validation demonstrate that the HBO1 and MLL1/2 complexes are critical epigenomic regulators restraining lung adenocarcinoma development.
Saturation analysis defines a distinct tumor-suppressive HBO1 complex variant and MLL1 complex specificity
The HBO1 complex is a member of the larger, highly conserved MYST family of histone acetyltransferases (29), while the MLL1 complex is a member of the COMPASS family of methyltransferase complexes (6). To fully elucidate the role of the MYST and COMPASS families in lung tumorigenesis, we generated a Tuba-seqUltra library that included key genes from our initial analysis, and 47 additional epigenomic regulators. This library targeted every COMPASS and MYST family member, histone demethylases, and other related genes of interest (Lenti-U6BCsgRNASaturation/Cre library; Figure 3A–B, Supplemental Table 7). We initiated tumors with the Lenti-U6BCsgRNASaturation/Cre library in KT;H11LSL-Cas9 (n=31) and KT (n=5) mice (Supplemental Figure 5A–E). Tuba-seqUltra analysis uncovered many additional epigenomic regulators that impact tumor size and/or tumor number (Figure 3C–E, Supplemental Figure 5F–K, and Supplemental Tables 8–10).
Figure 3. Saturation analysis of MYST and COMPASS families reveals specific tumor-suppressive complexes.

A. Genes from the MYST and COMPASS families, as well as other genes of interest, were included for in vivo functional saturation analysis.
B. The Lenti-U6BCsgRNASaturation/Cre library contains sgRNAs targeting 38 epigenomic regulators from the initial analyses (Figures 1–2), 47 newly selected epigenomic regulators, as well as tumor suppressors, essential genes, non-targeting and safe-targeting sgRNAs (collectively referred to as sgInerts).
C-D. Impact of each sgRNA on tumor size (C) and tumor number (D) in KT;H11LSL-Cas9 mice. Each dot represents an sgRNA. Significant sgRNAs are colored as indicated.
E. Gene-level analysis of tumor growth (relative mean tumor size) and tumor initiation/early growth (relative tumor number) for the Lenti-U6BCsgRNASaturation/Cre library. Each dot represents a gene. Established tumor suppressors, essential genes, top novel epigenomic tumor suppressors, and representative genes in other classes are labeled. Newly included genes are shown in bold and underlined. Note the split x-axis.
F-G. Effects of inactivating genes from the HBO1 or the MOZ/MORF complexes on tumor size (F) and tumor number (G). Bars show aggregated data of all sgRNAs for each gene. Statistical significance was determined by bootstrap resampling with 10,000 iterations. Error bars represent 95% confidence intervals. The complex(es) to which each subunit belongs are indicated below each graph.
H. The tumor-suppressive HBO1JADE2-ING5 complex, in which all subunits are tumor suppressor genes.
I-J. Effects of inactivating genes from the MLL1/2/3/4 complexes on tumor size (I) and tumor number (J). Bars show aggregated data of all sgRNAs for each gene. Statistical significance was determined by bootstrap resampling with 10,000 iterations. Error bars represent 95% confidence intervals. The complex(es) to which each subunit belongs are indicated below each graph.
In addition to KAT7 and MEAF6, the HBO1 complex can contain either ING4 or ING5 and one of JADE1/2/3 or BRPF1/2/3 (29). Among these alternative subunits, our Tuba-seqUltra saturation analysis identified ING5 and JADE2 as tumor-suppressive HBO1 subunits (Figure 3F–G, Supplemental Figure 5L–M, Supplemental Table 10). Inactivation of ING4, JADE1/3 and all BRPFs either had no effect or decreased lung tumorigenesis in vivo (Figure 3F–G). These differences were not driven by differences in expression among the subunits (Supplemental Figure 5N). Thus, KAT7/MEAF6/JADE2/ING5 comprise the tumor-suppressive variant of the HBO1 complex in lung adenocarcinoma (Figure 3E–H). Importantly, none of the other MYST family genes were tumor suppressors (Supplemental Figure 6A–B, Supplemental Table 10). Inactivating Kat6a or Kat6b, the catalytic subunits of the MOZ/MORF complexes, or Kat8, the catalytic subunit of the male-specific-lethal (MSL) and the non-specific-lethal (NSL) complexes, or Kat5, the catalytic subunit of the TIP60 complex, led to modest decreases in tumor growth (Figure 3F–G, Supplemental Figure 6C–D, Supplemental Tables 8–10).
Among the COMPASS family complex components, those within the MLL1/2 complexes had the highest magnitudes of tumor suppression (Figure 3I–J, Supplemental Figure 6A–B, Supplemental Table 10). However, inactivation of Kmt2b, the catalytic subunit of the MLL2 complex and a paralog of Kmt2a, did not promote tumor growth and reduced tumor number (Figure 3I–J). Tumors initiated with dual-sgRNA lentiviral vectors indicated that simultaneous inactivation of Kmt2a and Kmt2b also reduced tumorigenesis (18) (Supplemental Figure 6E–F). Thus, while the MLL1 complex has a unique tumor-suppressive role, MLL1 and MLL2 complexes may have partially redundant essential functions in lung adenocarcinoma.
By systematically targeting entire gene families, we dissected the functional impact of MYST and COMPASS genes in driving lung tumorigenesis in vivo and revealed that specific paralogs can dictate tumor suppressive function in epigenomic regulatory complexes. We pinpointed the HBO1JADE2-ING5 complex and the MLL1 complex as suppressors of lung adenocarcinoma development.
HBO1 complex deficiency disrupts histone acetylation in lung tumors
The HBO1 complex catalyzes acetylation of several lysine residues on the tails of histone 3 and histone 4 (7). To assess which histone modifications are regulated by the HBO1 complex in lung cancer, we first assessed H3K14ac (7,25,30). Immunohistochemistry showed that CRISPR-mediated Kat7 or Meaf6 inactivation greatly reduced H3K14ac (Figure 4A). Western blot analysis of FACS isolated neoplastic cells from KT;H11LSL-Cas9 mice with Lenti-sgKat7/Cre-initiated lung tumors (hereafter referred to as sgKat7 cells) confirmed a significant reduction in KAT7 and H3K14ac (Figure 4B–C). The residual KAT7 protein and H3K14ac could result from incomplete inactivation of Kat7 by CRISPR in a subset of tumors. H4K12ac and H4K5ac are other histone acetylation marks attributed to the HBO1 complex (31). H4K12ac but not H4K5ac was reduced in sgKat7 cells (Figure 4B–C, Supplemental Figure 7A–C). Similarly, H3K14ac and H4K12ac, but not H4K5ac were reduced in sgMeaf6 cells (Figure 4D–E, Supplemental Figure 7A, D–E).
Figure 4. Disruption of the HBO1 complex and its target histone modifications in mouse and human lung adenocarcinoma.

A. Representative immunohistochemistry staining for H3K14ac in mouse lung tumors initiated by the indicated vectors in KT;H11LSL-Cas9 mice. Lower panels (scale bar, 50 μm) are higher magnification images of areas in the upper panel (scale bar, 100 μm).
B. Representative western blots of FACS-isolated lineage (CD45/CD31/Ter119/F4/80) negative, TdTomato positive (Lin−TdTom+) neoplastic cells from tumors initiated in KT;H11LSL-Cas9 mice with Lenti-sgKat7/Cre or Lenti-sgSafe/Cre vector. Each lane is from a different mouse.
C. Densitometry quantification of western blots. Relative intensities are normalized to ACTIN. Error bars represent +/− standard error of the mean, and each dot represents a different mouse. Statistical significance was determined by Student’s t-test.
D. Representative western blots of FACS-isolated Lin−TdTom+ neoplastic cells from KT;H11LSL-Cas9 mice with Lenti-sgMeaf6/Cre or Lenti-sgSafe/Cre vectors initiated tumors. Each lane is from a different mouse.
E. Densitometry quantification of western blots. Relative intensities are normalized to ACTIN. Error bars represent +/− the standard error of the mean, and each dot represents a different mouse. Statistical significance was determined by Student’s t-test.
F. Representative western blots of FACS-isolated Lin−TdTom+ neoplastic cells from tumors initiated in KT and KT;H11LSL-Cas9;Kat7fl/fl mice with Lenti-sgSafe/Cre vector. Each lane is from a different mouse.
G. Densitometry quantification of western blots. Relative intensities are normalized to ACTIN. Error bars represent +/− standard error of the mean, and each dot represents a different mouse. Statistical significance was determined by Student’s t-test.
H. Type and frequency of mutations in subunits of the HBO1JADE2-ING5 tumor-suppressive complex in human lung adenocarcinoma. The number of individuals (n) is indicated.
I. Representative immunohistochemistry staining of human lung cancer samples expressing high, medium, low, or absent levels of H3K14ac (scale bar, 100 μm; inset scale bar, 5 μm).
J. Percentage of human lung tumors expressing different levels of H3K14ac in normal lung tissue (Normal), mixed lung adenocarcinoma with bronchioalveolar carcinoma (Mixed), and lung adenocarcinoma (LUAD). Statistical significance was determined using the Kruskal-Wallis test with Benjamini-Hochberg correction.
K. Percentage of human lung tumors categorized by clinical tumor grade and stage. Reduced H3K14ac levels are correlated with higher human lung tumor grade and stage. Statistical significance was determined by Kruskal-Wallis test with Benjamini-Hochberg correction.
L. Representative western blots of human bronchial epithelial cell lines and lung adenocarcinoma cell lines. Oncogene status of each cell line is annotated.
To further validate the role of the HBO1 complex in histone modification in an orthogonal model in which all tumors would be Kat7-deficient, we generated lung tumors in KT and KT;H11LSL-Cas9;Kat7fl/fl mice (Supplementary Figure 7F) (25). Lung tumors in KT;H11LSL-Cas9;Kat7fl/fl mice were higher grade as evidenced by fewer lepidic lesions, increased nuclear pleomorphism, and increased nucleus to cytoplasm ratio compared to control tumors in KT mice (Supplemental Figure 7G–H). Moreover, neoplastic cells from lung tumors in KT;H11LSL-Cas9;Kat7fl/fl mice lacked KAT7 protein, had extremely low/absent H3K14ac, and had modestly but consistently reduced H4K12ac as assessed by immunohistochemistry and western blotting (Figure 4F–G and Supplemental Figure 7I–K). Thus, in lung adenocarcinoma, H3K14ac is predominantly if not exclusively generated by the HBO1 complex, with effects on H4K12ac being more modest, consistent with previous reports (7,25).
Human lung adenocarcinomas exhibit genetic alterations in the HBO1JADE2-ING5 complex variant and frequent reductions in H3K14ac
While mutation frequency was not an initial criterion to include genes in our broad functional screen of epigenomic regulators, given the identification of the tumor-suppressive HBO1JADE2-ING5 complex, we queried published human lung adenocarcinoma genome sequencing data for mutations and deep deletions in these genes (32). These mutations in KAT7 occurred in ~1% of tumors and are largely mutually exclusive with mutations and deep deletions in JADE2, ING5 and MEAF6 (Figure 4H). Overall, ~3% of human lung adenocarcinomas we analyzed had point mutations or deep deletions in a member of the HBO1JADE2-ING5 complex (Figure 4H). Tumor suppressor genes in the MLL1 complex, including KMT2A, PSIP1, and MEN1, had point mutations or deep deletions in ~5% of human lung adenocarcinomas. (Supplemental Figure 8A). In addition, genetic alterations in the subunits of the HBO1JADE2-ING5 and/or MLL1 tumor suppressor complexes are associated with reduced overall survival of lung adenocarcinoma patients (Supplemental Figure 8B–D).
Given that tumor suppressor genes are frequently inactivated by non-mutational mechanisms (33), we next assessed the levels of H3K14ac, H4K12ac, and H4K5ac in >200 human lung adenocarcinomas across independent cohorts by immunohistochemistry (Figure 4I–J, Supplemental Figure 9A–B). Consistently, ~30% of tumors had low or absent H3K14ac relative to normal lung epithelial cells, suggesting a large fraction of human lung adenocarcinomas have reduced HBO1 complex activity. Lung tumors with mixed bronchioalveolar carcinoma histology, a precursor to lung adenocarcinoma with better clinical outcomes (34), were less likely to have low/absent H3K14ac. Critically, reduced H3K14ac levels are significantly associated with worsening tumor grade and stage, which are key features of tumor progression and poor prognosis (Figure 4K). Consistent with the TMAs, the levels of H3K14ac were reduced in 16/21 (76%) of human lung adenocarcinoma cell lines driven by different oncogenes (Figure 4L, Supplemental Figure 9C). Similar to our mouse tumors, the human lung adenocarcinoma TMAs showed reductions in H4K12ac levels that significantly correlated with H3K14ac levels, suggesting coordinated regulation of these histone modifications (Supplemental Figure 10A–C). Levels of H4K5ac were not different between human normal lung and cancer samples (Supplemental Figure 10D–E).
To contextualize the prevalence of HBO1 inactivation in human lung adenocarcinomas, we assessed H3K36me3, the histone modification catalyzed by SETD2, which is one of the most highly mutated bona fide tumor suppressor genes in human lung adenocarcinomas (10). Approximately ~15% of tumors had reduced levels of H3K36me3 (Supplemental Figure 10F–G), comparable to previous data (10). Thus, the fraction of human lung adenocarcinoma with reduced/absent HBO1 complex activity is greater than or comparable to the percent of tumors with reduced/absent SETD2 activity.
The HBO1 and MLL1 complexes regulate shared chromatin regions in lung adenocarcinoma
To further investigate the epigenomic consequences of inactivating the HBO1 complex in lung tumors, we performed Assay for Transposase-accessible chromatin with sequencing (ATAC-seq) on sgKat7 and sgSafe cells (Figure 5A, Supplemental Figure 11A–B, Supplemental Table 11). These cells had significantly altered chromatin accessibility, with more regions becoming less accessible compared to sgSafe cells (Figure 5B, Supplemental Table 12). Over 35% of the less accessible regions were in promoter regions (Figure 5C, Supplemental Table 13). To better understand the impacts of other HBO1 and MLL1 complex genes on chromatin accessibility, we performed ATAC-seq on sorted neoplastic cells from lung tumors initiated with sgKmt2a, sgMeaf6, or sgPsip1 expressing Lenti-sgRNA/Cre vectors. Similar to Kat7, inactivating these genes significantly affected chromatin accessibility, with more regions becoming less accessible in sgMeaf6 and sgPsip1 cells (Supplemental Figure 11C, Supplemental Tables 14–16). Furthermore, 29% to 50% of the less accessible regions in sgKmt2a, sgMeaf6, or sgPsip1 cancer cells were within promoters, respectively (Figure 5C, Supplemental Figure 11D). These observations are consistent with H3K14ac and H3K4me3, the respective primary histone modifications by the HBO1 and MLL1 complexes as marks that facilitate transcription at promoters (28,30).
Figure 5. The HBO1 and MLL1 complexes regulate chromatin accessibility and co-occupy shared genomic loci.

A. FACS-isolated lineage (CD45/CD31/Ter119/F4/80) negative, TdTomato positive (Lin−TdTom+) neoplastic cells from dissociated tumor-bearing mouse lungs were used for bulk ATAC-seq.
B. Mean average (MA) plots of chromatin accessibility changes in sgKat7 and sgKmt2a tumor cells relative to sgSafe cells. Red and blue dots represent statistically significant ATAC-seq peaks (cut-off: p.adj ≤ 0.05). Data shown are derived from two independent ATAC-seq experiments.
C. Genomic annotation and percentage distribution of significantly decreased chromatin accessibility regions (cut-off: log2 fold-change < 0 & p.adj ≤ 0.05) in sgKat7 or sgKmt2a cells relative to sgSafe cells.
D. Heatmaps of significantly decreased chromatin accessibility regions in sgKmt2a cells relative to sgSafe cells (cut-off: log2 fold-change < 0 & p.adj ≤ 0.05). The same genomic regions are shown for sgKat7 cells relative to sgSafe cells, indicating broad similarity of decreased chromatin accessibility between these two genotypes.
E. Overlap of significantly decreased chromatin accessibility regions between sgKat7 and sgKmt2a cells relative to sgSafe controls.
F. Top transcription factor motifs enriched in shared genomic regions with significantly decreased chromatin accessibility in sgKat7 and sgKmt2a cells relative to sgSafe cells.
G. Heatmaps of normalized CUT&RUN signals for the indicated proteins and histone modifications within ±3 kb of transcription start sites (TSS) for all genes in the KrasG12D; p53−/− murine lung adenocarcinoma cell line (KPTC).
H. Genomic annotation and percentage distribution of CUT&RUN signals for the indicated proteins and histone modifications in the KPTC cell line.
I. Overlap of CUT&RUN signals between the indicated proteins and histone modifications.
J. Representative CUT&RUN tracks showing binding of the indicated proteins and histone modifications in the KPTC cell line at canonical tumor suppressor genes (Stk11, Cdkn2c) and transcription factors (Foxa1, Foxm1) that regulate lung epithelial development. These data demonstrate direct co-occupancy of HBO1 and MLL1 complexes and their target modifications near the promoters of these genes. Numbers in square brackets indicate the range of normalized peak scores for the tracks below.
Critically, the overall chromatin accessibility landscapes between tumors with inactivated HBO1 and MLL1 complex genes are significantly correlated. There were substantial overlaps in regions of reduced chromatin accessibility (Supplemental Figure 11E). For example, >50% of the less accessible regions in sgKmt2a cells were also less accessible in sgKat7 cells (Figure 5D–E, Supplemental Table 17). Similar overlaps in chromatin accessibility existed between inactivating other HBO1 or MLL1 complex genes (Supplemental Figure 11F–I, Figure 12A).
To better characterize the overlapping chromatin regions regulated by the HBO1 and MLL1 complexes, we examined the DNA-binding motifs and the genes that are associated with these regions. The shared regions of reduced chromatin accessibility between sgKat7 and sgKmt2a cells were enriched for transcription factor motifs for FOXA1, FOXA2 and NKX2.1, which regulate lung airway epithelium development (Figure 5F, Supplemental Table 18) (35). Shared regions with reduced chromatin accessibility in sgMeaf6 and sgPsip1 were enriched for similar transcription factors (Supplemental Figure 12A, Supplemental Table 18). In addition, genomic regions near tumor suppressor genes such as Chd1 and Fbwx7 had consistently reduced accessibility (Supplemental Figure 12B, Supplemental Tables 4, 12,14–16) (36,37). Overlapping regions of increased chromatin accessibility were enriched for KLF and TEAD motifs (Supplemental Figure 12C, Supplemental Table 19), which are known to promote cell proliferation and regulate lung morphogenesis (38,39).
To examine the genomic regions directly regulated by the HBO1 and MLL1 complex, we performed Cleavage Under Targets and Release Using Nuclease (CUT&RUN) on two independent KrasG12D; p53−/− murine lung adenocarcinoma cell lines. KMT2A and its primary histone modification H3K4me3 were found mainly at the promoter regions and near the transcription start sites (Figure 5G–H, Supplemental Figure 13A), consistent with our ATAC-seq data and previous studies (6). KAT7 also primarily bound near the transcription start sites (Figure 5G–H). Although H3K14ac peak signals were highest near transcription start sites, they were also broadly distributed throughout the genome, including in introns and intergenic regions (Figure 5G–H, Supplemental Figure 13A–D), consistent with publicly available ChIP-seq data from human and mouse cells findings (Supplemental Figure 13E) (25,40). Importantly, 67.8% and 86.4% of regions were co-occupied by KAT7 and KMT2A in these two murine lung adenocarcinoma cell lines (Figure 5I, Supplemental Figure 13B–C). Furthermore, almost all H3K4me3 peaks were co-occupied with H3K14ac (Figure 5I, Supplemental Figure 13C). In addition, co-occupied peaks were located at the promoter and transcription start sites of many canonical tumor suppressor genes including Stk11 and Cdkn2c, as well as Chd1 and Fbxw7, that showed reduced chromatin accessibility upon HBO1 and MLL1 complex inactivation in autochthonous lung tumors (Figure 5J, Supplemental Figure 12B, Supplemental Figure 13F). Similarly, co-occupied peaks were present at the promoters of lung lineage transcription factors, including Foxa1 and Foxm1, the motifs of which were enriched in regions of reduced chromatin accessibility in vivo (Figure 5F, Supplemental Figure 12A). Taken together, our data suggest that the HBO1 and MLL1 complexes regulate the chromatin landscape and modify histones at shared regions of the genome involved in tumor suppression and lung development.
To determine whether the catalytic activity of KAT7 suppresses lung adenocarcinoma growth, we treated a KrasG12D; p53−/− murine lung adenocarcinoma cell line with WM3835, a small molecule inhibitor that blocks the lysine acetyltransferase activity of KAT7 (30). WM3835 treatment significantly reduced H3K14ac levels in these cells (Supplemental Figure 14A–B). Treatment of the lung adenocarcinoma cells with WM3835 over 5 days significantly increased colony formation compared to vehicle treated cells (Supplemental Figure 14C–D). To gain insights into the molecular changes associated with this growth phenotype, we performed CUT&RUN and bulk RNA-seq. Compared to vehicle treated cells, WM3835 treatment reduced peak signals for H3K14ac and H3K4me3 (Supplemental Figure 14E–F). At the transcriptome level, WM3835 treatment increased the expression of genes involved in proliferation and decreased the expression of genes involved in apoptosis (Supplemental Figure 14G–H, Supplemental Table 20). Overall, these data suggest that the acetyltransferase activity of HBO1 is at least in part required in suppressing lung tumor growth.
The HBO1 and MLL1 complexes regulate cell type identity and canonical tumor suppressor gene expression in lung adenocarcinoma
To investigate the gene expression programs regulated by the HBO1 complex in lung tumors in vivo, we performed single-cell RNA sequencing (scRNA-seq) on FACS-isolated neoplastic cells from sgKat7 and sgSafe lung tumors (Figure 6A, Supplemental Table 21). The sgKat7 cells were in largely distinct clusters from control sgSafe cells (Figure 6B, Supplemental Figure 15A–C). We compared gene expression between clusters composed predominantly of sgKat7 cells relative to sgSafe, given that a subset of sgKat7 cells will not have complete gene inactivation resulting from inefficiencies in CRISPR-Cas9 (Supplemental Figure 15D). There were significant differences in the overall gene expression profile between sgKat7 and sgSafe clusters, with a greater number of genes being down-regulated in sgKat7 clusters, consistent with ATAC-seq profiling (Figure 6C, Figure 5B, Supplemental Table 22). The down-regulated genes were involved in cytoskeleton organization, cell migration, differentiation and apoptosis (Supplemental Figure 16A, Supplemental Table 23). Furthermore, we observed significant overall correlation in gene expression profile between WM3835 treated murine lung adenocarcinoma cells and Kat7 inactivated autochthonous tumor cells (Supplemental Figure 16B).
Figure 6. The HBO1 and MLL1 complex genes regulate cell state identity and canonical tumor suppressor gene expression.

A. FACS-isolated lineage (CD45/CD31/Ter119/F4/80) negative, TdTomato positive (Lin−TdTom+) neoplastic cells from dissociated tumor-bearing mouse lungs were used for scRNA-seq.
B. UMAPs of scRNA-seq data for the indicated genotypes.
C. Differential gene expression between cell clusters that are predominantly sgKat7 or sgKmt2a compared to cell clusters that are predominantly sgSafe. The specific clusters for each group are shown in Supplemental Figure 15. Red dots indicate statistically significant up-regulated genes (cut-off: log2 fold-change ≥ 0.14 & p.adj ≤ 0.05), and blue dots indicate statistically significant down-regulated genes (cut-off: log2 fold-change ≤ −0.14 & p.adj ≤ 0.05). The total number of statistically significant genes is indicated.
D. Dot plots of canonical tumor suppressor genes between the indicated cluster-based comparisons. Asterisks (*) indicate statistical significance (cut-off: log2 fold-change ≤ −0.14 or ≥ 0.14 & p.adj ≤ 0.05).
E-F. Cell type signature scores for sgKat7 or sgSafe transduced tumor cells (E), and sgKmt2a or sgSafe transduced tumor cells (F). Violin plots show cell type signature scores for cells in predominantly sgKat7 or sgSafe clusters (E), and cells in predominantly sgKmt2a or sgSafe clusters (F). Median cell type signature score is indicated by a dot on each violin plot. Statistical significance was determined by Wilcoxon rank-sum test.
G-H. Dot plots of AT2 and gastrointestinal marker genes between cell clusters that are predominantly sgKat7 (G) or sgKmt2a (H) compared to cell clusters that are predominantly sgSafe. Asterisks (*) indicate statistical significance (cut-off: log2 fold-change ≤ −0.14 or ≥ 0.14 & p.adj ≤ 0.05).
To investigate the impact of perturbing other HBO1 complex genes as well as the MLL1 complex on transcriptional programs and cell states, we performed scRNA-seq on sgKmt2a, sgMeaf6, and sgPsip1 cells (Figure 6B, Supplemental Figure 15E–R). Clusters enriched for sgKmt2a, sgMeaf6, and sgPsip1 cells exhibited more down-regulated genes than up-regulated genes. Many cellular processes down-regulated in sgKat7 cell clusters were similarly down-regulated in the other genotypes. Multiple tumor suppressor genes, including Trp53, Stk11, Chd1, Dot1l, Dusp5, Fbxw7, and Rb1, had reduced expression in clusters enriched for cells with inactivated HBO1 or MLL1 complex genes (Figure 6D, Supplemental Figure 16C–D). These observations align with our ATAC-seq and CUT&RUN analyses (Figure 5), further supporting that HBO1 and MLL1 complexes regulate shared molecular programs and the expression of canonical tumor suppressor genes in lung adenocarcinoma.
We next examined the impact of HBO1 or MLL1 complex deficiency on cell-state identity. Inactivation of Kat7, Kmt2a or Psip1 promoted a more AT2-like state, characterized by increased AT2 cell signature and increased expression of known AT2 marker genes (Figure 6E–H, Supplemental Figure 16E–G). sgMeaf6 clusters showed increased expression for both AT2 and AT1 marker genes (Supplemental Table 22). Deletion of Kat7 using floxed alleles in normal AT2 cells also increased the expression of AT2 marker genes and the down-regulated genes were enriched in sgKat7 cells (Supplemental Figure 17A–D, Supplemental Table 24). In addition, cells clusters of sgRNAs targeting the HBO1 or MLL1 complex genes had enhanced gene signatures from other tissues such as the pancreas and kidney Figure 6E–H, Supplemental Figure 16H–K, Supplemental Table 25). The emergence of mixed lineage cell states indicates reduced lineage fidelity, a feature of tumor progression and is associated with worse clinical outcome (9). Taken together, the scRNA-seq analyses revealed that inactivation of the HBO1 or MLL1 complexes consistently repressed the expression of canonical tumor suppressor genes and weakened lineage fidelity.
KAT7 exhibits epistasis with the MLL1 complex and canonical tumor suppressor genes
Understanding genetic interactions can uncover redundant functions within and between complexes and pathways, as well as reveal important insights into cancer evolution and cellular fitness. Given the shared tumor-suppressive effects of the HBO1 and MLL1 complexes and their considerable similarity in molecular features, we examined the fitness relationship between the HBO1 and MLL1 complexes in human cancer cells. Analysis of the Cancer Dependency Map Project (DepMap) (41) showed that the tumor-suppressive HBO1JADE2-ING5 complex members had highly correlated fitness effects with one another, and with the tumor-suppressive genes from the MLL1 complex, but not with KMT2B (Figure 7A, Supplemental Figure 18A–B, Supplemental Table 26). The correlation coefficients between genes across the HBO1 and MLL1 complexes were comparable to genes within each complex. Importantly, the non-tumor suppressive paralogs ING4 and JADE1/3 were less correlated than ING5 and JADE2 with tumor-suppressive MLL1 genes (Supplemental Figure 18B, Supplemental Table 26). These fitness correlations from >1,000 human cancer cell lines support a functionally distinct HBO1JADE2-ING5 complex that interacts with the MLL1 complex.
Figure 7. Kat7 is epistatic with the MLL1 complex and canonical tumor suppressor genes.
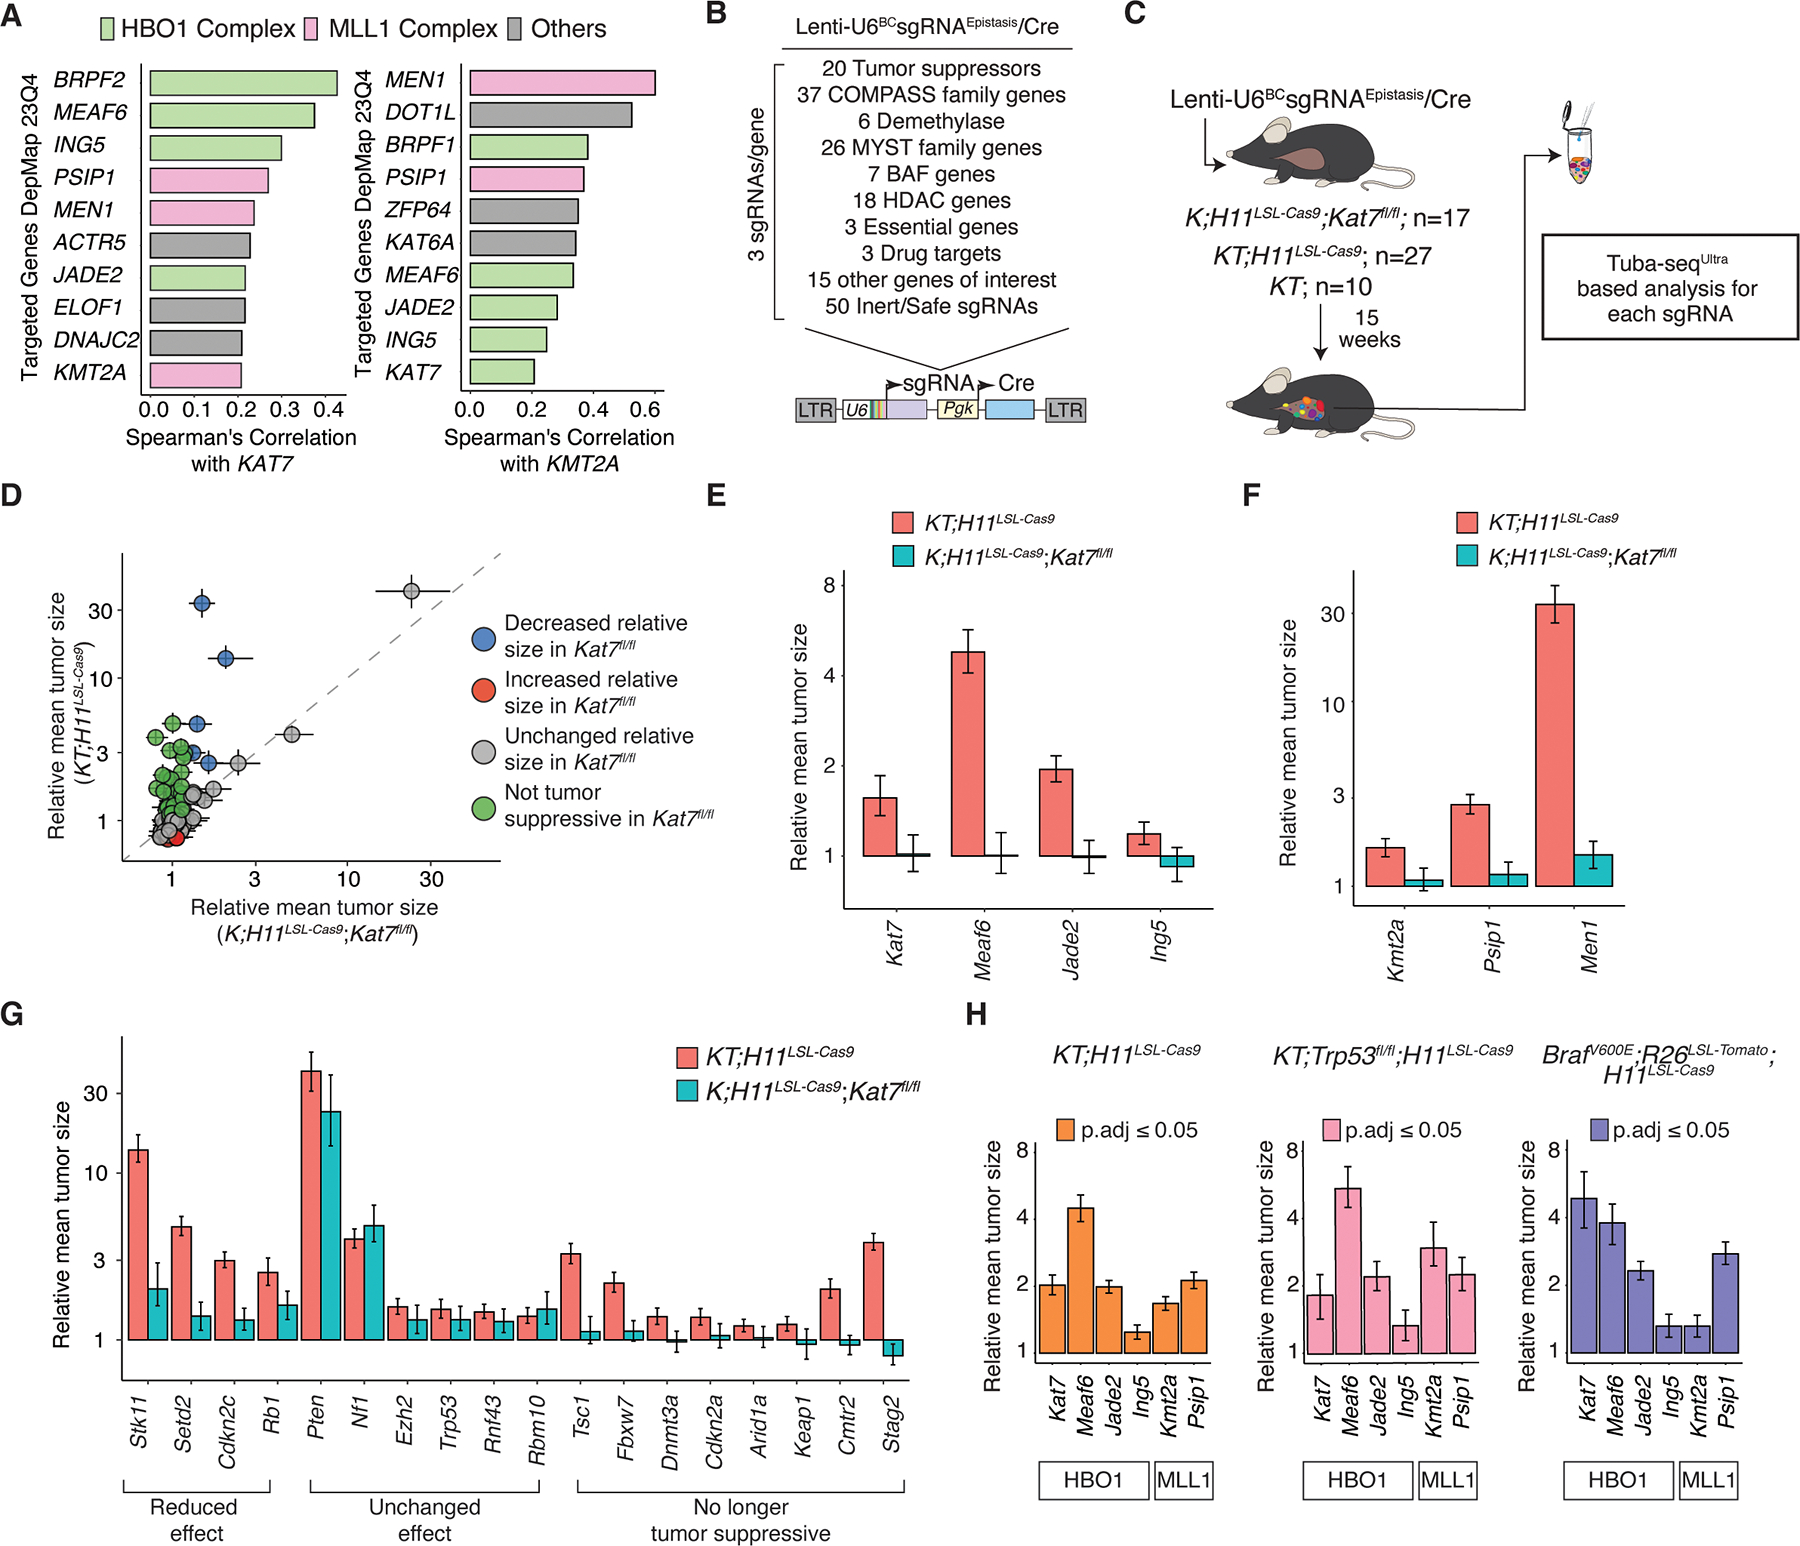
A. Correlation of cancer dependency scores from DepMap showing the top genes correlated with KAT7 include genes within the HBO1 and MLL1 complexes. Similarly, genes highly correlated with KMT2A include members of the MLL1 and HBO1 complexes.
B. Genes included in the Lenti-U6BCsgRNAEpistasis/Cre library.
C. Tumors were initiated with the Lenti-U6BCsgRNAEpistasis/Cre library in the indicated numbers of KT;H11LSL-Cas9 and KT mice. Tumors developed for 15 weeks before Tuba-seqUltra analysis.
D. Mean tumor size relative to inert sgRNAs for the genes targeted in the Lenti-U6BCsgRNAEpistasis/Cre library is shown for K;H11LSL-Cas9;Kat7fl/fl mice (x-axis) and KT;H11LSL-Cas9 mice (y-axis). Each dot represents a gene. The diagonal line (y = x) indicates no difference in relative mean tumor size between the two mouse genotypes. Error bars represent 95% confidence intervals.
E. Mean tumor size relative to sgInerts for HBO1JADE2-ING5 complex genes in KT;H11LSL-Cas9 and K;H11LSL-Cas9;Kat7fl/fl mice.
F. Mean tumor size relative to sgInerts for MLL1 complex tumor suppressor genes in KT;H11LSL-Cas9 and K;H11LSL-Cas9;Kat7fl/fl mice.
G. Mean tumor size relative to sgInerts for canonical tumor suppressor genes in KT;H11LSL-Cas9 and K;H11LSL-Cas9;Kat7fl/fl mice. Genes are considered to have reduced tumor suppressive effects in K;H11LSL-Cas9;Kat7fl/fl mice if their 95% confidence intervals do not overlap with the lower bound of the 95% confidence interval in KT;H11LSL-Cas9 mice. Genes are no longer considered tumor suppressive if the 95% confidence interval crosses 1 or is below 1 in K;H11LSL-Cas9;Kat7fl/fl mice but is greater than 1 in KT;H11LSL-Cas9 mice.
H. Mean tumor size relative to sgInerts when targeting genes in the HBO1JADE2-ING5 or MLL1 complex in lung tumors from the indicated mouse genotypes.
To dissect the functional relationship between the HBO1 and MLL1 complexes, as well as with other tumor suppressor genes, we generated a Tuba-seqUltra library targeting the MYST family associated genes, the COMPASS family associated genes and 18 canonical tumor suppressor genes in KT, KT;H11LSL-Cas9, and K;H11LSL-Cas9;Kat7fl/fl mice (Figure 7B–C, Supplemental Figure 18C–F, Supplemental Table 27). As expected, Cre-mediated inactivation of Kat7 increased tumor growth (Supplemental Figure 18G–H). Overall, there were widespread epistatic interactions with Kat7 (Figure 7D). Cas9-mediated targeting of Kat7 increased tumor growth in KT;H11LSL-Cas9 mice while having no effect in K;H11LSL-Cas9;Kat7fl/fl mice (Figure 7E). Likewise, inactivation of Ing5, Meaf6, or Jade2 increased tumor growth in KT;H11LSL-Cas9 mice but not in K;H11LSL-Cas9; Kat7fl/fl mice, demonstrating that these genes function as part of a tumor suppressive complex (Figure 7E, Supplemental Table 28).
To investigate the functional interaction between the HBO1 and MLL1 complexes in tumor suppression, we assessed the impact of coincident inactivation of Kat7 with key members of the MLL1 complex. The increased tumor growth driven by Kmt2a, Men1, or Psip1 inactivation was almost completely abolished in the context of Kat7 deficiency (Figure 7F). This dramatic reduction of tumor suppression by MLL1 complex genes in the absence of Kat7 demonstrates strong epistatic interaction between these two complexes, where the MLL1 and HBO1 complexes functionally interact to suppress lung tumor growth, consistent with their molecular profiles.
Since perturbing the HBO1 and MLL1 complexes reduced the expression canonical tumor suppressor genes (Figure 6), we hypothesized that inactivation of HBO1 could influence the functional outcome of other tumor suppressor pathways. We quantified the effects of inactivating tumor suppressor genes on Kat7-proficient and Kat7-deficient lung tumors. Inactivation of several tumor suppressors, such as Nf1, Rbm10, and Ezh2, promoted tumor growth to a similar extent regardless of Kat7 status. However, inactivating many others, such as Stk11, Setd2, and Cdkn2c increased the growth of Kat7-deficient tumors less than Kat7-proficient tumors (Figure 7G). Strikingly, inactivating Stag2 and other tumor suppressor genes associated with the STAG2-cohesin complex increased the growth of Kat7-proficient tumors but decreased the growth of Kat7-deficient lung tumors, suggesting that STAG2-cohesin is required for Kat7-deficient lung tumors (Figure 7G, Supplemental Figure 19A) (13). We further confirmed this synthetic lethal interaction by inactivating Kat7 in KT;H11LSL-Cas9;Stag2fl/fl mice, which significantly reduced tumor size relative to sgInert tumors (Supplemental Figure 19B–D)(42). Thus, Kat7 displays a range of epistatic interaction with a subset of tumor suppressor genes, further supporting its role as a pivotal regulator of lung tumorigenesis.
Finally, we assessed the generalizability of the HBO1 and MLL1 complex genes in suppressing lung tumorigenesis under different oncogenic contexts and in the absence of the critical p53 tumor suppressor gene. We included sgRNAs targeting genes in the HBO1JADE2-ING5 complex and the MLL1 complex in a Tuba-seqUltra library and initiated lung tumors in KT;H11LSL-Cas9, BrafV600ET;H11LSL-Cas9, and KT;Trp53fl/fl;H11LSL-Cas9 mice. Inactivating these genes greatly increased tumor growth across all genetic backgrounds (Figure 7H, Supplemental Figure 20A–C, Supplemental Table 29). Thus, tumor suppression by the HBO1 and MLL1 complex extends across multiple genetic driver contexts in lung tumors.
DISCUSSION
Enabled by the simplicity and versatility of Tuba-seqUltra, we performed iterative functional screens in vivo to systematically investigate epigenomic regulatory genes in lung tumorigenesis. This experimental paradigm of discovery, saturation, and epistasis screens within autochthonous cancer models, coupled with molecular analysis identified previously unappreciated HBO1JADE2-ING5 and MLL1 complexes as impactful tumor suppressive epigenomic regulators in lung adenocarcinoma.
An important implication of this work is the shift from studying individual driver genes toward investigating functional units, such as protein complexes, that can drive tumorigenesis. By examining the phenotypic impacts of hundreds of epigenomic regulatory genes in parallel, we deconvoluted the myriad of potential functions associated with individual genes and pinpointed the specific protein complexes important in tumorigenesis. Furthermore, through targeting all the genes in the larger gene families, we clearly delineated functional specificity among different variants of the HBO1 complex and unexpectedly identified HBO1JADE2-ING5 as the sole tumor suppressive complex.
The HBO1 and MLL1 complexes maintain chromatin accessibility and co-occupy shared genomic regions, including at promoters of canonical tumor suppressor genes such as Stk11 and Cdkn2c, as well as lung lineage transcription factors. Inactivation of HBO1 and MLL1 complexes in vivo reduced the expression of multiple tumor suppressor genes and promoted a shift from lung lineage toward alternative tissue identities. Notably, our epistasis analysis demonstrates that Kat7 inactivation reduced the tumor-suppressive effects mediated by these canonical tumor suppressors. Other studies have shown that lung lineage transcription factors such as Nkx2.1 and Cebpa/b, as well as increase in cellular plasticity, are known to play critical roles in multiple aspects of carcinogenesis, ranging from therapy resistance to metastatic potential (9,43,44). Cells with enhanced plasticity and lineage infidelity play critical roles in promoting many aspects of carcinogenesis from therapy resistance to metastatic ability (9). Chromatin remodeling is fundamental to the emergence of cellular plasticity and lineage infidelity (9). In lung and pancreatic cancer, highly plastic cells are defined by specific chromatin accessibility modules (9,45). Thus, the ability of the HBO1 and MLL1 complexes to facilitate the expression of tumor suppressor genes and safeguard lineage fidelity places them as an essential nexus of tumor suppression.
Our work emphasizes the role of non-mutational mechanisms in driving tumor phenotypes. While members of the HBO1 and MLL1 complexes have distinct functions that are independent of histone-modifying activities (46,47), the consistent tumor-suppressive effects of inactivating multiple members from the same complex suggest that their shared functions are likely vital for restraining tumor growth. Every member of the HBO1JADE2-ING5 complex exhibits tumor-suppressive properties, and the increased cell growth from pharmacological inhibition of KAT7 catalytic activity further suggests that its histone-modifying activity is essential for suppressing lung tumor growth. Importantly, over 30% of human lung adenocarcinomas have reduced levels of H3K14ac, which is associated with more aggressive clinical features. For the MLL1 complex, other histone methyltransferase subunits in the COMPASS family, including Kmt2c and Kmt2d, also exhibited tumor-suppressive functions, while the demethylase Kdm1a is a tumor-dependency gene. Furthermore, Men1 and Psip1, additional tumor-suppressive members of the MLL1 complex, primarily function to recruit the complex to histones at specific loci (48). Conversely, the tumor-dependency genes within the MLL1 complex, including Wdr5, Rbbp5, and Dpy30, lack the SET domain necessary for robust methyltransferase activity in vivo and are integral to all COMPASS complexes (6,49). Therefore, inactivating these genes likely disrupts the structure of multiple COMPASS complexes simultaneously, making them essential for cell survival. Although it is conceivable that functions independent of histone modification by MLL1 can suppress tumor growth, the convergence of multiple subunits in the same complex with the catalytic subunit, and the increase in cell growth resulting from pharmacological inhibition of KAT7, indicates that the histone-modifying activities of the HBO1 and MLL1 complexes likely suppresses the development of lung adenocarcinoma.
We anticipate that the relationship between the HBO1 and MLL1 complexes in cancer to be multifaceted. The similarity in chromatin accessibility landscapes, their co-occupancy at chromatin sites, and the broad fitness correlation between the HBO1 and MLL1 complexes collectively suggest that these complexes interact in lung adenocarcinoma. At the biochemical level, in vitro experiments have shown that the HBO1 complex directly binds to KMT2A (50). Additionally, interactions between the HBO1 and MLL1 complexes may be mediated through their histone modifications. The PHD fingers in ING4/5 can bind to H3K4me3 generated by the MLL1 complex, recruiting the HBO1 complex to H3K4me3 loci (51). Conversely, H3K14ac may recruit the MLL1 complex to generate H3K4me3 (52). The functional consequences of these interactions depend on the cellular and genetic contexts. The HBO1 and MLL1 complexes suppress lung adenocarcinoma, but their interaction is essential for MLL1 fusion-driven leukemia, and KAT7 has been suggested as a therapeutic target (30,53). Fusion proteins involving NUP98 and KAT7 or JADE2 potently transform hematopoietic progenitors into leukemic cells while fusions with other JADEs have limited transforming capacity (50), demonstrating the unique role of JADE2 containing HBO1 complex in regulating cancer growth. Interestingly, in Stag2-deficient lung tumors, Kat7 is a genetic vulnerability, similar to its role in leukemia. These context-dependencies underscore the importance of cell type and genotype in shaping the cancer epigenome and implicate that therapeutic targeting of KAT7 will require thorough consideration of both tumor type and the mutational landscape.
Although this study primarily focused on tumor-suppressive epigenomic regulators, we identified multiple genes that are required for autochthonous lung adenocarcinoma. Inactivation of several genes reduced tumor growth to an extent comparable to known drug targets SOS2 and PTPN11/SHP2. Inhibitors already exist for some of the novel epigenomic tumor-dependency genes that we identified, such as Kdm1a (54) and Kat6a (55). Future in vivo studies on these epigenomic tumor-dependency genes may uncover novel actionable targets for lung cancer.
In this study, we provide a phenotypic map of epigenomic regulators in autochthonous lung adenocarcinoma. Our new methodology is cost-effective, highly accessible, and offers virtually unlimited scalability compared to previous barcode-based CRISPR screening methods involving clonal tracing. We anticipate that Tuba-seqUltra will enable rapid and comprehensive in vivo functional genomics analyses, including studies that focus on broad biological processes, identify therapeutic targets, and dissect the intricate genetic mechanisms involved in a wide range of biological questions and disease models.
MATERIALS and METHODS
Experimental Model and Subject Details
Mouse models
All animal experiments in this study were approved by the Institutional Animal Care and Use Committee (IACUC) at Stanford University, protocol number 26696. KrasLSL-G12D/+ (RRID:IMSR_JAX:008179), Trp53fl/fl (RRID:IMSR_JAX008462), R26LSL-TdTomato (RRID:IMSR_JAX:007914), and H11LSL-Cas9 (RRID:IMSR_JAX:027632), and BrafV600E (RRID:IMSR_JAX: 017837) mice were from the Jackson Laboratories. Kat7fl/fl mice were previously described (25). All mice were on a C57BL/6 background and kept in standard conditions with 12-hour light/dark cycle and ad libitum access to food and water.
Human lung adenocarcinoma tissue microarray
Human lung cancer tissue microarray from Stanford University School of Medicine was obtained from patients who provided written informed consent for research use, in accordance with Institutional Review Board approvals and the Declaration of Helsinki. An additional human lung cancer tissue microarray was purchased from U.S. Biomax (Cat # LUC1201MSur).
Human cell lines
Human bronchial epithelial cell lines HBEC3KT and HBEC30KT were a gift from Dr. John Minna (University of Texas Southwestern Medical Center). These cells were maintained in PneumaCult™-Ex Plus Medium (Stem Cell Technologies, 05040). EGFR mutant lung cancer cell lines were a gift from Dr. Katerina Politi (Yale University). All other human cell lines used in this study were obtained from ATCC. The human lung cancer cell lines were cultured in RPMI-1640 medium (Gibco, 11875093) supplemented with 10% fetal bovine serum (FBS; Phoenix Scientific). Mycoplasma testing was performed using MyCoAlert Detection Kit (Lonza, LT07–318).
Method Details
Tuba-seqUltra vector design and barcoding
Proper functioning of the U6 promoter requires sequence motifs including the octamer, proximal sequence element, distal sequence element, and the TATA box. Previous work has shown that the U6 promoter can be modified so long as these critical motifs and the distance between them are intact (56). Thus, we hypothesized that the regions immediately after the TATA box would be amendable for barcode incorporation. To generate the Tuba-seqUltra vector, we replaced the human U6 promoter in the previously described Lenti-sgRNA/Cre vector (13) with a gBlock (Integrated DNA Technologies, IA) synthesized bovine U6 (bU6) promoter via Gibson assembly. The bU6 promoter allows effective sgRNA expression and expands the potential barcode space from 15 nucleotides in human U6 to up to 23 nucleotides, providing a maximum of 423 potential barcode diversity. In our design, the last 3 nucleotides in the bU6 vector were left unchanged to serve as sticky ends to clone sgRNAs. We included fixed nucleotides in the barcode region to distinguish between different Tuba-seqUltra libraries.
To barcode the Tuba-seqUltra vector, it was linearized by PCR using high fidelity Q5 polymerase (NEB, MO0492L) with primers flanking the U6-barcode-sgRNA region. Forward primer: 5’ GTTTAAGAGCTAAGCTGGAAACA 3’. Reverse primer: 5’ AACTATATAAAGCTAAGAATAGAAAAAATTTTACAGTTATGGT 3’. The PCR product was then treated with DpnI restriction endonuclease (NEB, R0176S) to digest the original vector thereby reducing background bacterial colonies. This linearized backbone was purified using Qiagen PCR purification with QIAquick Mini Spin columns following the manufacturer’s protocol (Qiagen, #28106). Barcoding primers were synthesized by Stanford Protein and Nucleic Acid Facility (Stanford, CA) as a ~100 nucleotide single stranded sequence with the following format: actgtaaaattttttctattcttagctttatatagttNNNNNNNNNNNNNNNNNatgggagttctgcctcaagcaagtgtttaagagctaagctggaaac The Ns in the primer denote the degenerate sequences that serve as barcodes. This primer consists of homology regions with the Tuba-seqUltra vector backbone (lower case sequences) and two Esp3I sites in opposite orientation for sgRNA library insertion. Gibson assembly was performed to anneal the barcoding primer with the purified linearized Tuba-seqUltra vector using NEBuilder HiFi DNA Assembly Master Mix (NEB, ES2621L) with 150 ng/μL of vector and 1 μL of 10 uM barcoding primer per 20 μL reaction at 50 °C for 4 hours. The assembled product was purified with standard isopropanol precipitation protocol and re-suspended in TE. The resuspended barcoded vector was electroporated into 10-beta electrocompetent E. coli (NEB, C3020K) following manufacturer’s protocol. The bacteria colonies were pooled, and the plasmids were extracted using Qiagen Plasmid Plus Midi-prep kit (Qiagen, 12941). Depending on the library size ~ 150,000 – 2,000,000 colonies were pooled per library.
sgRNA design, synthesis and cloning of Lenti-Tuba-seqUltra library
sgRNAs in the Lenti-U6BCsgRNAEpigenomics/Cre and Lenti-U6BCsgRNASaturation/Cre library were primarily taken from the Brie mouse CRISPR libraries. The sequences were accessed from Addgene (https://www.addgene.org/pooled-library/broadgpp-mouse-knockout-brie/). For each gene, we selected the first three sgRNAs. Non-targeting sgRNAs (sgNT) were taken from Cai et al., 2021 (13). Safe targeting sgRNAs (sgSafes) were taken from Bassik Mouse CRISPR Knockout Library accessed from Addgene (https://www.addgene.org/pooled-library/bassik-mouse-crispr-knockout/). The sgSafes target regions of the genome that do not have known functions. They were included as controls to account for potential genotoxic effects from genome editing, which may influence cell growth phenotypes. For complete sequence of sgRNAs in each library, see Supplemental Tables 2, 8, and 28.
Each sgRNA library was synthesized on oligo chips (Agilent Technologies, CA, or Twist Biosciences, CA) in the format TAAGGTGCGTACTAGCTGACCGTCTCTatggXXXXXXXXXXXXXXXXXXXXgtttAGAGACGGCGCCTACACACCTATCTAA Upper case sequences denote PCR handles for amplifying the oligo libraries, lower case sequence denote Esp3I restriction site overhangs and Xs denote sgRNA sequences. The synthesized sgRNA library is PCR amplified with Q5 polymerase (NEB, MO0492L) for 11–12 cycles using the following primers. Forward primer: 5’ TAAGGTGCGTACTAGCTGAC 3’. Reverse primer: 5’ TTAGATAGGTGTGTAGGCGC 3’. The amplified sgRNA library was purified with QIAquick Mini Spin columns (Qiagen, #28106) following manufacturer’s protocol.
The barcoded Tuba-seqUltra vector was digested with BsmBI-v2 (NEB R0379L) for 2 hours at 55°C and purified with QIAquick Mini Spin columns (Qiagen, #28106) following the manufacturer’s protocol. Golden Gate assembly was used to ligate the PCR amplified sgRNA library with the barcoded Tuba-seqUltra vector. The molar ratio of insert (sgRNA library) to backbone (barcoded vector) was approximately 2:1. The Golden Gate assembly mix included 10X T4 Ligase buffer (NEB, B0202S), T4 DNA ligase (NEB, M0202S), Esp3I (NEB, R0734S), and molecular grade water (Cytiva, SH30538). The reaction was set up overnight for 70 cycles (37°C, 5 min → 20°C, 5 min). The assembled product was purified with isopropanol precipitation following standard protocol and electroporated into 10-beta electrocompetent E. coli (NEB, C3020K) as described by the manufacturer. The bacterial colonies were pooled (up to 10 million colonies for a library) and the plasmids were extracted via Qiagen Plasmid Plus Midi-prep kit (Qiagen, #12941) with endotoxin removal.
To check library integrity, barcode diversity and sgRNA representation, the U6-barcode-sgRNA region of the plasmid library was PCR amplified using primers compatible with Illumina sequencing (Illumina, CA). Forward primer: AATGATACGGCGACCACCGAGATCTACACxxxxxxxxxACACTCTTTCCCTACACGACGCTCTTCCGATCTNNNNNNNAGGGTTACAGTTTAGTCACCATA Reverse primer: CAAGCAGAAGACGGCATACGAGxxxxxxxxGTGACTGGAGTTCAGACGTGTGCTCTTCCGATCTNNNNNNNNCGACTCGGTGCCACTTTTTC Ns denote degenerate nucleotides to increase read diversity at the beginning of the amplicon, which facilitate cluster identification. Xs denote the i5 and i7 indexes. The PCR amplified plasmid library was validated by deep sequencing on MiSeq-Nano (Illumina, CA) or Novaseq6000 (Illumina, CA).
Tuba-seqUltra library preparation
The aliquoted benchmark spike-in cell lines were added to the frozen whole lung tissue from each mouse. Thus, each frozen lung tissue had three independent benchmark spike-in cell lines. For experiments using Lenti-U6BCsgRNAEpigenomics/Cre and Lenti-U6BCsgRNASaturation/Cre libraries, 100,000 cells from each of the three spike-in cell lines were added to the lungs for a total of 300,0000 spike-in cells per mouse. For experiments involving the Lenti-U6BCsgRNAEpistasis/Cre library, 50,000 cells from each of the three spike-in cell lines were added to the lungs, for a total of 150,000 spike-in cells per mouse. Genomic DNA from whole tumor bearing lungs with the spike-in cells added were extracted as previously described (15). Briefly, the tissues were homogenized in 20 ml lysis buffer (100mM NaCl, 20mM Tris, 10mM EDTA, 0.5% SDS) with 200 μl of 20 mg/ml Proteinase K (Life Technologies, AM2544). Homogenized tissues were incubated at 55°C overnight. Genomic DNA was extracted with phenol-chloroform (ThermoFisher Scientific, 15593049) or the Qiagen Puregene Kit (Qiagen, 158063) and precipitated with ethanol.
Next generation sequencing libraries for experiments involving the Lenti-U6BCsgRNAEpigenomics/Cre library were prepared by amplifying the U6-barcode-sgRNA in a two-step nested PCR with NEBNext Ultra II Q5 Master Mix (NEB, M0544S). For each mouse, 32 μg of genomic DNA was first amplified with primers (forward: 5’ TCGATTAGTGAACGGATCGGC 3’, reverse: 5’ CGAACCTCATCACTCGTTGC 3’) for 15 cycles to enrich the U6-barcode-sgRNA region. The first PCR products were then amplified with Illumina sequencing compatible primers in the format described above for plasmid sequencing with unique dual i5 and i7 indexes for each sample (see sgRNA design, synthesis and cloning of Lenti-Tuba-seqUltra library) for 15 cycles using NEBNext Ultra II Q5 Master Mix. Library preparation for experiments involving the Lenti-U6BCsgRNASaturation/Cre and Lenti-U6BCsgRNAEpistasis/Cre vectors, 32 μg of genomic DNA from each mouse was amplified in a single step using the Illumina sequencing compatible primers for up to 35 PCR cycles. The final PCR products underwent double-sided purification (0.70X left side and 0.95X right side) using SPRIselect beads (BD Life Sciences, B23317) and were pooled. The purified libraries were quantified and checked for quality using Agilent TapeStation system (Agilent, CA).
Immunohistochemistry
Lung tissues fixed in 10% formalin were embedded in paraffin and sectioned by Stanford Pathology/Histology Service Center (Stanford, CA) or Histo-Tec Laboratories (Hayward, CA). Hematoxylin and eosin stains were performed by Stanford Pathology/Histology Service Center (Stanford, CA) or Histo-Tec Laboratories (Hayward, CA). Immunohistochemistry was performed on 4 μm sections. Antigen retrieval was performed with 10 mM citrate buffer in a pressurized decloaking chamber. The slides were washed with 1X PBST and prepared with VECTASTAINABC-HRP Kit (Vector Laboratories, PK-4000). Antibody dilutions were 1: 250 for NKX2.1 (Abcam, ab76013, RRID:AB_1310784), 1: 100 for p63 (Cell Signaling, 13109S, RRID:AB_2637091), 1: 200 for H3K14ac (Abcam, ab52946, RRID:AB_880442), 1: 1000 for H4K12ac (Abcam, ab177793, RRID:AB_2651187), and 1: 200 for H4K5ac (Abcam, ab51997, RRID:AB_2264109). Sections were developed with DAB (Vector Laboratories, SK-4100) and counterstained with hematoxylin.
Immunohistochemistry for human lung adenocarcinoma TMAs was performed by Stanford Pathology/Histology Service Center. The dilutions were 1: 100 for H3K14ac (Abcam, ab52946, RRID:AB_880442), 1: 200 for H4K12ac (Abcam, ab177793, RRID:AB_2651187), 1: 200 for H4K5ac (Abcam, ab51997, RRID:AB_2264109), and 1:100 for H3K36me3 (Cell Signaling, 4909, RRID:AB_1950412).
Western blotting
FACS-isolated cells neoplastic cells, human and mouse cell lines grown in vitro were lysed by RIPA buffer (Fisher Scientific, PI89900) supplemented with protease inhibitor cocktail (Millipore, 11836170001). Denatured samples were run on a 4%–12% Bis-Tris gradient gel (Thermo Scientific, NP0323BOX) and transferred onto PVDF membranes. Membranes were immunoblotted using primary antibodies at 1: 1000 for H3K14ac (Abcam, ab52946, RRID:AB_880442), 1: 2000 for H4K12ac (Abcam, ab177793, RRID:AB_2651187), and 1: 2000 for H4K5ac (Abcam, ab51997, RRID:AB_2264109), 1:750 for β-ACTIN (Cell Signaling, 4970, RRID:AB_10691808), 1:1000 for KAT7 (Proteintech, 13751–1-AP, RRID:AB_2266703), and 1:2000 for Histone 3 (Abcam, ab1791, RRID:AB_302613). Histone 3 staining was performed on membranes stripped with Restore PLUS Western Blot Stripping Buffer (ThermoFisher, 46430). HRP-conjugated goat-anti-rabbit antibody was used as the secondary antibody at 1:5000 dilution (Santa Cruz Biotechnology, sc-2004). Densitometry was performed using ImageJ2 (v 2.14.0).
Bulk ATAC-seq library preparation
Two separate ATAC-seq experiments were performed following the Omni-ATAC protocol as previously described (57). One experiment was on FACS sorted Lin−TdTomato+ neoplastic cells from KT;H11LSL-Cas9 mice transduced with sgKat7 (n=4) or sgSafe23 (n=4). The other ATAC-seq experiment was on FACS sorted Lin−TdTomato+ neoplastic cells from KT;H11LSL-Cas9 mice transduced with sgMeaf6 (n=3), sgKmt2a (n=3), sgPsip1 (n=3), sgSafe23 (n=3), or sgSafe14 (n = 1). Briefly, approximately 50,000 cells were washed once in PBS and resuspended in 50 μL ATAC-RSB-Lysis buffer (10 mM Tris-HCl pH 7.4, 10 mM NaCl, 3 mM MgCl2, 0.1% IGEPAL CA-630, 0.1% Tween-20, 0.01% Digitonin). The cells in lysis buffer were incubated on ice for 3 minutes. Then 1 mL ATAC-RSB-Wash buffer (10 mM Tris-HCl pH 7.4, 10 mM NaCl, 3 mM MgCl2, 0.1% Tween20, 0.01% Digitonin) was added, and the nuclei were centrifuged at 500 g for 5 min at 4 °C. To transpose the nuclei, a solution of 25 μL 2× TD buffer (20 mM Tris-HCl pH 7.6, 10 mM MgCl2, 20% Dimethyl Formamide), 2.5 μL Tn5 transposase (custom produced) and 22.5 μL nuclease-free H2O was added, followed by incubation for 30 minutes at 37 °C while agitating at 1000 RPM. The transposed DNA was isolated using the MinElute PCR Purification Kit (Qiagen, 28004/28006), and PCR amplified as previously described (72 °C for 3 minutes, 98 °C for 30 seconds, 10 cycles of 98 °C for 10 seconds, 63 °C for 30 seconds, 72 °C for 30 seconds). Libraries were purified using the Qiagen MinElute PCR Purification kit (Qiagen, 28004), then sequenced on an Illumina NextSeq 550 (Illumina, CA).
Cell culture and drug treatment
Murine KrasG12D; p53−/− lung adenocarcinoma cell lines were established ex vivo from individually dissected tumors in mouse. Three cell lines were used in this study, the KPTC and 802T4 cell lines were established by the Winslow Lab (Stanford, CA). The 802T4 cell line was previously published in Winslow et al., (2011) (44). KP787 cell line was a gift from David Feldser (University of Pennsylvania). All murine cell lines were maintained in DMEM (Gibco, 11965092) supplemented with 10% FBS and 1% Penn/Strep at 37°C in a humidified incubator with 5% CO2. Colony formation assay was performed by seeding KP787 cells in 12-well plates at 1,000 cells per well. The cells were treated with 1 μM KAT7 inhibitor WM3835 (Selleck Chemicals, S9805) dissolved in DMSO (Invitrogen, D12345) or 0.02% DMSO as vehicle control each day for 5 days. Each condition was performed in triplicates, and the experiment was repeated four times. At the end of the treatment, the cells were stained with crystal violet (Sigma, C0775) and imaged.
Image analysis was performed by manually counting the colonies on FIJI (v. 2.16), and colony sizes were quantified using the “Analyze Particles” function. Relative mean colony size was determined by dividing the mean colony area of the WM3835-treated group by the corresponding DMSO vehicle group for each experimental replicate. Statistical significance was determined by one-sample t-test, with the mean normalized to μ=1.
CUT&RUN library preparation
CUT&RUN experiments for KPTC and 802T4 cells were performed after briefly culturing the cells for 24–48 hours. For the KAT7 inhibition experiment, KP787 cells were seeded onto 10 cm plates and treated consecutively for 5 days with either 1 μM WM3835 or 0.02% DMSO as vehicle control. Cells were trypsinized and immediately processed for CUT&RUN using the CUTANA™ ChIC/CUT&RUN Kit (Epicypher, 14–1048) according to the manufacturer’s instructions. Cells were incubated overnight at 4°C with the following antibodies (1 μL per reaction): Rabbit IgG (Epicypher, 13–0042), CTCF (Epicypher, 13–2014), H3K4me3 (Epicypher, 13–0060), H4K12ac (Abcam, ab52946), KMT2A (Epicypher, 13–2004), and KAT7 (Cell Signaling, 58418S), along with E. coli spike-in DNA. Targeted chromatin digestion was performed by adding calcium chloride (CaCl2) to activate Protein A/G-MNase (pAG-MNase), followed by incubation at 4°C for 2 hours. After digestion, reactions were stopped, and DNA was purified using SPRIselect beads (Beckman Coulter, B23319). Library preparation was performed using the CUTANA™ CUT&RUN Library Prep Kit Primer Set 1 (Epicypher, 14–1001) for KPTC and 802T4 cells, and Primer Set 2 (Epicypher, 14–1002) for KP787 cells, according to the manufacturer’s instructions. Prepared libraries were sequenced using 150 bp paired-end sequencing on an Illumina NovaSeq X Plus.
Single-cell RNA-seq library preparation
Two separate scRNA-seq experiments were performed using the split-seq approach from Parse Biosciences. One experiment was on FACS sorted Lin−TdTomato+ neoplastic cells from KT;H11LSL-Cas9 mice transduced with Lenti-sgRNA/Cre vectors expressing sgKat7 (n=3), sgSafe23 (n=2), or sgSafe14 (n=1). The other scRNA-seq experiment was on FACS sorted Lin−TdTomato+ neoplastic cells from KT;H11LSL-Cas9 mice transduced with Lenti-sgRNA/Cre vectors expressing sgMeaf6 (n=3), sgKmt2a (n=3), sgPsip1 (n=3), or sgSafe14 (n=4). Immediately after FACS, the sorted neoplastic cells were fixed with Evercode Cell Fixation kit (Parse Biosciences, ECF2101). For the sgKat7 versus sgSafe14 experiment, the fixed cells were prepared using Evercode WT Mini v2 kit (Parse Biosciences, ECW02110) according to the manufacturer’s instructions. For the other scRNA-seq experiment, the fixed cells were prepared using Evercode WT v2 kit (Parse Biosciences, ECW02030) according to manufacturer’s instructions. The Parse Mini v2 kit generated two sub-libraries and the Parse WT v2 kit generated 8 sub-libraries. The sub-libraries were inspected by the Agilent TapeStation system (Agilent, CA) and sequenced by Illumina NovaSeq S4 flow cell.
Statistical Analysis
Western blot quantification
Western blots were performed on FACS-sorted Lin−TdTomato+ neoplastic cells from three independent mice for each protein target. Quantification was conducted using ImageJ (FIJI, v2.14) by selecting each lane and quantifying with the Analyze → Plot Lanes function. The data for the target band were normalized to β-ACTIN from the same lane. We hypothesized that inactivation of the HBO1 complex, a histone writer complex, would not increase the levels of target histone marks. Therefore, statistical significance was determined by one-sided Student’s t-test in R v4.4.1. Western blot analysis for human and mouse lung cancer cell lines was performed using the same tools. Statistical significance for human cell lines was determined by one-way ANOVA with post-hoc Dunnett’s test comparing the normalized H3K14ac intensity of each cell line to the normalized average intensity between the two human bronchial epithelial cell lines (HBEC3KT and HBEC30KT). Statistical significance for mouse cell lines was determined by Student’s t-test.
Single-cell RNA-seq data analysis
The FASTQ files were preprocessed with the data analysis pipeline from Parse Biosciences (split-pipe v1.0.3). Default settings were used for aligning to GRCm38/mm10 mouse reference genome. Each sub-library was processed individually using the command split-pipe-mode all, and the outputs were combined with the command split-pipe-mode combine. The metrics generated by the split-pipeline were used for Supplemental Table 21.
Gene expression analysis was performed using Scanpy (v1.9.3). Each genotype was analyzed separately with the sgSafe cells from the same experiment as the reference. Cells meeting the following criteria: 1) the number of genes expressed was less than 6000; 2) total read count was less than 40,000; and 3) the percent of mitochondria genes was less than 10% were included in the analysis. Scrublet was used to assign doublet scores with an expected doublet rate of 7.5%. Doublets detected by Scrublet were removed.
Read count normalization was performed with scanpy.pp.normalize_total using default parameters and log-transformed with scanpy.pp.log1p. Feature selection was performed with scanpy.pp.highly_variable_genes on the normalized and scaled data to identify highly variable genes with the parameters: min_mean=0.0125, max_mean=3, min_disp=0.5. The data was further filtered with scanpy.pp.regress_out by regressing out total read count and percent mitochondrial genes. Then each gene was scaled to unit variance and values exceeding 10 standard deviations were clipped. UMAP embedding with Leiden clustering at resolutions between 0.5–1.5 was used to visualize the data.
Non-neoplastic cells were identified based on clustering patterns and expression of commonly accepted marker genes: Vim/Pdgfra/S100a4/Acta2 (mesenchymal cells), Ptprc/Ccr5 (lymphocytes), Mcam/Pcam1/Vcam1 (perivascular cells), and Cd34/Tek (endothelial cells). These cells were filtered from downstream analysis.
Assignment of genotype specific clusters on UMAP was guided by three general principles after visual inspection and calculation of the percent contribution of each sgRNA to a cell cluster. First, CRISPR-Cas9 mediated gene editing is not 100% efficient, thus some cells from mice transduced with gene-targeting sgRNA will be present in clusters of mice transduced with sgSafe vectors. Second, scRNA-seq captures a gradient of cell states including transitional states, and selecting cell clusters that are 100% of a genotype is overtly exclusionary. Third, different gene inactivation may have different effects on cell states and the transcriptome, therefore may require different cut-offs for cell cluster assignment. For sgKat7, cell clusters with more than 90% of cells from Lenti-sgKat7/Cre transduced mice were considered sgKat7 clusters, and the rest were sgSafe clusters. For sgMeaf6, cell clusters with more than 85% of cells from Lenti-sgMeaf6/Cre transduced mice were considered sgMeaf6 clusters, and the rest were sgSafe clusters. For sgKmt2a, cell clusters with more than 65% of cells from Lenti-sgKmt2a/Cre transduced mice were considered sgKmt2a clusters, and the rest were sgSafe clusters. For sgPsip1, the same cut-off as sgKmt2a was used.
Differential gene expression analysis was performed on log-transformed counts-per-million (CPM) normalized reads using the MAST hurdle model with a mixed-effects, incorporating random effects for individual mice to account for variation in gene expression associated with each sample, in accordance with current best practices (58). Differential expression analysis was also performed using the default Wilcoxon rank-sum test implemented in the scanpy.tl.rank_gene_groups function. All results are included in Supplemental Table 22. Genotype-specific cell clusters were compared to sgSafe clusters as the reference group. Genes with an absolute log2 fold change ≥ 0.14 and an FDR corrected p-value ≤ 0.05 were considered statistically significant.
Supplementary Material
STATEMENT OF SIGNIFICANCE.
Using a novel functional genomics method in vivo, we investigated epigenomic regulators in lung tumorigenesis. We discovered many novel genes that affect lung tumor growth. We show that the HBO1 and MLL1 complexes interact to suppress lung adenocarcinoma development. Our findings provide broad insights into the epigenomic regulatory landscape of lung cancer.
ACKNOWLEDGEMENTS
We thank the Stanford Shared FACS Facility for FACS related services, the Stanford Veterinary Service Center staff for animal care, and Stanford Protein and Nucleic Acidy Facility. We thank Sushama Varma from Stanford Pathology Department for preparing the TMA slides. We thank members of the Winslow and Petrov laboratories for experimental support. We thank Dr. Jacques Coté, Dr. Joseph Lipsick and Dr. Guiping Wang for helpful discussions on the project. Y.J.T was supported by a Canadian Institute of Health Research (CIHR) postdoctoral fellowship (MFE-176568). H.X was supported by a Tobacco-Related Disease Research Program (TRDRP) fellowship (T34FT8013). J.D.H was supported by an American Cancer Society postdoctoral fellowship (PF-21-112-01-MM) and a TRDRP fellowship (T31FT1619). S.K was supported by National Cancer Institute’s F99/K00 CA234962. E.G.S is supported by a TRDRP predoctoral fellowship (T33DT6556). D.N.D was supported by the National Cancer Institute Predoctoral to Postdoctoral Fellow Transition Award (K00-CA245784). E.L.A. was supported by the HHMI Gilliam Fellowship for Advanced Study (GT14928) and a National Cancer Institute Predoctoral to Postdoctoral Fellow Transition Award (F99CA284289). P.A.R was supported by the National Science Foundation Graduate Research Fellowship Program (DGE-2146755) and the Stanford Graduate Fellowship. G.B was supported by the National Research, Development and Innovation Office (RRF-2.3.1-21-2022-00006) and by the HUN-REN Welcome Home and Foreign Researcher Recruitment Program. M.v.R was supported by the D.K. Ludwig Fund for Cancer Research. This work was supported by R01-CA234349 (to D.A.P and M.M.W), R01-CA230025 (to M.M.W), and in part by the Stanford Cancer institute support grant (NIH P30-1147CA124435).
Footnotes
Conflict of Interest Statement
M.M.W and D.A.P are founders and hold equity in Guide Oncology. The other authors declare no competing interest.
Data and code availability
All Tuba-seqUltra datasets will be made publicly available through the NCBI’s Sequence Read Archive Database and accession numbers will be provided prior to publication of the manuscript. Tuba-seqUltra data can be accessed from NCBI GEO database with the following accession numbers: GSE303745 (Lenti-U6BCsgRNAEpigenomics/Cre library), GSE303746 (Lenti-U6BCsgRNASaturation/Cre library) and GSE303387 (Lenti-U6BCsgRNAEpistasis/Cre library). Other NGS data can be accessed with accession numbers: GSE282851 for scRNA-seq, GSE281967 for ATAC-seq, GSE303178, GSE303263, GSE303264 for CUT&RUN, and GSE302345, GSE302346 for bulk RNA-seq. The code used for data analysis can be accessed from https://github.com/JasperXuEvolution/Ultra_Seq and https://github.com/yjtang-winslowLab/Ultra_Seq.
Additional methods and analysis details are included in the Supplemental Methods and Analysis.
REFERENCES
- 1.Hanahan D Hallmarks of Cancer: New Dimensions. Cancer Discov 2022;12(1):31–46 doi 10.1158/2159-8290.CD-21-1059. [DOI] [PubMed] [Google Scholar]
- 2.Struhl K The distinction between epigenetics and epigenomics. Trends Genet 2024;40(12):995–7 doi 10.1016/j.tig.2024.10.002. [DOI] [PMC free article] [PubMed] [Google Scholar]
- 3.Liang WW, Lu RJ, Jayasinghe RG, Foltz SM, Porta-Pardo E, Geffen Y, et al. Integrative multi-omic cancer profiling reveals DNA methylation patterns associated with therapeutic vulnerability and cell-of-origin. Cancer Cell 2023;41(9):1567–85 e7 doi 10.1016/j.ccell.2023.07.013. [DOI] [PMC free article] [PubMed] [Google Scholar]
- 4.Corces MR, Granja JM, Shams S, Louie BH, Seoane JA, Zhou W, et al. The chromatin accessibility landscape of primary human cancers. Science 2018;362(6413) doi 10.1126/science.aav1898. [DOI] [Google Scholar]
- 5.Geffen Y, Anand S, Akiyama Y, Yaron TM, Song Y, Johnson JL, et al. Pan-cancer analysis of post-translational modifications reveals shared patterns of protein regulation. Cell 2023;186(18):3945–67 e26 doi 10.1016/j.cell.2023.07.013. [DOI] [PMC free article] [PubMed] [Google Scholar]
- 6.Cenik BK, Shilatifard A. COMPASS and SWI/SNF complexes in development and disease. Nat Rev Genet 2021;22(1):38–58 doi 10.1038/s41576-020-0278-0. [DOI] [PubMed] [Google Scholar]
- 7.Yokoyama A, Niida H, Kutateladze TG, Cote J. HBO1, a MYSTerious KAT and its links to cancer. Biochim Biophys Acta Gene Regul Mech 2024;1867(3):195045 doi 10.1016/j.bbagrm.2024.195045. [DOI] [PMC free article] [PubMed] [Google Scholar]
- 8.Tang YJ, Shuldiner EG, Karmakar S, Winslow MM. High-Throughput Identification, Modeling, and Analysis of Cancer Driver Genes In Vivo. Cold Spring Harb Perspect Med 2023;13(7) doi 10.1101/cshperspect.a041382. [DOI] [Google Scholar]
- 9.LaFave LM, Kartha VK, Ma S, Meli K, Del Priore I, Lareau C, et al. Epigenomic State Transitions Characterize Tumor Progression in Mouse Lung Adenocarcinoma. Cancer Cell 2020;38(2):212–28 e13 doi 10.1016/j.ccell.2020.06.006. [DOI] [PMC free article] [PubMed] [Google Scholar]
- 10.Walter DM, Venancio OS, Buza EL, Tobias JW, Deshpande C, Gudiel AA, et al. Systematic In Vivo Inactivation of Chromatin-Regulating Enzymes Identifies Setd2 as a Potent Tumor Suppressor in Lung Adenocarcinoma. Cancer Res 2017;77(7):1719–29 doi 10.1158/0008-5472.CAN-16-2159. [DOI] [PMC free article] [PubMed] [Google Scholar]
- 11.Concepcion CP, Ma S, LaFave LM, Bhutkar A, Liu M, DeAngelo LP, et al. Smarca4 Inactivation Promotes Lineage-Specific Transformation and Early Metastatic Features in the Lung. Cancer Discov 2022;12(2):562–85 doi 10.1158/2159-8290.CD-21-0248. [DOI] [PMC free article] [PubMed] [Google Scholar]
- 12.Langille E, Al-Zahrani KN, Ma Z, Liang M, Uuskula-Reimand L, Espin R, et al. Loss of Epigenetic Regulation Disrupts Lineage Integrity, Induces Aberrant Alveogenesis, and Promotes Breast Cancer. Cancer Discov 2022;12(12):2930–53 doi 10.1158/2159-8290.CD-21-0865. [DOI] [PMC free article] [PubMed] [Google Scholar]
- 13.Cai H, Chew SK, Li C, Tsai MK, Andrejka L, Murray CW, et al. A Functional Taxonomy of Tumor Suppression in Oncogenic KRAS-Driven Lung Cancer. Cancer Discov 2021;11(7):1754–73 doi 10.1158/2159-8290.CD-20-1325. [DOI] [PMC free article] [PubMed] [Google Scholar]
- 14.Wang G, Chow RD, Ye L, Guzman CD, Dai X, Dong MB, et al. Mapping a functional cancer genome atlas of tumor suppressors in mouse liver using AAV-CRISPR-mediated direct in vivo screening. Sci Adv 2018;4(2):eaao5508 doi 10.1126/sciadv.aao5508. [DOI] [PMC free article] [PubMed] [Google Scholar]
- 15.Rogers ZN, McFarland CD, Winters IP, Naranjo S, Chuang CH, Petrov D, et al. A quantitative and multiplexed approach to uncover the fitness landscape of tumor suppression in vivo. Nat Methods 2017;14(7):737–42 doi 10.1038/nmeth.4297. [DOI] [PMC free article] [PubMed] [Google Scholar]
- 16.Hill AJ, McFaline-Figueroa JL, Starita LM, Gasperini MJ, Matreyek KA, Packer J, et al. On the design of CRISPR-based single-cell molecular screens. Nat Methods 2018;15(4):271–4 doi 10.1038/nmeth.4604. [DOI] [PMC free article] [PubMed] [Google Scholar]
- 17.Hegde M, Strand C, Hanna RE, Doench JG. Uncoupling of sgRNAs from their associated barcodes during PCR amplification of combinatorial CRISPR screens. PLoS One 2018;13(5):e0197547 doi 10.1371/journal.pone.0197547. [DOI] [PMC free article] [PubMed] [Google Scholar]
- 18.Hebert JD, Tang YJ, Szamecz M, Andrejka L, Lopez SS, Petrov DA, et al. Combinatorial In Vivo Genome Editing Identifies Widespread Epistasis and an Accessible Fitness Landscape During Lung Tumorigenesis. Mol Biol Evol 2025;42(2) doi 10.1093/molbev/msaf023. [DOI] [Google Scholar]
- 19.Hebert JD, Xu H, Tang YJ, Ruiz PA, Detrick CR, Wang J, et al. Efficient and multiplexed somatic genome editing with Cas12a mice. Nat Biomed Eng 2025. doi 10.1038/s41551-025-01407-7. [DOI] [Google Scholar]
- 20.Singh Nanda J, Kumar R, Raghava GP. dbEM: A database of epigenetic modifiers curated from cancerous and normal genomes. Sci Rep 2016;6:19340 doi 10.1038/srep19340. [DOI] [PMC free article] [PubMed] [Google Scholar]
- 21.Ru B, Sun J, Tong Y, Wong CN, Chandra A, Tang ATS, et al. CR2Cancer: a database for chromatin regulators in human cancer. Nucleic Acids Res 2018;46(D1):D918–D24 doi 10.1093/nar/gkx877. [DOI] [PMC free article] [PubMed] [Google Scholar]
- 22.Chuang CH, Greenside PG, Rogers ZN, Brady JJ, Yang D, Ma RK, et al. Molecular definition of a metastatic lung cancer state reveals a targetable CD109-Janus kinase-Stat axis. Nat Med 2017;23(3):291–300 doi 10.1038/nm.4285. [DOI] [PMC free article] [PubMed] [Google Scholar]
- 23.Hwang JW, Cho Y, Bae GU, Kim SN, Kim YK. Protein arginine methyltransferases: promising targets for cancer therapy. Exp Mol Med 2021;53(5):788–808 doi 10.1038/s12276-021-00613-y. [DOI] [PMC free article] [PubMed] [Google Scholar]
- 24.Duan R, Du W, Guo W. EZH2: a novel target for cancer treatment. J Hematol Oncol 2020;13(1):104 doi 10.1186/s13045-020-00937-8. [DOI] [PMC free article] [PubMed] [Google Scholar]
- 25.Kueh AJ, Bergamasco MI, Quaglieri A, Phipson B, Li-Wai-Suen CSN, Lonnstedt IM, et al. Stem cell plasticity, acetylation of H3K14, and de novo gene activation rely on KAT7. Cell Rep 2023;42(1):111980 doi 10.1016/j.celrep.2022.111980. [DOI] [PubMed] [Google Scholar]
- 26.Suter MA, Chen A, Burdine MS, Choudhury M, Harris RA, Lane RH, et al. A maternal high-fat diet modulates fetal SIRT1 histone and protein deacetylase activity in nonhuman primates. FASEB J 2012;26(12):5106–14 doi 10.1096/fj.12-212878. [DOI] [PMC free article] [PubMed] [Google Scholar]
- 27.Wang H, Cai H, Wang X, Zhang M, Liu B, Chen Z, et al. HDAC3 maintains oocyte meiosis arrest by repressing amphiregulin expression before the LH surge. Nat Commun 2019;10(1):5719 doi 10.1038/s41467-019-13671-8. [DOI] [PMC free article] [PubMed] [Google Scholar]
- 28.Wang H, Helin K. Roles of H3K4 methylation in biology and disease. Trends Cell Biol 2025;35(2):115–28 doi 10.1016/j.tcb.2024.06.001. [DOI] [PubMed] [Google Scholar]
- 29.Avvakumov N, Cote J. The MYST family of histone acetyltransferases and their intimate links to cancer. Oncogene 2007;26(37):5395–407 doi 10.1038/sj.onc.1210608. [DOI] [PubMed] [Google Scholar]
- 30.MacPherson L, Anokye J, Yeung MM, Lam EYN, Chan YC, Weng CF, et al. HBO1 is required for the maintenance of leukaemia stem cells. Nature 2020;577(7789):266–70 doi 10.1038/s41586-019-1835-6. [DOI] [PubMed] [Google Scholar]
- 31.Doyon Y, Cayrou C, Ullah M, Landry AJ, Cote V, Selleck W, et al. ING tumor suppressor proteins are critical regulators of chromatin acetylation required for genome expression and perpetuation. Mol Cell 2006;21(1):51–64 doi 10.1016/j.molcel.2005.12.007. [DOI] [PubMed] [Google Scholar]
- 32.Gao J, Aksoy BA, Dogrusoz U, Dresdner G, Gross B, Sumer SO, et al. Integrative analysis of complex cancer genomics and clinical profiles using the cBioPortal. Sci Signal 2013;6(269):pl1 doi 10.1126/scisignal.2004088. [DOI] [PMC free article] [PubMed] [Google Scholar]
- 33.Kazanets A, Shorstova T, Hilmi K, Marques M, Witcher M. Epigenetic silencing of tumor suppressor genes: Paradigms, puzzles, and potential. Biochim Biophys Acta 2016;1865(2):275–88 doi 10.1016/j.bbcan.2016.04.001. [DOI] [PubMed] [Google Scholar]
- 34.Raz DJ, He B, Rosell R, Jablons DM. Bronchioloalveolar carcinoma: a review. Clin Lung Cancer 2006;7(5):313–22 doi 10.3816/CLC.2006.n.012. [DOI] [PubMed] [Google Scholar]
- 35.Herriges M, Morrisey EE. Lung development: orchestrating the generation and regeneration of a complex organ. Development 2014;141(3):502–13 doi 10.1242/dev.098186. [DOI] [PMC free article] [PubMed] [Google Scholar]
- 36.Xiao Y, Yin C, Wang Y, Lv H, Wang W, Huang Y, et al. FBXW7 deletion contributes to lung tumor development and confers resistance to gefitinib therapy. Mol Oncol 2018;12(6):883–95 doi 10.1002/1878-0261.12200. [DOI] [PMC free article] [PubMed] [Google Scholar]
- 37.Kidger AM, Saville MK, Rushworth LK, Davidson J, Stellzig J, Ono M, et al. Suppression of mutant Kirsten-RAS (KRAS(G12D))-driven pancreatic carcinogenesis by dual-specificity MAP kinase phosphatases 5 and 6. Oncogene 2022;41(20):2811–23 doi 10.1038/s41388-022-02302-0. [DOI] [PMC free article] [PubMed] [Google Scholar]
- 38.McConnell BB, Yang VW. Mammalian Kruppel-like factors in health and diseases. Physiol Rev 2010;90(4):1337–81 doi 10.1152/physrev.00058.2009. [DOI] [PMC free article] [PubMed] [Google Scholar]
- 39.Zhong Z, Jiao Z, Yu FX. The Hippo signaling pathway in development and regeneration. Cell Rep 2024;43(3):113926 doi 10.1016/j.celrep.2024.113926. [DOI] [PubMed] [Google Scholar]
- 40.Grant ZL, Hickey PF, Abeysekera W, Whitehead L, Lewis SM, Symons RCA, et al. The histone acetyltransferase HBO1 promotes efficient tip cell sprouting during angiogenesis. Development 2021;148(20) doi 10.1242/dev.199581. [DOI] [Google Scholar]
- 41.Tsherniak A, Vazquez F, Montgomery PG, Weir BA, Kryukov G, Cowley GS, et al. Defining a Cancer Dependency Map. Cell 2017;170(3):564–76 e16 doi 10.1016/j.cell.2017.06.010. [DOI] [PMC free article] [PubMed] [Google Scholar]
- 42.Ashkin EL, Tang YJ, Xu H, Hung KL, Belk JA, Cai H, et al. A STAG2-PAXIP1/PAGR1 axis suppresses lung tumorigenesis. J Exp Med 2025;222(1) doi 10.1084/jem.20240765. [DOI] [Google Scholar]
- 43.Murray CW, Brady JJ, Han M, Cai H, Tsai MK, Pierce SE, et al. LKB1 drives stasis and C/EBP-mediated reprogramming to an alveolar type II fate in lung cancer. Nat Commun 2022;13(1):1090 doi 10.1038/s41467-022-28619-8. [DOI] [PMC free article] [PubMed] [Google Scholar]
- 44.Winslow MM, Dayton TL, Verhaak RG, Kim-Kiselak C, Snyder EL, Feldser DM, et al. Suppression of lung adenocarcinoma progression by Nkx2-1. Nature 2011;473(7345):101–4 doi 10.1038/nature09881. [DOI] [PMC free article] [PubMed] [Google Scholar]
- 45.Burdziak C, Alonso-Curbelo D, Walle T, Reyes J, Barriga FM, Haviv D, et al. Epigenetic plasticity cooperates with cell-cell interactions to direct pancreatic tumorigenesis. Science 2023;380(6645):eadd5327 doi 10.1126/science.add5327. [DOI] [PMC free article] [PubMed] [Google Scholar]
- 46.Sapountzi V, Cote J. MYST-family histone acetyltransferases: beyond chromatin. Cell Mol Life Sci 2011;68(7):1147–56 doi 10.1007/s00018-010-0599-9. [DOI] [PMC free article] [PubMed] [Google Scholar]
- 47.Jiang H The complex activities of the SET1/MLL complex core subunits in development and disease. Biochim Biophys Acta Gene Regul Mech 2020;1863(7):194560 doi 10.1016/j.bbagrm.2020.194560. [DOI] [PMC free article] [PubMed] [Google Scholar]
- 48.Freire PR, Cutler JA, Armstrong SA. Therapeutic Targeting of the Menin–KMT2A Interaction. Annual Review of Cancer Biology 2024;8(Volume 8, 2024):291–307 doi 10.1146/annurev-cancerbio-062822-021934. [DOI] [Google Scholar]
- 49.Ali A, Tyagi S. Diverse roles of WDR5-RbBP5-ASH2L-DPY30 (WRAD) complex in the functions of the SET1 histone methyltransferase family. J Biosci 2017;42(1):155–9 doi 10.1007/s12038-017-9666-9. [DOI] [PubMed] [Google Scholar]
- 50.Gaurav N, Kanai A, Lachance C, Cox KL, Liu J, Grzybowski AT, et al. Guiding the HBO1 complex function through the JADE subunit. Nat Struct Mol Biol 2024. doi 10.1038/s41594-024-01245-2. [DOI] [Google Scholar]
- 51.Hung T, Binda O, Champagne KS, Kuo AJ, Johnson K, Chang HY, et al. ING4 mediates crosstalk between histone H3 K4 trimethylation and H3 acetylation to attenuate cellular transformation. Mol Cell 2009;33(2):248–56 doi 10.1016/j.molcel.2008.12.016. [DOI] [PMC free article] [PubMed] [Google Scholar]
- 52.Nakanishi S, Sanderson BW, Delventhal KM, Bradford WD, Staehling-Hampton K, Shilatifard A. A comprehensive library of histone mutants identifies nucleosomal residues required for H3K4 methylation. Nat Struct Mol Biol 2008;15(8):881–8 doi 10.1038/nsmb.1454. [DOI] [PMC free article] [PubMed] [Google Scholar]
- 53.Michmerhuizen NL, Heikamp EB, Iacobucci I, Umeda M, Arthur B, Mishra V, et al. KAT6A and KAT7 Histone Acetyltransferase Complexes Are Molecular Dependencies and Therapeutic Targets in NUP98-Rearranged Acute Myeloid Leukemia. Cancer Discov 2025. doi 10.1158/2159-8290.CD-24-1772. [DOI] [Google Scholar]
- 54.Fang Y, Liao G, Yu B. LSD1/KDM1A inhibitors in clinical trials: advances and prospects. J Hematol Oncol 2019;12(1):129 doi 10.1186/s13045-019-0811-9. [DOI] [PMC free article] [PubMed] [Google Scholar]
- 55.Mukohara T, Park YH, Sommerhalder D, Yonemori K, Hamilton E, Kim SB, et al. Inhibition of lysine acetyltransferase KAT6 in ER(+)HER2(−) metastatic breast cancer: a phase 1 trial. Nat Med 2024. doi 10.1038/s41591-024-03060-0. [DOI] [Google Scholar]
- 56.Ventura A, Meissner A, Dillon CP, McManus M, Sharp PA, Van Parijs L, et al. Cre-lox-regulated conditional RNA interference from transgenes. Proc Natl Acad Sci U S A 2004;101(28):10380–5 doi 10.1073/pnas.0403954101. [DOI] [PMC free article] [PubMed] [Google Scholar]
- 57.Corces MR, Trevino AE, Hamilton EG, Greenside PG, Sinnott-Armstrong NA, Vesuna S, et al. An improved ATAC-seq protocol reduces background and enables interrogation of frozen tissues. Nat Methods 2017;14(10):959–62 doi 10.1038/nmeth.4396. [DOI] [PMC free article] [PubMed] [Google Scholar]
Associated Data
This section collects any data citations, data availability statements, or supplementary materials included in this article.
Supplementary Materials
Data Availability Statement
All Tuba-seqUltra datasets will be made publicly available through the NCBI’s Sequence Read Archive Database and accession numbers will be provided prior to publication of the manuscript. Tuba-seqUltra data can be accessed from NCBI GEO database with the following accession numbers: GSE303745 (Lenti-U6BCsgRNAEpigenomics/Cre library), GSE303746 (Lenti-U6BCsgRNASaturation/Cre library) and GSE303387 (Lenti-U6BCsgRNAEpistasis/Cre library). Other NGS data can be accessed with accession numbers: GSE282851 for scRNA-seq, GSE281967 for ATAC-seq, GSE303178, GSE303263, GSE303264 for CUT&RUN, and GSE302345, GSE302346 for bulk RNA-seq. The code used for data analysis can be accessed from https://github.com/JasperXuEvolution/Ultra_Seq and https://github.com/yjtang-winslowLab/Ultra_Seq.
Additional methods and analysis details are included in the Supplemental Methods and Analysis.