

Abstract
The authors of this paper present a novel synthesis method for piezoelectric systems based on the Cauer’s method. The presented synthesis method opens new possibilities for the design of active damping systems using stacks of piezoelectric transducers with different geometric parameters or material properties, where each transducer in the stack is responsible for damping the next resonant frequency. The paper presents mathematical algorithms that have been used to synthesise models of piezoelectric systems, as well as an analytical method for verifying the generated models. A computer application for automating the calculations was also prepared, as well as a series of experimental tests on real piezoelectric systems. The authors carried out an analysis of the obtained results and based on this, determined the capabilities of the prepared synthesis method, as well as made proposals for its further development.
Keywords: Piezoelectricity, Synthesis, Analysis, Modelling
Subject terms: Mechanical engineering, Electrical and electronic engineering
Introduction
Intensive vibrations that occur during the operation of technical equipment are a common result of various factors, such as excessive tolerances in manufactured components and inadequately mounted or over stiffened structures1–3. Vibrations can also result from turbulence generated by moving machine parts coming into contact with various working media4. They can also be propagated through rigid structural supports and foundations5–7. Various equipment, such as controllers or optical sensors can be sensitive to this type of disturbance. Vibrations can also be harmful to workers under continuous or frequent exposure8. As a preventive measure, various types of passive and active damping methods have been developed to mitigate them1,4,6,8–13. Passive methods reduce vibrations by applying three basic principles: elimination of potential sources at the design stage, mitigation of negative effects of accumulated imperfections by fine tuning and dissipation of remaining kinetic energy by cushioning the equipment with damping materials.
The first and second principle can be considered good engineering practice. The third principle covers methods using different types of materials to absorb or dissipate kinetic energy originating from vibrating components.
However, passive methods have practical limitations. At high vibration intensities, it may not be possible to apply a sufficiently thick layer of damping material due to design limitations or excessive material costs. The concept of active damping systems has been developed to address those issues. Active damping systems draw energy from external sources to actively counteract internal oscillations14. Examples of such systems are components which dynamically regulate damping by stimulating magnetic or electro-rheological fluids, adjusting their viscosity with magnetic or electric fields of changing intensity15. The advantages of active systems include reduced space requirements and the ability to dynamically adapt the damping characteristics to the prevailing conditions. Piezoelectric components offer substantial miniaturization of devices by facilitating direct transduction between mechanical and electrical energy within the intrinsic structure of the material. Systems using piezoelectric materials also have an ability to stack several plates to increase the resultant displacement of an entire module.
Owing to the intricate multidimensional interactions between electric fields and mechanical stresses, a wide array of mathematical modelling techniques have been employed to analyse piezoelectric components. Lumped-parameter models have been used to characterize the dynamic behaviour of piezoelectric transducers through capacitors, inductors, and resistors. Among the various modelling approaches, the Maxwell model, adopted by researchers such as Goldfarb and Celanovic16,17 has been particularly prominent for capturing hysteresis behaviour. Additionally, Adriaens et al.18 have explored hybrid methodologies that integrate electrical and mechanical components from both domains to enhance the representation of damping effects associated with energy dissipation in piezoelectric materials. Finite element method (FEM) analysis has also been utilised in efforts to determine the material coefficients of piezoelectric systems, as demonstrated in the study by Lahmer et al.19 There are also studies which combine the use of electrical/mechanical analogies with FEM for faster prototyping and verification of model parameters. Gosiewski and Koszewnik in their work20 use this method to find quasi optimal locations of piezo stacks in the dampened structure and use an algorithm based on PD controllers to regulate the piezoelectric damping effect. An article21 written by Wu et al. describes the use of a novel optimisation algorithm to optimise the parameters of components in a shunt piezoelectric damping circuit. The authors use the algorithm to fine tune the parameters of attached electrical circuits to regulate the damping of piezoelectric components. Darleux, Lossouarn and Deü in their work22 push the concept further by coupling more complex structures to the electric network, introducing non-periodicities in the form of local masses and changing structure thicknesses. There are also studies based on the use of micromechanical modelling, like the article made by Nada Tassi et al.23 where the authors have tried using this method to model the behaviour of piezoelectric components under large deformation and high electric field.
Studies presented in 20–22 focus on utilising mathematical methods to develop circuits and algorithms which are aimed to optimise and supplement the functionality of existing and predefined piezoelectric transducers in different conditions they are placed in. Methods presented in 19,23 focus on the analysis of different model configurations and providing data on the model behaviour depending on the input information. While these methods provide a reliable framework for prototyping new systems, they require substantial prior knowledge regarding the initial conditions. Notably, there remains a research gap in the domain of comprehensive piezoelectric system synthesis, particularly when many of the initial parameters are undefined or unavailable.
The proposed synthesis approach leverages established mechanical–electrical analogies and the lumped parameter modelling framework, as discussed in 16,17, and incorporates the Cauer algorithm24,25 to facilitate efficient design of new stacked piezoelectric systems, tailored for different predefined loads, based on limited information. These systems consist of plates with varying geometries and material characteristics, each influencing the resonant frequency of the individual elements. By combining plates with distinct properties, the resulting stack can produce enhanced deformations across multiple frequency bands, thereby broadening the functional range of conventional piezoelectric devices.
This paper contains a detailed comparison of results taken from the study on three different configurations of two piezoelectric transducers with results obtained from a program written based on the developed synthesis method.
The research presented in this study aims to address a key gap in the early-stage design of mechanisms incorporating piezoelectric transducers. By providing a framework for preliminary system synthesis, the proposed method facilitates the identification of baseline configurations of piezoelectric components. These initial configurations serve as a foundation for subsequent refinement using advanced modelling and optimization techniques established in the existing literature.
Methods
The developed synthesis method is based on the Cauer method24,25. This method consists in decomposing the transmission function of the system into a chain fraction. To obtain the initial equation, we must assume the existence of a system (an oscillating machine for example) where it is possible to determine its modal vibration frequencies in one of its axis by using carefully placed sensors. Then, at the system design stage, based on the obtained results it is possible to determine the values of the resonant and anti-resonant frequencies, forming a base set of frequencies:
 |
1 |
 |
2 |
 |
3 |
where:
 –full set of considered frequencies,
 –set of resonant frequencies,
 –set of anti-resonant frequencies.
The transfer function polynomial of the synthesised system is then formed on the basis of the set of frequencies (1), assuming a cascade system model with a rigid constraint at one end and the other end free. The transfer function of the synthesised system in product form therefore takes the shape:
 |
4 |
where:
 –system response,
 –complex variable,
 –scaling factor.
After substituting symbolic variables ω1 to ωn with real frequencies from the set Ω, multiplying all elements and summing up every component standing next to each power of the complex variable, we obtain an exponential form of the equation:
 |
5 |
where:
 –real components of the nominator,
 –real components of the denominator.
and a chain fraction is determined by recursively subtracting the remainder from the division of the coefficients that are to the highest power of the denominator and numerator:
 |
6 |
 |
7 |
 |
8 |
where:
 – fraction of the coefficients of the greatest powers,
 –remainder of a rational function after reducing the fraction.
The coefficients of the chain fraction determined by Cauer’s method correspond to the lumped parameters (stiffness and mass) of the elements of the pre-synthesised mechanical cascade system. The infinite degree of freedom system obtained by this method is shown in Fig. 1.
Fig. 1.

A cascade system with an infinite number of degrees of freedom, consisting of inertial and elastic elements, with one side constrained.
Damping elements were added to the synthesised system, the parameters of which were determined using the Rayleigh method:
 |
9 |
where:
 –damping coefficient of the designated damping element,
 –lumped mass of the inertial element,
 –stiffness of the elastic element,
 –proportionality factor of damping to inertia,
 –proportionality factor of damping to stiffness.
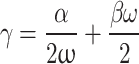
Only systems with subcritical damping (γ < 1) were considered26,27 and it was also assumed that the component of damping proportional to inertia ‘α’ is negligibly small for oscillations of piezoelectric systems. Using the relations for critical damping factor:
 |
10 |
 |
11 |
and assuming that α ≈ 0, a simplified form of Eq. (11) was obtained:
 |
12 |
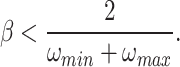
The damping factor proportional to stiffness could now be calculated from Eq. (12). For systems with more than one degree of freedom, each segment will have an individual critical damping factor ‘γ’. Therefore, for systems with a larger number of degrees of freedom, the global limits of the critical damping coefficient were determined from the system of equations:
 |
13 |
This means that there cannot be a segment in the system with critical or supercritical damping. The disadvantage of this solution is that the damping ratio has to be reduced for other segments oscillating at lower resonant frequencies. Knowing that both γmin and γmax have to be equal to less than 1 and substituting that to relation (13), the formula for the global proportionality coefficient for elastic components was determined
 |
14 |
After substituting the proportionality coefficient ‘β’ obtained in (14) into Eq. (9) and assuming that α ≈ 0, the damping values of each segment of the cascade system were determined. In addition, the interactions with the electrical part of the piezoelectric system were modelled as electromotive forces, denoted by the symbol ‘Gx’, and applied to each segment of the mechanical system. The modified system takes the form shown in Fig. 2. It is restrained on one side, while a harmonic force corresponding to the ambient vibrations is applied on the other side.
Fig. 2.

Modified cascade system with an infinite number of degrees of freedom, prepared for conversion to an electromechanical system.
The model was transformed based on the properties of real piezoelectric transducers and the parameters were determined as in18 (Fig. 3). The symbolic electromotive force from Fig. 2 was expanded into an electrical circuit which is responsible for providing the force through electromechanical coupling marked as ‘N’. The real piezoelectric system is a three-dimensional object, which requires the identification of its geometric parameters in each axis.
Fig. 3.

Electromechanical model of a single piezoelectric transducer with specified operating parameters, excited by an external voltage and subjected to harmonic excitation.
In contrast, the model synthesised in this paper is a one-dimensional system, since only the main axis of interaction of the piezoelectric transducer is considered. In order to transform the parameters of the synthesised model into parameters of a real system, it was necessary to divide the synthesis method into two cases. In the first case it is assumed that the geometrical parameters of the synthesised system are known and the aim of the synthesis is to approximate the material properties. In the second case, the material properties are known (e.g. they are selected from a catalogue of existing piezoelectric transducers) and the aim of the synthesis is to determine the geometric dimensions of the individual transducers in the synthesised system. In order to approximate the actual parameters of the designed system on the basis of the synthesised model, the approximation Eqs. (15–20) are defined.
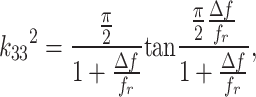
Based on the resonant and antiresonant frequency relation for each segment of the system, the value of the electromechanical coupling coefficient k33 is approximated:
 |
15 |
where:
 –resonant frequency of the segment,
 –difference between the resonant and antiresonant frequency.
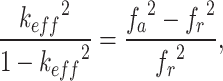
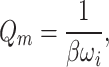
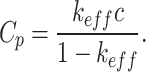
The effective coupling coefficient keff is also approximated from the equation:
 |
16 |
where:
 –antiresonant frequency of the segment.
The stiffness of the piezoelectric material is calculated using Hooke’s law and the properties determined during the synthesis process
 |
17 |
where:
 –synthesized stiffness parameter,
 –transducer thickness,
 –transducer surface area.
The mechanical quality factor of the transducer is approximated from the relation between the Rayleigh’s proportionality factor and resonant frequency of each segment
 |
18 |
where:
 – proportionality factor,
 –resonant frequency of a model segment.
To determine the direct value of the electrical permeability, the following formula was used:
 |
19 |
where the value of the electrical capacitance of the transducer has been calculated from the relationship between the effective coefficient and the elasticity of the elements obtained during the synthesis process:
 |
20 |
Based on the approximation equations used in the synthesis process, it is possible to calculate approximate values for the most quoted material properties of piezo transducers in the technical specifications.
The resonant frequencies and amplitude responses were verified with the matrix method. The constitutive equations of piezoelectricity28,29 in combination with Lagrangian mechanics were used to describe the relations. A set of equations defining mechanical and electrical interactions was created based on the mechatronic model from Fig. 3:
 |
21 |
Substituting the displacement and the voltage into the equation in the complex numbers domain, the following is obtained:
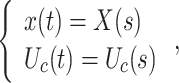 |
22 |
and equations in (21) were transformed into a matrix form:
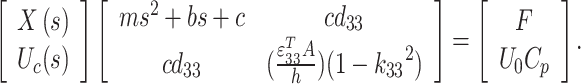 |
23 |
Based on the obtained matrix of coefficients, the elements corresponding to the flow of mechanical and electrical energy within the system have been determined:
 |
24 |
 |
25 |
 |
26 |
where Eq. (24) is responsible for the interactions in the mechanical part of the system; Eq. (25) represents the relationships occurring in the electrical part of the system, while Eq. (26) represents the electromechanical coupling responsible for the energy exchange between the mechanical and electrical parts of the two subsystems, symbolically denoted by the letter N in Fig. 3.
An application was then created in Matlab to automatically synthesise the desired cascade piezoelectric systems, selecting the required resonant frequencies with the possibility of specifying any geometric dimensions (Fig. 4) or material properties (Fig. 5).
Fig. 4.
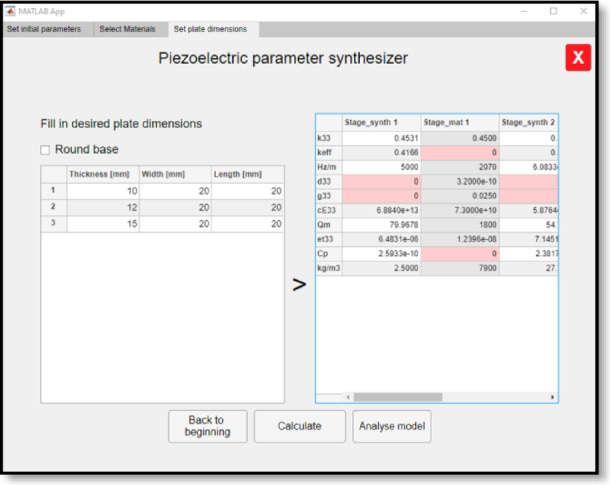
Interface for the synthesis of material properties of piezoelectric stack transducers based on fixed geometric parameters.
Fig. 5.
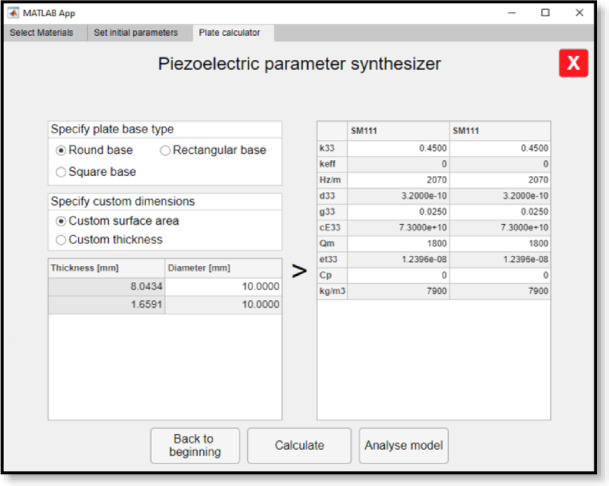
Interface based on real material properties for the synthesis of geometrical parameters of individual transducers in a piezoelectric stack.
It is possible to set boundary conditions in the analysis process, like the strength of the applied harmonic force, the voltage of the excitation system and the frequency range of the performed analysis (Fig. 6).
Fig. 6.
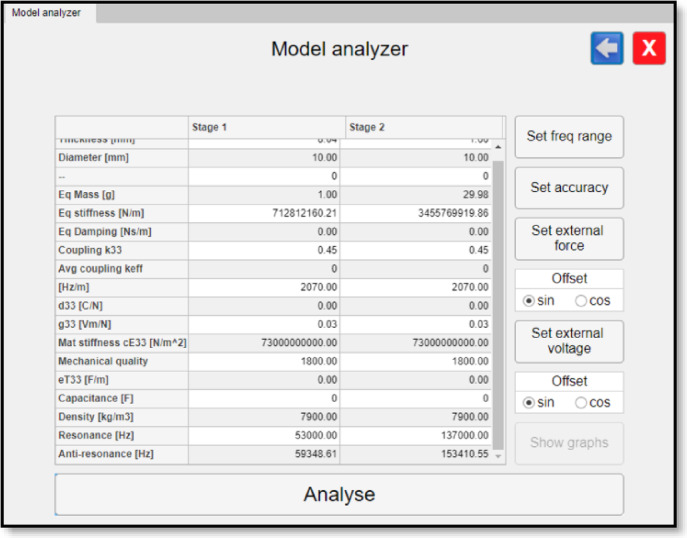
Synthesised piezoelectric system analysis module interface with choice of boundary conditions and response calculation accuracy.
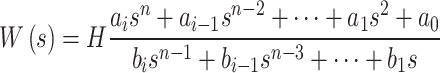
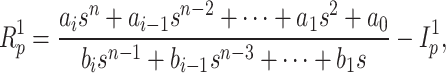
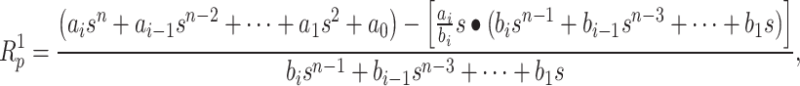
The response of the synthesised system with two degrees of freedom is shown in Fig. 7.
Fig. 7.

Plots of the amplitude response in the frequency domain when analysing a two degree of freedom system. It is possible to plot the response in terms of the displacement of the system and the voltage obtained at the output of the piezoelectric transducer.
The results obtained from the computer application were verified experimentally on a test bench consisting of a Tabor Electronics WW5064 voltage generator capable of generating a harmonic wave with a maximum amplitude of 10 Vpp and a frequency of 80 MHz. The voltage was amplified by a TEGAM 2340 amplifier at a 50:1 ratio and applied to each of the contact surfaces of piezoelectric transducers in the test stack. A Polytec laser vibrometer was used to measure the vibrations of the transducers. The signal output from the vibrometer was connected to a Rigol DS1064B oscilloscope. The input to the oscilloscope had an impedance of 1 MΩ, so the recorded vibrometer signal corresponded to a ratio of 50 nm/V. Samples were taken every 0.8 µs, giving a measurement resolution of 1.25 MHz and a measurement length of 6.5536 ms. Signals were sampled at a maximum frequency of 350 kHz, so that the Nyquist frequency was not exceeded. A schematic diagram of the measurement system is shown in Fig. 8.
Fig. 8.
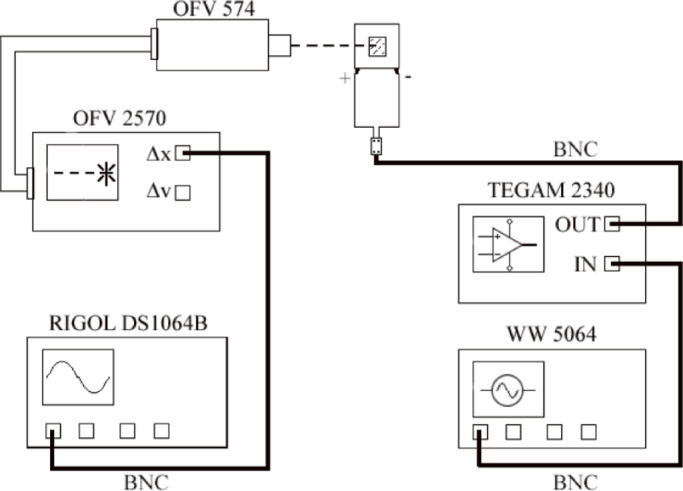
Schematic diagram of the measuring system.
Stacks of THORLABS PA4HEW and PA4FEW piezoelectric transducers were empirically tested. The PA4HEW transducer was a rectangular piezoelectric plate with dimensions of 10 × 10x2 mm. PA4FEW was a 5 × 5x2 mm rectangular plate. Both tested transducer types were made of the same piezoelectric material designated THP51 by the manufacturer. The PA4HEW and PA4FEW transducer types were selected to balance the complexity arising from multiple varying parameters with the need for close alignment to theoretical models. These transducers are composed of piezo-ceramic composites featuring an internal architecture more akin to a miniature stack of slender piezoelectric slices, rather than a monolithic structure. While this introduces a deviation from the theoretical assumption of homogenous bodies, it offers significant practical advantages, most notably, the feasibility of side-mounted electrical contacts. This design flexibility was essential given the constraints of the available testing aperture. To further minimize variability in comparative analysis, both transducer plates were fabricated from the same material and maintained identical thicknesses. The study initially considered incorporating an additional pair of plates made from a different material to evaluate the influence of material properties, however, this option was regrettably not feasible at the time. Technical specification of both types of transducers and the material were referenced in catalogue charts30–32. Three series of measurements were carried out as part of the study. Firstly, the displacement of a single PA4HEW transducer was measured when excited with a harmonic voltage of 1Vpp over a frequency range of 10–350 kHz. The displacement generated by a single PA4FEW was then measured in the same way. In the final series of measurements, a stack of the two transducers in question was tested, with the PA4HEW transducer on the inside, mounted on a rigid granite slab, and a PA4FEW transducer with a layer of reflective material on the outside (Fig. 9). The testing stand used for the study has been shown in Fig. 10.
Fig. 9.

Piezoelectric transducers attached vertically to a granite slab with cyanoacrylate adhesive. A thin layer of reflective material has also been applied to the surface of each tested element.
Fig. 10.

A picture of a full testing stand during the initial testing phase of piezoelectric transducers.
The series of measurements were carried out in the following order according to a previously prepared measurement procedure:
Align the laser beam emitter in an axis perpendicular to the plane of the piezoelectric system under test and activate the emitter,
Adjust the distance of the emitter from the surface to be measured as recommended in the instrument manual,
Aim the laser beam at the centre of the reflective surface,
Focus the laser beam onto a target point using a lens calibrator located at the tip of the emitter nozzle,
Adjust the emitter setting and beam focus until the recorded signal reaches the maximum value on the controller display,
Set the multiplier of the signal sampled by the oscilloscope to 1x,
Set the signal sampling rate to 1.25 MHz,
Set the scale of the measured signal on the oscilloscope display to 1 V,
Activate the FFT calculator function to monitor the frequency and amplitude of the recorded signal,
Set the scale of the FFT calculator to 200 mV in the Y axis and 62.5 kHz in the X axis,
Set the measurement recorder to save samples as “.xls” files,
Set the number of signal sampling points to 8192,
Set the parameters on the generator and the channel from which the control signal will be emitted (channel one, sinusoidal harmonic waveform, initial frequency 10 kHz, voltage 20 mVpp),
Activate the signal transmission on channel one of the generator,
Check the connection of the signal wires,
Switch the voltage amplifier into an active state,
Check the quality of the signal recorded by the laser vibrometer and oscilloscope,
Do a visual check of the response of the tested system on the oscilloscope display while adjusting the frequency of the control signal on the generator,
Reset the signal frequency to the initial 10 kHz value,
Connect a USB stick to the oscilloscope,
Start recording measurements at 5 kHz intervals, recording successive measurements to a USB stick (in the case of dynamic changes in system response, record at intervals of 1 kHz),
Copy stored results to a network drive,
Switch off the power supply,
Process the data using a computer algorithm written in Matlab R2019b.
To aggregate the data, an additional computer algorithm was prepared to present the results in the form of plots of the amplitude of the displacement of the measured surface against the frequency of the signal forcing the deformation of the piezo stack.
Results
Tests on a single 10 × 10x2 mm transducer have shown the maximum amplitude of plate surface displacement to be 42.31 nm at a frequency of 63.018 kHz. When measuring a system consisting of a single transducer with dimensions of 5 × 5x2 mm, the maximum recorded deformation occurred at a frequency of 99.029 kHz and was 57.44 nm. The recorded frequencies at which the maximum strain occurred were the resonant frequencies for transducers fixed on one side. The piezoelectric systems were tested using a control signal of 1 V, well below the manufacturer’s approved maximum voltage. The strain of the 10 × 10x2 mm transducer outside the resonant region was between 0.28 nm and 10.92 nm, while for the 5 × 5x2 mm transducer the measured strain was between 0.12 nm and 27.04 nm. In a test of a system consisting of two piezoelectric transducers connected, two regions of increased strain were observed at frequencies of 36 kHz and 122.986 kHz. The measured displacement values of the tested system at the indicated frequencies were 18.97 nm and 41.38 nm.
To validate the accuracy of the representation of real systems by mathematical models generated with synthesis method, models resembling the real systems were generated. For the synthesis method in which the same geometric parameters were assumed, the accuracy of synthesized material properties was verified. For the method using the real material properties, the accuracy of geometric parameter synthesis was verified.
Mathematical models of a real piezoelectric system consisting of a single 10 × 10x2 mm piezoelectric transducer, code-named PA4HEW, have been analysed. The computer application was used to create a mathematical model with similar technical parameters to the real system. A resonant frequency of 63 kHz was assumed to mimic the frequency recorded in the experimental study.
Verification started with the synthesis method, where identical material properties were assumed, and the output information was the geometric parameters of the system. Therefore, in this synthesis process, the material properties were selected from a material catalogue created in the application, which was based on the THORLABS catalogue. Geometric parameters of the synthesised system were then calculated based on the determined mechanical parameters. In the calculations, the thickness of the working element was assumed to be 2 mm, which is the thickness of a real piezoelectric transducer. It was also assumed that the modelled system has a square cross section. Based on these assumptions, the side length of the modelled piezoelectric transducer was determined to be 10.045 mm. The system was analysed to determine the amplitude of the response in the frequency domain.
A frequency range of 0—350 kHz was assumed. A voltage excitation of 1 V and a cosine harmonic waveform were used. A plot of the response of the system modelled using the synthesis method and the values obtained in the experimental study of the real piezoelectric system is shown in Fig. 11.
Fig. 11.

Response diagram of the modelled system based on the assumed real material properties and measurement points obtained in an experimental test of a real piezoelectric system consisting of a transducer with dimensions of 10 × 10x2 mm.
The amplitude response of the modelled piezoelectric system was characterised by a maximum displacement of 85 nm at a frequency of 58.5 kHz. The maximum recorded displacement amplitude of 42 nm for the real piezoelectric system was recorded at 63 kHz. The relative difference between the model resonance frequency and the real system resonance frequency was therefore 8%, while the difference between the amplitudes was twice that recorded for the real system. The synthesis method was then verified with real geometric parameters of the modelled system. The dimensions of the synthesised system were assumed to be identical to those of the real system, i.e. a square element with a side length of 10 mm and a thickness of 2 mm. The material properties of the synthesised piezoelectric system were calculated based on the input data used in the synthesis process. Table 1 shows the values obtained by the synthesis method and the material properties of the real piezoelectric transducer.
Table 1.
Material properties of the synthesised transducer and the real parameters for a 10 × 10x2mm plate.
| Synthesized model | Real transducer | |
|---|---|---|
| k33 | 0,683 | 0,680 |
| keff | 0,646 | 0,500 |
| d33 [C/N] | 9,812 ‧ 10–10 | 7,100 ‧ 10–10 |
 [N/m2] [N/m2] |
1,880 ‧ 1010 | 4,348 ‧ 1010 |
 [F/m] [F/m] |
3,388 ‧ 10–8 | 2,921 ‧ 10–8 |
The process of analysing the system response was carried out based on the determined material properties of the piezoelectric model. The results of the analysis were plotted on a graph, as shown in Fig. 12.
Fig. 12.

The response diagram of the synthesized model on the assumption of real geometrical parameters and a series of measurement points, which were determined through an experimental study of a real piezoelectric system comprising a transducer with dimensions of 10 × 10x2 mm.
The amplitude response of the modelled piezoelectric system was characterised by a displacement maximum of 32 nm at 60 kHz. Consequently, the relative difference between the resonant frequency of the model and the resonant frequency of the real system was 5%, while the difference between the amplitudes was 24%. The following study employed mathematical models of a real piezoelectric system comprising a single 5 × 5x2 mm piezoelectric transducer, identified as PA4FEW. Another mathematical model was constructed with analogous technical parameters to those of the actual system under examination. This time, a resonant frequency of 99 kHz was assumed to mimic the frequency recorded in the experimental test of the 5 × 5x2 mm transducer. The verification once again started with the synthesis method, in which identical material properties were assumed, and the output information was the geometrical parameters of the system. As in the preceding study, the material THP51 was selected from the material catalogue from which the actual piezoelectric transducers were manufactured. Based on the determined mechanical parameters, the geometrical parameters of the synthesised system were calculated. In the calculations, the thickness of the working element was assumed to be 2 mm, which is equal to the thickness of the actual piezoelectric transducer.
The results obtained in conjunction with those yielded by the experimental study are illustrated in Fig. 13. The amplitude response of the modelled piezoelectric transducer, which had dimensions identical to those of the real plate, was characterised by a maximum displacement of 84 nm at 92 kHz. The maximum amplitude recorded in the test of the real system was 57 nm at a frequency of 99 kHz. The relative difference between the resonant frequency of the model and the resonant frequency of the real system was therefore 7%, while the difference between the amplitudes was 32%.
Fig. 13.

Response diagram of the modelled system based on the assumed real material properties and measurement points obtained in an experimental test of a real piezoelectric system consisting of a transducer with dimensions of 5 × 5x2 mm.
Subsequently, the method of synthesis of a 5 × 5x2mm transducer with the assumed real geometrical parameters was verified in analogous way to the previously analysed 10 × 10x2mm plate. The geometric parameters of the synthesised system were assumed to be identical to those of the real system, namely a square-shaped element with a side length of 5 mm and a thickness of 2 mm. Based on these parameters, the material properties of the synthesised system were determined and are presented in Table 2.
Table 2.
Material properties of the synthesised transducer and the real parameters for a 5 × 5x2mm plate.
| Synthesized model | Real transducer | |
|---|---|---|
| k33 | 0,679 | 0,680 |
| keff | 0,642 | 0,500 |
| d33 [C/N] | 8,709 ‧ 10–10 | 7,100 ‧ 10–10 |
 [N/m2] [N/m2] |
8,358 ‧ 1010 | 4,348 ‧ 1010 |
 [F/m] [F/m] |
1,372 ‧ 10–7 | 2,921 ‧ 10–8 |
Based on the determined material properties of the piezoelectric model and the real geometrical parameters, the process of analysing the synthesised system was carried out again.
Figure 14 illustrates a graph that demonstrates the response of the synthesised system in conjunction with the measurement results obtained from the experimental study of the actual system. The amplitude response of the piezoelectric system, which was modelled using the second synthesis method, exhibited a displacement maximum of 46 nm at 94.5 kHz. Consequently, the relative difference between the resonance frequency of the model and the resonance frequency of the actual system was 5%, while the difference between the amplitudes was 19%. Following a comparison of the responses of systems comprising single piezoelectric transducers with the mathematical models created, a system with two degrees of freedom was verified. The synthesis of this system assumed two different resonant frequencies generated by two distinct piezoelectric transducers with geometrical dimensions of 5 × 5x2 mm and 10 × 10x2 mm. Similarly to the verification of systems composed of single piezoelectric transducers, the analysis commenced with a system modelled using the synthesis method, wherein the material properties of the piezoelectric transducers were initially assumed to be identical to those of the real system. Based on the parameters of the mechanical system and the assumed properties of the THP51 material selected from the piezoelectric materials catalogue, and after assuming a thickness of both transducers of 2 mm, the lengths of the cross-sectional sides of each synthesised element were calculated. The resulting geometrical parameters are presented in Table 3.
Fig. 14.

The response diagram of the synthesized model on the assumption of real geometrical parameters and a series of measurement points, which were determined through an experimental study of a real piezoelectric system comprising a transducer with dimensions of 5 × 5x2 mm.
Table 3.
Geometrical dimensions of a model with two degrees of freedom exhibiting resonance at 63 kHz and 99 kHz.
| Thickness [mm] | Cross-section length [mm] | |
|---|---|---|
| First plate | 2,000 | 8,442 |
| Second plate | 2,000 | 9,927 |
Subsequently, the synthesised system was analysed in the frequency domain, and the results obtained are presented on a graph together with the results obtained in an experimental study of a piezoelectric system composed of two different transducers. The graph is shown in Fig. 15.
Fig. 15.

The response diagram of the synthesized model on the assumption of real material properties and a series of measurement points, which were determined through an experimental study of a real piezoelectric system comprising of both transducers tested previously.
The response of the system modelled with the first synthesis method was characterised by two maximum values of the recorded displacement amplitude, with values of 25 nm at 29 kHz and 31 nm at 115.5 kHz. In the experimental study, the maximum recorded strain amplitude was 19 nm at 36 kHz and 41 nm at 123 kHz. With regard to the first maximum, the discrepancy between the model and the measured values was 20% in terms of frequency and 24% in terms of amplitude. In the case of the second maximum, the relative error of the model was 6% in terms of frequency and 25% in terms of amplitude. The subsequent phase of the study entailed the verification of the model generated through the second synthesis method, operating under the assumption that the geometric parameters of the transducers utilized in the modelled system were identical to those of the real stack. It was thus assumed that the synthesised system is composed of square-shaped elements with sides of lengths 5 mm and 10 mm and with a thickness of 2 mm. The resulting material parameters obtained from this synthesis method were shown in Table 4.
Table 4.
Material properties of the system created in the synthesis process and the real piezoelectric parameters.
| Synthesized model | Real stack | ||
|---|---|---|---|
| First plate | Second plate | Both plates | |
| k33 | 0,679 | 0,678 | 0,680 |
| keff | 0,641 | 0,640 | 0,500 |
| d33 [C/N] | 5,768 ‧ 10–10 | 3,420 ‧ 10–10 | 7,100 ‧ 10–10 |
 [N/m2] [N/m2] |
3,145 ‧ 1010 | 2,111 ‧ 1011 | 4,348 ‧ 1010 |
 [F/m] [F/m] |
2,270 ‧ 10–8 | 5,379 ‧ 10–8 | 2,921 ‧ 10–8 |
The response of the system was analysed based on the calculated parameters of the piezoelectric model, and the results were plotted on a graph, as illustrated in Fig. 16. A first amplitude maximum was observed at 33 kHz with a displacement value of 15 nm when the results were compared. A second maximum was observed at a frequency of 118 kHz, with a displacement value of 17 nm. In comparison to the values obtained through the experimental method on the real system, the relative error in the frequency of the first maximum was 9%, while the error in the determined value was 22%. Conversely, the error for the second recorded frequency maximum was 4%. The relative error of the displacement value for the second maximum was 59%.
Fig. 16.

The response diagram of the synthesized model on the assumption of real geometrical parameters and a series of measurement points, which were determined through an experimental study of a real piezoelectric system comprising of both transducers tested previously.
The results of the tests, together with the findings of the subsequent analysis, enabled the formulation of conclusions regarding the test itself and the potential causes of the observed deviations.
Discussion
In the case of systems comprising a single piezoelectric transducer, the geometric parameters of the modelled elements exhibited a high degree of agreement with the dimensions of the real transducers, a relative error of less than 1% was observed with regard to the catalogued geometrical dimensions. An analysis of systems created in the synthesis process, where material properties were assumed on the basis of catalogue data of real piezoelectric transducers, revealed an error between the determined values of resonant frequencies at the level of 5–8% of the values obtained in experimental measurements. The minimum relative difference between the displacement amplitudes obtained in the mathematical models was approximately 32%. In the case of synthesis, where the real geometrical parameters of the systems were initially assumed, the obtained material properties exhibited a degree of overlap, with real properties ranging between 15% and twice the actual values. In the case of the analysis of the mathematical models created by this synthesis method, the discrepancy between the calculated and actual resonant frequencies was found to be 5% in both instances. Additionally, the discrepancy in the calculated and actual displacements was observed to be between 24 and 32%.
A greater discrepancy from the real values was observed when analysing the model of a system comprising two connected piezo transducers. The geometric dimensions of the system model synthesized with real material properties of the piezoelectric transducers differed from the actual dimensions by 69% for a 5 × 5x2 mm wafer and by 1% for a 10 × 10x2 mm wafer. The resonant frequencies of the system obtained by this synthesis method were found to be in close agreement with those recorded in the experimental study, with a discrepancy of between 6 and 20%. Additionally, the difference between the amplitude values was found to be within a relative error of 24% to 25%. In the case of the synthesis method, where the real geometric dimensions of the transducers were assumed in the model, the synthesised material properties of the system were found to be in agreement with the actual values within one order of magnitude. The analysis of the response of the model created by this synthesis method revealed that the resonant frequencies exhibited an error of 4–9% compared to the actual values, while the difference for the determined values of the amplitudes was 22–59%.
In regard to the results of the verification of the author’s synthesis method, partial agreement was found between the determined geometrical and material parameters of the synthesised mathematical models and those of the real piezoelectric systems. The resonance frequencies of all synthesised systems were found to be highly accurate, as were the geometrical dimensions and material properties of those composed of single piezoelectric transducers. However, deviations were observed for the values of the strain amplitudes and parameters of a system composed of two piezoelectric transducers.
One of the reasons for the discrepancies is undoubtedly the difference between the manner in which interactions between elements in lumped systems are represented and the actual behaviour of piezoelectric systems. In order to model the interactions within a piezoelectric system with the Van Dyke-Butterworth model and basic mechanical models comprising lumped values of mass, stiffness and damping have been employed. However, these mathematical models are only partially able to simulate the phenomena occurring in real electromechanical systems, as they are a simplified form of these systems. The authors of several scientific papers16–18 have drawn attention to the limitations of models with lumped parameters and have proposed modifications to better represent real systems. It can thus be concluded that the mass of an oscillating piezoelectric transducer reflected in a mathematical model is a partial sum of the masses of its individual layers which oscillate to a varying degree depending on their distance between the free and constrained surfaces. The real system therefore differs from the modelled system with lumped parameters, in which the entire oscillating mass is displaced uniformly. One potential solution to this issue is to examine the problem under investigation using finite element methods and specialised FEM software designed for the stress/strain analysis of complex systems. The development of concepts for the synthesis of systems with intricate internal structures using the finite element method represents a crucial objective in the continuation of research on the modelling of piezoelectric systems.
In this study, the mechanical damping of piezoelectric systems was modelled using the Rayleigh method, which also entailed simplifying the damping values adopted in the mathematical model. Consequently, alternative methods for synthesising damping elements must be considered in future scientific work to reduce errors arising from the approximation of damping values.
Additionally, the synthesised mathematical models exhibited an overestimation of the electrical permeability coefficient, with the calculated values being approximately one order of magnitude higher than the actual values. In scientific publications33,34, the authors challenge the consistency of piezoelectric parameters determined in accordance with industry standards28, which manufacturers report for operating frequencies significantly below the resonant frequencies of piezoelectric systems. The authors of the aforementioned publications contend that assuming electrical permeability values, along with those of the electromechanical coupling and damping, to remain constant across the entire operating frequency range of piezoelectric systems is an erroneous assumption.
The displacement values and resonance frequencies of the real piezoelectric systems determined in the experimental study are subject to measurement error due to the precision of the measuring apparatus used and the test procedure adopted. The use of a cyanoacrylate glue to fix the piezoelectric transducers to a granite slab had a significant impact on the operation of the tested systems. The piezoelectric elements, during their work, are exhibiting changes in their geometric dimensions in all axes, irrespective of the mode of operation. Fixing any surface can impair the deformation in one or several of the transducer axes.
The feasibility of synthesising piezoelectric systems using the developed mathematical model was demonstrated in the context of a study conducted on three illustrative examples. However, the results of the analysis of the created mathematical models in comparison with the results of empirical tests showed discrepancies in the strain values of the transducers and in the calculated material and geometric parameters. Further experimental tests will need to be carried out using alternative measurement methods to verify the observed discrepancies. Further scientific work will also entail an in-depth analysis of the influence of factors such as constraint and control signal parameters on the obtained response of the tested piezoelectric systems.
The primary limitation of the proposed methodology lies in its current applicability to uniaxial force interactions. Consequently, mechanical systems exhibiting modal vibrations across multiple axes necessitate independent design procedures tailored to each directional mode. Furthermore, the piezoelectric transducers developed within this framework are specifically engineered to decouple the damped vibrational component from its structural anchorage such as machine foundations which may impose additional constraints. This design approach contrasts with alternative vibration mitigation systems that function through counterbalancing or inertial compensation mechanisms, potentially offering broader applicability.
Conversely, the potential exists for the advancement of technology, including the rapid prototyping and design of active damping systems based on piezoelectric transducers. The proposed approach introduces a novel pathway for damping system selection, requiring only minimal initial input, specifically, the modal frequencies of the system under design. Because the output system is made up of piezoelectric components exclusively, the method ensures a clean and adaptable system design, allowing for subsequent fine-tuning. As outlined in the introduction, this method provides a good framework for preliminary system synthesis by enabling the identification of suitable baseline configurations of piezoelectric elements. Furthermore, it maintains a high degree of modularity and design flexibility by giving the user access to the entire process at every step, making it an ideal starting point for integration with more advanced modelling and optimization methods which excel at later stages of design. These attributes collectively position this method as a versatile foundation for further development, including the implementation of custom control circuitry to enhance system functionality.
Author contributions
A.W created the concept of the study and supervised the project. J.H was responsible for developing the methodology and has done the investigations and cured the data. He also wrote the original draft of the article. Both authors were responsible for providing the necessary resources and equipment to conduct the research. All authors reviewed the manuscript.
Funding
The authors declare that no funding was used to support this article.
Data availability
The data that support the findings of this study are available from the corresponding author upon reasonable request.
Declarations
Competing interests
The authors declare that they have no conflict of interest.
Footnotes
Publisher’s note
Springer Nature remains neutral with regard to jurisdictional claims in published maps and institutional affiliations.
References
- 1.Lyon, R. H. Machinery Noise and Diagnostics. Butterworth-Heinemann10.1016/C2009-0-24812-4 (1987). [Google Scholar]
- 2.Salokyova, S. et al. Research on impacts of mechanical vibrations on the production machine to its rate of change of technical state. Adv. Mech. Eng.8, 1–10. 10.1177/1687814016655778 (2016). [Google Scholar]
- 3.Tavner, P. J. Review of condition monitoring of rotating electrical machines. IET Electr. Power Appl.2(4), 215–247. 10.1049/iet-epa:20070280 (2008). [Google Scholar]
- 4.Mohanta, R. K. et al. Sources of vibration and their treatment in hydro power stations—a review, engineering science and technology. An Int. J.20(2), 637–648. 10.1016/j.jestch.2016.11.004 (2017). [Google Scholar]
- 5.Bergamo E., Fasan M., Bedon C. 2020 Predictivity of CNC machine-induced vibrations on inter-story floors based on coupled experimental-numerical investigations. Proceedings of First International Electronic Conference on Actuator Technology: Materials, Devices and Applications. 10.3390/IeCAT2020-08529
- 6.Haiping, Du. et al. Advanced seat suspension control system design for heavy duty vehicles, emerging methodologies and applications in modelling. Academic Press10.1016/B978-0-12-819601-4.00003-5 (2020). [Google Scholar]
- 7.Shrestha, B. Study of building vibrations caused by machinery (University of New Mexico, 2018). [Google Scholar]
- 8.Hagood, N. W. & Flotow, A. Damping of structural vibrations with piezoelectric materials and passive electrical networks. J. Sound Vib.146(2), 243–268. 10.1016/0022-460X(91)90762-9 (2003). [Google Scholar]
- 9.Benjeddou, A. & Ranger, J.-A. Use of shunted shear-mode piezoceramics for structural vibration passive damping. Comput. Struct.84(22–23), 1415–1425. 10.1016/j.compstruc.2005.10.010 (2006). [Google Scholar]
- 10.Brownjohn, J. & Pavic, A. Vibration control of ultra-sensitive facilities, Proceedings of the Institution of Civil Engineers -. Struct. Build.159(5), 295–306. 10.1680/stbu.2006.159.5.295 (2006). [Google Scholar]
- 11.Kowal J., Szymkat M., Uhl T.: Synthesis and Analysis of Active Suspension Control. ACTIVE 95 Newport Beach, CA, Poland, 1995, pp. 346–351
- 12.Kozek, M. et al. Vibration damping of a flexible car body structure using piezo-stack actuators. Control. Eng. Pract.19(3), 298–310. 10.1016/j.conengprac.2009.08.001 (2011). [Google Scholar]
- 13.Rivin E.: Vibration isolation theory. Encyclopedia of Vibration, 10.1006/rwvb.2001.0179, 2001
- 14.Tokhi M.O., Mamour K., Hossain M.A.: Adaptive active noise and vibration control. UKACC International Conference on CONTROL, 1996
- 15.Dassisti, M., Olabi, A. G. & Brunetti, G. Application of magnetorheological fluids MRF in a suspension system. Materials Science and Materials Engineering10.1016/B978-0-12-815732-9.00085-1 (2021). [Google Scholar]
- 16.Goldfarb, M. & Celanovic, N. Modeling piezoelectric stack actuators for control of micromanipulation. IEEE Control Syst. Magazine10.1109/37.588158 (1997). [Google Scholar]
- 17.Goldfarb M., Celanovic N.: Behavioral Implications of Piezoelectric Stack Actuators for Control of Micromanipulation. Proceedings of the 1996 IEEE International Conference on Robotics and Automation Minneapolis, 1996
- 18.Adriaens H., Koning W., Banning R.: Modeling piezoelectric actuators. IEEE/ASME Transactions on mechatronics, vol. 5, no. 4, 2000
- 19.Lahmer, T. et al. FEM-based determination of real and complex elastic, dielectric, and piezoelectric moduli in piezoceramic materials. IEEE Trans. Ultrason. Ferroelectr. Freq. Control.55(2), 465–475. 10.1109/TUFFC.2008.664 (2008). [DOI] [PubMed] [Google Scholar]
- 20.Gosiewski, Z. & Koszewik, A. Fast prototyping method for the active vibration damping system of mechanical structures. Mechanical System and Signal Processing36(1), 136–151. 10.1016/j.ymssp.2011.12.011 (2013). [Google Scholar]
- 21.Tao, Wu. et al. Modeling analysis and tuning of shunt piezoelectric damping controller for structural vibration. Acta Mech.234, 4407–4426. 10.1007/s00707-023-03619-x (2023). [Google Scholar]
- 22.Darleux, R., Lossouarn, B. & Deü, J.-F. Broadband vibration damping of non-periodic plates by piezoelectric coupling to their electrical analogues. Smart Mater. Struct.29(5), 054001. 10.1088/1361-665X/ab7948 (2020). [Google Scholar]
- 23.Nada, T., Lahcen, A., Nadia, F. & Abdulmalik, A. Nonlinear micromechanical modeling of fully coupled piezo-elastic composite under large deformation and high electric field. Composite Struct.10.1016/j.compstruct.2023.116991 (2023). [Google Scholar]
- 24.Cauer, W. Ideale Transformatoren und lineare Transformationen. Elektrische Nachrichtentechnik (ENT)9, 157–174 (1932). [Google Scholar]
- 25.Cauer W.: Theorie der linearen Wechselstromschaltungen, Berlin: Akademie-Verlag, vol. 2, 1960
- 26.Adamowski, J. C., Nader, G. & Silva, E. C. N. Effective damping value of piezoelectric transducer determined by experimental techniques and numerical analysis. ABCM Symp. Series Mech.1, 271–279 (2004). [Google Scholar]
- 27.Liu, M. & Gorman, D. G. Formulation of Rayleigh damping and its extensions. Comput. Struct.57(2), 277–285. 10.1016/0045-7949(94)00611-6 (1995). [Google Scholar]
- 28.IEEE Standard on Piezoelectricity. ANSI/IEEE Std 176–1987, 1988, 10.1109/IEEESTD.1988.79638
- 29.Moncef, H., Jean-Yves, C. & Faida, M. A multi-agent methodology for multi-level modeling of mechatronic systems. Adv. Eng. Inform.3(3), 208–217. 10.1016/j.aei.2014.03.005 (2014). [Google Scholar]
- 30.PA4HEW - Piezo Chip, THORLABS, [online] https://www.thorlabs.com/ thorproduct.cfm?partnumber=PA4HEW, [last accessed 17.02.2024]
- 31.PA4FEW - Piezo Chip, THORLABS, [online] https://www.thorlabs.com/ thorproduct.cfm?partnumber=PA4FEW, [last accessed 17.02.2024]
- 32.Piezo Actuators product brochure, THORLABS, [online] https://www.thorlabs.com/ images/Brochures/Thorlabs_Piezo_Brochure.pdf, [last accessed 17.02.2024]
- 33.Mirzoyan, V., Sahakyan, A. & Mirzoyan, P. Behavior of dielectric permittivity of piezomonocrystall near the resonant frequency. Physical and Mathematical Sciences3, 62–65 (2014). [Google Scholar]
- 34.Park, Y. et al. Improvement of the standard characterization method on k33 mode piezoelectric specimens. Sens. Actuators, A312, 112–124 (2020). [Google Scholar]
Associated Data
This section collects any data citations, data availability statements, or supplementary materials included in this article.
Data Availability Statement
The data that support the findings of this study are available from the corresponding author upon reasonable request.