

Abstract
PAX3-FOXO1, an oncogenic transcription factor, drives a particularly aggressive subtype of rhabdomyosarcoma (RMS) by enforcing gene expression programs that support malignant cell states. Here we show that PAX3-FOXO1+ RMS cells exhibit altered pyrimidine metabolism and increased dependence on enzymes involved in de novo pyrimidine synthesis, including dihydrofolate reductase (DHFR). Consequently, PAX3-FOXO1+ cells display increased sensitivity to inhibition of DHFR by the chemotherapeutic drug methotrexate, and this dependence is rescued by provision of pyrimidine nucleotides. Methotrexate treatment mimics the metabolic and transcriptional impact of PAX3-FOXO1 silencing, reducing expression of genes related to PAX3-FOXO1-driven malignant cell states. Accordingly, methotrexate treatment slows growth of multiple PAX3-FOXO1+ tumor xenograft models, but not fusion-negative counterparts. Taken together, these data demonstrate that PAX3-FOXO1 induces cell states characterized by altered pyrimidine dependence and nominate methotrexate as an addition to the current therapeutic arsenal for treatment of these malignant pediatric tumors.
Introduction
Cellular metabolic pathways support critical cell functions, ranging from macromolecule biosynthesis and energy production to maintenance of redox homeostasis and cell signaling pathways. As cellular functions change, so does the demand for reducing equivalents, energy production, and macromolecule synthesis. Accordingly, cellular metabolic demands are often highly context-dependent, with cells of different lineages or even in distinct stages of differentiation experiencing unique metabolic phenotypes1-3. Consequently, metabolic perturbations fatal to one cell state may be well-tolerated in another. This context-specific role of metabolic programs is exemplified by inborn errors of metabolism, a constellation of human disorders driven by germline mutation in metabolic enzymes in which disease severity and affected organ system vary depending on the metabolic pathway—and even, the specific step within a pathway—that is mutated4,5. The notably heterogeneous clinical manifestations of inborn errors in metabolism underscores both how different cell states respond differently to metabolic alterations and how modifying factors including genotype and diet affect response to metabolic perturbations5.
The observation that many cell states have unique metabolic requirements raises the possibility that these metabolic vulnerabilities can be targeted to eliminate specific cell types. In cancer, such metabolic targeting has notable successes6. For example, pediatric acute lymphoblastic leukemia (ALL) is markedly sensitive to depletion of asparagine through asparaginase therapy7, and antifolates like aminopterin and methotrexate are classic agents for ALL8, choriocarcinoma9, and osteosarcoma10. To date, many metabolic therapies aim to target rapid proliferation of cancer cells or to exploit collateral lethality secondary to genetic mutations harbored by tumor cells11,12. Whether different cell states that emerge within and between tumor subtypes harbor different metabolic vulnerabilities is relatively poorly understood.
Here, we aimed to determine whether metabolic dependencies could be leveraged to target malignant cell states using rhabdomyosarcoma (RMS) as a model system. RMS is the most common pediatric soft tissue sarcoma and shares histological and transcriptional signatures of normal myogenic development13. RMS largely falls into two subtypes based on the presence or absence of a fusion oncogene in which the DNA-binding domain of PAX3 or, more rarely, PAX7, is fused with the transactivation domain of FOXO114. Whereas fusion-negative tumors are often lower-risk and effectively managed with a combination of chemotherapy, surgery, and radiotherapy15, fusion-positive tumors—especially those expressing PAX3-FOXO1—are higher-risk and more likely to be metastatic at diagnosis16,17. Accordingly, PAX3-FOXO1 expression correlates with worse outcomes for patients with either localized or metastatic disease, where 5-year overall survival is as low as 13% compared to 62% for fusion-negative disease18,19. Despite different prognoses, the therapeutic approach to fusion-positive and fusion-negative tumors is identical and has remained largely unchanged for over 30 years13.
Recent single-cell profiling of RMS cell lines and tumors revealed that RMS cells adopt a spectrum of different cell states that may contribute to malignant progression. Specifically, fusion-negative RMS cells retain the ability to access a range of cell states across the normal myogenic developmental cascade; in contrast, fusion-positive RMS cells are locked into a “cycling progenitor” state resistant to normal myogenic differentiation and associated with poor prognosis20,21. By comparing metabolic dependencies of fusion-positive and fusion-negative RMS cell lines, we aimed to determine whether malignant cell states that characterize PAX3-FOXO1+ RMS have metabolic vulnerabilities that can be exploited therapeutically for this hard-to-treat disease.
Materials & Methods
Cell Culture
RH30 (CRL-2061, RRID:CVCL_0041), RD (CCL-136, RRID:CVCL_1649), Hs729 (HTB-153, RRID:CVCL_0871), and C3H 10T1/2 (CCL-226, RRID:CVCL_0190) were purchased from the ATCC. RH41 (RRID:CVCL_2176) and SMS-CTR (RRID:CVCL_A770) were obtained from the Children’s Oncology Group Childhood Cancer Repository. Cell lines were maintained in DMEM supplemented with 10% fetal bovine serum (Gemini). Cell lines were validated via STR profiling by the ATCC or Childhood Cancer Repository and were routinely tested for mycoplasma using the MycoAlert Mycoplasma Detection Kit (Lonza, LT07-318). All cell lines were used for no more than 15 passages after being thawed from frozen stocks.
Xenograft studies
All animal work was approved by Memorial Sloan Kettering Cancer Center (MSKCC) Institutional Animal Care and Use Committee (protocol nos. 19-09-014, Finley and 16-08-011, Kung) in compliance with all relevant ethical regulations. Animals were housed in a pathogen-free facility maintained at 21.5 ± 1 °C and relative humidity 30–70% under a 12/12 h light/dark cycle.
For cell line xenograft experiments, 1 x 10⁶ (RH30), 2 x 10⁶ (RD and SMS-CTR), or 4 x 10⁶ (RH41) cells were mixed 1:1 with Matrigel (Corning, 356231) and subcutaneously engrafted into the right flank of 6–8-week-old female athymic nude mice (Charles River Laboratories, strain code 490). Mice were enrolled in experimental arms when their tumor size reached 100 mm3. Due to the staggered enrollment of mice in each study, female mice were exclusively used to avoid single housing of mice. Following enrollment, mice were treated with methotrexate (Sigma, M9929, 30 mg/kg) dissolved in corn oil (Sigma, C8267) and administered via IP injection three times a week, with each dose followed 24 h later by an IP injection of leucovorin calcium (Sigma, PHR1541, 24 mg/kg) dissolved in saline solution. Vehicle controlled mice received an equivalent volume of corn oil three times a week. Tumors were measured with calipers three times a week, and tumor volume was calculated using the equation: volume = 0.5 × length × width2. Mice were euthanized once tumors reached endpoint criteria (size at or exceeding 1500 mm3), or if mandated by veterinary staff. For LC-MS analysis of tumors, mice were euthanized and tumors were harvested 10 days after mice were enrolled into the study. Mouse weight was recorded at time of enrollment and at least once a week once mice were enrolled into each study.
For patient-derived xenograft experiments, NSG mice (Jackson Labs, strain #005557; RRID:IMSR_JAX:005557) were anesthetized and sterilized with 70% ethanol. Viably cryopreserved tumor fragments measuring 1-2 mm were thawed in a 37°C water bath and then implanted into a subcutaneous pocket in the mouse flank generated by blunt dissection. Surgical incisions were approximated and sealed with Vetbond tissue adhesive (MWI Veterinary Supply, 006245). An equal number of male and female mice were implanted. Implanted mice were monitored closely for tumor engraftment and growth. Mice were enrolled in treatment arms once tumors reached approximately 100 mm3 in size, balancing the numbers of male and female mice in each group as much as possible. For the experiment utilizing the model MSKPED-0140-X1, mice were treated with methotrexate (with leucovorin rescue) following a regimen identical to that used for cell line xenograft experiments (see above). For the experiment utilizing the model MSKPED-0004-X1, mice were treated with methotrexate (30 mg/kg) administered three times a week. 24 h after the first dose of MTX was administered, leucovorin calcium was provided continuously in drinking water at a concentration of 100 mg/L. Medicated water was refreshed twice a week. Cyclophosphamide (Sigma, C0768, 50 mg/kg) was administered to mice via IP injection once daily for five consecutive days.
Generation of CRISPR/Cas9-edited lines
Single guide RNA (sgRNA) sequences targeting DHFR, TYMS or the AAVS1 safe harbor site (control) were cloned into lentiCRISPRv2 (Addgene, 52961; RRID:Addgene_52961) as previously described22 but using BsmbI (Thermo Fisher Scientific, FD0454) as the restriction enzyme. All sgRNA sequences are provided in Supplementary Table 1. Lentivirus was produced and introduced into cells as described below, followed by selection with 1 μg/mL (RH30, RD, SMS-CTR, Hs729) or 0.5 μg/mL (RH41) puromycin (Thermo Fisher Scientific, A1113803). sgDHFR cell lines were maintained in the continuous presence of 100 μM leucovorin calcium (Fisher Scientific, 18-603-788) until plated for experiments. sgTYMS cell lines were maintained in the continuous presence of 100 μM thymidine (Sigma, T9250) and 100 μM cytidine (Sigma, C4654) until plated for experiments.
Generation of shPAX3-FOXO1 lines
Due to the existence of an EcoRI site at the PAX3-FOXO1 junction, the canonical miR-E hairpin cloning protocol23 was modified as follows. Hairpin sequences targeting the fusion junction between PAX3 and FOXO1 were designed using splashRNA24 and additional bases were added to the beginning and end of the sequence to enable PCR amplification. All shRNA sequences and cloning primers are provided in Supplementary Table 1. Hairpins were PCR-amplified and the doxycycline-inducible lentiviral vector LT3GEPIR23 (Addgene, 111177; RRID:Addgene_111177) was digested with EcoRI and XhoI. A hairpin sequence targeting Renilla luciferase was used as a control and was cloned into LT3GEPIR following the standard miR-E hairpin cloning protocol23. For each hairpin, the PCR-amplified insert and digested vector were assembled using NEBuilder HiFi DNA Assembly Master Mix (New England Biolabs, E2621S). A hairpin sequence targeting Renilla luciferase was used as a control and was cloned into LT3GEPIR following the standard miR-E hairpin cloning protocol23. Lentivirus was produced and introduced into RH30 cells as described below, followed by selection with 1 μg/mL puromycin (Thermo Fisher Scientific, A1113803).
Generation of PAX3-FOXO1 overexpression lines
The sequence for PAX3-FOXO1 (sourced from plasmid pCDNA3-PAX3-FOXO1/FKHR, Addgene, 115226; RRID:Addgene_115526) was subcloned into pCDH-CMV-MCS-EF1α-Puro (System Biosciences, CD510B-1) using primers listed in Supplementary Table 1. The empty vector was used to generate control cell lines. Lentivirus was produced and introduced into cells as described below, followed by selection with 1 μg/mL puromycin (Thermo Fisher Scientific, A1113803) for RD and SMS-CTR or 2 μg/mL puromycin for C3H 10T1/2.
Lentiviral Production
Lentivirus was generated by co-transfection of lentiviral vectors expressing sgRNA, shRNA, or cDNA of interest with packaging plasmids psPAX2 (Addgene, 12260; RRID:Addgene_12260) and pMD2.G (Addgene, 12259; RRID:Addgene_12259) into HEK293T cells (RRID:CVCL_0063) via calcium phosphate transfection. Viral-containing supernatant was passed through a 0.45 μm filter to remove debris. Target cells were exposed to viral supernatants in the presence of polybrene (8 μg/mL, Sigma, 107689) for two 24 h periods in 6-well plates before being moved to 10 cm2 dishes. Antibiotic selection was started 24 h later.
Growth curves
To measure response to drug treatment, cells were seeded into 12-well plates and allowed to adhere overnight. The following day, three wells of each line were counted to measure the starting cell number. If applicable, the remaining cells were changed to the relevant treatment medium. For experiments performed in dialyzed fetal bovine serum, cells were seeded into medium containing 10% dialyzed serum (Gemini) and changed to the relevant treatment medium the following day. Cells were counted 96 h later using a Beckman Coulter Multisizer 4e with a cell volume gate of 400-20,000 fL. Cell counts were normalized to starting cell number, and the number of population doublings per day was calculated using the following equation:
Relative proliferation for each treatment group is expressed as a percentage of the control group (set to 100%). This percentage was calculated using the doublings per day for each group. Methotrexate (Sigma, M9929), pemetrexed (Sigma, SML1490), lometrexol (Cayman Chemical Company, 18049), actinomycin D (Sigma, A1410), and 4-Hydroperoxy cyclophosphamide (MedChemExpress, HY-117433) were used at indicated concentrations. SHIN225 was a generous gift from the Rabinowitz lab. All drug response growth curve data shown is after 96 h of treatment, with the exception of methotrexate in C3H 10T1/2 lines, which were evaluated after 72 h of treatment. For nucleobase or nucleoside rescue experiments, thymidine (Sigma, T9250), cytidine (Sigma, C4654), and/or hypoxanthine (Sigma, H9377) were added at stated concentrations. To measure response to leucovorin withdrawal in sgDHFR lines, cell lines were seeded into 12-well plates in media without leucovorin calcium. The following day, three wells of each line were counted to measure the starting cell number. Media was refreshed two days later, and cells were counted five days after the starting cell number was measured. Cell counts were normalized to starting cell number, and the equation above was used to calculate doublings per day but with 5 as the denominator. The percentage of cells in each knockout line relative to the control line (sgAAVS1) was then calculated. To measure response to thymidine and cytidine withdrawal in sgTYMS lines, a similar procedure to that described above for leucovorin withdrawal was used, with two key modifications: cell lines were seed into 12-well plates without thymidine or cytidine, and cells were counted 4 days after the starting cell number was measured. For evaluation of the effects of PAX3-FOXO1 knockdown, cells were seeded as described above and doxycycline (1 μg/mL, Sigma, D9891) was added 24 h later. Cells were counted every day for three days. Medium containing doxycycline was refreshed every 48 h.
Viability Assay
Cells were seeded into clear-bottom, white 96-well plates (Corning, 3610) and allowed to adhere overnight. Serial drug dilutions were added 24 h later, and the CellTiter-Glo viability assay (Promega, G7572) was run 48 h later following manufacturer instructions. For evaluating response to MTX with 5-meTHF as the folate source, cells were seeded into 96-well plates in DMEM without folic acid (MSKCC media core) supplemented with 10% fetal bovine serum and 4 mg/L 5-meTHF (Sigma, M0132).
LC-MS Analysis
Cells were seeded in six-well plates. If applicable, 24 h after seeding, cells were changed to treatment media containing vehicle control (DMSO, Sigma, D2650) or 0.2 μM methotrexate (Sigma, M9929), or 1 μg/mL doxycycline (Sigma, D9891). 48 h later, cells were harvested using 1 mL ice-cold 80% methanol containing 2 μM deuterated 2-hydroxyglutarate (d-2-hydroxyglutaric-2,3,3,4,4-d5 acid (d5-2HG)) as an internal standard. Plates were incubated at −80°C overnight. For LC-MS analysis of cells cultured in dialyzed serum, cells were seeded into six-well plates in medium containing 10% dialyzed serum, changed to treatment media 24 h after seeding, and harvested 24 h after starting treatment as described above. For LC-MS analysis of tumors, tumors were harvested 10 days after mice were enrolled into the study and freeze clamped on dry ice. Tumors were ground on dry ice to fine powder and weighed; each sample contained roughly 10 mg tissue. 1 mL ice-cold 80% methanol containing 2 μM d5-2HG was added to tissue powder and samples were vortexed and stored at −80°C overnight. All samples were centrifuged at 20,000 x g for 20 min at 4°C to clear protein, then dried in an evaporator (Genevac EZ-2 Elite). Dried extracts were resuspended in 30 μL of mobile phase A (10 mM tributylamine and 15 mM acetic acid in 97:3 water:methanol) and were incubated on ice for 20 min with vortexing every 5 min. Samples were cleared by centrifugation at 20,000 x g for 20 min at 4°C. After clearing, samples were subjected to MS/MS acquisition using an Agilent 1290 Infinity LC system equipped with a quaternary pump, multisampler, and thermostatted column compartment coupled to an Agilent 6470 series triple quadrupole system with a dual Agilent Jet Stream source for sample introduction. Data were acquired in dynamic MRM mode using electrospray ionization in negative ion mode. Capillary voltage was 2000 V, nebulizer gas pressure was 45 Psi, drying gas temperature was 150°C and drying gas flow rate was 13 L/min. 5 μL of sample was injected onto an Agilent Zorbax RRHD Extend-C18 (1.8 μm, 2.1 × 150 mm) column maintained at 35°C. A 24 min chromatographic gradient was performed using mobile phase A and mobile phase B (10 mM tributylamine and 15 mM acetic acid in methanol) at a flow rate of 0.25 mL/min. Following the 24 min gradient the analytical column was backflushed for 6 min with 99% acetonitrile at a 0.8 mL/min flow rate followed by a 5 min re-equilibration step (MassHunter Metabolomics dMRM Database and Method, Agilent Technologies). Data analysis was performed with MassHunter Quantitative Analysis (v. B.09.00). For analysis of cells, peak areas for each metabolite were normalized to d5-2HG and to protein content of matched duplicate samples as determined by bicinchoninic acid (BCA) assay (Thermo Fisher Scientific, 23225). For analysis of tumors, peak areas were normalized to d5-2HG and tumor powder weight.
Principal component analysis (PCA) was performed by feeding a matrix of normalized metabolite peak areas (as described above) to the prcomp function in R (v. 4.3.2, RRID:SCR_001905) with the “scale” argument set to “TRUE”. Partial least squares-discriminant analysis (PLS-DA) and variable importance in the projection (VIP) analysis were performed using MetaboAnalyst 6.0 (RRID:SCR_015539)26. The Venn diagram showing overlapping VIP results was generated using the R package eulerr (version 7.0.2, RRID:SCR_022753). For principal component analysis integrating separate experiments, z-scores were first calculated within each experiment using the scale function in R (v. 4.3.2) with default parameters. PCA was then performed with the prcomp function in R with default parameters.
Western Blotting
Cells were seeded in six-well plates. If applicable, 24 h after seeding, cells were changed to treatment media containing vehicle control (DMSO, Sigma, D2650) or 0.2 μM methotrexate (Sigma, M9929). Protein lysates were extracted in RIPA buffer (Cell Signaling Technology, 9806) and concentration determined by BCA assay (Thermo Fisher Scientific, 23225). Samples were boiled for 5 min, then separated by SDS-polyacrylamide gel electrophoresis and transferred to nitrocellulose membranes (Bio-Rad, 1620115). Membranes were blocked in 3% milk in Tris-buffered saline with 0.1% Tween-20 (TBST) followed by incubation with primary antibodies at 4°C overnight. Following TBST washes, membranes were incubated with horseradish-peroxidase-conjugated secondary antibodies (Cytiva, mouse, NA931; rabbit, NA934) for at least 1 h at room temperature, incubated with Pierce ECL Western Blotting Substrate (Thermo Fisher Scientific, 32109) and imaged using HyBlot CL Autoradiography Film (Denville Scientific, E3018) with an SRX-101A X-ray Film Processor (Konica Minolta). Antibodies used were anti-DHFR (1:1000, Cell Signaling Technology, 45710; RRID:AB_3683693), anti-TYMS (1:1000, Cell Signaling Technology, 9045; RRID:AB_2797693), anti-FOXO1 (1:1000, Cell Signaling Technology, 2880; RRID:AB_2106495), anti-UCK1 (1:1000, Proteintech, 12271-1-AP; RRID:AB_11182173), anti-UCK2 (1:1000, Proteintech, 10511-1-AP; RRID:AB_2241182), anti-tubulin (1:10,000, Sigma, T9026; RRID:AB_477593), and anti-vinculin (1:10,000, Sigma, V9131; RRID:AB_477629).
EdU or EU incorporation flow cytometry assay
Cells were seeded in triplicate into 12-well plates. 24 h after seeding, cells were changed to treatment media containing DMSO (Sigma, D2650) or 0.2 μM methotrexate (Sigma, M9929). Cells were collected for flow cytometry analysis 48 h after starting treatment. One hour before collection, cells were changed into fresh medium containing 10 μM EdU (Vector Laboratories, CCT-1149) or 1 mM EU (Vector Laboratories, CCT-1261-25). Cells labeled with EdU were collected and stained with ZombieGreen Fixable Viability dye (Biolegend, 423111), followed by fixation with 4% paraformaldehyde and permeabilization with saponin-based permeabilization and wash reagent (Thermo Fisher Scientific, C10419). Cells labeled with EU were collected and then fixed and permeabilized as described above. Fixed and permeabilized cells were stained using the Click-iT Cell Reaction Buffer Kit (Thermo Fisher Scientific, C10269) and AZDye 405 Picolyl Azide (Vector Laboratories, CCT-1308) according to the manufacturer’s instructions. Samples were analyzed on an LSRFortessa flow cytometer using FACSDiva v8.0 (BD Biosciences). Analysis of EdU or EU incorporation was performed with FlowJo (version 10.10.0, RRID:SCR_008520).
Oxygen consumption
Oxygen consumption rate (OCR) was measured using a Seahorse XFe96 Extracellular Flux Analyzer (Agilent Technologies). Cells were plated on tissue-culture-treated XFe96 96-well plates (Agilent Technologies, 102416) in DMEM at the following densities: 20,000 cells per well for RH30 and RH41, 10,000 cells per well for RD, and 15,000 cells per well for SMS-CTR. Densities were determined by identifying seeding numbers that gave rise to OCR measurements within the linear range. Each cell line or condition was seeded in n = 11-12 wells. The next day, cells were washed twice with Seahorse XF DMEM medium supplemented with 10 mM glucose, 2 mM L-glutamine, and 1 mM pyruvate and incubated in this medium for 2 h before performing the Seahorse XF Cell Mito Stress test kit (Agilent, 103015-100) according to the manufacturer’s instructions. During the measurements, oligomycin (1 μM), FCCP (1 μM) and rotenone/antimycin A (500 nM) were injected in sequence. Raw data were analyzed using Wave Desktop Software (Agilent, version 2.6.1). After the assay, OCR measurements were normalized to the average protein content for each condition, determined via BCA assay. Basal mitochondrial OCR was calculated as the difference between the first baseline OCR measurement and the first OCR measurement following rotenone/antimycin A injection.
RNA-sequencing and RNA-sequencing analysis
RNA was isolated with TRIzol (Thermo Fisher Scientific, 15596018) according to manufacturer’s instructions. After RiboGreen quantification and quality control by Agilent BioAnalyzer, 500 ng of total RNA with RIN values of 9.3-10 underwent polyA selection and TruSeq library preparation according to instructions provided by Illumina (TruSeq Stranded mRNA LT Kit, catalog #RS-122-2102), with 8 cycles of PCR. Samples were barcoded and run on a NovaSeq 6000. FASTQ files were aligned to the hg38 reference genome using Dragen v3.10 (Illumina) to generate BAM files. A matrix of raw counts was generated using featureCounts/subread (version 2.16.1, RRID:SCR_012919)27. Differentially expressed genes were determined using DESeq2 (version 1.42.1, RRID:SCR_015687)28. Overrepresentation analysis was performed using clusterProfiler (version 4.10.1, RRID:SCR_016884)29. To assess correlation of gene expression between MTX data and KFR shPAX3-FOXO1 data (obtained from GSE218974, see below), the Pearson correlation coefficient and corresponding p-value were calculated using the cor.test function in R (version 4.3.2).
Published RNA-sequencing analysis
For the published RH30 PAX3-FOXO1 degron data30, FASTQ files were downloaded from the Gene Expression Omnibus (RRID:SCR_005012) under accession number GSE183281 using SRAToolkit (version 3.1.0) and filtered using fastp (version 0.23.4, RRID:SCR_016962)31. Filtered FASTQ files were aligned to the hg38 reference genome using STAR (version 2.7.11b, RRID:SCR_004463)32 and a matrix of raw counts was generated using featureCounts/subread (version 2.16.1)27. Differentially expressed genes were determined using DESeq2 (version 1.42.1)28. Hierarchical clustering was performed using code adapted from a publicly available repository on Github (https://tavareshugo.github.io/data-carpentry-rnaseq/04b_rnaseq_clustering.html). To select candidate genes for hierarchical clustering, a significance cutoff of Padj < 0.05 was used.
For published RMS patient tumor data33,34, a raw counts matrix was downloaded from the Gene Expression Omnibus (GSE108022). Gene signature scores were calculated by adding the z-scores for all genes in the stated list and dividing by the square root of the gene list size35.
DepMap mRNA analysis
Gene expression data were downloaded from the DepMap portal, 24Q2 release (RRID:SCR_017655)36. To compare gene expression between fusion-negative (n = 10) and PAX3-FOXO1+ (n = 7) RMS cell lines, average expression values (using reported transcript per million (TPM) values) were calculated for every gene within each subtype, and the fusion-negative averages were subtracted from the PAX3-FOXO1+ averages. Genes were ranked in descending order of difference, and this ranked list was used as input for GSEA.
DepMap differential essentiality analysis
Gene essentiality data were downloaded from the DepMap portal, 24Q2 release (RRID:SCR_017655)36. To calculate differential essentiality between fusion-negative (n = 5) and PAX3-FOXO1+ (n = 7) RMS cell lines, the average essentiality score for every gene was calculated within each subtype, the PAX3-FOXO1+ averages were subtracted from the fusion-negative averages for each gene, and genes were ranked in descending order of difference.
Single cell RNA-sequencing analysis
Published data20 for KFR cells expressing a doxycycline-inducible hairpin against PAX3-FOXO1 were downloaded from the Gene Expression Omnibus (GSE218974). Data were processed with Seurat (version 5.1.0, RRID:SCR_016341)37 following the standard pipeline. To generate gene signature scores, the AddModuleScore function was utilized with the indicated gene lists in Supplementary Table 2.
Statistics and reproducibility
All statistical analyses were performed in Prism 10 (GraphPad, RRID:SCR_002798) except for DepMap differential essentiality analysis, RNA-seq overrepresentation analysis, and hierarchical clustering, which were performed in R (v4.3.2), and GSEA, which was performed using GSEA software (v4.3.3, RRID:SCR_003199). No statistical methods were used to pre-determine sample size. All in vitro experiments were independently repeated at least twice with similar results except for LC-MS analysis of cells cultured in dialyzed FBS, which was performed once.
Data and reagent availability
RNA-sequencing data generated by this study have been deposited in the Gene Expression Omnibus under the accession code GSE286950. Previously published bulk and single-cell RNA-sequencing data utilized or reanalyzed for this study are available under the accession codes GSE183281, GSE108022, and GSE218974. DepMap data (24Q2 release) were downloaded from the DepMap Portal (https://depmap.org/portal). All unique reagents generated by this study will be made available, following request, from the corresponding author with a completed material transfer agreement. All other raw data are available upon request from the corresponding author.
Results
Rhabdomyosarcoma subtypes harbor intrinsic metabolic differences
We first assessed whether cultured RMS cell lines recapitulate cell state differences of human tumors. RMS cell lines profiled by the DepMap project36 were grouped by fusion status and analyzed for expression of genes characterizing the muscle stem cell (MuSC) or differentiated populations typifying fusion-negative tumors and the cycling progenitor and cell cycle (S-phase) state that distinguish fusion-positive tumors20. Genes upregulated in PAX3-FOXO1+ relative to fusion-negative cell lines were significantly enriched for genes belonging to the cycling progenitor and cell cycle state; in contrast, genes upregulated in fusion-negative cell lines were enriched for MuSC and, to a lesser extent, differentiation-associated genes (Supplementary Fig. S1A). Thus, although cultured cell lines cannot fully capture the phenotypic heterogeneity of human tumors, RMS cell lines do recapitulate aspects of the aberrant cell fate programs observed in PAX3-FOXO1+ relative to fusion-negative RMS tumors.
Next, we asked whether metabolic profiles varied with RMS subtype using a panel of PAX3-FOXO1+ RMS lines (RH30, RH41) and fusion-negative RMS lines (RD, SMS-CTR). Unsupervised analysis of liquid chromatography-mass spectrometry (LC-MS)-based metabolomic profiling revealed that lines clustered based on fusion status (Fig. 1A). Of the 126 metabolites analyzed, 66 significantly changed (P < 0.05) between subtypes (Supplementary Fig. S1B). Supervised clustering using variable importance in the projection (VIP) analysis (Supplementary Fig. S1C) revealed that metabolomic changes were largely reproducible, with 29 metabolites emerging with VIP scores > 1.0 in two independent experiments (Fig. 1B). Of these metabolites, intermediates in pyrimidine metabolism and pyrimidine nucleotides were consistently elevated in PAX3-FOXO1+ RMS cell lines compared to their fusion-negative counterparts (Fig. 1C, D). Pyrimidine metabolism intermediates were also elevated in xenograft tumors derived from a representative PAX3-FOXO1+ cell line relative to tumors derived from a fusion-negative cell line in vivo, suggesting that the observed metabolic phenotypes are robust across environmental contexts (Fig. 1E).
Figure 1. Rhabdomyosarcoma subtypes harbor intrinsic metabolic differences.

A, Principal component analysis of targeted metabolomics data of 126 metabolites obtained from four RMS cell lines. Ellipses represent 95% confidence intervals within each sample group. B, Venn diagram depicting metabolites that discriminate between PAX3-FOXO1+ and fusion-negative RMS across two independent LC-MS experiments. Metabolites with variable importance in the projection (VIP) scores over 1.0 were included in the analysis. C, Schematic depicting de novo pyrimidine synthesis pathway. D, Levels of N-carbamoyl aspartate, dihydroorotate (DHO), deoxycytidine monophosphate (dCMP), cytidine monophosphate (CMP), and uridine. E, Levels of N-carbamoyl aspartate, dihydroorotate, orotate, and dCMP measured in vehicle-treated fusion-negative (RD) or PAX3-FOXO1+ (RH30) cell line-derived xenograft tumors. F, Volcano plot showing log2 fold change in metabolite abundance in RH30 cells expressing shRNA against PAX3-FOXO1 compared to cells expressing shRNA against Renilla luciferase (control). Cells were cultured with doxycycline for 72 h to induce shRNA expression. Pyrimidine metabolites are highlighted in teal. Dotted horizontal line indicates significance threshold FDR < 0.05. G, Heatmap depicting levels of pyrimidine metabolites in RH30 cells expressing shRNAs against PAX3-FOXO1, expressed as the log2-transformed fold change relative to shRenilla. Data are from same experiment as data shown in F. H, Heatmap of gene signature scores for pyrimidine, purine, and TCA cycle genes obtained from published single-cell RNA-sequencing data20 of KFR RMS cells expressing shRNA against PAX3-FOXO1 (shScramble serves as a control). Cells were ranked in order of increasing cycling progenitor signature score. Gene lists are provided in Supplementary Table 2. For D, data are mean ± s.d., n = 3 independent replicates. For E, data are mean ± s.d., n = 8 (RH30) or n = 6 (RD). Statistical significance was assessed by ordinary one-way ANOVA with Tukey’s multiple comparisons test with each PAX3-FOXO1+ cell line compared to each fusion-negative cell line (D) or unpaired two-tailed Student’s t test comparing RD and RH30 (E). (*P < 0.05, **P < 0.01, ***P < 0.001, ****P < 0.0001)
To determine whether the observed metabolic changes were a consequence of fusion status, we introduced doxycycline (dox)-inducible hairpins targeting PAX3-FOXO1 into RH30 cells. Three days of dox administration triggered robust loss of PAX3-FOXO1 and a modest decline in proliferation (Supplementary Fig. S1D, E), consistent with previous work demonstrating that only prolonged PAX3-FOXO1 repression induces growth arrest30. PAX3-FOXO1 silencing triggered changes in metabolites related to pyrimidine metabolism, with notable downregulation in de novo pyrimidine biosynthesis intermediates (Fig. 1F, G). The observation that N-carbamoyl aspartate and dihydroorotate, pyrimidine biosynthesis intermediates decreased in fusion-negative cells, are among the most downregulated metabolites following PAX3-FOXO1 silencing is consistent with the notion that pyrimidine biosynthesis is closely tied to PAX3-FOXO1 expression.
To determine whether changes in pyrimidine metabolism are a direct consequence of transactivation by PAX3-FOXO1 or secondary to cell state changes driven by PAX3-FOXO1 expression, we interrogated published datasets delineating direct PAX3-FOXO1 targets. Across five datasets profiling PAX3-FOXO1 chromatin occupancy38-40, known PAX3-FOXO1-target genes were reproducibly identified as directly bound by PAX3-FOXO1 (Supplementary Fig. S1F). In contrast, no pyrimidine synthesis genes emerged as reproducible PAX3-FOXO1 targets (Supplementary Fig. S1F). We therefore examined the alternate hypothesis that pyrimidine metabolism varies alongside RMS cell state. Analysis of transcriptional profiling of RH30 cells following acute PAX3-FOXO1 depletion30 revealed that PAX3-FOXO1 controls RMS cell state in cultured cells: following PAX3-FOXO1 degradation, genes related to fusion-negative cell states (MuSC, differentiated) were largely upregulated while genes related to fusion-positive cell states (cycling progenitor, S-phase) were largely downregulated (Supplementary Fig. S1G, H). Of the genes gradually downregulated following PAX3-FOXO1 degradation were three genes crucial for de novo pyrimidine synthesis: the trifunctional enzyme carbamoyl-phosphate synthetase 2, aspartate transcarbamylase and dihydroorotase (CAD), thymidylate synthase (TYMS) and dihydrofolate reductase (DHFR) (Supplementary Fig. S1I). DHFR and TYMS were likewise downregulated following expression of shRNA targeting PAX3-FOXO1 in two independent fusion-positive RMS cell lines, whereas CAD showed inconsistent effects (Supplementary Fig. S1J). To more broadly investigate metabolic gene expression across cell states, we ranked cells assessed by single cell-RNA-sequencing20 by their cycling progenitor gene signature score, confirming that cells expressing a hairpin targeting PAX3-FOXO1 overwhelmingly exhibited low scores for this PAX3-FOXO1-associated cell state (Fig. 1H). Consistently, cells exhibiting low cycling progenitor gene scores also exhibited lower levels of genes associated with pyrimidine synthesis, and to a lesser extent, purine synthesis, but not genes in unrelated metabolic pathways like the tricarboxylic acid (TCA) cycle (Fig. 1H). Thus, altered expression of pyrimidine related genes and altered pyrimidine metabolites are intrinsic features of PAX3-FOXO1+ cell states.
Genome-wide CRISPR screens reveal metabolic vulnerabilities specific to PAX3-FOXO1+ RMS
The above findings raise the possibility that transcriptional heterogeneity between malignant cell states in RMS is accompanied by distinct metabolic programs. To determine whether metabolic differences inherent to PAX3-FOXO1+ and fusion-negative RMS result in subtype-specific metabolic vulnerabilities, we leveraged genome-wide CRISPR screens from the DepMap project36. For every gene in the genome, the average essentiality score from 5 fusion-negative RMS lines was subtracted from the average score from 7 PAX3-FOXO1+ RMS lines, resulting in a differential essentiality score (Supplementary Table 3). Ranking genes by differential essentiality revealed PAX3 as the most differentially essential gene between the two RMS subtypes (Fig. 2A), likely because all four sgRNAs targeting PAX3 also target PAX3-FOXO1 (Supplementary Fig. S2A, B). In contrast, of the four sgRNAs targeting FOXO1, only the 2 that also target PAX3-FOXO1 were depleted in PAX3-FOXO1+ cell lines; consistently, FOXO1 was the 60th most differentially essential gene between the two subtypes (Supplementary Fig. S2A, B). Further validating the approach, MYOG, a muscle differentiation marker known to be more highly expressed in PAX3-FOXO1+ cells and tumors41, was the 2nd most differentially essential gene. Among metabolic genes, DHFR and TYMS emerged as the 1st and 3rd most differentially essential, respectively (Fig. 2B). Even when compared to all genes in the genome, DHFR ranked 9th and TYMS ranked 12th, ahead of MYCN (17th), a known driver oncogene in many cases of PAX3-FOXO1+ RMS40,42 (Fig. 2A). Differential dependence on DHFR/TYMS was not simply driven by fusion-negative RMS lines being unusually resistant to DHFR/TYMS inhibition: compared to all lines in DepMap, PAX3-FOXO1+ lines are more sensitive to loss of DHFR/TYMS, while fusion-negative RMS lines are not (Fig. 2C). Although DHFR and TYMS are involved in the folate cycle and pyrimidine biosynthesis, respectively, the two enzymes are tightly linked through dihydrofolate (DHF), which is both the product of TYMS enzymatic activity and the substrate for tetrahydrofolate (THF) production by DHFR (Fig. 2D). DHF inhibits TYMS by negative feedback inhibition43, and DHF accumulation is associated with cellular toxicity; accordingly, DHFR activity is required for sustained TYMS function in bacteria44. Indeed, in many bacterial species, DHFR and TYMS form a tightly coupled enzymatic unit in which TYMS activity cannot exceed that of DHFR45. Accordingly, the emergence of DHFR and TYMS as top dependencies in PAX3-FOXO1+ cells supports the hypothesis that dependence on de novo thymidine synthesis defines malignant PAX3-FOXO1+ cell states.
Figure 2. Genome-wide CRISPR screens reveal metabolic vulnerabilities specific to PAX3-FOXO1+ RMS.

A, Results of differential essentiality analysis comparing PAX3-FOXO1+ and fusion negative cell lines. Genes are ranked in descending order of differential essentiality. Data were obtained from DepMap 24Q2 release36. B, Bar graph of the top 15 metabolic genes more essential in PAX3-FOXO1+ RMS cell lines compared to fusion-negative RMS cell lines. DHFR and TYMS are highlighted in blue. Data were obtained from DepMap 24Q2 release36. C, Violin plots of gene essentiality scores (obtained from DepMap 24Q2 release) for DHFR and TYMS in fusion-negative RMS cell lines (n = 5), PAX3-FOXO1+ RMS cell lines (n = 7), or all other cell lines (n = 1,121). Lines represent median of each group. D, Schematic depicting DHFR and TYMS in the folate cycle (DHF = dihydrofolate; THF = tetrahydrofolate; 5,10-CH2-THF = 5,10-methylene THF; 10-CHO-THF = 10-formyl THF). E, Relative proliferation of RMS cells in response to DHFR editing using two independent sgRNAs (sgDHFR-1, sgDHFR-2). Data are shown as a percentage of control (sgAAVS1) for each cell line, and are mean ± s.d., n = 3 independent replicates. F, Summary of effects of DHFR loss on proliferation in 3 fusion-negative and 2 PAX3-FOXO1+ RMS cell lines. Data are from the same experiment as E. Significance was assessed using ordinary one-way ANOVA with Dunnett’s (C) or Tukey’s (E) multiple comparisons test. In C, each RMS subtype was compared to all other lines in DepMap. In E, for each sgRNA, each PAX3-FOXO1+ cell line was compared to each fusion-negative cell line. Significance displayed is reflective of all comparisons. (ns = not significant, **P < 0.01, ****P < 0.0001)
To validate the differential dependence on DHFR/TYMS, we engineered mutations in DHFR or TYMS in a panel of established RMS cell lines. To circumvent toxicity associated with loss of a common essential gene, cells were cultured with leucovorin calcium (rescue agent for folate antagonists46) when edited with sgRNA targeting DHFR or thymidine and cytidine (rescue agents for impaired de novo pyrimidine synthesis) when edited with sgRNA targeting TYMS. Of note, cell lines used in this study express equivalent levels of MTHFS, which encodes the enzyme that enables leucovorin to enter the folate cycle (Supplementary Fig. S2C, D). Following confirmation of successful editing (Supplementary Fig. S2E, F), the rescue agent was withdrawn and proliferation assessed. Across three fusion-negative cell lines, DHFR loss resulted in varying, yet modest, growth inhibition. In contrast, DHFR loss reduced proliferation by > 50% in two PAX3-FOXO1+ cell lines (Fig. 2E). Accordingly, across all sgRNAs and cell lines used, DHFR deletion was more detrimental to PAX3-FOXO1+ cells than to their fusion-negative counterparts (Fig. 2F). Similar results were obtained following TYMS deletion in two RMS cell lines, although TYMS loss was overall less well-tolerated than DHFR loss (Supplementary Fig. S2G). Together, these data demonstrate that DHFR/TYMS are selective vulnerabilities of PAX3-FOXO1+ RMS cell lines.
PAX3-FOXO1+ cells exhibit increased sensitivity to DHFR inhibition in vitro
Given the increased dependence of PAX3-FOXO1+ cells on DHFR, we asked whether DHFR inhibition represents a specific and targetable vulnerability in these cells. Methotrexate (MTX) is a well-established DHFR inhibitor and one of the oldest chemotherapeutic agents (Fig. 3A). Since its introduction in the 1960s, MTX has held an enduring role in the treatment of cancers including leukemia47 and osteosarcoma48, but its efficacy in PAX3-FOXO1+ RMS is largely unexplored. Previous, small-scale studies in RMS either occurred prior to recognition of PAX3-FOXO1 or enrolled few fusion-positive patients49-51. Of note, the one confirmed PAX3-FOXO1+ patient examined exhibited stable disease after MTX treatment and complete response to subsequent therapy50. Dose response curves revealed that PAX3-FOXO1+ cells were more sensitive than fusion-negative RMS cells to doses of MTX ranging from 0.2 to 200 μM (Fig. 3B). Consistently, whereas fusion-negative RMS cells maintained proliferation at approximately 50% of control rates despite the presence of 0.2 μM MTX, PAX3-FOXO1+ cells exhibited a more severe proliferative decline (RH30) or even an overall decrease in cell number (RH41) at this dose (Fig. 3C, D). Importantly, MTX sensitivity was not simply secondary to different growth rates, as no consistent differences emerged in basal proliferation rates of PAX3-FOXO1+ and fusion-negative lines (Supplementary Fig. S3A). To further test the model that PAX3-FOXO1 induces sensitivity to MTX, we expressed PAX3-FOXO1 in two fusion-negative RMS lines (SMS-CTR, RD) and non-transformed 10T1/2 cells (Supplementary Fig. S3B-D). In all cases, ectopic PAX3-FOXO1 expression exacerbated the impact of MTX on proliferation, demonstrating that PAX3-FOXO1 is sufficient to increase MTX sensitivity (Supplementary Fig. S3E-G).
Figure 3. PAX3-FOXO1+ cells exhibit increased sensitivity to DHFR inhibition in vitro.

A, Schematic of the folate cycle indicating targets of methotrexate (MTX). B, Dose response curve for MTX in RMS cell lines measured by CellTiter-Glo viability assay after 48 h of treatment. Maximum dose tested was 200 μM. C, Relative proliferation of RMS cells in response to MTX (0.2 μM) for 96 h. Data are shown as a percentage of the vehicle control (DMSO). D, Summary of the effects of MTX on relative proliferation from C. Each dot represents the average of all replicates from each cell line. E, Correlation matrix displaying Pearson correlation coefficients (r) for pairwise comparisons of metabolic effects of MTX in four RMS cell lines treated with MTX (0.2 μM) for 48 h. Correlation coefficients were calculated using the log2 fold change of MTX over vehicle (DMSO) for each metabolite. F, Volcano plots for two RMS cell lines (RH41, PAX3-FOXO1+ and RD, fusion-negative) showing the log2 fold change in metabolite abundance in cells treated with MTX (0.2 μM, 48 h) compared to cells treated with vehicle (DMSO). Dotted horizontal line indicates significance threshold FDR < 0.05. G, Relative proliferation of RMS cells in response to MTX (0.2 μM) in the presence or absence of thymidine (10 μM), hypoxanthine (100 μM), and/or cytidine (10 μM) for 96 h. Data are shown as a percentage of the vehicle control (DMSO, H2O, 0.1N NaOH). For B, C, and G, data are mean ± s.d., n = 3 independent replicates. Significance was assessed by ordinary one-way ANOVA with Tukey’s multiple comparisons test (B, C), unpaired two-tailed Student’s t-test (D), or 2-way ANOVA with Tukey’s multiple comparisons test (G). In B, C, and G, each PAX3-FOXO1+ cell line was compared to each fusion-negative cell line. For B, comparison shown at the 0.2 μM dose. (ns = not significant, *P < 0.05, **P < 0.01, ***P < 0.001, ****P < 0.0001)
DHFR executes two reactions: the sequential reduction of folic acid to DHF, then THF (Fig. 3A). Although folic acid is present in most standard cell culture media, 5-methyl tetrahydrofolate (5-meTHF) is the primary physiological folate source in vivo52,53 (Supplementary Fig. S4A). To test whether folic acid underlies differential MTX sensitivity, we replaced folic acid with 5-meTHF. As expected52,53, cells with 5-meTHF as their primary folate source were overall less sensitive to MTX (Supplementary Fig. S4B). Nevertheless, PAX3-FOXO1+ cells still exhibit greater sensitivity to MTX than fusion-negative cells, even with 5-meTHF as the primary folate source. (Supplementary Fig. S4B).
To further test the notion that PAX3-FOXO1+ cells are preferentially reliant on DHFR, but not folate metabolism more generally, we evaluated other drugs targeting the folate cycle. Neither pemetrexed, which inhibits multiple steps of the cycle, nor SHIN2, which targets serine hydroxymethyltransferase (SHMT) 1/2 (Supplementary Fig. S4A), exhibited differential efficacy in fusion-negative and PAX3-FOXO1+ RMS cells (Supplementary Fig. S4C, D, E). Of the many fates of the one-carbon units carried by the folate cycle, de novo purine biosynthesis is thought to represent the largest demand54; accordingly, MTX is frequently considered an anti-purine55. To assess the impact of purine synthesis inhibition, we treated cells with lometrexol, a phosphoribosylglycinamide formyltransferase (GART) inhibitor. Notably, lometrexol had equivalent effects on viability and proliferation in PAX3-FOXO1+ and fusion-negative RMS cells (Supplementary Fig. S4F, G, H). More generally, actinomycin D, which intercalates DNA to block transcription56, and cyclophosphamide, a DNA alkylating agent57, are currently deployed in standard-of-care chemotherapeutic regimens for RMS patients13, but PAX3-FOXO1+ and fusion-negative cells did not exhibit differential sensitivity to either actinomycin D or 4-hydroperoxy cyclophosphamide (4-HC), the active metabolite of cyclophosphamide (Supplementary Fig. S4I, J, K). Thus, of all drugs evaluated, differential drug sensitivity between RMS subtypes is unique to DHFR inhibition via MTX.
Demand for nucleotides underlies methotrexate sensitivity
We next asked why PAX3-FOXO1+ cells are more sensitive to MTX than their fusion-negative counterparts. To our surprise, the metabolic response to MTX was largely independent of RMS subtype: across all 4 lines, MTX induced highly correlated metabolic changes (Pearson r > 0.9) (Fig. 3E). The equivalent effects of MTX in all cell lines demonstrates that differential MTX sensitivity is not due to altered drug uptake or metabolism.
We therefore examined individual metabolites to determine which limit proliferation in MTX-treated cells. Consistent with the noted anti-purine effects of MTX55, purine nucleotides including adenosine triphosphate (ATP), inosine triphosphate (ITP), and deoxyguanosine triphosphate (dGTP) were consistently decreased (Fig. 3F, Supplementary Fig. S5A). However, hypoxanthine, a purine salvage precursor that mitigates MTX toxicity in certain circumstances58,59, failed to rescue growth inhibition by MTX, and even sensitized one cell line (RH30) to MTX (Supplementary Fig. S5B). These results are consistent with the observations that folate cycle and purine biosynthesis inhibitors are equivalently effective across RMS cell lines and argue that MTX sensitivity in PAX3-FOXO1+ cells does not result from increased demand for de novo purine biosynthesis. Furthermore, despite declines in ATP levels following MTX treatment, mitochondrial oxygen consumption was not consistently affected by MTX, in line with previous reports60, suggesting that changes in mitochondrial respiration are unlikely to contribute to differential MTX sensitivity between RMS subtypes (Supplementary Fig. S5C).
We therefore tested the hypothesis that differential sensitivity to MTX arises from inhibition of de novo thymidine synthesis. MTX has been shown to interfere with de novo thymidine synthesis via TYMS inhibition43, and thymidine supplementation can rescue certain cells from MTX61,62. Indeed, MTX strongly depleted pyrimidine nucleotides thymidine diphosphate (TDP) and thymidine triphosphate (TTP) as well as pyrimidine synthesis intermediates N-carbamoyl aspartate and dihydroorotate (Fig. 3F, Supplementary Fig. S5A). Thymidine supplementation alone proved effective at rescuing fusion-negative cell lines from MTX, restoring proliferation to 73% (RD) and 77% (SMS-CTR) of untreated cells (Fig. 3G). In contrast, thymidine had a more modest (RH30, 52%) or no (RH41) ability to rescue PAX3-FOXO1+ cells from MTX (Fig. 3G). Whereas hypoxanthine alone had little effect, co-treatment with hypoxanthine and thymidine fully rescued proliferation in fusion-negative cells, demonstrating that thymidine synthesis is the most acute limitation for these cells, and combined restoration of thymidine and purine synthesis restores proliferation of fusion-negative RMS cells in the presence of MTX (Fig. 3G). In contrast, PAX3-FOXO1+ cells maintained a significant proliferative defect despite improved proliferation in the presence of hypoxanthine and thymidine (Fig. 3G). Given that MTX also reduced levels of intermediates involved in de novo pyrimidine synthesis (Fig. 3F, Supplementary Fig. S5A), we further supplemented cells with the remaining pyrimidine nucleoside, cytidine. The combined addition of thymidine, cytidine, and hypoxanthine fully restored proliferation of MTX-treated PAX3-FOXO1+ cells to control levels (Fig. 3G).
As serum contains small molecules that could contribute to nucleotide synthesis and affect the response to MTX, we repeated the above experiments using dialyzed serum. Consistent with previous findings63, all cells were dramatically sensitized to MTX in dialyzed serum, and this sensitivity was reversed by thymidine and hypoxanthine supplementation (Supplementary Fig. S5D). As before, thymidine and hypoxanthine supplementation is sufficient to fully rescue proliferation of fusion-negative cells treated with MTX, whereas PAX3-FOXO1+ cells maintained a significant growth defect under these conditions. Only the combined addition of hypoxanthine, thymidine and cytidine enabled PAX3-FOXO1+ cells to approach normal proliferation rates in the presence of MTX (Supplementary Fig. S5D). Collectively, these observations indicate that MTX impairs proliferation by limiting nucleotide synthesis, as restoring nucleotides is sufficient to reverse growth inhibition in MTX-treated cells. Furthermore, the requirement for both cytidine and thymidine to rescue PAX3-FOXO1+ cells, but not fusion-negative cells, reveals that increased demand for pyrimidine nucleotides contributes to MTX sensitivity in PAX3-FOXO1+ cell lines.
Methotrexate phenocopies loss of PAX3-FOXO1
The observation that demand for pyrimidine nucleotides drives differential MTX sensitivity in RMS cell lines led us to hypothesize that MTX could target PAX3-FOXO1-driven cell states. Suggestively, PAX3-FOXO1 silencing, which downregulates genes associated with the cycling progenitor cell state, also downregulates pyrimidine-related genes including DHFR and TYMS (Supplementary Fig. S6A, B). We therefore compared the metabolic response of PAX3-FOXO1 silencing to that of MTX treatment in RH30 cells. Principal component analysis revealed that cells treated with MTX or in which PAX3-FOXO1 was silenced clustered together, away from their respective controls, suggesting underlying similarities in the metabolic effects of MTX and PAX3-FOXO1 silencing (Fig. 4A). Indeed, across all profiled metabolites, changes induced by PAX3-FOXO1 silencing significantly correlated with changes induced by MTX (Fig. 4B). The correlation persisted even when only pyrimidine-related metabolites were assessed, driven in part by coordinated downregulation of N-carbamoyl aspartate, dihydroorotate, TDP, and TTP following both MTX treatment and PAX3-FOXO1 silencing (Fig. 4B).
Figure 4. Methotrexate phenocopies loss of PAX3-FOXO1.

A, Principal component analysis of RH30 cells treated with vehicle (DMSO) or MTX (0.2 μM) for 48 h, and RH30 cells expressing shRNA against Renilla luciferase (control) or PAX3-FOXO1 (cultured with doxycycline for 72 h to induce knockdown). MTX data were previously shown in Fig. 1A and shPAX3-FOXO1 data were previously shown in Fig. 1D. 101 metabolites were included in analysis. B, Scatter plot of metabolic data shown in A comparing metabolic effects of MTX and PAX3-FOXO1 silencing in RH30 cells. Pyrimidine metabolites are highlighted in teal. C, Overrepresentation analysis of genes significantly (Padj < 0.05) upregulated (“up with MTX”) or downregulated (“down with MTX”) upon MTX treatment in two PAX3-FOXO1+ cell lines (RH30, RH41). Analysis was performed using cell fate gene lists detailed in Supplementary Table 2. Cells were treated with MTX (0.2 μM) for 48 h. D, Gene set enrichment analysis (GSEA) depicting the effect of MTX on cell fate gene lists in two PAX3-FOXO1+ cell lines (RH30, RH41). Cells were treated with MTX (0.2 μM) for 48 h. E, Heatmap of Pearson correlation coefficients (r) comparing transcriptional effects of MTX (in each RMS cell line) against effects of PAX3-FOXO1 silencing (in KFR cell line, published data20). Correlation coefficients were calculated for all genes and for genes involved in cell fate. Cells were treated with MTX (0.2 μM) for 48 h. F, Heatmap depicting normalized enrichment scores from GSEA analysis of data from four MTX-treated RMS cell lines. Gene lists (1, 2, and 3) are composed of genes significantly upregulated or downregulated by PAX3-FOXO1 in three independent published experiments20,66. G, Gene set signature scores in published RNA-sequencing of RMS patient tumors33 using gene lists composed of genes significantly (P < 0.05) upregulated (“MTX up”) or downregulated (“MTX down”) by MTX in two PAX3-FOXO1+ cell lines (RH30, RH41). Gene lists are provided in Supplementary Table 2. Significance was assessed in G by unpaired two-tailed Student’s t test comparing RMS subtypes. (*P < 0.05, **P < 0.01, ****P < 0.0001)
Declines in N-carbamoyl aspartate and dihydroorotate could be driven by allosteric inhibition of CAD, which responds to changes in pyrimidines including (d)UTP and (d)UDP64,65. Although metabolites including uridine and deoxyuridine accumulate following MTX treatment (Fig. 4B), uridine salvage does not appear to be increased by MTX, as MTX exerted modest and variable effects on incorporation of uridine analog 5-ethynyl uridine into cellular nucleotide pools (Supplementary Fig. S6C). Accordingly, MTX treatment tended to decrease, rather than increase, expression of uridine salvage enzymes UCK1/2 (Supplementary Fig. S6D). More broadly, declines in pyrimidine biosynthesis intermediates did not appear secondary to salvage of exogenous metabolites, as MTX triggered similar declines in N-carbamoyl aspartate and dihydroorotate even when cells were cultured in dialyzed serum (Supplementary Fig. S6E). Thus, whereas blockage in dUMP usage for thymidine synthesis driven by MTX treatment or PAX3-FOXO1 silencing may lead to a backup of pyrimidine nucleotides or other metabolites that inhibit CAD, MTX itself does not appear to noticeably increase pyrimidine salvage pathway activity.
Given the similar effects of MTX treatment and PAX3-FOXO1 on cell metabolism—and, in particular, on pyrimidine metabolism—we asked whether these metabolic changes accompany cell state changes. RNA-sequencing of cells exposed to MTX for 48 h revealed that genes defining the PAX3-FOXO1-driven cycling progenitor and S-phase cell states were significantly overrepresented among genes decreased by MTX in both RH30 and RH41 cells (Fig. 4C). Reciprocally, genes defining the fusion-negative associated MuSC cell state were significantly overrepresented among genes upregulated by MTX in both PAX3-FOXO1+ cell lines (Fig. 4C). More broadly, gene set enrichment analysis of each line’s response to MTX revealed that genes downregulated by MTX were significantly enriched for genes defining the cycling progenitor cell state whereas genes defining the fusion-negative MuSC cell state were enriched among genes upregulated by MTX in PAX3-FOXO1+ cells (Fig. 4D). Similar trends were observed in fusion-negative cells, although the effect of MTX on gene expression was less consistent than in PAX3-FOXO1+ cells (Supplementary Fig. S6F). Importantly, the proportion of cells in S-phase was largely consistent between PAX3-FOXO1+ and fusion-negative cell lines, either in untreated or MTX-treated cells (Supplementary Fig. S6G). Together, these results indicate that MTX alters RMS cell state gene expression programs, particularly in PAX3-FOXO1+ cells, without exerting differential effects on cell cycle distribution in different RMS subtypes.
Given the above similarities between MTX and PAX3-FOXO1 silencing on metabolism and gene expression programs, we directly compared the impact of MTX and PAX3-FOXO1 silencing on transcriptional networks. Across all genes in the genome, changes induced by MTX significantly correlated with changes induced by PAX3-FOXO1 silencing. This correlation increased when focusing on genes related to RMS cell states (Fig. 4E). More generally, genes identified as up- or down-regulated across three separate experiments assessing the impact of PAX3-FOXO1 silencing20,66 were significantly enriched among genes up- and down-regulated, respectively, following MTX treatment (Fig. 4F). Reciprocally, genes reproducibly upregulated by MTX across PAX3-FOXO1+ RMS cell lines tended to be expressed at lower levels in PAX3-FOXO1+ tumors whereas genes repressed by MTX tended to be expressed at higher levels in PAX3-FOXO1+ tumors (Fig. 4G). Taken together, these results demonstrate that MTX mimics the transcriptional and metabolic effects of PAX3-FOXO1 inhibition, supporting the notion that MTX targets PAX3-FOXO1-dependent cell states.
Methotrexate is effective as a single agent in PAX3-FOXO1+ tumors
To investigate how RMS tumors respond to MTX in vivo, we xenografted RMS cell lines and once tumors reached 100 mm3 in size, we treated mice with 30 mg/kg MTX three times a week—a dose approximately 10-fold lower than those mimicking pediatric high-dose MTX regimens in mice (400 mg/kg)67. 24 h after each dose, mice were provided leucovorin calcium, a rescue agent employed clinically to mitigate toxicity following MTX treatment (Fig. 5A). This dose regimen of MTX was well-tolerated, and mouse weights remained relatively constant throughout treatment in all groups (Supplementary Fig. S7A, B). Neither fusion-negative xenograft responded to MTX, and MTX neither slowed tumor growth rate (Fig. 5B, C) nor affected survival of mice engrafted with these cell lines (Fig. 5D). In contrast, both xenografts derived from PAX3-FOXO1+ cell lines showed a striking response to MTX, which noticeably slowed tumor growth (Fig. 5E, F). Accordingly, MTX was sufficient to significantly prolong survival of mice bearing PAX3-FOXO1+ xenografts when compared to matched vehicle controls, even when provided as a single agent (Fig. 5G).
Figure 5. Methotrexate is effective as a single agent in PAX3-FOXO1+ tumors.
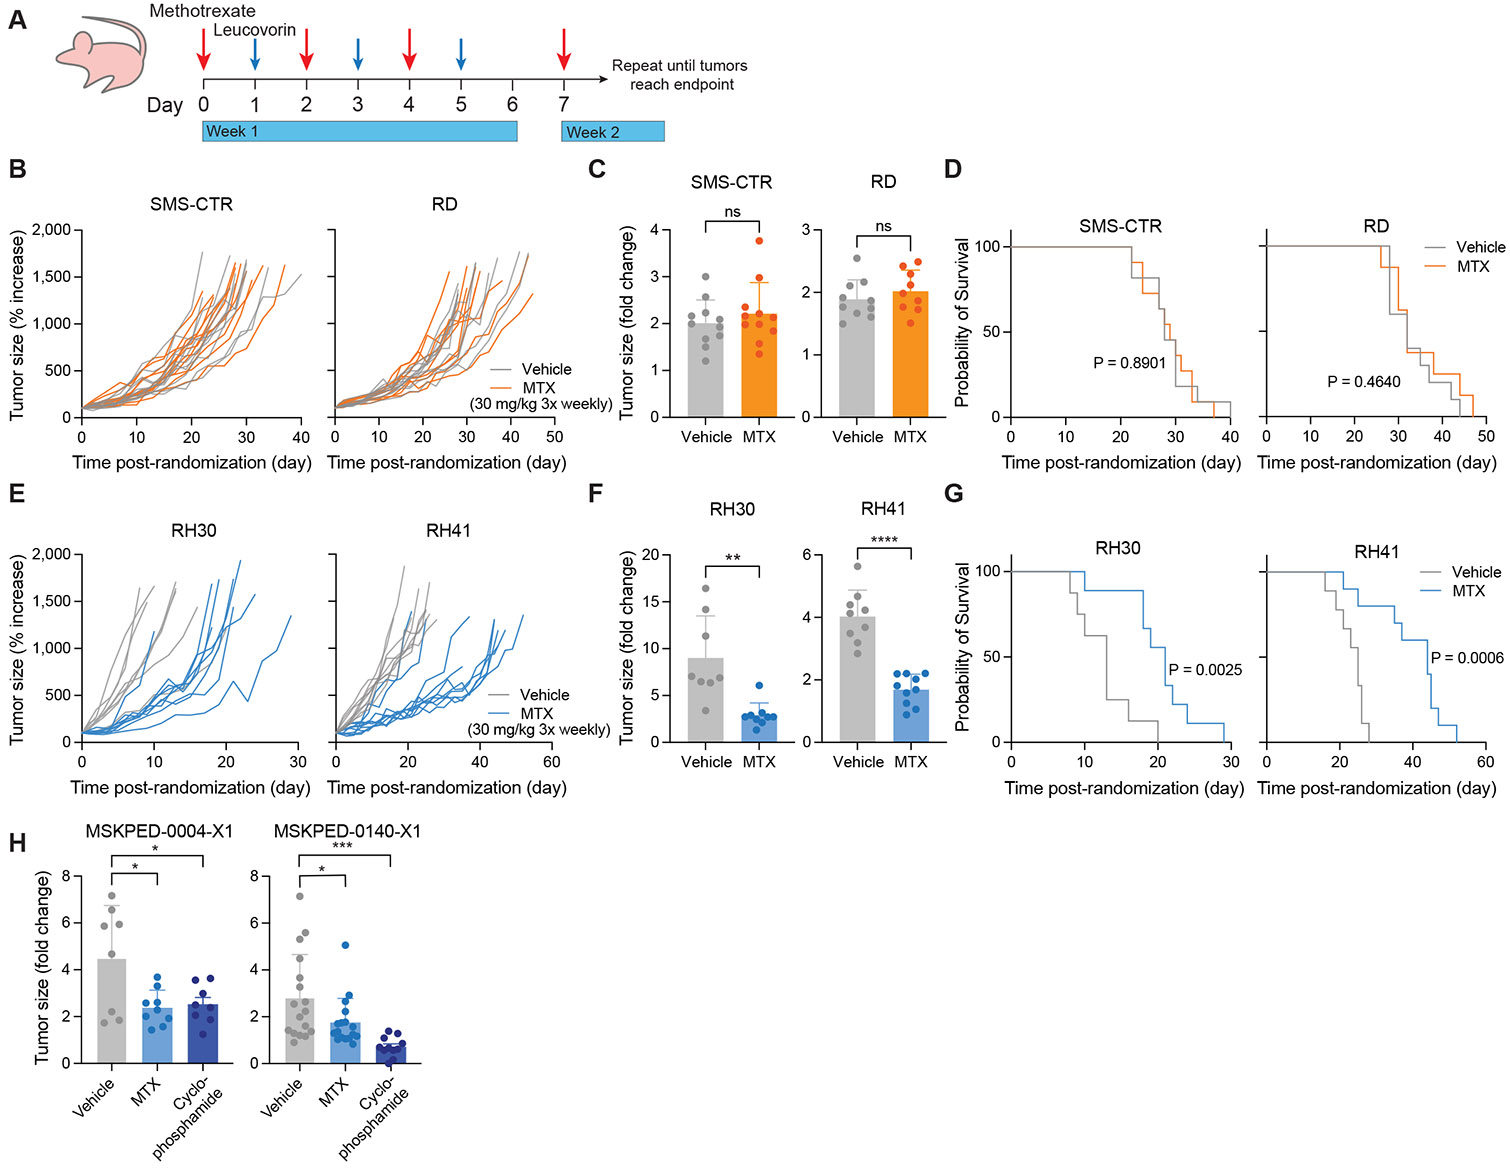
A, Schematic depicting dosing strategy for methotrexate and leucovorin rescue in RMS cell line xenograft experiments. B, E, Tumor growth curves for fusion-negative RMS (B, SMS-CTR and RD) and PAX3-FOXO1+ RMS (E, RH30 and RH41) cell line xenografts. Data are normalized to tumor size at the start of treatment. C, F, Change in tumor size for fusion-negative RMS (C, SMS-CTR and RD) and PAX3-FOXO1+ RMS (F, RH30 and RH41) cell line xenografts over the first week (6-8 d) of treatment with vehicle (corn oil) or MTX. Data are shown as a fold change relative to tumor size at the start of treatment. D, G, Survival curves for mice bearing fusion-negative RMS (D, SMS-CTR and RD) or PAX3-FOXO1+ RMS (G, RH30 and RH41) cell line xenografts. H, Change in tumor size for two PAX3-FOXO1+ PDX models (MSKPED-0004-X1, left and MSKPED-0140-X1, right) over the first week of treatment with vehicle (corn oil), MTX, or cyclophosphamide. Data are shown as a fold change relative to tumor size at the start of treatment. Data are mean ± s.d. For SMS-CTR (B, C, D), n = 11. For RD (B, C, D), n = 10 (vehicle) or 9 (MTX). For RH30 (E, F, G), n = 8 (vehicle) or 9 (MTX). For RH41 (E, F, G), n = 9 (vehicle) or 10 (MTX). For MSKPED-0004-X1 (H), n = 8 (vehicle, cyclophosphamide) or 9 (MTX). For MSKPED-0140-X1 (H), n = 17 (vehicle, MTX) or 11 (cyclophosphamide). Significance was assessed by log-rank (Mantel-Cox) test (D, G), unpaired two-tailed Student’s t-test (C, F), or ordinary one-way ANOVA with Dunnett’s multiple comparisons test (H). In H, each treatment group was compared to vehicle control. (ns = not significant, *P < 0.05, **P < 0.01, ***P < 0.001, ****P < 0.0001)
We next evaluated the efficacy of MTX in two patient-derived xenograft (PDX) PAX3-FOXO1+ RMS models. Of note, cyclophosphamide, currently employed in standard-of-care regimens, was effective at slowing tumor growth and prolonging survival in only one of two examined PAX3-FOXO1+ PDX models (Supplementary Fig. S7C, D). Nevertheless, MTX was effective in significantly slowing tumor growth during the first week of treatment in both PAX3-FOXO1+ PDX models (Fig. 5H), including a highly aggressive and chemoresistant model (MSKPED-0004-X1). When leucovorin administration was appropriately delayed, MTX was sufficient to prolong survival (Supplementary Fig. S7D). When leucovorin was provided continuously after an initial 24 h delay (Supplementary Fig. S7C), MTX was initially effective at slowing growth, but this effect was not durable. While there is ample scope to improve dosing strategies, these data indicate that MTX treatment can slow tumor growth—and even increase survival—in PAX3-FOXO1+ RMS models.
Discussion
Here we show that PAX3-FOXO1+ RMS cells exhibit dependence on pyrimidine synthesis that can be exploited with MTX. New therapies are urgently needed for pediatric patients with PAX3-FOXO1+ tumors, who face grim prognosis. As targeting transcription factors is notoriously difficult, our work suggests that targeting metabolic vulnerabilities inherent to the PAX3-FOXO1-driven cell state represents an alternative and tractable strategy for treating PAX3-FOXO1+ tumors. MTX has the additional advantage of being well-tolerated clinically: leucovorin enables safe administration of high doses, even in pediatric patients46, such that over 10 years, less than two percent of pediatric patients receiving high-dose MTX required intense supportive care68. Furthermore, the dose of 30 mg/kg utilized in this study for in vivo experiments is approximately equivalent to a dose of 90 mg/m2 in humans69, appreciably lower than the 500 mg/m2 considered the minimum for high-dose MTX46 and over 100-fold lower than doses used in osteosarcoma patients48. The potential to leverage a relatively low dose of MTX for PAX3-FOXO1+ RMS provides ample scope for combination with existing chemotherapies, possibly allowing for administration of lower and less toxic doses of current standard-of-care drugs. The possibility of lowering chemotherapy doses is particularly appealing given that even when successful, aggressive cancer treatment at a young age—especially involving radiation or chemotherapy with alkylating agents like cyclophosphamide—puts pediatric cancer survivors at greater risk for adverse health outcomes later in life, including other cancers70. Further optimization of the delivery and dosing schedule for MTX—with accompanying leucovorin rescue—and potential for combination with existing therapeutic options will be a critical direction for future investigation.
Why PAX3-FOXO1+ cells are preferentially sensitive to MTX, but not other antifolates, remains to be determined. The observation that both PAX3-FOXO1+ cells and fusion-negative cells have similar metabolic responses to MTX (Fig. 3E) argues against drug uptake, efflux, or metabolism as drivers of differential MTX sensitivity. The specific sensitivity to MTX is reminiscent of clinical practice in osteosarcoma, where MTX is a mainstay of patient care48 whereas pemetrexed demonstrates much lower efficacy in established osteosarcoma cell lines in vitro71. Indeed, individual antifolates have highly distinct use cases, underscoring the context-specific efficacy of each drug72. Why these drugs have different clinical applications remains unknown but likely stems from their specific mechanisms of action. For example, although both MTX and pemetrexed target DHFR, TYMS, and GART, DHFR is MTX’s primary target whereas TYMS is pemetrexed’s primary target72,73. In the context of high pyrimidine synthesis, only DHFR inhibition will trigger DHF buildup, which has been reported to be toxic in certain cases44,45, perhaps explaining why MTX exerts more toxicity than pemetrexed. Whether newer versions of MTX like pralatrexate are effective in PAX3-FOXO1+ RMS remains to be determined, and future studies investigating specific determinants of antifolate sensitivity will provide key mechanistic insights as to how best to deploy each agent.
Our data indicate that MTX specifically targets the PAX3-FOXO1-driven malignant cell state. Although PAX3-FOXO1 does not directly activate pyrimidine biosynthesis genes, expression of these genes depends on sustained PAX3-FOXO1 expression and PAX3-FOXO1 loss reduces metabolites associated with pyrimidine biosynthesis. Our results are consistent with the notion that PAX3-FOXO1 induces a metabolic addiction, akin to oncogene addiction, in which the specific metabolic program directed by PAX3-FOXO1 (pyrimidine synthesis) is required for survival of PAX3-FOXO1+ cells. Accordingly, targeting pyrimidine synthesis with MTX mimics loss of PAX3-FOXO1, recapitulating the metabolic and transcriptional effects of PAX3-FOXO1 silencing. The observation that MTX sensitivity is reversed by providing exogenous pyrimidines supports the notion that pyrimidine dependence is a targetable liability of PAX3-FOXO1+ cells.
Intriguingly, induction of a DHFR-dependent metabolic state may be a general principle of PAX3 activation. During development, PAX3 plays a critical role in the formation of skeletal muscle and the central nervous system74, and Pax3 mutant mice exhibit neural tube defects that can be mitigated by supplementation of folic acid but not formate75. These observations indicate that defects in DHFR activity specifically, but not one-carbon metabolism broadly, underlie developmental disorders driven by reduced PAX3 function and suggest that PAX3-FOXO1+ malignant cell states mimic aspects of PAX3-directed cell states during normal development. Determining why PAX3-driven cell states have increased demand for DHFR activity—whether because of increased demand for or reduced ability to salvage pyrimidine nucleotides or general sensitivity to nucleotide imbalance—will provide important insight into additional strategies to treat diseases driven by aberrant PAX3 transcriptional activity.
More broadly, this work reinforces the notion that identifying metabolic dependencies of distinct cell states will provide opportunities to refine therapeutic approaches for solid tumors like RMS. Although the metabolic landscape of pediatric solid tumors like RMS is still relatively unexplored, the concept of targeting metabolism for cancer treatment is as old as chemotherapy itself. MTX, one of the first antimetabolites, has been continuously used for over sixty years to treat various cancers, both as frontline and relapse therapy72. However, like all traditional chemotherapies, it has not had universal success, highlighting the need to identify specific disease subtypes and cell states in which MTX will be most effective. Continued exploration of metabolic dependencies of malignant cell states is likely to provide new avenues to treat pediatric cancers, where low mutational burden, especially in fusion-positive RMS where PAX3-FOXO1 (or alternate fusion PAX7-FOXO1) is itself the main oncogenic driver, presents a significant challenge to targeted therapy development33. Alternative approaches exploiting the metabolic rewiring necessary for maintenance of aberrant cell fate programs may result in unique metabolic vulnerabilities that can be leveraged for therapeutic benefit.
Supplementary Material
Significance.
PAX3-FOXO1+ rhabdomyosarcoma cells and tumors exhibit increased sensitivity to DHFR inhibition via methotrexate, identifying a potential therapeutic vulnerability that can be exploited to treat this aggressive pediatric sarcoma.
Acknowledgements
We thank members of the Finley lab, Santosh Vardhana, Jovana Pavisic, and Damon Reed for discussion and Andrew Intlekofer for use of shared LC-MS instrumentation. K.I.P. was supported by a Bruce Charles Forbes Pre-Doctoral Fellowship (MSKCC). J.S.B. was supported by a Human Frontier Science Program Fellowship (L1000200/2021-L) and is a Kravis WiSE Fellow (MSKCC). A.M.M. is supported by a T32 training grant from the NICHD (T32HD060600-15). B.T.J. is supported by a Ruth L. Kirschstein Predoctoral fellowship from the NICHD (no. F30HD107943). S.C. is an MSK Bridge Scholar and Damon Runyon SPARK Scholar. A.X. is supported by a Ruth L. Kirschstein Predoctoral fellowship from the NCI (no. F30CA284711-01). B.T.J. and A.X. were additionally supported by a Medical Scientist Training Program grant from the NIGMS of the National Institutes of Health under award number T32GM152349 to the Weill Cornell/Rockefeller/Sloan Kettering Tri-Institutional MD-PhD Program. L.W.S.F. is a New York Stem Cell Foundation – Robertson Investigator. We acknowledge the use of the Integrated Genomics Operation Core, funded by the NCI Cancer Center Support Grant (CCSG, P30 CA08748), Cycle for Survival, and the Marie-Josée and Henry R. Kravis Center for Molecular Oncology. This work was additionally supported by grants from the NYSCF, the Pershing Square Sohn Foundation, the Geoffrey Beene Cancer Research Center (to L.W.S.F.), the PaulieStrong Foundation (to F.D.C.), the Tow Center for Developmental Oncology at MSKCC (to L.W.S.F. and F.D.C.) and the Memorial Sloan Kettering Cancer Center Support Grant (P30CA08748).
Footnotes
The authors declare no potential conflicts of interest.
References
- 1.Tippetts TS, Sieber MH, Solmonson A. Beyond energy and growth: the role of metabolism in developmental signaling, cell behavior and diapause. Development. Oct 15 2023;150(20):dev201610. [DOI] [PMC free article] [PubMed] [Google Scholar]
- 2.Jackson BT, Finley LWS. Metabolic regulation of the hallmarks of stem cell biology. Cell Stem Cell. Feb 1 2024;31(2):161–180. [DOI] [PMC free article] [PubMed] [Google Scholar]
- 3.Tu WB, Christofk HR, Plath K. Nutrient regulation of development and cell fate decisions. Development. Oct 15 2023;150(20) [Google Scholar]
- 4.Erez A, DeBerardinis RJ. Metabolic dysregulation in monogenic disorders and cancer - finding method in madness. Nat Rev Cancer. Jul 2015;15(7):440–8. [DOI] [PubMed] [Google Scholar]
- 5.DeBerardinis RJ, Thompson CB. Cellular metabolism and disease: what do metabolic outliers teach us? Cell. Mar 16 2012;148(6):1132–44. [DOI] [PMC free article] [PubMed] [Google Scholar]
- 6.Xiao Y, Yu TJ, Xu Y, et al. Emerging therapies in cancer metabolism. Cell Metab. Aug 8 2023;35(8):1283–1303. [DOI] [PubMed] [Google Scholar]
- 7.Egler RA, Ahuja SP, Matloub Y. L-asparaginase in the treatment of patients with acute lymphoblastic leukemia. J Pharmacol Pharmacother. Apr-Jun 2016;7(2):62–71. [DOI] [PMC free article] [PubMed] [Google Scholar]
- 8.Farber S, Diamond LK. Temporary remissions in acute leukemia in children produced by folic acid antagonist, 4-aminopteroyl-glutamic acid. N Engl J Med. Jun 3 1948;238(23):787–93. [DOI] [PubMed] [Google Scholar]
- 9.Lurain JR, Elfstrand EP. Single-agent methotrexate chemotherapy for the treatment of nonmetastatic gestational trophoblastic tumors. Am J Obstet Gynecol. Feb 1995;172(2 Pt 1):574–9. [DOI] [PubMed] [Google Scholar]
- 10.Whelan JS, Davis LE. Osteosarcoma, Chondrosarcoma, and Chordoma. J Clin Oncol. Jan 10 2018;36(2):188–193. [DOI] [PubMed] [Google Scholar]
- 11.Luengo A, Gui DY, Vander Heiden MG. Targeting Metabolism for Cancer Therapy. Cell Chem Biol. Sep 21 2017;24(9):1161–1180. [DOI] [PMC free article] [PubMed] [Google Scholar]
- 12.Finley LWS. What is cancer metabolism? Cell. Apr 13 2023;186(8):1670–1688. [DOI] [PMC free article] [PubMed] [Google Scholar]
- 13.Skapek SX, Ferrari A, Gupta AA, et al. Rhabdomyosarcoma. Nat Rev Dis Primers. Jan 7 2019;5(1):1. [DOI] [PMC free article] [PubMed] [Google Scholar]
- 14.Parham DM, Barr FG. Classification of rhabdomyosarcoma and its molecular basis. Adv Anat Pathol. Nov 2013;20(6):387–97. [DOI] [PMC free article] [PubMed] [Google Scholar]
- 15.Meza JL, Anderson J, Pappo AS, Meyer WH. Analysis of prognostic factors in patients with nonmetastatic rhabdomyosarcoma treated on intergroup rhabdomyosarcoma studies III and IV: the Children's Oncology Group. J Clin Oncol. Aug 20 2006;24(24):3844–51. [DOI] [PubMed] [Google Scholar]
- 16.Breneman JC, Lyden E, Pappo AS, et al. Prognostic factors and clinical outcomes in children and adolescents with metastatic rhabdomyosarcoma--a report from the Intergroup Rhabdomyosarcoma Study IV. J Clin Oncol. Jan 1 2003;21(1):78–84. [DOI] [PubMed] [Google Scholar]
- 17.Hettmer S, Li Z, Billin AN, et al. Rhabdomyosarcoma: current challenges and their implications for developing therapies. Cold Spring Harb Perspect Med. Nov 3 2014;4(11):a025650. [DOI] [PMC free article] [PubMed] [Google Scholar]
- 18.Heske CM, Chi YY, Venkatramani R, et al. Survival outcomes of patients with localized FOXO1 fusion-positive rhabdomyosarcoma treated on recent clinical trials: A report from the Soft Tissue Sarcoma Committee of the Children's Oncology Group. Cancer. 2020;127(6):946–956. [DOI] [PMC free article] [PubMed] [Google Scholar]
- 19.Heinz AT, Schonstein A, Ebinger M, et al. Significance of fusion status, Oberlin risk factors, local and maintenance treatment in pediatric and adolescent patients with metastatic rhabdomyosarcoma: Data of the European Soft Tissue Sarcoma Registry SoTiSaR. Pediatr Blood Cancer. Jan 2024;71(1):e30707. [DOI] [PubMed] [Google Scholar]
- 20.Danielli SG, Porpiglia E, De Micheli AJ, et al. Single-cell profiling of alveolar rhabdomyosarcoma reveals RAS pathway inhibitors as cell-fate hijackers with therapeutic relevance. Sci Adv. Feb 10 2023;9(6):eade9238. [DOI] [PMC free article] [PubMed] [Google Scholar]
- 21.Danielli SG, Wei Y, Dyer MA, et al. Single cell transcriptomic profiling identifies tumor-acquired and therapy-resistant cell states in pediatric rhabdomyosarcoma. Nat Commun. Jul 26 2024;15(1):6307. [DOI] [PMC free article] [PubMed] [Google Scholar]
- 22.Ran FA, Hsu PD, Wright J, Agarwala V, Scott DA, Zhang F. Genome engineering using the CRISPR-Cas9 system. Nat Protoc. Nov 2013;8(11):2281–2308. [DOI] [PMC free article] [PubMed] [Google Scholar]
- 23.Fellmann C, Hoffmann T, Sridhar V, et al. An optimized microRNA backbone for effective single-copy RNAi. Cell Rep. Dec 26 2013;5(6):1704–13. [DOI] [PubMed] [Google Scholar]
- 24.Pelossof R, Fairchild L, Huang CH, et al. Prediction of potent shRNAs with a sequential classification algorithm. Nat Biotechnol. Apr 2017;35(4):350–353. [DOI] [PMC free article] [PubMed] [Google Scholar]
- 25.Garcia-Canaveras JC, Lancho O, Ducker GS, et al. SHMT inhibition is effective and synergizes with methotrexate in T-cell acute lymphoblastic leukemia. Leukemia. Feb 2021;35(2):377–388. [DOI] [PMC free article] [PubMed] [Google Scholar]
- 26.Pang Z, Lu Y, Zhou G, et al. MetaboAnalyst 6.0: towards a unified platform for metabolomics data processing, analysis and interpretation. Nucleic Acids Res. Jul 5 2024;52(W1):W398–W406. [DOI] [PMC free article] [PubMed] [Google Scholar]
- 27.Liao Y, Smyth GK, Shi W. featureCounts: an efficient general purpose program for assigning sequence reads to genomic features. Bioinformatics. Apr 1 2014;30(7):923–30. [DOI] [PubMed] [Google Scholar]
- 28.Love MI, Huber W, Anders S. Moderated estimation of fold change and dispersion for RNA-seq data with DESeq2. Genome Biol. 2014;15(12):550. [DOI] [PMC free article] [PubMed] [Google Scholar]
- 29.Wu T, Hu E, Xu S, et al. clusterProfiler 4.0: A universal enrichment tool for interpreting omics data. Innovation (Camb). Aug 28 2021;2(3):100141. [DOI] [PMC free article] [PubMed] [Google Scholar]
- 30.Zhang S, Wang J, Liu Q, et al. PAX3-FOXO1 coordinates enhancer architecture, eRNA transcription, and RNA polymerase pause release at select gene targets. Mol Cell. Dec 1 2022;82(23):4428–4442 e7. [DOI] [PMC free article] [PubMed] [Google Scholar]
- 31.Chen S, Zhou Y, Chen Y, Gu J. fastp: an ultra-fast all-in-one FASTQ preprocessor. Bioinformatics. Sep 1 2018;34(17):i884–i890. [DOI] [PMC free article] [PubMed] [Google Scholar]
- 32.Dobin A, Davis CA, Schlesinger F, et al. STAR: ultrafast universal RNA-seq aligner. Bioinformatics. Jan 1 2013;29(1):15–21. [DOI] [PMC free article] [PubMed] [Google Scholar]
- 33.Shern JF, Chen L, Chmielecki J, et al. Comprehensive genomic analysis of rhabdomyosarcoma reveals a landscape of alterations affecting a common genetic axis in fusion-positive and fusion-negative tumors. Cancer Discov. Feb 2014;4(2):216–31. [DOI] [PMC free article] [PubMed] [Google Scholar]
- 34.Hayes MN, McCarthy K, Jin A, et al. Vangl2/RhoA Signaling Pathway Regulates Stem Cell Self-Renewal Programs and Growth in Rhabdomyosarcoma. Cell Stem Cell. Mar 1 2018;22(3):414–427 e6. [DOI] [PMC free article] [PubMed] [Google Scholar]
- 35.Lee E, Chuang HY, Kim JW, Ideker T, Lee D. Inferring pathway activity toward precise disease classification. PLoS Comput Biol. Nov 2008;4(11):e1000217. [DOI] [PMC free article] [PubMed] [Google Scholar]
- 36.Tsherniak A, Vazquez F, Montgomery PG, et al. Defining a Cancer Dependency Map. Cell. Jul 27 2017;170(3):564–576 e16. [DOI] [PMC free article] [PubMed] [Google Scholar]
- 37.Hao Y, Stuart T, Kowalski MH, et al. Dictionary learning for integrative, multimodal and scalable single-cell analysis. Nat Biotechnol. Feb 2024;42(2):293–304. [DOI] [PMC free article] [PubMed] [Google Scholar]
- 38.Sunkel BD, Wang M, LaHaye S, et al. Evidence of pioneer factor activity of an oncogenic fusion transcription factor. iScience. Aug 20 2021;24(8):102867. [DOI] [PMC free article] [PubMed] [Google Scholar]
- 39.Cao L, Yu Y, Bilke S, et al. Genome-wide identification of PAX3-FKHR binding sites in rhabdomyosarcoma reveals candidate target genes important for development and cancer. Cancer Res. Aug 15 2010;70(16):6497–508. [DOI] [PMC free article] [PubMed] [Google Scholar]
- 40.Gryder BE, Yohe ME, Chou HC, et al. PAX3-FOXO1 Establishes Myogenic Super Enhancers and Confers BET Bromodomain Vulnerability. Cancer Discov. Aug 2017;7(8):884–899. [DOI] [PMC free article] [PubMed] [Google Scholar]
- 41.Dias P, Chen B, Dilday B, et al. Strong immunostaining for myogenin in rhabdomyosarcoma is significantly associated with tumors of the alveolar subclass. Am J Pathol. Feb 2000;156(2):399–408. [DOI] [PMC free article] [PubMed] [Google Scholar]
- 42.Tonelli R, McIntyre A, Camerin C, et al. Antitumor activity of sustained N-myc reduction in rhabdomyosarcomas and transcriptional block by antigene therapy. Clin Cancer Res. Feb 1 2012;18(3):796–807. [DOI] [PubMed] [Google Scholar]
- 43.Chu E, Drake JC, Boarman D, Baram J, Allegra CJ. Mechanism of thymidylate synthase inhibition by methotrexate in human neoplastic cell lines and normal human myeloid progenitor cells. J Biol Chem. May 25 1990;265(15):8470–8. [PubMed] [Google Scholar]
- 44.Howell EE, Foster PG, Foster LM. Construction of a dihydrofolate reductase-deficient mutant of Escherichia coli by gene replacement. J Bacteriol. Jul 1988;170(7):3040–5. [DOI] [PMC free article] [PubMed] [Google Scholar]
- 45.Schober AF, Mathis AD, Ingle C, et al. A Two-Enzyme Adaptive Unit within Bacterial Folate Metabolism. Cell Rep. Jun 11 2019;27(11):3359–3370 e7. [DOI] [PMC free article] [PubMed] [Google Scholar]
- 46.Howard SC, McCormick J, Pui CH, Buddington RK, Harvey RD. Preventing and Managing Toxicities of High-Dose Methotrexate. Oncologist. Dec 2016;21(12):1471–1482. [DOI] [PMC free article] [PubMed] [Google Scholar]
- 47.Evans WE, Crom WR, Abromowitch M, et al. Clinical pharmacodynamics of high-dose methotrexate in acute lymphocytic leukemia. Identification of a relation between concentration and effect. N Engl J Med. Feb 20 1986;314(8):471–7. [DOI] [PubMed] [Google Scholar]
- 48.Harrison DJ, Geller DS, Gill JD, Lewis VO, Gorlick R. Current and future therapeutic approaches for osteosarcoma. Expert Rev Anticancer Ther. Jan 2018;18(1):39–50. [DOI] [PubMed] [Google Scholar]
- 49.Bode U. Methotrexate as relapse therapy for rhabdomyosarcoma. Am J Pediatr Hematol Oncol. Spring 1986;8(1):70–2. [PubMed] [Google Scholar]
- 50.Pappo AS, Bowman LC, Furman WL, et al. A phase II trial of high-dose methotrexate in previously untreated children and adolescents with high-risk unresectable or metastatic rhabdomyosarcoma. J Pediatr Hematol Oncol. Sep-Oct 1997;19(5):438–42. [DOI] [PubMed] [Google Scholar]
- 51.Pratt CB, Roberts D, Shanks EC, Warmath EL. Clinical trials and pharmacokinetics of intermittent high-dose methotrexate-"leucovorin rescue" for children with malignant tumors. Cancer Res. Dec 1974;34(12):3326–31. [PubMed] [Google Scholar]
- 52.Sullivan MR, Darnell AM, Reilly MF, et al. Methionine synthase is essential for cancer cell proliferation in physiological folate environments. Nat Metab. Nov 2021;3(11):1500–1511. [DOI] [PMC free article] [PubMed] [Google Scholar]
- 53.Ghergurovich JM, Xu X, Wang JZ, et al. Methionine synthase supports tumour tetrahydrofolate pools. Nat Metab. Nov 2021;3(11):1512–1520. [DOI] [PMC free article] [PubMed] [Google Scholar]
- 54.Ducker GS, Rabinowitz JD. One-Carbon Metabolism in Health and Disease. Cell Metab. Jan 10 2017;25(1):27–42. [DOI] [PMC free article] [PubMed] [Google Scholar]
- 55.Allegra CJ, Hoang K, Yeh GC, Drake JC, Baram J. Evidence for direct inhibition of de novo purine synthesis in human MCF-7 breast cells as a principal mode of metabolic inhibition by methotrexate. J Biol Chem. Oct 5 1987;262(28):13520–6. [PubMed] [Google Scholar]
- 56.Sobell HM. Actinomycin and DNA transcription. Proc Natl Acad Sci U S A. Aug 1985;82(16):5328–31. [DOI] [PMC free article] [PubMed] [Google Scholar]
- 57.Colvin OM. An overview of cyclophosphamide development and clinical applications. Curr Pharm Des. Aug 1999;5(8):555–60. [PubMed] [Google Scholar]
- 58.Chan TC, Howell SB. Role of hypoxanthine and thymidine in determining methotrexate plus dipyridamole cytotoxicity. Eur J Cancer. 1990;26(8):907–11. [DOI] [PubMed] [Google Scholar]
- 59.Kong W, Wang J. Hypoxanthine transport in human glioblastoma cells and effect on cell susceptibility to methotrexate. Pharm Res. Nov 2003;20(11):1804–11. [DOI] [PubMed] [Google Scholar]
- 60.Soflaee MH, Kesavan R, Sahu U, et al. Purine nucleotide depletion prompts cell migration by stimulating the serine synthesis pathway. Nat Commun. May 16 2022;13(1):2698. [DOI] [PMC free article] [PubMed] [Google Scholar]
- 61.Taylor IW, Tattersall MH. Methotrexate cytotoxicity in cultured human leukemic cells studied by flow cytometry. Cancer Res. Apr 1981;41(4):1549–58. [PubMed] [Google Scholar]
- 62.Uitendaal MP, Schornagel JH, Leyva A, Pinedo HM. Influence of concomitant infusion of thymidine and inosine on methotrexate activity in normal and P388-bearing mice. Eur J Cancer Clin Oncol. Dec 1984;20(12):1527–32. [DOI] [PubMed] [Google Scholar]
- 63.Sobrero AF, Bertino JR. Endogenous thymidine and hypoxanthine are a source of error in evaluating methotrexate cytotoxicity by clonogenic assays using undialyzed fetal bovine serum. Int J Cell Cloning. Jan 1986;4(1):51–62. [DOI] [PubMed] [Google Scholar]
- 64.Shin J, Mir H, Khurram MA, et al. Allosteric regulation of CAD modulates de novo pyrimidine synthesis during the cell cycle. Nat Metab. Feb 2023;5(2):277–293. [DOI] [PMC free article] [PubMed] [Google Scholar]
- 65.Tatibana M, Shigesada K. Activation by 5-phosphoribosyl 1-pyrophosphate of glutamine-dependent carbamyl phosphate synthetase from mouse spleen. Biochem Biophys Res Commun. Jan 31 1972;46(2):491–7. [DOI] [PubMed] [Google Scholar]
- 66.Ebauer M, Wachtel M, Niggli FK, Schafer BW. Comparative expression profiling identifies an in vivo target gene signature with TFAP2B as a mediator of the survival function of PAX3/FKHR. Oncogene. Nov 8 2007;26(51):7267–81. [DOI] [PubMed] [Google Scholar]
- 67.Sirotnak FM, Moccio DM, Dorick DM. Optimization of high-dose methotrexate with leucovorin rescue therapy in the L1210 leukemia and sarcoma 180 murine tumor models. Cancer Res. Feb 1978;38(2):345–53. [PubMed] [Google Scholar]
- 68.Christensen AM, Pauley JL, Molinelli AR, et al. Resumption of high-dose methotrexate after acute kidney injury and glucarpidase use in pediatric oncology patients. Cancer. Sep 1 2012;118(17):4321–30. [DOI] [PMC free article] [PubMed] [Google Scholar]
- 69.Nair AB, Jacob S. A simple practice guide for dose conversion between animals and human. J Basic Clin Pharm. Mar 2016;7(2):27–31. [DOI] [PMC free article] [PubMed] [Google Scholar]
- 70.Oeffinger KC, Mertens AC, Sklar CA, et al. Chronic health conditions in adult survivors of childhood cancer. N Engl J Med. Oct 12 2006;355(15):1572–82. [DOI] [PubMed] [Google Scholar]
- 71.Bodmer N, Walters DK, Fuchs B. Pemetrexed, a multitargeted antifolate drug, demonstrates lower efficacy in comparison to methotrexate against osteosarcoma cell lines. Pediatr Blood Cancer. Apr 2008;50(4):905–8. [DOI] [PubMed] [Google Scholar]
- 72.Walling J. From methotrexate to pemetrexed and beyond. A review of the pharmacodynamic and clinical properties of antifolates. Invest New Drugs. Jan 2006;24(1):37–77. [DOI] [PubMed] [Google Scholar]
- 73.Adjei AA. Pharmacology and mechanism of action of pemetrexed. Clin Lung Cancer. Apr 2004;5 Suppl 2:S51–5. [DOI] [PubMed] [Google Scholar]
- 74.Boudjadi S, Chatterjee B, Sun W, Vemu P, Barr FG. The expression and function of PAX3 in development and disease. Gene. Aug 5 2018;666:145–157. [DOI] [PMC free article] [PubMed] [Google Scholar]
- 75.Sudiwala S, Palmer A, Massa V, et al. Cellular mechanisms underlying Pax3-related neural tube defects and their prevention by folic acid. Dis Model Mech. Nov 22 2019;12(11) [Google Scholar]
Associated Data
This section collects any data citations, data availability statements, or supplementary materials included in this article.