

Abstract
Purpose:
Assess obesity and cardiometabolic disease risk factors among a high-risk pediatric population.
Design:
Observational, cross-sectional study using electronic medical records (EMR).
Setting:
The only academic medical center in Mississippi.
Sample:
Data were extracted for children and adolescents aged 2 through 19 years treated in primary care from 2013–2023.
Measures:
Measures of height, weight, blood pressure, lipid profiles, and hemoglobin A1c were categorized to determine the prevalence of obesity, hypertension, hyperlipidemia, and hyperglycemia.
Analyses:
Multivariable regression models were used to establish the association between age- and sex-adjusted body mass index z-score (zBMI) and demographic characteristics. Outcomes were explored by race/ethnicity, sex, age, insurance type, visit year, and rurality.
Results:
The study sample included 38,275 participants (M age = 8.9 years, SD = 5.3; 48.7% female; 45.4% non-Hispanic Black [NHB]). Half of NHB females aged 12 through 19 were either overweight (19.0 %), obese (15.9%), or severely obese (14.9%). Age was positively associated with BMI z-score (P < 0.001). Nearly 40% of all participants with a blood pressure (BP) reading had a measure consistent with elevated BP (17.1%) or hypertension (22.1%). NHB males with severe obesity had the highest prevalence of stage II hypertension (12.3%).
Conclusions:
The distribution of mean zBMI values greater than zero indicated that this pediatric population contained a larger proportion of individuals with obesity than the age- and sex-matched reference population. Intervention in NHB females aged 2 through 9 with severe obesity may present the best opportunity for the prevention of severe obesity and hypertension.
Keywords: pediatric obesity, cardiometabolic risk factors, health disparity, electronic health records
In Brief
Given the lack of a comprehensive state-level pediatric obesity monitoring system in Mississippi, we utilized electronic medical records to determine the prevalence of obesity, hypertension, hyperlipidemia, and hyperglycemia in youth 2 to 19 years old. This racially diverse clinical pediatric population from the state’s only academic medical center (N = 38,275 patients) contained a larger proportion of individuals with overweight and obesity than the age- and sex-matched reference population (33.3%) and had high cardiometabolic disease risk (39.2%). Non-Hispanic Black females aged 12 to 19 years of age had the highest rates of overweight, obesity, and severe obesity. Early life course interventions, especially for Non-Hispanic Black females 2 to 9 years of age may present the best opportunity for prevention of obesity and hypertension, and longitudinal studies are needed to better understand the etiology of cardiometabolic disease in youth.
Purpose
The rising obesity epidemic in children and adolescents is a critical public health concern in the Southeastern United States.1–3 Social and environmental risk factors are highly prevalent in this region,4,5 and disparities by race, economic status, and rural/urban residence have been consistently reported.6,7 Further, obesity in children and adolescents persists into adulthood, exacerbating disparities in premature cardiometabolic disease morbidity and mortality.1,2 Equitable approaches to obesity surveillance and subsequent treatment and prevention strategies are needed to mitigate health disparities.8
Historically, Mississippi has led the nation in the prevalence of childhood obesity. Given that there is no data monitoring system for obesity in Mississippi, state-level statistics are typically estimated from self-report surveys.9 Electronic medical record (EMR) systems store current and comprehensive clinical data and may be useful for monitoring obesity in the absence of routine surveillance.10,11 No studies have utilized EMRs to assess obesity and cardiometabolic disease risk factors among children and adolescents in Mississippi.
The overall purpose of this study was to assess the feasibility of using EMR for the surveillance of obesity and cardiometabolic risk factors, while assessing the state of obesity and cardiometabolic health among children and adolescents in Mississippi. This study used EMR data (2013–2023) among children and adolescents (2 through 19 years) from a large community-based primary care pediatric practice in Mississippi. Aim 1 was to estimate the prevalence of overweight, obesity, severe obesity, elevated blood pressure, hypertension, prediabetes, and dyslipidemia among the study sample. Aim 2 was to establish the multivariable relationship between age- and sex-adjusted body mass index z-score (zBMI) and demographic characteristics. Aim 3 was to establish the multivariable relationships and their magnitudes between several dependent cardiometabolic biomarkers and body mass index (BMI) adjusted for demographic characteristics. The central hypothesis was that increases in BMI would be associated with adverse cardiometabolic biomarker measurements.
Methods
Design and Sample
This observational, cross-sectional study followed the Strengthening and Reporting of Observational Studies Epidemiology reporting guidelines.12 Data were extracted from EMRs of patients at the University of Mississippi Medical Center (UMMC) aged 2 through 19 with a primary care encounter in pediatrics, family medicine, or adolescent medicine between January 1, 2013, and June 30, 2023. UMMC has a large pediatric primary care clinical network in the state and serves as Mississippi’s only tertiary academic medical center. Specialty care pediatric patients and those diagnosed with type 1 diabetes were excluded. The participants’ most recent encounter with a recorded height and weight was selected to create the cross-sectional analytic cohort.
The UMMC primary pediatric care practice serves central Mississippi with most patients residing in the Jackson Metropolitan Statistical Area, which had an estimated population of 610,257 in 2023. An estimated 143,000 of these individuals were aged 2 through 19 years. Hence, the cohort contains approximately one-quarter of the children and adolescents in this area. The sample was predominantly Black (47.2%) or White (46.2%). The majority (63.6%) were urban dwellers, and 36.4% resided in a rural area.
Measures
Body mass index (BMI) was computed by dividing weight (in kilograms) by height (in meters) squared.15 Body mass index percentile (BMI%ile) was derived using the 2000 Centers for Disease Control and Prevention age- and sex-specific growth charts.16 BMI%ile was used to categorize participants’ weight status and determine the prevalence of underweight (< 5th BMI%ile), healthy weight (≥ 5th to < 85th BMI%ile), overweight (≥ 85th BMI%ile to < 95th BMI%ile), obesity (≥ 95th BMI%ile to < 120% of the 95th BMI%ile) and severe obesity (≥ 120% of 95th BMI%ile).17 Body mass index z-score (zBMI) was calculated using the 2022 Centers for Disease Control and Prevention growth charts.
Cardiometabolic biomarkers included systolic blood pressure (SBP), diastolic blood pressure (DBP), and lipid profiles (total cholesterol [TC], high-density lipoprotein [HDL], low-density lipoprotein [LDL], triglycerides, and glycated hemoglobin [HbA1c]). Measures of SBP and DBP were used to categorize participants with elevated BP, stage I hypertension (HTN), or stage II HTN using guidelines for children aged 1 through 12 years and adolescents aged 13 through 19 years.18
Lipid measures were used to identify hyperlipidemia as defined by the National Institutes of Health guidelines.19 Borderline and high TC (170–199 mg/dL and ≥ 200 mg/dL, respectively), LDL (110–129 mg/dL and ≥ 130 mg/dL, respectively), and (borderline and low) HDL (40–45 mg/dL and < 40 mg/dL, respectively) followed classifications for all children and adolescents aged 0 through 19 years. Thresholds established separately for children and adolescents aged 0 through 9 years and 10 through 19 years were used to categorize participants with borderline (75–99 mg/dL and 90–129 mg/dL, respectively) and high (≥ 100 mg/dL and ≥ 130 mg/dL, respectively) triglycerides. Guidelines set forth by the American Diabetes Association were used to categorize participants with healthy HbA1c (< 5.7%), prediabetes (5.7%–6.4%), or type II diabetes (≥ 6.5%).20
Analysis
Prevalence by weight status, blood pressure (BP) status, hyperlipidemia, and hyperglycemia was defined as the number of participants within each category, divided by the total number of participants in the analytic dataset or analytic subset, and was reported as a percentage with corresponding 95% confidence interval (CI). Prevalence by weight status was stratified by race and ethnicity (non-Hispanic Black [NHB], non-Hispanic White [NHW], Hispanic/Latino or other races [Other]), sex (Male, Female), age group (2 through 5 years, 6 through 11 years, 12 through 19 years), insurance type (commercial, public, other), and statistical area (metropolitan, micropolitan, small town, or rural using rural–urban commuting area codes [RUCA]).13 The age groups were selected in accordance with previous obesity prevalence research for consistency and ease of cross-study comparisons.14 Elevated BP and HTN analyses were stratified by race and ethnicity, sex, age group, and weight status. The same age groups were used to stratify the BP and HTN analyses as used in the obesity analysis for within-study consistency.
Multivariable regression models were fitted to assess the relationships between the cardiometabolic risk factors and race/ethnicity, sex, age, insurance type, RUCA designation, visit year, and BMI. Specifically, to assess the adjusted associations between these characteristics, a multivariable linear regression model was fitted for each cardiometabolic risk factor, with visit year, BMI, sex, age, race/ethnicity, RUCA designation, and insurance type as independent variables. The multivariable linear regression model for zBMI did not include BMI as an independent variable but included all other independent variables. Quadratic and cubic terms for age were considered in each model to account for nonlinear trends. Furthermore, for the prespecified potential interactions between race, sex, and age, models with two-way interactions between the independent variables were also evaluated for significance. The assumptions of the general linear model were held for each model considered. HbA1c, HDL, LDL, TC, and triglycerides were log-transformed to ensure that modeling assumptions were held. All analyses were performed using R.15 Statistical significance was assessed at P < 0.05.
Results
There were 38,275 participants in the analytic sample (48.7% female). Of those, 45.4% were NHB, 38.5% were NHW, and 16.1% represented other races/ethnicities. The mean age was 8.9 years (SD = 5.3) and the mean zBMI was 0.40 (SD = 1.33). Most (90.0%) resided in a metropolitan area, and more than half had public health insurance (55.0%). The number of participants by year was not equally distributed (2013, n = 3,533; 2014, n = 3,266; 2015, n = 2,999; 2016, n = 3,313; 2017, n = 3,314; 2018, n = 6,312; 2019, n = 5,630; 2020, n = 3,416; 2021, n = 2,766; 2022, n = 2,891; 2023, n = 835).
Prevalence of Underweight, Healthy Weight, Overweight, Obesity, and Severe Obesity
Overall, 33.3% of study participants were overweight or obese. The prevalence of overweight (15.0%, 95% CI, 14.6–15.3) and obesity (12.0%, 95% CI, 11.7–12.4) was greater than severe obesity (6.3%, 95% CI, 6.0–6.5).
Weight Status by Race and Ethnicity, Sex, and Age
Table 1 reports the prevalence of weight status by race/ethnicity, sex, and age. Half (49.9%) of NHB females 12 to 19 years old were overweight, obese, or severely obese. The prevalence of severe obesity among NHB females of all ages (9.0%; 95% CI, 8.4–9.6) was twice that of NHWs (4.5%, 95% CI, 4.0–4.9).
Table 1.
Prevalence of Overweight, Obesity, and Severe Obesity by Race, Sex, and Age Among Participants Aged 2 through 19 Years in a Clinical Setting in Mississippi, 2013–2023a
| Age Group | Non-Hispanic White | Non-Hispanic Black | Other Race or Ethnicityb | |||
|---|---|---|---|---|---|---|
| Weight Status | Female (n = 7,157) | Male (n = 7,589) | Female (n = 8,527) | Male (n = 8,849) | Female (n = 2,950) | Male (n = 3,203) |
| All ages | ||||||
| Underweightc | 4.2 (3.7–4.7) | 5.5 (5.0–6.0) | 4.5 (4.1–5.0) | 4.9 (4.5–5.4) | 4.9 (4.1–5.7) | 5.1 (4.3–5.8) |
| Healthy Weightd | 65.9 (64.8–67.0) | 64.8 (63.7–65.8) | 56.5 (55.4–57.5) | 61.7 (60.7–62.7) | 61.2 (59.5–63.0) | 62.1 (60.4–63.7) |
| Overweighte | 14.9 (14.1–15.7) | 13.7 (12.9–14.4) | 16.7 (15.9–17.5) | 14.2 (13.6–15.0) | 16.5 (15.2–17.8) | 13.9 (12.7–15.1) |
| Obesityf | 10.6 (9.9–11.3) | 11.0 (10.3–11.7) | 13.3 (12.6–17.5) | 12.2 (11.5–12.9) | 12.5 (11.3–13.7) | 13.7 (12.5–14.9) |
| Severe Obesityg | 4.5 (4.0–4.9) | 5.1 (4.6–5.6) | 9.0 (8.4–9.6) | 6.9 (6.4–7.4) | 4.9 (4.1–5.7) | 5.3 (4.6–6.1) |
| 2 through 5 years | ||||||
| Underweight | 6.2 (5.3–7.2) | 6.8 (5.8–7.7) | 8.9 (7.9–9.9) | 8.0 (7.1–8.9) | 7.4 (5.9–8.8) | 6.5 (5.1–7.8) |
| Healthy Weight | 74.3 (72.5–76.0) | 73.2 (71.6–74.9) | 67.7 (66.0–69.3) | 69.4 (67.9–71.0) | 67.6 (65.0–70.3) | 67.2 (64.6–69.7) |
| Overweight | 11.6 (10.3–12.8) | 12.2 (10.9–13.4) | 12.5 (11.3–13.7) | 12.4 (11.3–13.5) | 13.9 (11.9–15.8) | 13.1 (11.3–15.0) |
| Obesity | 7.1 (6.1–8.2) | 7.3 (6.3–8.3) | 9.2 (8.2–10.3) | 9.5 (8.5–10.5) | 9.8 (8.1–11.5) | 11.7 (10.0–13.5) |
| Severe Obesity | 0.8 (0.4–1.2) | 0.5 (0.2–0.8) | 1.7 (1.2–2.2) | 0.7 (0.4–1.0) | 1.4 (0.7–2.0) | 1.5 (0.8–2.1) |
| 6 through 11 years | ||||||
| Underweight | 4.3 (3.4–5.2) | 5 (4.1–5.9) | 2.7 (2.1–3.4) | 3.1 (2.5–3.8) | 4.3 (3.0–5.6) | 4.5 (3.2–5.8) |
| Healthy Weight | 63 (60.9–65.1) | 62.9 (60.9–64.9) | 53.9 (51.8–55.9) | 57.7 (53.6–60.0) | 56.8 (53.6–60.0) | 59.2 (56.1–62.2) |
| Overweight | 15.1 (13.5–16.6) | 14.6 (13.2–16.1) | 18.7 (17.1–20.3) | 15.6 (13.4–18.1) | 15.8 (13.4–18.1) | 13.4 (11.3–15.6) |
| Obesity | 12.6 (11.1–14.0) | 11.5 (10.2–12.9) | 14.7 (13.3–16.2) | 14.2 (13.4–18.1) | 15.8 (13.4–18.1) | 15.2 (13.0–17.5) |
| Severe Obesity | 5.1 (4.1–6.1) | 6.0 (5.0–6.9) | 9.9 (8.7–11.1) | 9.4 (8.2–10.5) | 7.4 (5.7–9.1) | 7.7 (6.0–9.3) |
| 12 through 19 years | ||||||
| Underweight | 2.4 (1.8–2.9) | 4.6 (3.8–5.4) | 1.8 (1.4–2.3) | 3.0 (2.4–3.6) | 2.2 (1.2–3.2) | 3.6 (2.4–4.9) |
| Healthy Weight | 60.7 (58.9–62.6) | 57.7 (55.8–59.6) | 48.3 (46.6–50.0) | 56.7 (54.9–58.4) | 57.1 (53.8–60.4) | 58.0 (54.8–61.2) |
| Overweight | 17.7 (16.3–19.1) | 14.3 (13.0–15.7) | 19.0 (17.7–20.4) | 15.2 (14.1–16.6) | 21.0 (19.3–23.7) | 15.4 (13.0–17.7) |
| Obesity | 12.1 (10.8–13.3) | 14.3 (13.0–15.7) | 15.9 (14.7–17.2) | 13.4 (12.2–14.6) | 12.7 (10.4–14.9) | 15.4 (13.0–17.7) |
| Severe Obesity | 7.1 (6.2–8.1) | 9.1 (8.0–0.2) | 14.9 (13.7–16.2) | 11.6 (10.4–12.7) | 7.0 (5.3–8.8) | 8.3 (6.5–10.1) |
Data in the table represent percentages and corresponding 95% Confidence Interval (lower limit, upper limit).
Other races or ethnicities included Hispanic or Latino, American Indian or Alaska Native, Multiracial, and Asian.
Underweight was defined as <5th body mass index percentile.
Healthy weight was defined as ≥5th to <85th body mass index percentile.
Overweight was defined as ≥85th to <95th body mass index percentile.
Obesity was defined as ≥95th BMI% to <120% of the 95th body mass index percentile.
Severe obesity was defined as ≥120% 95th body mass index percentile.
NHB females compared to males had a higher prevalence of severe obesity among all ages (9.0%; 95% CI, 8.4–9.6 and 6.9%; 95% CI, 6.4–7.4, respectively), 2 to 5-year-olds (1.7%; 95% CI, 1.2–2.2 and 0.7%; 95% CI, 0.4–1.0, respectively), and 12 to 19-year-olds (14.9% 95% CI, 13.7–16.2 and 11.6%; 95% CI, 10.4–12.7, respectively). Females aged 12 through 19 years had the highest prevalence of severe obesity among the entire cohort. Among males of all ages, NHBs (6.9%; 95% CI, 6.4–7.4) compared to NHWs (5.1%; 95% CI, 4.6–5.6) had a higher prevalence of severe obesity. NHB males aged 6 through 11 years (9.4%; 95% CI, 8.2–10.5) and 12 through 19 years (11.6%; 95% CI, 10.4–12.7) had a higher prevalence of severe obesity compared to NHWs (6.0%; 95% CI, 5.0–6.9 and 9.1%; 95% CI, 8.0–10.2, respectively).
Weight Status by Insurance Type and RUCA Designation
NHBs with commercial (8.1%; 95% CI, 7.5–8.7) or public (7.1%; 95% CI, 7.2–8.3) insurance had the highest prevalence of severe obesity. Among participants from metropolitan areas, the prevalence of obesity and severe obesity was higher among NHBs (12.6%; 95% CI, 12.1–13.1 and 8.0%; 95% CI, 7.4–8.3, respectively) compared to NHWs (10.6%; 95% CI, 10.1–11.1 and 4.6%; 95% CI, 4.3–5.0, respectively). While not significantly different from NHWs or people of other races/ethnicities, NHBs in micropolitan (8.0%; 95% CI, 6.4–9.7), small town (9.3%; 95% CI, 7.1–11.4), and rural (7.5%; 3.7–11.3) areas had the highest rates of severe obesity.
Linear Regression Model: Standardized Body Mass Index
The multivariable regression model for zBMI was significant (adjusted R2 = 0.05, F(11, 38260) = 166.3, P < 0.001). Age (β = 0.146, P < 0.001) was positively associated with zBMI, with the quadratic term for age (β = −0.005, P < 0.001) fitting a nonlinear moderating association with increasing cross-sectional age. The nonlinear cross-sectional association is visualized in Figure 1, with increasing zBMI observed across participants 2 through 9 years and a plateau in elevated zBMI across participants 10 through 19 years.
Figure 1.

Cross-sectional zBMI by Age.
Compared to NHWs, zBMI was higher among NHBs (β = 0.190, P < 0.001) and Other (β = 0.121, P < 0.001) adjusted for age, age-squared, sex, insurance status, visit year, and RUCA designation. There was no difference in zBMI between males and females (β = −0.02, P = 0.11) adjusted for age, race, insurance status, and RUCA designation. Compared to metropolitan, zBMI was higher among micropolitan (β = 0.062, P = 0.047) and small town (β = 0.131, P < 0.001) areas adjusted for age, age-squared, sex, race, visit year, and insurance status. The zBMI of those from rural areas was not different from metropolitan (β = 0.046, P = 0.481), adjusted for age, age-squared, sex, race, visit year, and insurance status. There was no significant adjusted difference in zBMI by insurance type or visit year.
Elevated Blood Pressure, Stage I Hypertension, and Stage II Hypertension
Of the 38,275 participants in the analytic sample, 30,401 (79.4%) had a SBP and DBP measure. Of those with BP measures, the mean age was 10.2 years (SD = 4.9); the mean zBMI was 0.564 (SD = 1.33); 47.0% were NHB, 37.3% were NHW, and 15.7% represented people of other races/ethnicities; 90% resided in a metropolitan area; and 55.7% had public health insurance. Of those without BP measures, the mean age was 4.0 years (SD = 3.9); 39.1% were NHB, 43.4% were NHW, 17.5% represented people of other races/ethnicities, 90.2% resided in a metropolitan area, and 52.3% had public insurance. Nearly 40% of participants with BP determinations had SBP or DBP consistent with elevated BP (17.1%), stage 1 HTN (18.3%), or stage II HTN (3.8%).
Prevalence of Blood Pressure Status by Race and Ethnicity, Sex, and Weight Status
Table 2 presents the prevalence of normal BP, elevated BP, stage I HTN, and stage II HTN by race/ethnicity, sex, and weight status. Elevated BP and stage II HTN were higher among males (18.6%; 95% CI, 18.0–19.2 and 4.2%; 95% CI 3.9–5.4, respectively) compared to females (15.5%; 95% CI, 14.9–16.1 and 3.4%; 95% CI, 3.1–3.7, respectively). The highest rates of stage II HTN were in males and females with severe obesity in each racial/ethnic group. The highest prevalence of stage II HTN was in NHB males with severe obesity (12.3%; 95% CI, 9.6–15.0).
Table 2.
Prevalence of Elevated Blood Pressure and Stage I and Stage II Hypertension by Race, Sex, and Weight Status Among Participants Aged 2 through 19 Years from a Clinical Setting in Mississippi, 2013–2023a
| Weight Category | Non-Hispanic White | Non-Hispanic Black | Other Race or Ethnicityb | |||
|---|---|---|---|---|---|---|
| Blood Pressure Category | Female (n = 6,101) | Male (n = 6,290) | Female (n = 7,607) | Male (n = 7,703) | Female (n = 2,563) | Male (n = 2,678) |
| Underweight c | ||||||
| Normal d | 68.6 (62.0–75.3) | 67.3 (61.8–72.7) | 65.7 (59.7–71.7) | 63.6 (58.0–69.2) | 74.7 (65.8–83.7) | 73.7 (65.6–81.8) |
| Elevatede | 13.3 (8.4–18.2) | 15.5 (11.3–19.7) | 10.3 (6.5–14.2) | 16.3 (12.0–20.6) | 13.2 (6.2–20.1) | 11.4 (5.6–17.2) |
| Stage I f | 15.4 (10.3–20.6) | 15.1 (11.0–19.3) | 14.9 (10.4–19.4) | 16.3 (12.0–20.6) | 9.9 (3.8–16.0) | 12.3 (6.3–18.3) |
| Stage II g | 2.7 (0.4–5.0) | 2.1 (0.4–3.8) | 9.1 (5.5–12.7) | 3.9 (1.6–6.1) | 2.2 (0.0–5.2) | 11.4 (5.6–17.2) |
| Healthy weight h | ||||||
| Normal | 70.4 (68.9–71.9) | 65.7 (64.2–67.2) | 67.3 (65.9–68.8) | 60.1 (58.6–61.6) | 74.3 (71.9–76.6) | 67.8 (65.4–70.2) |
| Elevated | 13.9 (12.8–15.0) | 17.0 (15.8–18.2) | 13.9 (12.8–15.0) | 18.9 (17.7–20.0) | 11.7 (10.0–13.4) | 14.8 (13.0–16.6) |
| Stage I | 13.8 (12.7–15.0) | 15.2 (14.1–16.4) | 16.1 (14.9–17.3) | 17.2 (16.0–18.3) | 12.5 (10.8–14.3) | 14.3 (12.5–16.1) |
| Stage II | 1.8 (1.4–2.3) | 2.1 (1.6–2.5) | 2.7 (2.2–3.2) | 3.9 (3.3–4.4) | 1.5 (0.8–2.1) | 3.2 (2.3–4.0) |
| Overweight i | ||||||
| Normal | 60.4 (57.2–63.7) | 52.9 (49.5–56.3) | 60.2 (57.5–62.9) | 55.6 (52.6–58.5) | 67.9 (63.3–72.5) | 59.3 (54.3–64.4) |
| Elevated | 16.4 (14.0–18.9) | 21.5 (18.7–24.3) | 18.1 (15.9–20.2) | 19.9 (17.5–22.3) | 13.1 (9.8–16.5) | 19.5 (15.4–23.6) |
| Stage I | 20.9 (18.2–23.6) | 21.2 (18.4–24.0) | 18.1 (16.0–20.3) | 19.8 (17.4–22.2) | 17.4 (13.7–21.2) | 18.9 (14.9–23.0) |
| Stage II | 2.3 (1.3–3.3) | 4.4 (3.0–5.8) | 3.6 (2.6–4.6) | 4.7 (3.4–6.0) | 1.5 (0.3–2.7) | 2.2 (0.7–3.8) |
| Obesity j | ||||||
| Normal | 50.5 (46.5–54.4) | 45.9 (42.1–49.6) | 48.3 (45.3–51.4) | 47.5 (44.3–50.7) | 55.7 (50.2–61.2) | 50.7 (45.5–55.9) |
| Elevated | 23.5 (20.2–26.9) | 21.8 (18.7–24.9) | 21.2 (18.7–23.7) | 20.9 (18.3–23.5) | 17.4 (13.2–21.6) | 19.7 (15.6–23.9) |
| Stage I | 22.3 (19.0–25.5) | 27.1 (23.7–30.4) | 24.7 (22.1–27.3) | 25.0 (22.3–27.8) | 22.2 (17.6–26.7) | 23.9 (19.5–28.4) |
| Stage II | 3.7 (2.2–5.2) | 5.3 (3.6–7.0) | 5.8 (4.3–7.2) | 6.5 (5.0–8.1) | 4.7 (2.4–7.1) | 5.6 (3.2–8.0) |
| Severe Obesity k | ||||||
| Normal | 35.5 (30.0–40.9) | 32.8 (27.8–37.8) | 39.0 (35.5–42.5) | 35.4 (31.5–39.3) | 46.2 (37.7–54.7) | 38.6 (31.0–46.2) |
| Elevated | 22.0 (17.2–26.7) | 23.4 (18.9–27.9) | 18.4 (15.6–21.2) | 21.7 (18.4–25.1) | 16.7 (10.3–23.0) | 20.9 (14.5–27.2) |
| Stage I | 31.8 (26.5–37.1) | 31.7 (26.7–36.6) | 32.1 (28.8–35.5) | 30.6 (26.9–34.3) | 28.0 (20.4–35.7) | 29.1 (22.0–36.2) |
| Stage II | 10.8 (7.3–14.3) | 12.1 (8.6–15.6) | 10.5 (8.3–12.7) | 12.3 (9.6–15.0) | 9.1 (4.2–14.0) | 11.4 (6.4–16.3) |
Data in the table represent percent and the 95% Confidence Interval (lower limit, upper limit).
Other races or ethnicities included Hispanic or Latino, American Indian or Alaska Native, Multiracial, and Asian.
Underweight was defined as <5th body mass index percentile.
Normal blood pressure is defined as < 90th percentile for children <= 12 years, < 120/< 80 mm Hg for adolescents 13 years or older.
Elevated blood pressure is defined as ≥ 90th (or ≥ 120/80 mm Hg, whichever is lower) to < 95th percentile for children up to age 12 years, 120–129/< 80 mmHg for adolescents 13 or older.
Stage I hypertension is defined as ≥ 95th to < 95th percentile + 12 mm Hg OR 130/80 to 139/89 mm Hg (whichever is lower) for children up to age 12 years, 1309/89 for adolescents 13 or older.
Stage II hypertension is defined as ≥ 95th percentile + 12 mm Hg OR ≥ 140/90 mm Hg (whichever is lower) for children under age 12, ≥ 140/90 for adolescents 13 years or older.
Healthy weight was defined as ≥5th to <85th body mass index percentile.
Overweight was defined as ≥85th to <95th body mass index percentile.
Obesity was defined as ≥95th BMI% to <120% 95th body mass index percentile.
Severe obesity was defined as ≥120% 95th body mass index percentile.
Linear Regression Model: Systolic Blood Pressure
The regression model for cross-sectional SBP was significant (adjusted R2 = 0.42, F(14, 30386) = 1543, P < 0.001). BMI (β = 1.05, P < 0.001) and age (β = 0.545, P = 0.009) were positively associated with SBP. The quadratic term (β = 0.148, P < 0.001) and cubic term for age (β = −0.005, P < 0.001) fit a nonlinear moderating association between increasing cross-sectional age and SBP (Figure 2). The effect of age on SBP was conditional on BMI. As both cross-sectional age and BMI increased, the corresponding SBP was lower than would be expected if the effects of age and BMI were strictly additive (β = −0.033, P < 0.001). SBP was higher in males than females (β = 2.15, P < 0.001) and lower in NHBs (β = −0.71, P < 0.001) and people of other races/ethnicities compared to NHWs (β = −1.52, P < 0.001). There was a secular time trend present in the data, with visit year being negatively associated with SBP (β = −0.274, P < 0.001). There was no difference in SBP by insurance type or RUCA designation.
Figure 2.
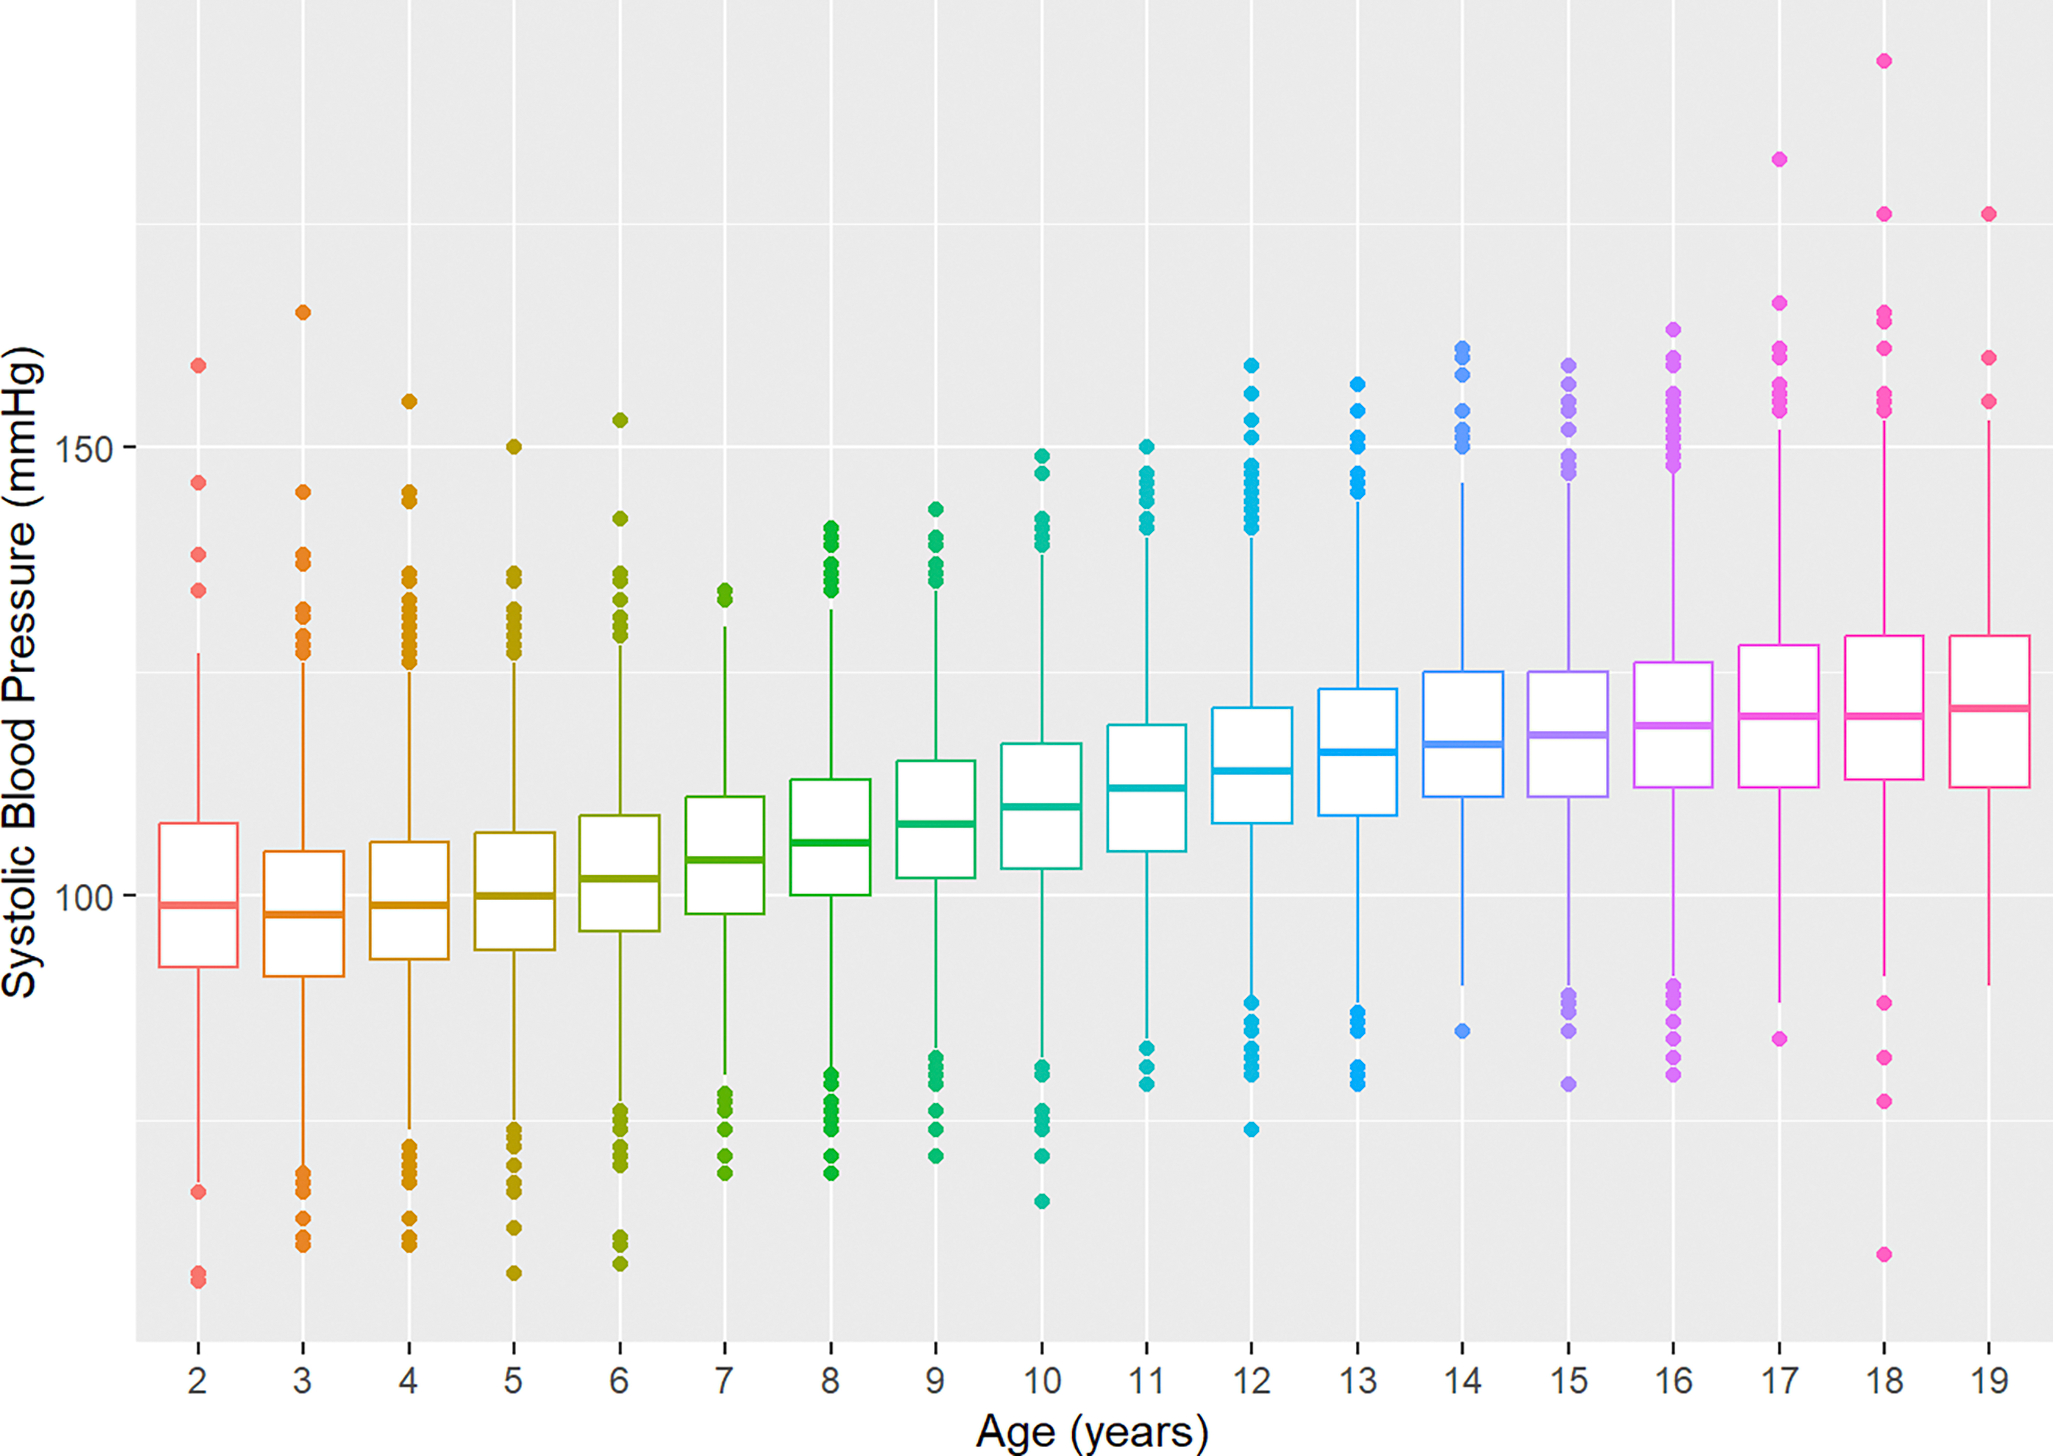
Cross-sectional Systolic Blood Pressure by Age.
Linear Regression Model: Diastolic Blood Pressure
The regression model for cross-sectional DBP was significant (adjusted R2 = 0.18, F(13, 30387) = 530.2, P < 0.001). BMI (β = 0.305, P < 0.001) and age (β = 0.534, P < 0.001) were positively associated with DBP. The quadratic term (β = 0.011, P < 0.001) for age fit a nonlinear moderating association with increasing cross-sectional DBP (Figure 3). The effect of age on DBP was conditional on BMI. As both age and BMI increased, the corresponding DBP was lower than expected if the effects of age and BMI were strictly additive (β = −0.006, P = 0.028). Compared to NHWs, DBP was not discernibly different among NHBs (β = −0.012, P = 0.915) and was lower in people of other races/ethnicities (β = −0.624, P < 0.001). There was a secular time trend present in the data, with visit year being negatively associated with DBP (β = −0.248, P < 0.001). There was no difference in DBP by sex, insurance type, or RUCA designation.
Figure 3.
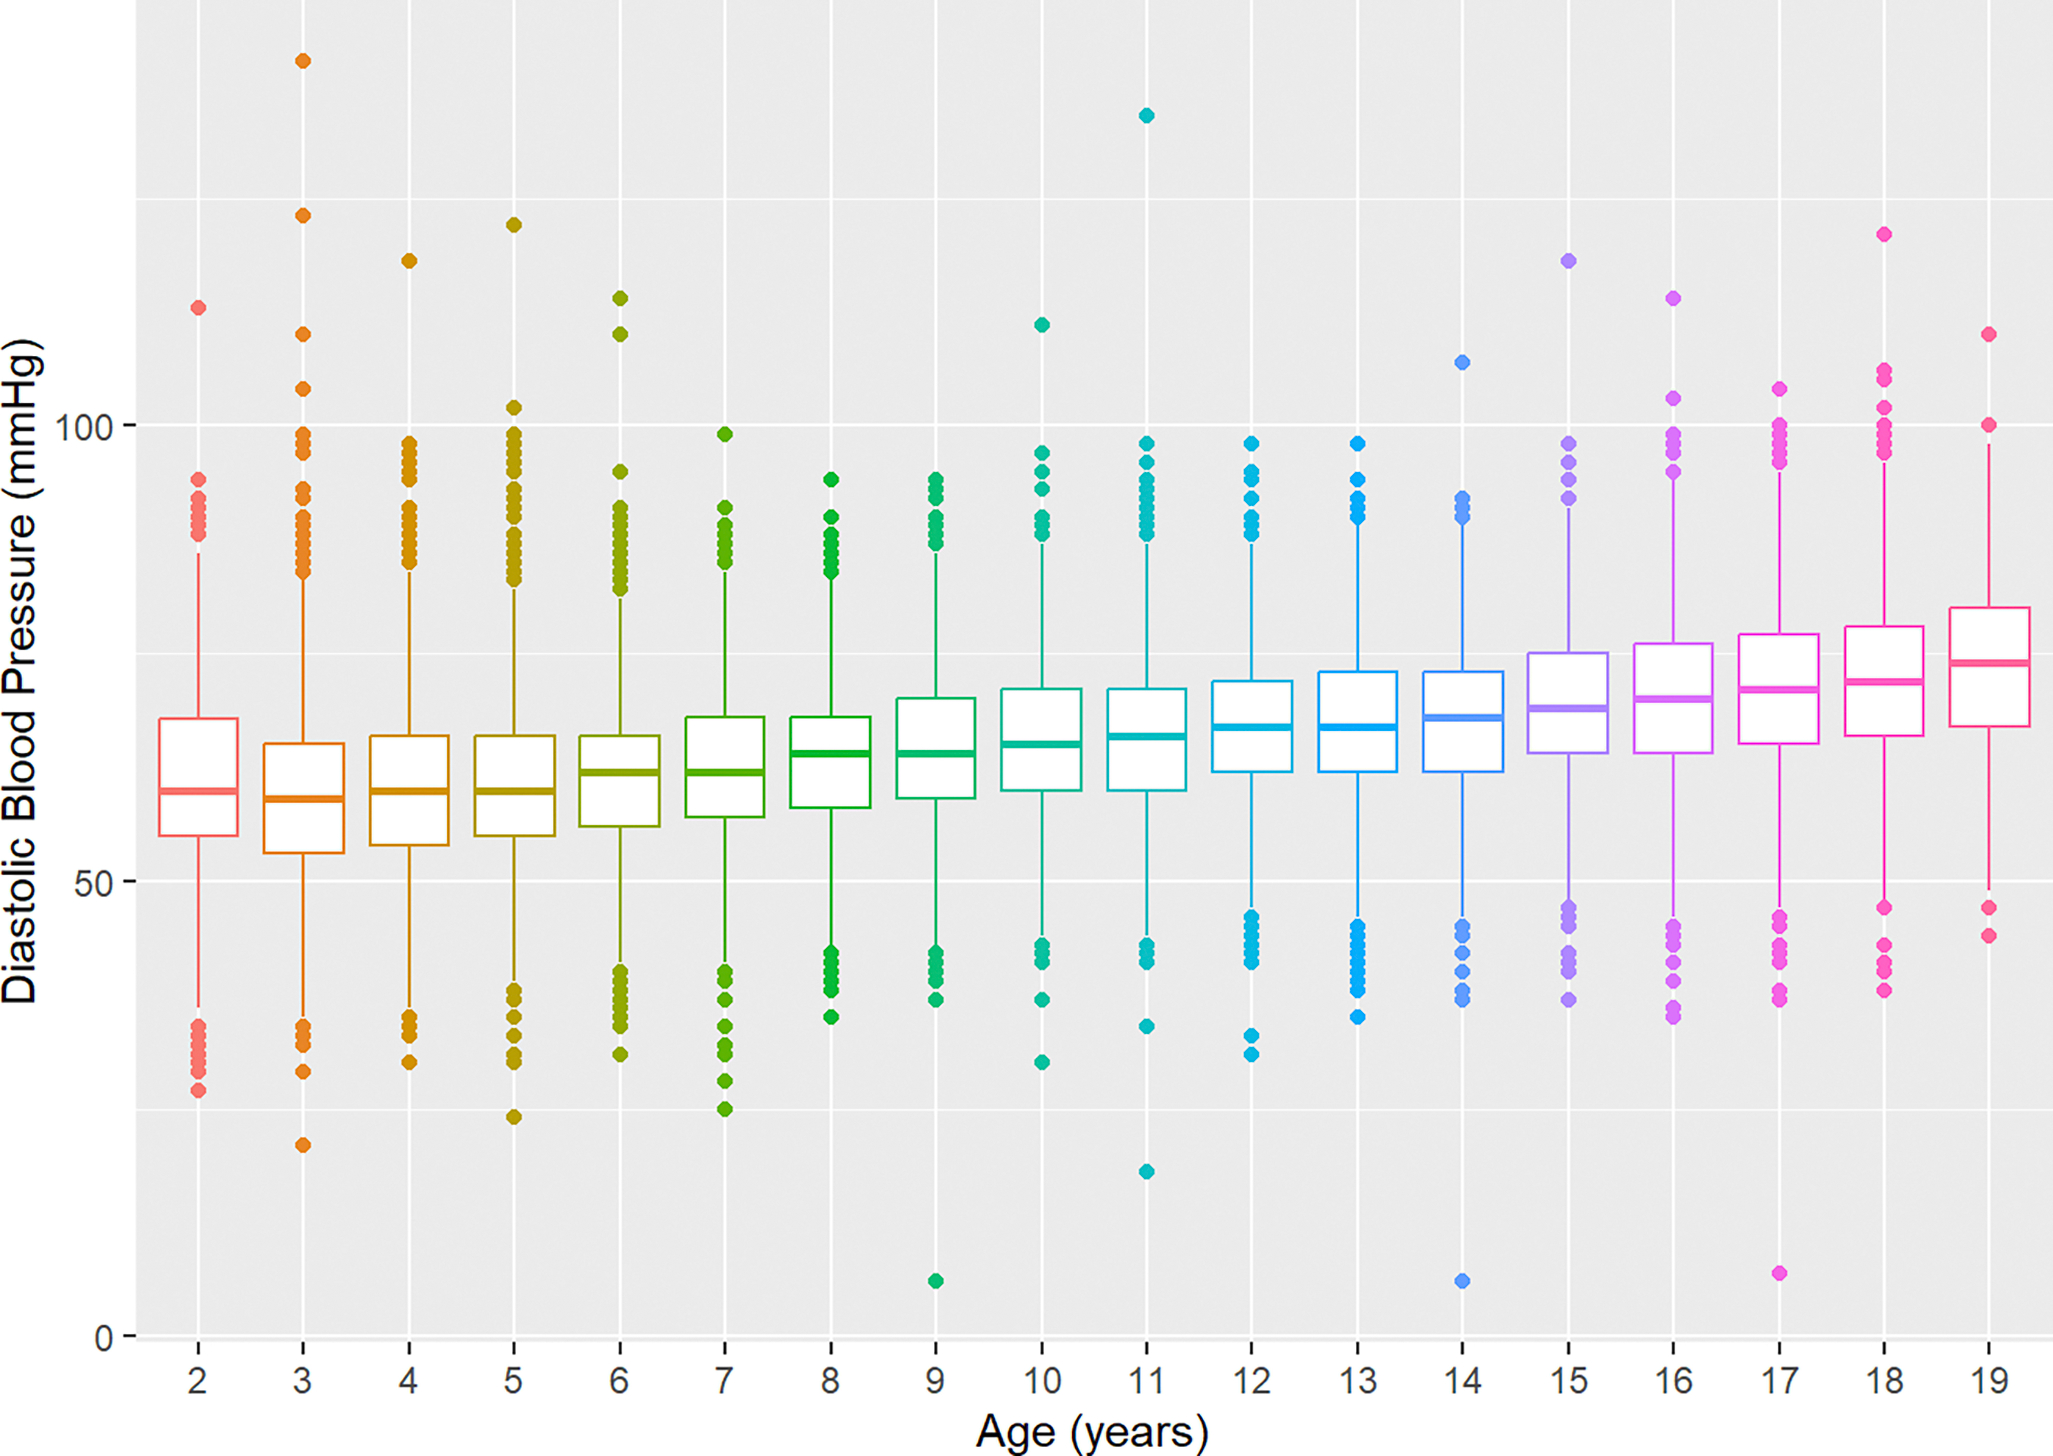
Cross-sectional Diastolic Blood Pressure by Age.
Glycated Hemoglobin A1c and Hyperglycemia
Of the 38,275 participants in the analytic sample, 37,933 children and adolescents did not have an HbA1C. Among the 342 participants with an HbA1c, the mean age was 14.5 years (SD = 3.73); the mean zBMI was 2.13 (SD = 1.60); 48.7% were male; 83.6% were NHB, 6.1% were NHW, and 10.2% represented people of other races/ethnicities; 89.8% resided in a metropolitan area; and 55.6% had public health insurance. The mean HbA1c was 5.39 mmol/mol (SD = 0.509), and most participants with a recorded HbA1c had a measure in the normal range (n = 263, 76.9%), 74 (21.6%) had an HbA1c consistent with prediabetes, and 5 (1.5%) had an HbA1c consistent with type II diabetes. Among the 37,933 participants without an HbA1c measure, the mean age was 8.84 years (SD = 5.29); the mean zBMI was 0.384 (SD = 1.32); 51.4% were male; 45.1% were NHB, 38.8% were NHW, and 16.1% represented people of other races/ethnicities; 90% resided in a metropolitan area; and 55.0% had public health insurance.
Linear Regression Model: Glycated Hemoglobin A1c
The linear regression model for HbA1c was significant (adjusted R2 = 0.05, F(11, 330) = 2.672, P < 0.01). BMI was associated with higher log-transformed HbA1c (β = 0.002, P < 0.001). Compared to NHWs, NHBs (β = 0.050, P = 0.011) had higher log-transformed HbA1c, and there was no discernible difference with people of other races/ethnicities (β = 0.041, P = 0.091). There was a secular time trend present in the data, with encounter year being negatively associated with HbA1c (β = −0.004, P = 0.036). HbA1c did not vary by age, insurance type, or RUCA designation.
Lipid Profile and Hyperlipidemia
Of the 38,275 participants in the analytic sample, 36,246 did not have a complete lipid profile, including TC, HDL, LDL, and triglycerides. Among the 2,029 participants (5.3%) with a full lipid panel, the mean age was 13.3 years (SD = 4.13); the mean zBMI was 0.564 (SD = 1.33); 50.7% were male, 51.6% were NHB, 34.5% were NHW, and 13.8% represented people of other races/ethnicities; 89.9% resided in a metropolitan area; and 63.5% had public health insurance. Among the 36,246 participants without a complete lipid profile, the mean age was 8.64 (SD = 5.25); the mean zBMI was 0.391 (SD = 1.33); 51.4% were male; 45.1% were NHB, 38.7% were NHW, and 16.2% represented people of other races/ethnicities; 90.0% resided in a metropolitan area; and 54.5% had public health insurance.
Total Cholesterol: Prevalence and Linear Regression Model
Of the 2,029 participants with a TC measure (mean = 171.0 mg/dL, SD = 39.9 mg/dL), 1,069 (52.7%) had acceptable TC, 571 (28.1%) had borderline high TC, and 389 (19.2%) had high TC. The linear regression model for log-transformed TC was significant (adjusted R2 = 0.008, F(11, 2018) = 2.491, P = 0.004). Compared to participants with commercial insurance, those with public insurance had lower log-transformed TC (β = −0.021, P = 0.048) and there was no discernible difference among participants with other insurance (β = −0.035, P = 0.317). There was a secular time trend present in the data, with visit year being negatively associated with log-transformed TC (β = −0.005, P = 0.006). TC was not associated with BMI, race/ethnicity, sex, age, or RUCA designation.
High-Density Lipoprotein: Prevalence and Linear Regression Model
The mean HDL was 50.7 mg/dL (SD = 15.4 mg/dL). Most participants (n = 1,187, 58.5%) had a measure within the acceptable range, 366 (18.0%) had a measure that was borderline low, and 476 (23.5%) had a low HDL. The linear regression model for log-transformed HDL was significant (adjusted R2 = 0.013, F(11, 2017) = 3.459, P < 0.001). Compared to participants with commercial insurance, participants with public insurance had lower log-transformed HDL (β = −0.071, P < 0.001), and those with other insurance were not discernibly different (β = −0.008, P = 0.512). Log-transformed HDL was not associated with BMI, race/ethnicity, visit year, sex, age, or RUCA designation.
Low-Density Lipoprotein: Prevalence and Linear Regression Model
Of the 2,029 participants with an LDL measure, 43 had an LDL not reported as a discrete measure and were excluded from the analysis. Of the 1,986 (5.2%) participants with a valid LDL (mean = 97.0 mg/dL, SD = 34.4 mg/dL), 1,383 (68.2%) had a normal measure, 320 (15.8%) had a borderline high measure, and 283 (13.9%) had high LDL. The overall multivariable linear regression model for log-transformed LDL was significant (adjusted R2 = 0.008, F(11, 1974) = 2.309, P = 0.008). Age was associated with increased log-transformed LDL (β = 0.007, P = 0.002). There was a secular time trend present in the data, with visit year being negatively associated with log-transformed LDL (β = −0.01, P = 0.003). LDL was not associated with BMI, race/ethnicity, sex, insurance type, or RUCA designation.
Triglycerides: Prevalence and Linear Regression Model
Of the 2,029 children and adolescents with a triglyceride measure, 10 participants had a value that was not reported as a discrete measure and were excluded from the analysis. Of the 2,019 (5.3%) participants with a valid triglyceride measure (mean = 121.0 mg/dL, SD = 87.3 mg/dL), 868 (42.8%) had a healthy measure, 482 (23.8%) had a measure that was borderline high, and 669 (3.3%) had high triglycerides. The linear regression model for log-transformed triglycerides was not significant (adjusted R2 = −0.001, F(11, 2014) = 0.7639, P = 0.677). Triglyceride measures were not associated with BMI, race/ethnicity, sex, age, insurance type, visit year, or RUCA designation.
Discussion
The overall purpose of this study was to assess the feasibility of using EMR for the surveillance of obesity and cardiometabolic risk factors, while assessing the state of obesity and cardiometabolic health among children and adolescents in Mississippi. Using EMR data (2013–2023) among children and adolescents (2 through 19 years), this study determined (1) the prevalence of overweight, obesity, severe obesity, elevated blood pressure, hypertension, prediabetes, and dyslipidemia; (2) the multivariable relationship between zBMI and demographic characteristics, and (3) the multivariable relationships between various cardiometabolic biomarkers and BMI adjusted for demographic characteristics.
The assessment of prevalence yielded several noteworthy results. In particular, the prevalence of severe obesity was lower than previously reported in other non-EMR Mississippi-based studies. For example, in a representative sample of Mississippi public school-aged students (surveyed biennially), Zhang et al.16 found the prevalence of class II obesity was 9.1%, whereas in this study it was estimated to be 6.3%. These differential findings may be attributable to the exclusion of specialty care patients in the current EMR-based study. Despite the general finding that severe obesity was lower than expected in this study, NHB female adolescents had a particularly high rate of severe obesity. In general, obesity and severe obesity have been observed with greater prevalence among female and racial and ethnic minority children and adolescents, with particularly high rates among American Indian/Alaska Native, Hispanic, and Black populations.17 Our findings contribute to this phenomenon and are relevant to populations with high proportions of NHB children and adolescents.
Obesity in children and adolescents increases the risk for premature cardiometabolic disease across the life course.18,19 Obesity is a primary risk factor for HTN20 and elevated BP in children and adolescents has been associated with premature cardiovascular disease in adulthood.21 The prevalence of elevated BP and HTN in this study was higher than in other reports,22,23 suggesting increased risk for cardiovascular disease in this population.
The prevalence of prediabetes was found to be in concordance with recent estimates, while the prevalence of dyslipidemia was higher than expected.24,25 These findings should be viewed cautiously. Lipid profiles and HbA1c were reported for a subset of the overall study population, which differed substantially from the overall study sample. In particular, the lipid subsample had greater age (mean = 13.3) and zBMI (mean = 0.564) compared to the overall sample, while the HbA1c subsample had greater age (mean = 14.5 years), zBMI (mean = 2.13), percentages of racial and ethnic minorities (NHB: 83.6% and Other: 10.1%, and percentage of females (61.7%) than the overall sample. This may be a result of confounding by indication—underlying clinical indications may have been the impetus for collecting these measures. Thus, these findings should not be viewed as representative of the entire study sample or the broader child and adolescent population in Mississippi. For inferential purposes, methods such as propensity score matching should be employed in future studies to address confounding by indication and to ensure that the subsample is representative of the broader study sample and population of interest.26
Based on the assessment of the multivariable relationship between zBMI and demographic characteristics, the current study in a clinical population found a larger proportion of obesity than the age and sex-matched reference population. Although zBMI is normatively adjusted for age and sex, significant and independent residual associations were found between sex and cross-sectional age and zBMI. Participants aged 4 through 19 exhibited elevated zBMI, however, the cross-sectional increase in zBMI was mainly observed in children aged 3 through 9 years before plateauing in those 10 through 19 years old. There are three critical periods for the primary prevention of obesity in children and adolescents: the perinatal period, infancy, and adolescence.27 While cross-sectional observations require confirmation in a longitudinal study, the association between age and zBMI suggested that interventions targeting the perinatal and infancy periods would be more promising for preventing obesity than those initiated during adolescence. This adds to the mounting epidemiological evidence calling for prevention strategies in pregnancy and infancy.28
In assessing the multivariable relationships between various cardiometabolic biomarkers and BMI adjusted for demographic characteristics, visit year was identified as having a statistically significant, negative association with SBP, DBP, TC, and LDL. This indicates that as time went on, the average measurement of each of these cardiometabolic biomarkers decreased. The magnitude of change as year increased was small. However, this finding may indicate that the cardiometabolic health of the study population improved slightly over time or may have been an artifact of the selection of the study population. 24–26,29–31
This study was not without limitations. First, the EMR data represented a clinical population, which may not have been representative of the general population. Second, this was a single-center study with an overrepresentation of NHBs and metropolitan residents. Third, routine height, weight, and BP measurements in EMR data may lack rigorous standardization. BP measures were from a single clinical encounter, but guidelines recommend measures be taken across three independent encounters before making a diagnosis.32 Fourth, the ascertainment of lipid and HbA1c measures was likely confounded by indication, greatly limiting the generalizability and representativeness of their accompanying findings. Sixth, the race/ethnicity classifications include a catch-all category for all other races/ethnicities included in the study. This assumes that all other races/ethnicities have similar effect sizes, which may not be true. However, due to small sample sizes, the alternative was to not represent people of other racial/ethnicities in the study. For practical reasons, we created the catch-all category, but the results should be interpreted with caution. Lastly, longitudinal associations could not be assessed using a cross-sectional study design.
Based on this research, there are several avenues for future research to improve the use of EMR for the surveillance of obesity and cardiometabolic health in the absence of state-based surveillance systems. First, the influence of including specialty care patients in the assessment of obesity and cardiometabolic health should be studied to identify methods to combat underestimation. Second, methods for addressing and correcting for confounding by indication in EMRs should be identified and applied to increase generalizability and representativeness. Third, this study looked at individual cardiometabolic biomarkers and their association with BMI and demographic characteristics but did not include a composite characterization of cardiometabolic health, such as through a cardiometabolic risk score. There are other risk metrics in use in adults that should be studied in children and adolescents.33 Lastly, the identification of potential intervention times and of the secular trend in cardiometabolic health should be studied via longitudinal methods.
SO WHAT?
This is the first EMR-based report from an academic medical center that describes obesity and cardiometabolic disease risk factors among children and adolescents in Mississippi. This observation from cross-sectional data indicated a high risk of severe obesity and accelerated cardiometabolic disease risk in this primary care pediatric population from a large community-based pediatric practice within the only academic medical center in Mississippi. Early life course interventions may present the best opportunity for obesity and cardiometabolic disease prevention. Longitudinal cohort studies in children and adolescents are needed to characterize adiposity and cardiometabolic phenotypes. Further investigation is warranted to elucidate the severity of risk for cardiometabolic disease among pediatric specialty care populations at this academic medical center. Using EMR data to assess obesity and cardiometabolic disease risk factors in pediatric patients is relevant to other states that do not have statewide obesity surveillance systems. In the absence of these surveillance systems, other medical centers could reproduce our methods on the EMRs from their patient populations to provide insight into the state of obesity and other conditions within their medical system and in their local area. Further research on using EMR to monitor obesity and risk for cardiometabolic disease in children and adolescents is a priority.
Funding Statement:
Research reported in this publication was supported in part by the National Institute of General Medical Sciences of the National Institutes of Health under Award Number U54GM115428; the Eunice Shriver National Institute of Child Health and Human Development under award number U54HD113159; the National Heart, Lung, and Blood Institute and National Institute on Minority Health and Health Disparities under award numbers HHSN268201800012I, HHSN268201800015I, and HHSN26800001; the National Institute on Minority and Health Disparities under award number P50MD017338; and the Centers for Disease Control and Prevention under cooperative agreements NU58DP007397 and NU58DP006572. The content is solely the authors’ responsibility. It does not represent the official views of the National Institutes of Health, the Centers for Disease Control and Prevention, or the University of Mississippi Medical Center. The corresponding author affirms that they have listed all contributors as co-authors. A peer-reviewed abstract of the findings was presented in poster format at the 2023 annual meeting of the Society of Behavioral Medicine.
Footnotes
Declaration of Conflicting Interest:
The authors declare no potential conflicts of interest concerning the research, authorship, or publication of this article.
Ethical Approval and Informed Consent Statement:
This study was approved by the University of Mississippi Medical Center Institutional Review Board (#2016–0292). For this study, informed consent was not necessary and was waived by the Institutional Review Board due to the use of de-identified data.
Data Availability Statement:
The dataset analyzed in the current study is available from the corresponding author by reasonable request.
References
- 1.DeBoer MD, Filipp SL, Gurka MJ. Geographical variation in the prevalence of obesity and metabolic syndrome among US adolescents. Pediatr Obes. 2019;14(4):e12483. doi: 10.1111/ijpo.12483 [DOI] [PMC free article] [PubMed] [Google Scholar]
- 2.Zgodic A, Eberth JM, Breneman CB, et al. Estimates of childhood overweight and obesity at the region, state, and county levels: a multilevel small-area estimation approach. Am J Epidemiol. 2021;190(12):2618–2629. doi: 10.1093/aje/kwab176 [DOI] [PMC free article] [PubMed] [Google Scholar]
- 3.Liu J, Lavie CJ, Park YMM, Bagiella E. Geographic variation and trends in prevalence of obesity among US adolescents, 2016–2021. Public Health. 2023/10/01/ 2023;223:128–130. doi: 10.1016/j.puhe.2023.07.017 [DOI] [PubMed] [Google Scholar]
- 4.Barker LE, Kirtland KA, Gregg EW, Geiss LS, Thompson TJ. Geographic distribution of diagnosed diabetes in the U.S.: a diabetes belt. Am J Prev Med. 2011;40(4):434–9. doi: 10.1016/j.amepre.2010.12.019 [DOI] [PubMed] [Google Scholar]
- 5.Kaczynski AT, Eberth JM, Stowe EW, et al. Development of a national childhood obesogenic environment index in the United States: differences by region and rurality. Int J Behav Nutr Phys Act. 2020;17(1):83. doi: 10.1186/s12966-020-00984-x [DOI] [PMC free article] [PubMed] [Google Scholar]
- 6.Kim Y, Cubbin C, Oh S. A systematic review of neighbourhood economic context on child obesity and obesity-related behaviours. Obes Rev. Mar 2019;20(3):420–431. doi: 10.1111/obr.12792 [DOI] [PMC free article] [PubMed] [Google Scholar]
- 7.Probst JC, Barker JC, Enders A, Gardiner P. Current state of child health in rural America: how context shapes children’s health. J Rural Health. 2018;34(S1):s3–s12. 10.1111/jrh.12222 [DOI] [PMC free article] [PubMed] [Google Scholar]
- 8.Kumanyika SK. A framework for increasing equity impact in obesity prevention. Am J Public Health. 2019;109(10):1350–1357. doi: 10.2105/ajph.2019.305221 [DOI] [PMC free article] [PubMed] [Google Scholar]
- 9.Grant T, Lott L, Miller J, Roberts J, Sutton VD, Zhang L. Mississippi Obesity Action Plan: Vision, Goals and Call to Action. 2018. https://msdh.ms.gov/page/resources/6164.pdf
- 10.Hohman KH, Martinez AK, Klompas M, et al. Leveraging electronic health record data for timely chronic disease surveillance: the multi-state EHR-based network for disease surveillance. JPHMP. 2023;29(2):162–173. doi: 10.1097/phh.0000000000001693 [DOI] [PMC free article] [PubMed] [Google Scholar]
- 11.Hoelscher DM, Ranjit N, Pérez A. Surveillance systems to track and evaluate obesity prevention efforts. Annu Rev Public Health. 2017;38:187–214. 10.1146/annurev-publhealth-031816-044537 [DOI] [PubMed] [Google Scholar]
- 12.Ghaferi AA, Schwartz TA, Pawlik TM. STROBE reporting guidelines for observational studies. JAMA Surgery. 2021;156(6):577–578. doi: 10.1001/jamasurg.2021.0528 [DOI] [PubMed] [Google Scholar]
- 13.Rural-Urban Community Area Codes. Economic Research Service, US Department of Agriculture. Accessed July 11, 2022, https://www.ers.usda.gov/data-products/rural-urban-commuting-area-codes/
- 14.Ogden CL, Carroll MD, Lawman HG, et al. Trends in obesity prevalence among children and adolescents in the United States, 1988–1994 through 2013–2014. JAMA. 2016;315(21):2292–9. doi: 10.1001/jama.2016.6361 [DOI] [PMC free article] [PubMed] [Google Scholar]
- 15.Team RC. R: A Language and Environment for Statistical Computing. R Foundation for Statistical Computing. www.R-project.org
- 16.Zhang L, Gordy XZ, Kolbo J, Johnson J. Prevalence and subgroup comparisons of obesity and severe obesity among Mississippi public school students. Prev Med Rep. 2021;23:101389–101389. doi: 10.1016/j.pmedr.2021.101389 [DOI] [PMC free article] [PubMed] [Google Scholar]
- 17.Ogden CL, Fryar CD, Martin CB, et al. Trends in obesity prevalence by race and Hispanic origin: 1999–2000 to 2017–2018. JAMA. 2020;324(12):1208–1210. doi: 10.1001/jama.2020.14590 [DOI] [PMC free article] [PubMed] [Google Scholar]
- 18.Drozdz D, Alvarez-Pitti J, Wójcik M, et al. Obesity and cardiometabolic risk factors: from childhood to adulthood. Nutrients. 2021;13(11). doi: 10.3390/nu13114176 [DOI] [PMC free article] [PubMed] [Google Scholar]
- 19.Bendor CD, Bardugo A, Pinhas-Hamiel O, Afek A, Twig G. Cardiovascular morbidity, diabetes and cancer risk among children and adolescents with severe obesity. Cardiovasc Diabetol. 2020;19(1):79. doi: 10.1186/s12933-020-01052-1 [DOI] [PMC free article] [PubMed] [Google Scholar]
- 20.Falkner B, Gidding SS, Baker-Smith CM, et al. Pediatric Primary Hypertension: An underrecognized condition: a scientific statement from the American Heart Association. Hypertension. 2023;80(6):e101–e111. doi: 10.1161/HYP.0000000000000228 [DOI] [PubMed] [Google Scholar]
- 21.Yang L, Magnussen CG, Yang L, Bovet P, Xi B. Elevated blood pressure in childhood or adolescence and cardiovascular outcomes in adulthood. Hypertension. 2020;75(4):948–955. doi:doi: 10.1161/HYPERTENSIONAHA.119.14168 [DOI] [PubMed] [Google Scholar]
- 22.Hardy ST, Sakhuja S, Jaeger BC, et al. Trends in blood pressure and hypertension among US children and adolescents, 1999–2018. JAMA Netw Open. 2021;4(4):e213917. doi: 10.1001/jamanetworkopen.2021.3917 [DOI] [PMC free article] [PubMed] [Google Scholar]
- 23.Song P, Zhang Y, Yu J, et al. Global prevalence of hypertension in children: a Systematic review and meta-analysis. JAMA Pediatrics. 2019;173(12):1154–1163. doi: 10.1001/jamapediatrics.2019.3310 [DOI] [PMC free article] [PubMed] [Google Scholar]
- 24.Mainieri F, La Bella S, Chiarelli F. Hyperlipidemia and cardiovascular risk in children and adolescents. Biomedicines. 2023;11(3). doi: 10.3390/biomedicines11030809 [DOI] [PMC free article] [PubMed] [Google Scholar]
- 25.Perak AM, Ning H, Kit BK, et al. Trends in levels of lipids and apolipoprotein B in US youths aged 6 to 19 years, 1999–2016. JAMA. 2019;321(19):1895–1905. doi: 10.1001/jama.2019.4984 [DOI] [PMC free article] [PubMed] [Google Scholar]
- 26.Kyriacou DN, Lewis RJ. Confounding by indication in clinical research. JAMA. 2016;316(17):1818–1819. doi: 10.1001/jama.2016.16435 [DOI] [PubMed] [Google Scholar]
- 27.Lawlor DA, Chaturvedi N. Treatment and prevention of obesity—are there critical periods for intervention? Int J Epidemiol. 2006;35(1):3–9. doi: 10.1093/ije/dyi309 [DOI] [PubMed] [Google Scholar]
- 28.Redsell SA, Edmonds B, Swift JA, et al. Systematic review of randomised controlled trials of interventions that aim to reduce the risk, either directly or indirectly, of overweight and obesity in infancy and early childhood. MCHN. 2016;12(1):24–38. 10.1111/mcn.12184 [DOI] [PMC free article] [PubMed] [Google Scholar]
- 29.Esquivel Zuniga R, DeBoer MD. Prediabetes in adolescents: prevalence, management and diabetes prevention strategies. Diabetes Metab Syndr Obes. 2021;14:4609–4619. doi: 10.2147/DMSO.S284401 [DOI] [PMC free article] [PubMed] [Google Scholar]
- 30.Perng W, Conway R, Mayer-Davis E, Dabelea D. Youth-onset type 2 diabetes: the epidemiology of an awakening epidemic. Diabetes Care. 2023;46(3):490–499. doi: 10.2337/dci22-0046 [DOI] [PMC free article] [PubMed] [Google Scholar]
- 31.Bjornstad P, Chao LC, Cree-Green M, et al. Youth-onset type 2 diabetes mellitus: an urgent challenge. Nat Rev Nephrol. 2023;19(3):168–184. doi: 10.1038/s41581-022-00645-1 [DOI] [PMC free article] [PubMed] [Google Scholar]
- 32.Flynn JT, Kaelber DC, Baker-Smith CM, et al. Clinical practice guideline for screening and management of high blood pressure in children and adolescents. Pediatrics. 2017;140(3). doi: 10.1542/peds.2017-1904 [DOI] [PubMed] [Google Scholar]
- 33.Sodero G, Rigante D, Pane LC, et al. Cardiometabolic risk assessment in a cohort of children and adolescents diagnosed with hyperinsulinemia. Diseases. 2024;12(6):119. 10.3390/diseases12060119 [DOI] [PMC free article] [PubMed] [Google Scholar]
Associated Data
This section collects any data citations, data availability statements, or supplementary materials included in this article.
Data Availability Statement
The dataset analyzed in the current study is available from the corresponding author by reasonable request.