

Abstract
Background
Determining the status of glioma molecular markers is a problem of clinical importance in medicine. Current medical-imaging-based approaches for this problem suffer from various limitations, such as incomplete fine-grained feature extraction of glioma imaging data and low prediction accuracy of molecular marker status.
Methods
To address these issues, a deep learning method is presented for the simultaneous joint prediction of multi-label statuses of glioma molecular markers. Firstly, a Gradient-aware Spatially Partitioned Enhancement algorithm (GASPE) is proposed to optimize the glioma MR image preprocessing method and to enhance the local detail expression ability; secondly, a Dual Attention module with Depthwise Convolution (DADC) is constructed to improve the fine-grained feature extraction ability by combining channel attention and spatial attention; thirdly, a hybrid model PMNet is proposed, which combines the Pyramid-based Multi-Scale Feature Extraction module (PMSFEM) and the Mamba-based Projection Convolution module (MPCM) to achieve effective fusion of local and global information; finally, an Iterative Truth Calibration algorithm (ITC) is used to calibrate the joint state truth vector output by the model to optimize the accuracy of the prediction results.
Results
Based on GASPE, DADC, ITC and PMNet, the proposed method constructs the Gradient-Aware Dual Attention Iteration Truth Calibration-PMNet (GDI-PMNet) to simultaneously predict the status of glioma molecular markers (IDH1, Ki67, MGMT, P53), with accuracies of 98.31%, 99.24%, 97.96% and 98.54% respectively, achieving non-invasive preoperative prediction, thereby capable of assisting doctors in clinical diagnosis and treatment.
Conclusions
The GDI-PMNet method demonstrates high accuracy in predicting glioma molecular markers, addressing the limitations of current approaches by enhancing fine-grained feature extraction and prediction accuracy. This non-invasive preoperative prediction tool holds significant potential to assist clinicians in glioma diagnosis and treatment, ultimately improving patient outcomes.
Keywords: Glioma, Molecular marker status, Multi-labeling, Image preprocessing, Iterative probability calibration, Attention mechanism improvement
Introduction
Glioma is the most common primary intracranial malignant tumor, accounting for approximately 45% of all brain tumors [1]. In the fifth edition of the World Health Organization (WHO) Classification of Tumors of the Central Nervous System [2], molecular diagnosis has become a crucial component in the evaluation of gliomas. By analyzing the status of molecular markers such as isocitrate dehydrogenase 1 (IDH1), Ki67 antigen (Ki67), O6-methylguanine-DNA methyltransferase (MGMT), and tumor protein 53 (P53), clinical experts can more accurately assess the disease progression in glioma patients. Such molecular information provides a scientific basis for the formulation of individualized diagnosis and treatment plans.
IDH1 is an enzyme that plays a critical role in cellular metabolism. Research indicates [3] that patients with IDH1 mutations generally exhibit greater sensitivity to chemotherapy and improved prognostic survival compared to those with the IDH1 wild-type. Ki67 [4, 5], a nuclear protein closely associated with cell proliferation, shows a positive correlation between its proliferation index and tumor grade. MGMT [6], a DNA repair enzyme, plays a vital role in repairing DNA damage caused by environmental carcinogens, thereby preventing cell carcinogenesis and death. Increased methylation of the MGMT promoter enhances the therapeutic efficacy of alkylating agents and radiotherapy. P53 [7], a key tumor suppressor gene, effectively regulates the proliferation and spread of tumor cells. Patients with P53 mutations tend to have a poorer prognosis compared to those with the P53 wild-type, particularly after targeted drug therapies. In summary, the accurate evaluation of molecular markers such as IDH1, Ki67, MGMT, and P53 is of significant clinical importance for the diagnosis and treatment of brain glioma, as such information helps in developing personalized treatment plans, thereby improving patient outcomes and quality of life.
Traditional methods for detecting the status of molecular markers such as IDH1, Ki67, MGMT, and P53 often rely on DNA sequencing or immunohistochemistry (IHC) [8]. These techniques require invasive procedures, such as biopsies, to obtain tissue samples, which can cause physical harm to patients and increase both detection costs and the financial burden on families. With the growing application of Artificial Intelligence (AI) in medical image processing, intelligent diagnostic methods based on medical images have become a research hotspot. These methods offer a non-invasive alternative, reducing patient trauma and medical expenses. More specifically, in image-based intelligent diagnosis, image preprocessing plays a pivotal role. Typically, raw Magnetic Resonance Imaging (MRI) scans have grayscale levels ranging from 0 to 4095. Traditional preprocessing techniques often reduce these grayscale levels to 256 in order to decrease image resolution and simplify the computational complexity of subsequent algorithms. However, uniformly dividing the continuous grayscale range into discrete levels has notable shortcomings. Given that adjacent pixels are often highly correlated, even subtle grayscale variations can carry important pathological information. For example, in MRI scans of brain gliomas, minimal differences in the tumor’s edges or internal structures may have significant diagnostic and grading implications. When a uniform hard-division approach is applied, these subtle differences may be obscured or lost, potentially omitting crucial details. Therefore, image preprocessing should carefully consider both the spatial relationships between pixels and the continuity of grayscale values, avoiding simple, rigid divisions. By preserving these fine distinctions and spatial information, key features can be more effectively extracted, thereby providing higher-quality data for subsequent tasks such as segmentation, classification, or diagnosis.
In recent years, intelligent diagnostic technologies based on medical images have advanced rapidly, offering new possibilities for non-invasive prediction of glioma molecular marker statuses [9]. For instance, Liu et al. [10] developed MultiGeneNet, achieving an accuracy of 83.57% and an area under the curve (AUC) of 0.886 in predicting IDH1 mutations. Similarly, Chen et al. [11] fine-tuned a ResNet50 model using transfer learning to predict the Ki67 index, attaining an accuracy of 90.5% with an AUC of 0.773. Faghani et al. [12] employed a DenseNet121 architecture, training three models with different random initializations and using a voting mechanism to predict MGMT promoter methylation status, ultimately reaching an accuracy of 65.42%. Zhao et al. [13] utilized an improved RegNet model to predict P53 gene status, achieving a remarkable accuracy of 94.70% and an AUC of 0.9657. Despite these successes, most studies have focused on single molecular markers, limiting their ability to capture the multifaceted molecular characteristics of gliomas. To address this gap, researchers have begun to explore the comprehensive evaluation of multiple molecular markers. Cui et al. [14] used Support Vector Machines (SVM) to predict the status of IDH1 and Ki67, reporting a prediction accuracy of 67.33% for IDH1 and 73.33% for Ki67, with corresponding AUC scores of 0.7098 and 0.7899. Calabrese et al. [15] combined radiomics and convolutional neural networks (CNNs) to predict IDH1 mutations, achieving an accuracy of 93%. For MGMT promoter methylation and P53 status, the combined method attained accuracies of 72% and 70%, respectively.Chauhan et al. [16] introduced ResNet50-H for multi-gene mutation status prediction, achieving an accuracy of 86.65% (AUC 0.9066) for IDH1, 77.43% (AUC 0.7332) for P53, and 91.17% (AUC 0.8955) for Ki67.These studies highlight the growing potential of AI-based methods in providing comprehensive, non-invasive diagnostic tools for glioma patients, paving the way for more personalized and effective treatment strategies.
However, these methods fail to account for the fine-grained features of glioma images and do not fully leverage the spatial and channel information within the images. This leads to incomplete feature extraction and suboptimal prediction of glioma gene statuses. To address these limitations, researchers have introduced attention mechanisms into deep learning models, focusing primarily on channel and spatial attention mechanisms. In the channel attention mechanism, Hu et al. [17] proposed the Squeeze-and-Excitation (SE) module, which enhances the model’s expressiveness by adaptively recalibrating channel weights. The SE module extracts global features via global average pooling, generates normalized weights through fully connected layers and sigmoid activation, and multiplies these weights channel-wise with the original feature map to achieve channel-wise recalibration. For spatial attention mechanisms, Jaderberg et al. [18] introduced the Spatial Transformer Network (STN) module, which dynamically adjusts the spatial features of input data to improve the network’s transformation capabilities. The STN consists of a localization network, a grid generator, and a sampler. It highlights key regions using an affine transformation matrix, generates transformed images, and samples them to enhance the model’s robustness and generalization. To combine both mechanisms, Woo et al. [19] proposed the Convolutional Block Attention Module (CBAM), which integrates channel and spatial attention to enhance CNN feature representation. CBAM first applies channel attention, generating weights via global pooling and a sigmoid function, followed by spatial attention, which produces a spatial attention map through pooling and convolution operations. However, existing attention mechanisms suffer from issues such as large parameter sizes and high computational complexity, which result in longer training and inference times.
Finally, due to the presence of numerous uncertainties during the training of deep learning models [20], such as noise in the data, model over-fitting, and adversarial attacks, these disturbances can hinder the model’s ability to accurately capture underlying patterns in the data. As a result, the accuracy of molecular biomarker status prediction for gliomas may decline.
In summary, although significant progress has been made in the prediction of glioma molecular marker status, challenges remain, such as incomplete feature extraction and low accuracy in predicting the status of multiple molecular markers. Therefore, this paper focuses on addressing these issues in the task of predicting the status of IDH1, Ki67, MGMT, and P53 molecular markers in Magnetic Resonance Imaging (MRI) brain glioma. The main contributions of this paper are as follows:
To optimize the grayscale preprocessing method for glioma images, the Gradient-Aware Spatially Partitioned Enhancement (GASPE) algorithm was proposed, using gradient information to guide spatial partitioning, enhancing local details while preserving the global structure, significantly improving image quality and processing efficiency.
To fully utilize the channel and spatial information in glioma images, reduce model parameters, and accelerate training speed, the Dual Attention with Depthwise Convolution (DADC) module was constructed. By combining depthwise convolution with an attention mechanism, this module reduced the model’s parameter size while fully leveraging the channel and spatial information of glioma images, improving the model’s computational efficiency and feature extraction ability.
To effectively integrate both local and global information from images, a hybrid model, PMNet, was proposed, which incorporates the Pyramid-based Multi-Scale Feature Extraction module (PMSFEM) and the Mamba-based Projection Convolution Module (MPCM). The PMSFEM and MPCM modules enable the effective fusion of local and global information, further optimizing multi-scale feature extraction and the interaction between global and local information.
To mitigate disturbances caused by various uncertainties, an Iteration Truth Calibration (ITC) algorithm was used to iteratively calibrate the multi-gene mutation truth vector calculated by the PMNet model, optimizing the multi-molecular biomarker state prediction results for brain glioma images.
The GDI-PMNet (Gradient-Aware Dual Attention Iteration Truth Calibration-PMNet) model for the simultaneous joint prediction of glioma molecular biomarkers status was proposed, which enabled non-invasive and precise prediction of multiple molecular biomarker states for brain glioma, including IDH1, Ki67, MGMT, and P53.
Related works
Attention mechanism
The attention mechanism [21] is a widely used technology that aims to improve the model’s ability to focus on and understand input data. It is usually divided into two types: channel attention mechanism and spatial attention mechanism. Combining these two attention mechanisms, the model can not only capture the key features in the data more accurately, but also reduce the impact of redundant features, thereby improving the model’s prediction and generalization capabilities.
Mamba
Mamba, an emerging State Space Model (SSM) [22], has demonstrated strong application potential in fields such as natural language processing and computer vision. For instance, in text summarization tasks, Mamba-based models effectively handle long-range dependencies, preserving the coherence and relevance of the text, and significantly outperform traditional Transformer models. In computer vision, Mamba models enhance the performance of image classification, object detection, and segmentation tasks by capturing long-range dependencies in images and videos [23].
Uncertainty calibration
The uncertainty of deep learning [24] mainly comes from factors such as random initialization parameters, stochastic gradient algorithms, and sample data, which lead to a certain degree of volatility and uncertainty in the model prediction results. The truth discovery algorithm [25] can effectively reduce the volatility and uncertainty of the model prediction results, thereby improving the reliability and generalization ability of the model.
Multi-label state joint prediction model of glioma molecular markers based on GDI-PMNet
Grayscale-based GASPE data preprocessing optimization algorithm
Common medical image preprocessing method is to evenly divide the grayscale values of the original image into 256 levels. For example, for MRI glioma image data with grayscales of 0-4095, this uniform division method can effectively reduce the number of grayscale levels, help reduce the model time complexity, and improve model performance. However, medical images typically have complex structures and subtle differences between tissues, and traditional uniform grayscale division methods have limitations in capturing these fine distinctions, potentially failing to fully represent the rich information in the image. To address this issue, this paper proposes GASPE algorithm based on superpixel segmentation, aimed at dividing the grayscale values of glioma images into 256 levels. The algorithm combines spatial information and grayscale similarity, clustering grayscale values with high spatial similarity together to more accurately express the subtle differences in medical images. Compared to traditional methods, the GASPE algorithm not only preserves key image details more effectively, but also significantly enhances the quality of medical image processing and analysis. The resulting images after uniform division and GASPE partitioning are shown in Fig. 1.
Fig. 1.

A Comparison of uniform partitioning and GASPE processing; B Comparison of histograms after uniform partitioning and GASPE processing; C: difference heat map based on A; D difference histogram based on B; E black and white difference map generated by C and D
However, traditional superpixel segmentation algorithms do not fully consider the variations in gradient magnitudes when clustering 4096 grayscale values into 256 levels. To address this issue, this paper proposes an improved superpixel segmentation algorithm that incorporates gradient information for gradient-aware spatial partitioning of the grayscale values in medical images. The specific steps are as follows:
The glioma image, sized 512 × 512, is randomly divided into 256 regions, with an initial centroid randomly selected within each region
To reduce computational complexity, the search range for each iteration is limited to a 2R×2R area around each clustering center. For each superpixel region, the distance U between each pixel and the current centroid is calculated, and the pixel is assigned to the nearest centroid’s cluster
 |
1 |
where R represents the initial step size between superpixels, N is the total number of pixels in the image, and T is the number of superpixels.
 |
2 |
where  is the color distance,
  is the spatial distance, m and the weight parameters determine the relative importance of each.
The gradient magnitude variation within the image’s spatial range is calculated. Each superpixel region is traversed to retrieve pixel values and their corresponding gradient magnitudes. Based on the gradient magnitudes, each pixel’s weight is computed, and weighted processing is applied to the pixel values within the region.
The centroid value corresponding to each pixel is retrieved and used to replace the original grayscale value of the pixels within the cluster.
The GASPE algorithm combines gradient information and superpixel segmentation techniques to perform non-uniform partitioning of the grayscale values in medical images, enabling a more precise representation of the fine structures and edge details in the images. During the superpixel segmentation process, a clustering method is applied to partition the image, and small-batch data is used for iterative processing to update the clustering centers, rather than operating on the entire dataset. This significantly accelerates the algorithm’s convergence speed and computational efficiency. Moreover, by integrating gradient information, the GASPE algorithm considers the spatial representation of the image more comprehensively, further optimizing the processing of fine image details.
Multi-label state joint prediction model of glioma molecular markers based on PMNet
In the proposed model, the input image is first processed through a feature extraction module, CBR (Convolution BatchNorm ReLU Block). This module includes a series of standard operations: a 3 × 3 convolutional layer that captures local features of the image, followed by Batch Normalization (BN) to speed up training and improve model stability. A ReLU activation function is then applied to introduce non-linearity, enhancing the model’s ability to learn complex patterns. Finally, max-pooling is used to reduce the resolution of the feature map while retaining essential feature information. The purpose of this module is to extract meaningful initial features from the raw image, establishing a strong foundation for deeper feature extraction and analysis. The architecture of the CBR module is shown in Fig. 2.
Fig. 5.

Dual attention with depthwise convolution
Medical images often contain rich, fine-grained features that traditional feature extraction methods struggle to capture fully. To address this challenge, this paper introduces PMSFEM designed to effectively extract and integrate features across multiple scales. The core idea behind PMSFEM is to construct a feature pyramid at multiple scales, leveraging feature maps of different resolutions to capture information ranging from fine-grained local details to broader global context. This multi-scale approach not only enhances the model’s ability to perceive subtle details, but also establishes effective connections between different scales, thereby enriching the feature representation and improving robustness. In this way, PMSFEM provides more comprehensive and detailed feature information for subsequent image analysis. The structure of PMSFEM is illustrated in Fig. 3, which shows the process of constructing the multi-scale feature pyramid from the input image.
Fig. 2.
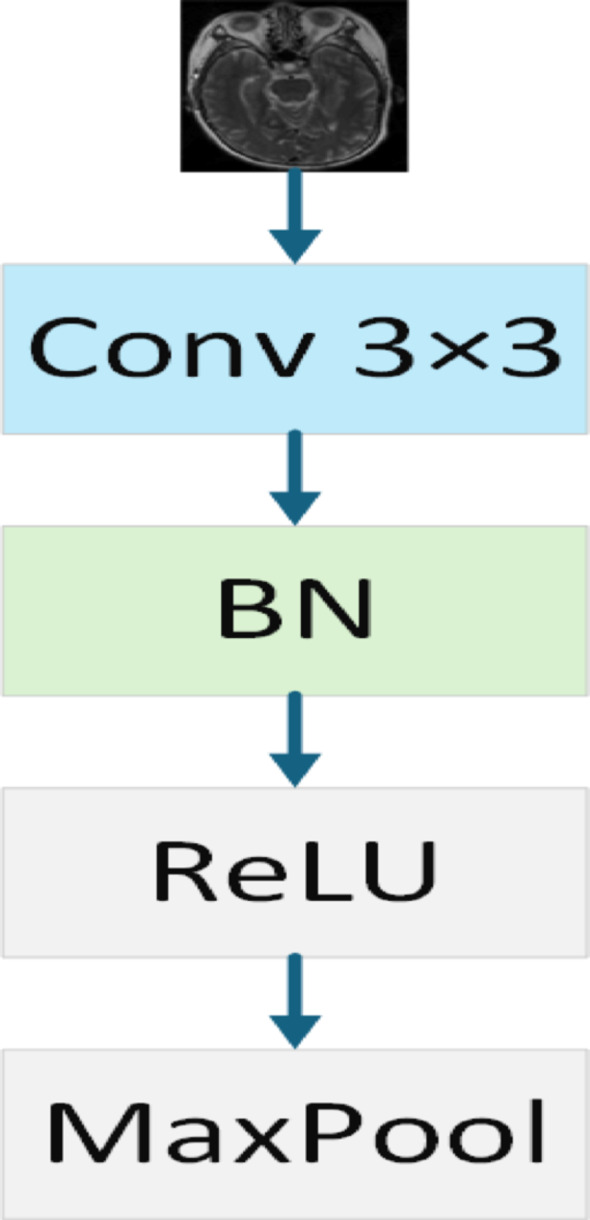
CBR block
To further address the challenge of extracting complex structures and multi-level features in medical images, this paper introduces MPCM to effectively extract and integrate features across multiple levels through a combination of projection and convolution operations. The core idea behind MPCM is to leverage the efficient sequence modeling capabilities of the Mamba architecture, using projection operations to map the input features into different feature spaces, followed by convolution operations for feature extraction. This approach not only enhances the model’s understanding of both local details and global context but also establishes more effective connections between different feature spaces. As a result, MPCM significantly improves the diversity and robustness of feature representations, providing richer feature information for subsequent image analysis. The structure of MPCM is illustrated in Fig. 4, which shows the process of transforming input features through multi-level projection and convolution operations.
Fig. 3.

Pyramid-based multi-scale feature extraction module
To further enhance feature representation, this paper introduces DADC module for extracting both channel and spatial information, thereby improving the model’s ability to capture relevant features. The mechanism combines depthwise separable convolution with a dual attention module to capture the rich details of images, boosting the model’s capability to handle glioma image data. For channel attention, global average pooling (GAP) and global max pooling (GMP) are applied to process each channel individually. These pooled features are then integrated through a shared multi-layer perceptron (MLP) to automatically learn the most relevant channel features for the current task while ignoring redundant information. For spatial attention, the channel-attended features undergo depthwise separable convolution to extract spatial information. The spatial attention module then processes these features to focus on the most significant spatial characteristics within the image. This design allows DADC to effectively combine channel and spatial attention mechanisms while leveraging depthwise separable convolution to reduce both parameter count and computational complexity. As a result, the model can maintain high efficiency while significantly improving feature representation capabilities. The structure of DADC is shown in Fig. 5.
Fig. 4.

Mamba-based projection convolution module
In terms of model efficiency, compared to standard convolution, let’s assume that the input image has a height of H, width of W, Cin input channels, Cout output channels, and a kernel size of K. The parameter count for standard convolution is given by formula (3), while the parameter count for depthwise separable convolution is shown in formula (4). The ratio between the two is given by formula (5). As seen from formula (5), using depthwise separable convolution significantly reduces the number of parameters.
 |
3 |
 |
4 |
 |
5 |
The proposed PMNet consists of the CBR Block and PM Block, where the PM Block is composed of the PMSFEM, MPCM, and DADC Blocks, enabling fine-grained feature extraction and enhanced feature representation of the input images. This modular design not only enhances the model’s predictive capability but also improves its robustness when handling complex glioma images. The network architecture of PMNet is illustrated in Fig. 6.
Fig. 6.

PMNet
Multi-label state joint prediction optimization algorithm for glioma molecular markers based on ITC
Since there are multiple factors of uncertainty disturbance in the training process of deep learning models, these uncertainty disturbances will affect the learning process of the model, resulting in low stability and accuracy of the prediction results. In order to solve this problem, this paper constructs a ITC algorithm to calibrate the prediction probability of the model, aiming to optimize the accuracy of the prediction results, thereby enhancing the model’s performance in the simultaneous multi-label joint prediction of glioma molecular markers.
Specifically, the ITC algorithm performs post-processing calibration on the predicted probability output by the model, making the predicted probability of the model closer to the true probability distribution. This process aims to alleviate the common confidence instability problem of deep learning models, that is, the probability output by the model often cannot accurately reflect its true uncertainty about the result. Therefore, in the ITC algorithm, N original vectors of prediction results are obtained from the trained network model as the input  of the calibration model, where
  is the probability vector, f is the model classifier function,
  is the classifier prediction vector, and its probability distribution is
  . L is the number of categories of the input image,
  is the probability representation in the L-dimensional space, that is, the distribution of the model’s prediction results in the L-dimensional space, as shown in formula (6):
 |
6 |
The iterative result of the true value vector  is shown in formula (7):
 |
7 |
Since  , the true value probability vector is
 . On this basis, the confidence
  is optimized so that the uncertainty of the prediction result converges to the local optimum through the objective function. Its objective function is shown in formula (8):
 |
8 |
Let  , so formula (9) can be equivalent to formula (9),
 |
9 |
In the above process, the algorithm seeks  to
to  minimize the cross entropy of and, where
  is the similarity value between
 and each high-dimensional classification vector, that is, the error value between the predicted result and the true molecular marker multi-label state of glioma patients. The smaller the error, the more accurate the prediction result. By adopting the method of alternately fixing the true value vector and the confidence, the optimal confidence
  is found by formula (10):
 |
10 |
After the confidence level is determined, the truth vector is updated using formula (11). The uncertainty of the result is continuously reduced within N iterations of the same sample. When the truth vector eventually becomes stable, the iterative update of the truth vector and the confidence level is terminated, and the confidence level and the calibrated truth vector  are obtained, thus optimizing the result of the previous iteration.
 |
11 |
Adjust the predicted probability output by the model to better reflect the true probability distribution. This can reduce the prediction bias caused by model uncertainty, thereby improving the reliability and accuracy of the prediction. By post-processing each prediction result and calibrating its probability value, the prediction results of the model are more consistent and reliable. The TPC structure is shown in Fig. 7.
Fig. 7.

Iteration truth calibration block
Multi-label state joint prediction model of glioma molecular markers based on GDI-PMNet
In order to comprehensively consider the challenges of glioma image preprocessing, model parameter complexity, and data uncertainty disturbance, this paper proposes the GDI-PMNet model, a classification model for the simultaneous joint prediction of glioma molecular marker multi-label states, based on GASPE, DADC, and IPC.The overall network structure is shown in Fig. 8.
Fig. 8.

Overall architecture diagram of the GDI-PMNet. A Gradient-aware spatial partition enhancement block; B PMNet; C CBR block; D PM block; E pyramid-based multi-scale feature extraction module; F Mamba-based projection convolution module; G dual attention with depthwise convolution block; H iteration truth calibration block; I predict block
Specifically, the GASPE algorithm is applied in the preprocessing stage of glioma medical images. By integrating spatial gradient information with non-uniform grayscale segmentation, GASPE significantly enhances the expression of fine details in the image. Compared to traditional uniform segmentation methods, GASPE not only captures finer details of medical images more accurately but also leverages spatial gradient information to improve feature representation. This, in turn, provides richer information for subsequent classification models, further enhancing the overall performance of the model.
The PMNet model efficiently extracts and represents fine-grained features by constructing the CBR Block and PM Block. The CBR Block, consisting of convolution, BN, and the ReLU activation function, extracts basic features while enhancing the model’s non-linearity. The PM Block is composed of PMSFEM, MPCM, and DADC Blocks. PMSFEM uses a multi-scale feature pyramid structure to capture multi-level information from local details to global context. MPCM leverages the efficient sequence modeling capabilities of the Mamba architecture to further enhance feature representation. The DADC Block combines channel and spatial attention mechanisms, focusing on key features while using depthwise separable convolutions to reduce parameters and computational complexity, thus improving feature representation. Through this modular design, PMNet significantly enhances the model’s ability to capture features at various levels, improving the precision and efficiency of feature extraction
Additionally, the ITC algorithm performs post-processing to calibrate the predicted probabilities output by the model, optimizing prediction accuracy. This calibration adjusts the model’s predicted probabilities to better align with the true probability distribution, accurately reflecting the model’s confidence in its predictions. It effectively mitigates the confidence bias commonly observed in deep learning models for complex tasks, ensuring the stability and accuracy of simultaneous multi-label joint predictions for glioma molecular biomarkers.
With this design, GDI-PMNet significantly enhances the classification performance of simultaneous joint prediction for glioma molecular biomarkers, offering more reliable decision support for clinical diagnosis and treatment. As shown in Fig. 9I, GDI-PMNet is capable of effectively predicting the status of multiple molecular biomarkers, including IDH1 Mutant, IDH1 Wild, Ki67 Mutant, Ki67 Wild, MGMT Methylated, MGMT UnMethylated, P53 Mutant, and P53 Wild.
Fig. 9.

A Original image; B Histogram of original image; C uniform image; D histogram of uniform image; E GASPE image; F histogram of GASPE image
Experimental results and analysis
Dataset
This paper utilizes two high-quality datasets for experimental analysis: the clinical dataset from a local affiliated hospital and the publicly available Cancer Imaging Archive (TCIA) dataset. The local affiliated hospital clinical dataset serves as the training set and includes multimodal brain MRI images from 285 glioma patients diagnosed by pathology. The distribution of molecular pathological features in this dataset is as follows: IDH1 wild-type in 182 cases (63.86%), mutated in 103 cases (36.14%); Ki67 wild-type in 55 cases (19.30%), mutated in 230 cases (80.70%); MGMT unmethylated in 173 cases (60.70%), methylated in 112 cases (39.30%); P53 wild-type in 84 cases (29.47%), mutated in 201 cases (70.53%). The molecular biomarker statuses of all patients were strictly confirmed through immunohistochemical (IHC) testing of surgically resected specimens. MRI imaging was performed using a 3.0 Tesla scanner, with the following specific parameters: spatial resolution of 0.4688 mm, flip angle (FA) of 90°, echo time (ET) of 23.88 ms, and repetition time of 2652.94 ms.
To comprehensively evaluate the model’s generalization performance, the TCIA public dataset was selected as an independent validation set, which includes imaging data from 270 glioma patients. To ensure data consistency and comparability, all image data underwent a rigorous preprocessing pipeline, including standardization and resampling, and were ultimately resized to a uniform specification of 224 × 224 pixels.
Evaluation indicators
Common evaluation indicators
This paper utilizes a range of evaluation metrics to comprehensively assess the performance of the proposed algorithm in the simultaneous joint prediction of multi-label status for glioma molecular biomarkers. The specific metrics include accuracy (Acc), precision (Pre), recall (Recall), F1-score, and the area under the receiver operating characteristic curve (AUROC). True positive (TP) refers to the number of multi-molecular biomarker mutation samples correctly predicted by the model; true negative (TN) represents the number of multi-molecular biomarker non-mutation samples correctly predicted by the model; false positive (FP) indicates the number of non-mutation samples that the model incorrectly predicts as mutations; and false negative (FN) represents the number of mutation samples that the model incorrectly predicts as non-mutations. AUROC is the area under the receiver operating characteristic curve (ROC), with a value range of [0, 1]. The closer the value is to 1, the better the model’s classification performance.
Acc refers to the ratio of the number of correctly classified samples in the test set to the total number of samples, and its formula is shown in formula (12).
 |
12 |
Pre refers to the ratio of the number of true mutation samples in the test set to the number of predicted mutation samples, and its formula is shown in formula (13):
 |
13 |
Recall refers to the ratio of the number of samples correctly predicted as mutations to the number of true mutations in the test set, and its formula is shown in formula (14).
 |
14 |
F1-score is the harmonic mean of Pre and Recall, and its formula is shown in formula (15).
 |
15 |
Model complexity evaluation index
To comprehensively assess the computational efficiency of the GDI-PMNet model, this paper quantitatively analyzes the model’s computational complexity from both time complexity and space complexity dimensions. Model complexity reflects the computational resources required during the inference process, which is an important metric for evaluating the model’s practicality and deployability. Time complexity (TC) is used to assess the computational time required during the model’s inference process, reflecting the model’s running efficiency, and its calculation formula is shown in Eq. (16). Space complexity (SC) is used to evaluate the memory required during the model’s inference process, reflecting the model’s operational efficiency, and its calculation formula is shown in Eq. (17).
 |
16 |
 |
17 |
Among them, n represents the number of network layers, k represents the convolution kernel size, Cin represents the number of input channels, Cout represents the number of output channels, F represents the feature map size, Clin represents the number of input channels of the FC layer, and Clout represents the number of output channels of the FC layer.
The calculation formulas for the TCPMNet(n) and SCPMNet(n) of the PMNet model are given by Eqs. (18) and (19), respectively.
 |
18 |
 |
19 |
where j represents the number of layers in the pyramid architecture, and q denotes the number of PM blocks.
The calculation formulas of TCI−PMNet(n) and SCI−PMNet(n) of the I-PMNet model are shown in formula (20) and formula (21) respectively.
 |
20 |
 |
21 |
Among them, P represents the dimension of the high-dimensional vector, L represents the number of categories, and S represents the number of ITC algorithm iterations.
Grayscale-based gradient-aware Spatial partitioning enhancement GASPE data preprocessing optimization algorithm
In this paper, we applied GASPE algorithm to optimize the preprocessing of the glioma dataset. Specifically, as shown in Fig. 9A and B display part of the original images and their corresponding histograms for a single patient in this sequence; Fig. 9C and D present the results of images and histograms after conventional uniform image partition preprocessing; while Fig. 9E and F show the processed images and histograms after applying the GASPE algorithm.
By comparing Fig. 9A–F, it is evident that the image details in Fig. 9E are better highlighted, the histogram is more balanced, and the image contrast has been significantly enhanced. This indicates that the GASPE algorithm has enabled more reasonable spatial partitioning of pixels and more precise boundary delineation of tissues and organs, thus providing a more accurate and high-quality foundation for subsequent image processing and analysis.
The algorithm time comparison is shown in Table 1. The bold words in the table indicate the optimal performance. It can be seen from Table 1 that the GASPE algorithm proposed in this article takes far less time than the original K-Means algorithm in single image preprocessing.
Table 1.
Algorithm time comparison
| Model | The time of single image (s) |
|---|---|
| K-means | 88.29 |
| GASPE | 0.12 |
Bold value indicate the optimal performance
Comparisons of time and space complexities
To further validate the effectiveness of the pyramid architecture layer depth and the IPC algorithm on TC and SC in this experiment, we compared the basic PMNet model, the PMNet models with different pyramid architecture layer depths, and the I-PMNet model incorporating the IPC algorithm. The comparison results are shown in Table 2.
Table 2.
Comparison of time complexity and space complexity of the model
| Model | TC (Flops/G) | SC (Byte/M) | Acc_IDH1 | Acc_Ki67 | Acc_MGMT | Acc_P53 |
|---|---|---|---|---|---|---|
| PMNet | 21.52225672 | 27.642438 | 96.91 | 97.90 | 96.56 | 97.38 |
| 2-PMNet | 30.589260624 | 35.307718 | 97.20 | 98.37 | 96.51 | 97.67 |
| 3-PMNet | 39.656264528 | 42.972998 | 97.44 | 98.08 | 96.68 | 97.90 |
| 4-PMNet | 48.723268432 | 50.638278 | 97.85 | 98.84 | 97.50 | 97.44 |
| 5-PMNet | 57.790272336 | 58.303558 | 98.14 | 98.84 | 97.85 | 98.49 |
| I-PMNet | 22.52307592 | 28.461638 | 96.91 | 98.37 | 96.62 | 98.02 |
| 2I-PMNet | 30.590079824 | 36.126918 | 97.26 | 98.66 | 96.33 | 97.09 |
| 3I-PMNet | 39.657083728 | 43.792198 | 97.61 | 98.02 | 96.74 | 97.79 |
| 4I-PMNet | 48.724087632 | 51.457478 | 98.31 | 99.24 | 97.96 | 98.54 |
| 5I-PMNet | 57.791091536 | 59.122758 | 98.23 | 98.19 | 98.27 | 98.19 |
Bold values indicate the optimal performance
Comparison of joint prediction results of multi-label states of glioma molecular markers using various attention methods
To further validate the effectiveness of the proposed method, the model was compared with commonly used attention mechanisms. The comparison results are shown in Table 3, and the result comparison graph is presented in Fig. 10. Experimental results demonstrate that the proposed model achieves the best performance.
Table 3.
Comparison of classification results of glioma molecular markers with multiple labeling status between between different attention mechanisms (unit: %)
| Model | DADC | CBAM [26] | CA [27] | SE [28] | SCSE [29] | GAM [30] | |
|---|---|---|---|---|---|---|---|
| ACC (%) | IDH1 | 97.32 | 95.63 | 95.98 | 96.10 | 96.51 | 96.10 |
| Ki67 | 98.31 | 98.14 | 97.79 | 97.15 | 97.15 | 97.32 | |
| MGMT | 96.62 | 96.51 | 95.75 | 95.69 | 95.63 | 96.04 | |
| P53 | 98.20 | 97.15 | 96.56 | 96.45 | 96.68 | 97.44 | |
| Pre (%) | IDH1 | 97.44 | 95.55 | 95.93 | 95.81 | 96.29 | 95.99 |
| Ki67 | 97.89 | 97.77 | 97.31 | 96.09 | 95.88 | 96.64 | |
| MGMT | 96.80 | 96.44 | 95.59 | 95.66 | 95.38 | 95.86 | |
| P53 | 98.24 | 97.07 | 96.52 | 96.69 | 96.85 | 97.34 | |
| Recall (%) | IDH1 | 96.77 | 95.00 | 95.39 | 95.78 | 96.16 | 95.57 |
| Ki67 | 96.68 | 96.23 | 95.56 | 94.71 | 94.94 | 94.70 | |
| MGMT | 96.00 | 96.09 | 95.33 | 95.13 | 95.30 | 95.69 | |
| P53 | 97.37 | 95.98 | 95.10 | 94.67 | 95.07 | 96.43 | |
| F1-score (%) | IDH1 | 97.10 | 95.26 | 95.64 | 95.79 | 96.23 | 95.77 |
| Ki67 | 97.27 | 96.98 | 96.40 | 95.39 | 95.40 | 95.64 | |
| MGMT | 96.40 | 96.26 | 95.46 | 95.38 | 95.34 | 95.77 | |
| P53 | 97.79 | 96.50 | 95.78 | 95.60 | 95.90 | 96.87 | |
| AUROC (%) | IDH1 | 97.09 | 95.26 | 95.64 | 95.79 | 96.23 | 95.77 |
| Ki67 | 97.27 | 96.98 | 96.40 | 95.38 | 95.40 | 95.64 | |
| MGMT | 96.37 | 96.26 | 95.46 | 95.38 | 95.34 | 95.77 | |
| P53 | 97.79 | 96.50 | 95.78 | 95.60 | 95.91 | 96.87 | |
Comparison of the joint prediction results of multiple models for multi-label status of glioma molecular markers
Bold values indicate the optimal performance
Fig. 10.

Comparison of the performance results of different attention mechanisms
To further validate the effectiveness of the proposed method, the model was compared with commonly used models on the local affiliated hospital clinical dataset. The comparison results are shown in Table 4, and the radar chart comparison is presented in Fig. 11. Additionally, the proposed model was compared with common models on the TCIA public dataset, with the comparison results shown in Table 5 and the radar chart in Fig. 12. Furthermore, the model was also compared with existing methods, and the results are presented in Table 6. Experimental results indicate that the proposed model achieves optimal performance.
Table 4.
Comparison of classification results of glioma molecular markers with multiple labeling status between models on a clinical dataset from a local affiliated hospital (unit: %)
| Model | GDI-PMNet | Res Net [31] | EfficientNet [32] | GhostNet [33] | PVT [34] | ViT [35] | Swin-tra nsformer [36] | Reg Net [37] | ConvNext [38] | |
|---|---|---|---|---|---|---|---|---|---|---|
| ACC (%) | IDH1 | 98.31 | 94.99 | 92.08 | 90.86 | 92.89 | 91.90 | 92.25 | 92.95 | 92.78 |
| Ki67 | 99.24 | 96.97 | 95.28 | 94.87 | 95.75 | 95.11 | 94.99 | 95.46 | 96.68 | |
| MGMT | 97.96 | 94.53 | 92.49 | 91.03 | 92.20 | 91.32 | 92.31 | 92.49 | 92.31 | |
| P53 | 98.54 | 95.63 | 93.36 | 93.54 | 94.18 | 93.24 | 93.71 | 93.65 | 93.07 | |
| Pre (%) | IDH1 | 98.37 | 94.93 | 91.58 | 90.71 | 92.69 | 91.84 | 91.80 | 92.62 | 92.17 |
| Ki67 | 99.42 | 96.06 | 93.30 | 93.04 | 94.59 | 92.27 | 92.17 | 94.04 | 96.07 | |
| MGMT | 97.89 | 94.29 | 92.57 | 90.61 | 91.75 | 90.76 | 92.01 | 92.67 | 91.87 | |
| P53 | 98.38 | 95.91 | 92.97 | 93.00 | 93.78 | 92.35 | 93.19 | 93.15 | 92.06 | |
| Recall (%) | IDH1 | 98.04 | 94.23 | 91.29 | 89.41 | 91.90 | 90.58 | 91.43 | 92.11 | 92.28 |
| Ki67 | 98.17 | 94.15 | 91.39 | 90.23 | 91.57 | 92.08 | 91.78 | 91.16 | 93.17 | |
| MGMT | 97.80 | 94.01 | 91.33 | 90.19 | 91.59 | 90.73 | 91.53 | 91.24 | 91.71 | |
| P53 | 98.10 | 93.44 | 90.72 | 91.14 | 91.94 | 91.11 | 91.38 | 91.28 | 90.99 | |
| F1-score (%) | IDH1 | 98.20 | 94.56 | 91.43 | 89.99 | 92.27 | 91.14 | 91.61 | 92.36 | 92.22 |
| Ki67 | 98.78 | 95.07 | 92.31 | 91.55 | 92.98 | 92.18 | 91.97 | 92.51 | 94.53 | |
| MGMT | 97.84 | 94.15 | 91.88 | 90.39 | 91.67 | 90.75 | 91.76 | 91.86 | 91.79 | |
| P53 | 98.24 | 94.57 | 91.75 | 92.00 | 92.80 | 91.70 | 92.22 | 92.15 | 91.50 | |
| AUROC (%) | IDH1 | 98.20 | 94.56 | 91.43 | 89.99 | 92.27 | 91.14 | 91.61 | 92.36 | 92.22 |
| Ki67 | 98.78 | 95.07 | 92.31 | 91.55 | 92.98 | 92.18 | 91.97 | 92.51 | 94.53 | |
| MGMT | 97.84 | 94.15 | 91.88 | 90.39 | 91.67 | 90.75 | 91.76 | 91.86 | 91.79 | |
| P53 | 98.24 | 94.57 | 91.75 | 92.00 | 92.80 | 91.70 | 92.22 | 92.15 | 91.50 | |
Fig. 11.

Performance comparison results of different models on local affiliated hospital datasets
Table 5.
Comparison of classification results of glioma molecular markers with multiple labeling status among different models on the TCIA public dataset (units:%)
| Model | GDI-PMNet | Res Net [31] |
EfficientNet [32] | GhostNet [33] | PVT [34] | ViT [35] | Swin-Tra nsformer [36] | Reg Net [37] | ConvNext [38] | |
|---|---|---|---|---|---|---|---|---|---|---|
| ACC (%) | IDH1 | 98.14 | 97.31 | 94.70 | 94.14 | 53.75 | 92.73 | 53.95 | 94.50 | 95.14 |
| Ki67 | 98.84 | 97.35 | 94.70 | 94.18 | 54.11 | 92.69 | 54.15 | 94.50 | 95.18 | |
| MGMT | 97.85 | 97.31 | 94.70 | 94.10 | 53.63 | 92.69 | 54.52 | 94.50 | 95.14 | |
| P53 | 98.49 | 97.31 | 94.70 | 94.14 | 51.18 | 92.65 | 53.59 | 94.46 | 95.14 | |
| Pre (%) | IDH1 | 98.11 | 97.31 | 94.72 | 94.13 | 53.78 | 92.72 | 54.58 | 94.49 | 95.13 |
| Ki67 | 98.81 | 97.35 | 94.72 | 94.17 | 56.10 | 92.68 | 54.44 | 94.49 | 95.18 | |
| MGMT | 97.93 | 97.31 | 94.72 | 94.09 | 53.50 | 92.68 | 55.30 | 94.49 | 95.13 | |
| P53 | 98.28 | 97.31 | 94.72 | 94.13 | 52.63 | 92.64 | 59.11 | 94.45 | 95.13 | |
| Recall (%) | IDH1 | 97.93 | 97.31 | 94.68 | 94.16 | 53.19 | 92.75 | 53.16 | 94.51 | 95.15 |
| Ki67 | 97.47 | 97.35 | 94.68 | 94.20 | 53.12 | 92.70 | 53.50 | 94.51 | 95.18 | |
| MGMT | 97.51 | 97.31 | 94.68 | 94.12 | 53.42 | 92.70 | 53.75 | 94.51 | 95.14 | |
| P53 | 98.06 | 97.31 | 94.68 | 94.16 | 51.93 | 92.66 | 52.37 | 94.47 | 95.14 | |
| F1-score (%) | IDH1 | 98.02 | 97.31 | 94.69 | 94.14 | 51.57 | 92.73 | 49.65 | 94.50 | 95.14 |
| Ki67 | 98.12 | 97.35 | 94.69 | 94.18 | 47.12 | 92.69 | 51.24 | 94.50 | 95.18 | |
| MGMT | 97.71 | 97.31 | 94.69 | 94.10 | 53.27 | 92.69 | 50.49 | 94.50 | 95.14 | |
| P53 | 98.17 | 97.31 | 94.69 | 94.14 | 48.06 | 92.65 | 42.17 | 94.46 | 95.14 | |
| AUROC (%) | IDH1 | 98.02 | 97.31 | 94.69 | 94.14 | 51.57 | 92.73 | 49.65 | 94.50 | 95.14 |
| Ki67 | 98.12 | 97.35 | 94.69 | 94.18 | 47.12 | 92.69 | 51.24 | 94.50 | 95.18 | |
| MGMT | 97.71 | 97.31 | 94.69 | 94.10 | 53.27 | 92.69 | 50.49 | 94.50 | 95.14 | |
| P53 | 98.17 | 97.31 | 94.69 | 94.14 | 48.06 | 92.65 | 42.17 | 94.46 | 95.14 | |
Fig. 12.

Performance comparison of different models on TCIA public dataset
Table 6.
Comparison of the results of this paper’s method with existing methods (units:%)
| Model | GDI-PMNet | Liu et al. [10] | Chen et al. [11] | Faghani et al. [12] | Zhao et al. [13] | Cui et al. [14] | Calabrese et al. [15] | Chauhan et al. [16] | |
|---|---|---|---|---|---|---|---|---|---|
| ACC (%) | IDH1 | 98.31 | 83.57 | 67.33 | 93.00 | 86.65 | |||
| Ki67 | 99.24 | 90.50 | 73.33 | 91.17 | |||||
| MGMT | 97.96 | 65.42 | 72.00 | ||||||
| P53 | 98.54 | 94.70 | 70.00 | 77.43 | |||||
| Pre (%) | IDH1 | 98.37 | 83.33 | ||||||
| Ki67 | 99.42 | ||||||||
| MGMT | 97.89 | ||||||||
| P53 | 98.38 | 94.31 | |||||||
| Recall (%) | IDH1 | 98.04 | 75.58 | ||||||
| Ki67 | 98.17 | ||||||||
| MGMT | 97.80 | ||||||||
| P53 | 98.10 | 98.53 | |||||||
| F1-score (%) | IDH1 | 98.20 | 79.27 | ||||||
| Ki67 | 98.78 | ||||||||
| MGMT | 97.84 | ||||||||
| P53 | 98.24 | 96.38 | |||||||
| AUROC (%) | IDH1 | 98.20 | 88.60 | 70.98 | 90.66 | ||||
| Ki67 | 98.78 | 77.30 | 78.99 | 89.55 | |||||
| MGMT | 97.84 | ||||||||
| P53 | 98.24 | 96.57 | 73.32 | ||||||
Ablation experiment
To demonstrate the superiority of the GDI-PMNet model, ablation experiments were conducted on both the local affiliated hospital dataset and the TCIA public dataset. The purpose of these experiments was to verify the impact of different module combinations on the experimental results. The experimental results show that removing each individual module leads to a noticeable decrease in accuracy. This indicates that the model with the highest prediction accuracy is effective in capturing the multi-label heterogeneity features of glioma molecular markers. The comparison of the ablation experiment results is presented in Tables 7 and 8, and the ablation comparison results are illustrated in Figs. 13 and 14
Table 7.
Comparison of results of ablation experiments on molecular markers of glioma on local affiliated hospital clinical dataset (unit: %)
| Model | GDI-PMNet | GD-PMNet | G-PMNet | PMNet | |
|---|---|---|---|---|---|
| IPC | √ | ||||
| DADC | √ | √ | |||
| GASPE | √ | √ | √ | ||
| PMNet | √ | √ | √ | √ | |
| ACC (%) | IDH1 | 98.31 | 97.85 | 97.32 | 96.91 |
| Ki67 | 99.24 | 98.84 | 98.31 | 97.90 | |
| MGMT | 97.96 | 97.50 | 96.62 | 96.56 | |
| P53 | 98.54 | 97.44 | 98.20 | 97.38 | |
| Pre (%) | IDH1 | 98.37 | 97.67 | 97.44 | 97.32 |
| Ki67 | 99.42 | 98.58 | 97.89 | 97.83 | |
| MGMT | 97.89 | 97.47 | 96.80 | 96.37 | |
| P53 | 98.38 | 96.96 | 98.24 | 97.60 | |
| Re-call (%) | IDH1 | 98.04 | 97.76 | 96.77 | 96.13 |
| Ki67 | 98.17 | 97.69 | 96.68 | 95.31 | |
| MGMT | 97.80 | 97.22 | 96.00 | 96.34 | |
| P53 | 98.10 | 96.85 | 97.37 | 95.99 | |
| F1-score (%) | IDH1 | 98.20 | 97.71 | 97.10 | 96.67 |
| Ki67 | 98.78 | 98.13 | 97.27 | 96.51 | |
| MGMT | 97.84 | 97.35 | 96.40 | 96.35 | |
| P53 | 98.24 | 96.91 | 97.79 | 96.75 | |
| AUROC (%) | IDH1 | 98.20 | 97.71 | 97.09 | 96.67 |
| Ki67 | 98.78 | 98.13 | 97.27 | 96.51 | |
| MGMT | 97.84 | 97.35 | 96.37 | 96.35 | |
| P53 | 98.24 | 96.91 | 97.79 | 96.75 | |
Table 8.
Comparison of results of ablation experiments on molecular markers of glioma on the TCIA public dataset (unit: %)
| Model | GDI-PMDNet | GD-PMNet | G-PMNet | PMNet | |
|---|---|---|---|---|---|
| IPC | √ | ||||
| DADC | √ | √ | |||
| GASPE | √ | √ | √ | ||
| PMNet | √ | √ | √ | √ | |
| ACC (%) | IDH1 | 98.14 | 97.61 | 97.20 | 96.68 |
| Ki67 | 98.84 | 98.31 | 98.37 | 98.25 | |
| MGMT | 97.85 | 97.32 | 96.51 | 96.74 | |
| P53 | 98.49 | 97.90 | 97.67 | 97.96 | |
| Pre (%) | IDH1 | 98.11 | 97.64 | 97.32 | 96.98 |
| Ki67 | 98.81 | 98.23 | 98.16 | 98.30 | |
| MGMT | 97.93 | 97.45 | 96.47 | 96.65 | |
| P53 | 98.28 | 97.97 | 97.34 | 98.07 | |
| Re-call (%) | IDH1 | 97.93 | 97.21 | 96.65 | 95.94 |
| Ki67 | 97.47 | 96.34 | 96.60 | 96.00 | |
| MGMT | 97.51 | 96.84 | 96.06 | 96.42 | |
| P53 | 98.06 | 96.93 | 97.00 | 96.94 | |
| F1-score (%) | IDH1 | 98.02 | 97.41 | 96.96 | 96.42 |
| Ki67 | 98.12 | 97.25 | 97.36 | 97.10 | |
| MGMT | 97.71 | 97.13 | 96.26 | 96.53 | |
| P53 | 98.17 | 97.43 | 97.17 | 97.48 | |
| AUROC (%) | IDH1 | 98.02 | 97.41 | 96.96 | 96.42 |
| Ki67 | 98.12 | 97.25 | 97.36 | 97.10 | |
| MGMT | 97.71 | 97.13 | 96.26 | 96.53 | |
| P53 | 98.17 | 97.43 | 97.17 | 97.48 | |
Fig. 13.

Performance comparison results of different modules on local affiliated hospital datasets
Fig. 14.

Performance comparison of different modules on TCIA public dataset
Discussion
This paper introduces the GDI-PMNet model for the simultaneous multi-label prediction of glioma molecular marker statuses, effectively predicting the IDH1, Ki67, MGMT, and P53 markers in glioma patients. The experimental accuracies achieved are 98.31%, 99.24%, 97.96%, and 98.54%, respectively. These results not only validate the effectiveness of the GDI-PMNet model in a non-invasive prediction of glioma molecular marker statuses but also provide crucial support for preoperative precision diagnosis and personalized treatment planning.
The GDI-PMNet model improves prediction accuracy by employing the GASPE algorithm for image preprocessing optimization, the DADC module for enhanced feature extraction, and the ITC algorithm for calibrating prediction results. The GASPE algorithm, which combines gradient information with superpixel segmentation, significantly enhances the preprocessing quality of glioma MR images, improving the expression of local details. This optimized preprocessing method not only retains key information in the images but also provides high-quality data support for subsequent feature extraction and classification tasks. The DADC module further improves the model’s ability to extract fine-grained features by incorporating both channel attention and spatial attention mechanisms. This dual-attention mechanism focuses on critical regions in the images, reducing interference from redundant information, thus improving prediction accuracy. Additionally, the ITC algorithm calibrates the model’s joint output multi-label state true vector, effectively mitigating uncertainty disturbances in deep learning models and improving the accuracy of the prediction results. These improvements enable the GDI-PMNet model to excel in predicting glioma molecular marker statuses.
Despite the aforementioned encouraging improvements, there are still some issues that deserve further investigation in future research. Firstly, although high-quality clinical datasets and public datasets were used, these datasets may not fully capture the diversity of glioma patients. For instance, the local affiliated hospital dataset primarily includes data from patients in a specific region, which may limit the model’s generalizability to other regions or populations. This limitation is consistent with the findings of Chen et al. [39], who emphasized the importance of data diversity when developing glioma prediction models. Future research should consider incorporating more diverse datasets, including data from different regions and populations, to enhance the model’’s generalization capability.Secondly, while the GDI-PMNet model demonstrates excellent overall prediction accuracy, there is still room for improvement in the prediction of certain molecular markers, such as MGMT. For example, the recall and precision for predicting MGMT may still be improved. This may be due to the class imbalance in the dataset, where the number of samples with methylated MGMT status is significantly lower than those with unmethylated MGMT status, leading to insufficient prediction capabilities for the minority class. This issue is common in medical image analysis, as Faghani et al. [40] pointed out that class imbalance can lead to models being biased toward the majority class, affecting the performance of predictions for the minority class. Future research could explore techniques such as oversampling, undersampling, or synthetic data generation to balance the dataset and improve the model’s ability to predict minority classes.
Additionally, although the ITC algorithm was used to calibrate the model’s output, the interpretability of deep learning models remains a challenge. As Ma et al. [41] mentioned, the ‘black box’ nature of many deep learning models limits their application in clinical practice, especially in medical fields that require transparency and interpretability. While the ITC algorithm has improved the model’s accuracy to some extent, there is still a need for the development of more intuitive and clinically understandable explanation tools.
The above discussions suggest that future research could focus on several areas: First, expanding the sample size, particularly by including more data from different medical institutions, to verify the broad applicability of the model. Second, more efficient image preprocessing algorithms could be explored to reduce computational complexity and improve the model’s computational efficiency. Additionally, future research could attempt to incorporate more molecular markers, such as Telomerase Reverse Transcriptase (TERT) or ATR-X syndrome protein (ATRX), to further enhance the model’s prediction capabilities. Finally, exploring the integration of multimodal data, such as genomic and clinical data, could further improve the model’s prediction accuracy and clinical utility.
In conclusion, the GDI-PMNet model proposed in this paper excels in the simultaneous joint multi-label prediction of glioma molecular markers, offering reliable support for preoperative non-invasive prediction. By optimizing image preprocessing, enhancing feature extraction, and calibrating prediction results, GDI-PMNet significantly improves prediction accuracy, offering crucial support for the development of personalized diagnostic and treatment plans for glioma. Future research can further enhance the model’s generalizability and practicality by expanding the sample size, optimizing computational efficiency, and incorporating more external validation datasets.
Conclusion
This paper proposes the GDI-PMNet model, built upon GASPE, DADC, IPC, and PMNet, for the intelligent prediction of simultaneous joint multi-label statuses of glioma molecular biomarkers. GASPE optimizes the subtle details of glioma images, significantly improving the model’s diagnostic ability for genetic mutation status in glioma images. The DADC module enhances the fine-grained feature extraction capability by integrating channel and spatial information, further increasing the model’s focus on key features. The IPC module optimizes the multi-label status probabilities of molecular biomarkers calculated by PMNet, thereby improving the accuracy of joint predictions for glioma molecular biomarker status.
Experimental results demonstrate that the GDI-PMNet model, incorporating GASPE, DADC, IPC, and PMNet, performs exceptionally well in predicting the molecular biomarker status of glioma IDH1, Ki67, MGMT, and P53 based on MR images, with accuracies of 98.31%, 99.24%, 97.96%, and 98.54%, respectively. This model holds significant clinical value for non-invasive joint prediction of glioma molecular biomarker status and auxiliary diagnosis and treatment.
Acknowledgements
Not applicable.
Abbreviations
- GASPE
Gradient-aware spatially partitioned enhancement
- DADC
Dual attention module with depthwise convolution
- PMSFEM
Pyramid-based multi-scale feature extraction module
- MPCM
Mamba-based projection convolution module
- IT
Iterative truth calibration
- GDI-PMNet
Gradient-aware dual attention iteration truth calibration-PMNet
- WHO
World Health Organization
- IDH1
Isocitrate dehydrogenase 1
- Ki67
Ki67 antigen
- MGMT
O6-methylguanine-DNA methyltransferase
- P53
Tumor Protein 53
- IHC
Immunohistochemistry
- AI
Artificial intelligence
- MRI
Magnetic resonance imaging
- AUC
Area under the curve
- SVM
Support vector machines
- CNNs
Convolutional neural networks
- SE
Squeeze-and-excitation
- STN
Spatial transformer network
- CBAM
Convolutional block attention module
- SSM
State space model
- CBR
Convolution BatchNorm ReLU block
- BN
Batch Normalization
- GAP
Global average pooling
- GMP
Global max pooling
- MLP
Multi-layer perceptron
- TCIA
The cancer imaging archive
- FA
Flip angle
- ET
Echo time
- Acc
Accuracy
- Pre
Precision
- AUROC
Area under the receiver operating characteristic curve
- TP
True positive
- TN
True negative
- FP
False positive
- FN
False negative
- TC
Time complexity
- SC
Space complexity
- TERT
Telomerase reverse transcriptase
- ATRX
ATR-X syndrome protein
Author contributions
FL Writing – original draft, review & editing, Visualization, Methodology. TZ, YC, YC, HY and XX Data curation, Methodology, Project administration. HZ Writing – review & editing, Methodology, Project administration.
Funding
This work was supported by the National Natural Science Foundation of China(Grant Number 62102345); the Project for Research on Medical in Jiangsu Commission of Health(Grant Number Z2020032); and the Xuzhou Key Research and Development Program(Grant Number KC22117).
Data availability
Publicly available dataset used in this paper can be found at https://www.cancerimagingarchive.net/access-data. Private dataset used in this paper can be requested from the corresponding author upon reasonable request.
Declarations
Ethics approval and consent to participate
The study was conducted according to the guidelines of the Declaration of Helsinki, and approved by the Ethics Committee of Xuzhou Medical University. It was confirmed that informed consent was obtained from all subjects and/or their legal guardians.
Consent for publication
Not applicable.
Competing interests
The authors declare no competing interests.
Footnotes
Publisher’s note
Springer Nature remains neutral with regard to jurisdictional claims in published maps and institutional affiliations.
References
- 1.Asif S, Zhao M, Tang F, et al. An enhanced deep learning method for multi-class brain tumor classification using deep transfer learning. Multimedia Tools Appl. 2023;82(20):31709–36. [Google Scholar]
- 2.Louis DN, Perry A, Wesseling P, et al. The 2021 WHO classification of tumors of the central nervous system: a summary. Neuro Oncol. 2021;23(8):1231–51. [DOI] [PMC free article] [PubMed] [Google Scholar]
- 3.Xu J, Xu FP, Liu ZH, et al. The correlation analysis of TERT promoter mutations with IDH1/2 mutations and 1p/19q detected in human gliomas. Medicine. 2022;101(29):e29668. [DOI] [PMC free article] [PubMed] [Google Scholar]
- 4.Gates EDH, Lin JS, Weinberg JS, et al. Guiding the first biopsy in glioma patients using estimated Ki-67 maps derived from MRI: conventional versus advanced imaging. Neuro Oncol. 2019;21(4):527–36. [DOI] [PMC free article] [PubMed] [Google Scholar]
- 5.She Y, Liu X, Jiang J, et al. The role of apparent diffusion coefficient in the grading of adult isocitrate dehydrogenase-mutant astrocytomas: relationship with the Ki-67 proliferation index. Acta Radiol. 2024;65(5):489–98. [DOI] [PubMed] [Google Scholar]
- 6.Mansouri A, Hachem LD, Mansouri S, et al. MGMT promoter methylation status testing to guide therapy for glioblastoma: refining the approach based on emerging evidence and current challenges. Neuro Oncol. 2019;21(2):167–78. [DOI] [PMC free article] [PubMed] [Google Scholar]
- 7.Yang ZX, Ling F, Ruan SB, et al. Clinical and prognostic implications of 1p/19q, IDH, BRAF, MGMT promoter, and TERT promoter alterations, and expression of Ki-67 and p53 in human gliomas. Cancer Manag Res. 2021;13:8755–65. [DOI] [PMC free article] [PubMed] [Google Scholar]
- 8.Lee MH, Kim J, Kim ST, et al. Prediction of IDH1 mutation status in glioblastoma using machine learning technique based on quantitative radiomic data. World Neurosurg. 2019;125:e688–96. [DOI] [PubMed] [Google Scholar]
- 9.Ohba S, Kuwahara K, Yamada S, et al. Correlation between IDH, ATRX, and TERT promoter mutations in glioma. Brain Tumor Pathol. 2020;37:33–40. [DOI] [PubMed] [Google Scholar]
- 10.Liu X, Hu W, Diao S, et al. Multi-scale feature fusion for prediction of IDH1 mutations in glioma histopathological images. Comput Methods Programs Biomed. 2024;248:108116. [DOI] [PubMed] [Google Scholar]
- 11.Chen J, Xue Y, Ren L, et al. Predicting meningioma grades and pathologic marker expression via deep learning. Eur Radiol. 2024;34(5):2997–3008. [DOI] [PubMed] [Google Scholar]
- 12.Faghani S, Khosravi B, Moassefi M, et al. A comparison of three different deep learning-based models to predict the MGMT promoter methylation status in glioblastoma using brain MRI. J Digit Imaging. 2023;36(3):837–46. [DOI] [PMC free article] [PubMed] [Google Scholar]
- 13.Zhao Y, Liang F, Cao Y, et al. MRI-based model for accurate prediction of P53 gene status in gliomas. Electronic Research Archive. 2024;32(5):3113–29. [Google Scholar]
- 14.Cui Y, Dang Y, Zhang H, et al. Predicting isocitrate dehydrogenase genotype, histological phenotype, and Ki-67 expression level in diffuse gliomas with an advanced contrast analysis of magnetic resonance imaging sequence. Quant Imaging Med Surg. 2023;13(6):3400. [DOI] [PMC free article] [PubMed] [Google Scholar]
- 15.Calabrese E, Rudie JD, Rauschecker AM, et al. Combining radiomics and deep convolutional neural network features from preoperative MRI for predicting clinically relevant genetic biomarkers in glioblastoma. Neuro-oncology advances, 2022;4(1): vdac060. [DOI] [PMC free article] [PubMed]
- 16.Chauhan E, Sharma A, Uppin MS, et al. Multiple instance learning for glioma diagnosis using hematoxylin and eosin whole slide images: an Indian cohort study. arXiv preprint arXiv:2402.15832, 2024.
- 17.Hu J, Shen L, Sun G. Squeeze-and-excitation networks. In:Proceedings of the IEEE conference on computer vision and pattern recognition. 2018; p. 7132–7141.
- 18.Jaderberg M, Simonyan K, Zisserman A. Spatial transformer networks. Advances in neural information processing systems. 2015; p. 28.
- 19.Woo S, Park J, Lee JY, et al. Cbam: Convolutional block attention module[C]//Proceedings of the European conference on computer vision (ECCV). 2018: 3–19.
- 20.Ma C, Huang Z, Xian J, et al. Improving uncertainty calibration of deep neural networks via truth discovery and geometric optimization. In: Uncertainty in artificial intelligence. PMLR; 2021; p. 75–85.
- 21.Vaswani A, Shazeer N, Parmar N, et al. Attention is all you need. Advances in neural information processing systems. 2017; p. 30.
- 22.Gu A, Dao T. Mamba: Linear-time sequence modeling with selective state spaces. arXiv preprint arXiv:2312.00752, 2023.
- 23.Bansal S, Madisetty S, Rehman MZU, et al. A comprehensive survey of Mamba architectures for medical image analysis: classification, segmentation, restoration and beyond. arXiv preprint arXiv:2410.02362, 2024.
- 24.Ding H, Xu J. Learning the truth vector in high dimensions. J Comput Syst Sci. 2020;109:78–94. [Google Scholar]
- 25.Xu H, Zhang H, Li Q, et al. A data-semantic-conflict-based multi-truth discovery algorithm for a programming site. Comput Mater Continua. 2021;68(2):2681–91. [Google Scholar]
- 26.Woo S, Park J, Lee JY, et al. Cbam: Convolutional block attention module. In: Proceedings of the European conference on computer vision (ECCV). 2018; p. 3–19.
- 27.Hou Q, Zhou D, Feng J. Coordinate attention for efficient mobile network design. In: Proceedings of the IEEE/CVF conference on computer vision and pattern recognition. 2021; p. 13713–13722.
- 28.Hu J, Shen L, Sun G. Squeeze-and-excitation networks. In: Proceedings of the IEEE conference on computer vision and pattern recognition. 2018; p. 7132–7141.
- 29.Roy A G, Navab N, Wachinger C. Concurrent spatial and channel ‘squeeze and excitation’ in fully convolutional networks. In: Medical image computing and computer assisted intervention–MICCAI 2018: 21st international conference, Granada, Proceedings, Part I. Springer International Publishing; 2018; p. 421–429.
- 30.Liu Y, Shao Z, Hoffmann N. Global attention mechanism: Retain information to enhance channel-spatial interactions. arXiv preprint arXiv:2112.05561, 2021.
- 31.He K, Zhang X, Ren S, et al. Deep residual learning for image recognition. In: Proceedings of the IEEE conference on computer vision and pattern recognition. 2016; p. 770–778.
- 32.Koonce B, Koonce B. EfficientNet. Convolutional neural networks with swift for Tensorflow: image recognition and dataset categorization. 2021; p. 109–123.
- 33.Han K, Wang Y, Tian Q, et al. Ghostnet: More features from cheap operations. In: Proceedings of the IEEE/CVF conference on computer vision and pattern recognition. 2020; p.1580–1589.
- 34.Wang W, Xie E, Li X, et al. Pyramid vision transformer: a versatile backbone for dense prediction without convolutions. In: Proceedings of the IEEE/CVF international conference on computer vision. 2021; p. 568–578.
- 35.Dosovitskiy A, Beyer L, Kolesnikov A, et al. An image is worth 16x16 words: Transformers for image recognition at scale. arXiv preprint arXiv:2010.11929, 2020.
- 36.Liu Z, Lin Y, Cao Y, et al. Swin transformer: Hierarchical vision transformer using shifted windows. In: Proceedings of the IEEE/CVF international conference on computer vision. 2021; p. 10012–10022.
- 37.Radosavovic I, Kosaraju RP, Girshick R, et al. Designing network design spaces. In: Proceedings of the IEEE/CVF conference on computer vision and pattern recognition. 2020; p. 10428–10436.
- 38.Liu Z, Mao H, Wu CY, et al. A convnet for the 2020s. In: Proceedings of the IEEE/CVF conference on computer vision and pattern recognition. 2022. p. 11976–11986.
- 39.Chen J, Xue Y, Ren L, et al. Predicting meningioma grades and pathologic marker expression via deep learning. Eur Radiol. 2024;34(5):2997–3008. [DOI] [PubMed] [Google Scholar]
- 40.Faghani S, Khosravi B, Moassefi M, et al. A comparison of three different deep learning-based models to predict the MGMT promoter methylation status in glioblastoma using brain MRI. J Digit Imaging. 2023;36(3):837–46. [DOI] [PMC free article] [PubMed] [Google Scholar]
- 41.Ma C, Huang Z, Xian J, et al. Improving uncertainty calibration of deep neural networks via truth discovery and geometric optimization. In: Uncertainty in artificial intelligence. PMLR; 2021. p. 75–85.
Associated Data
This section collects any data citations, data availability statements, or supplementary materials included in this article.
Data Availability Statement
Publicly available dataset used in this paper can be found at https://www.cancerimagingarchive.net/access-data. Private dataset used in this paper can be requested from the corresponding author upon reasonable request.