

Abstract
Distinct hepatocyte subpopulations are spatially segregated along the portal–central axis and are critical to understanding metabolic homeostasis and injury in the liver1. Although several bioactive molecules, including ascorbate and bilirubin, have been described as having a role in directing zonal fates, zonal liver architecture has not yet been replicated in vitro2,3. Here, to evaluate hepatic zonal polarity, we developed a self-assembling zone-specific liver organoid by co-culturing ascorbate- and bilirubin-enriched hepatic progenitors derived from human induced pluripotent stem cells. We found that preconditioned hepatocyte-like cells exhibited zone-specific functions associated with the urea cycle, glutathione synthesis and glutamate synthesis. Single-nucleus RNA-sequencing analysis of these zonally patterned organoids identifies a hepatoblast differentiation trajectory that dictates periportal, interzonal and pericentral human hepatocytes. Epigenetic and transcriptomic analysis showed that zonal identity is orchestrated by ascorbate- or bilirubin-dependent binding of EP300 to TET1 or HIF1α. Transplantation of the self-assembled zonally patterned human organoids improved survival of immunodeficient rats who underwent bile duct ligation by ameliorating the hyperammonaemia and hyperbilirubinaemia. Overall, this multi-zonal organoid system serves as an in vitro human model to better recapitulate hepatic architecture relevant to liver development and disease.
The liver is a multi-faceted organ with a wide range of functions such as glycolysis and gluconeogenesis, lipogenesis and fatty acid oxidation, protein synthesis and xenobiotic catabolism. These divergent and complex functions are spatially segregated through compartmentalization into distinct regions called zone 1, 2 and 3 hepatocytes on the basis of their proximity from the central vein to the portal vein1,4. For example, the maintenance of nitrogen level in the liver is precisely balanced between input of nutrients and output as ammonia, which is metabolized by the urea cycle, nitric oxide cycle and glutamine synthesis5–7. The urea cycle is primarily carried out in zone 1 and 2 hepatocytes, whereas glutamine synthesis takes place in zone 3 hepatocytes8. The nitric oxide cycle is primarily maintained in zone 2 and 3 hepatocytes9. Citrulline is necessary for these pathways and its levels are maintained by the nitric oxide cycle, which is augmented by glutathione10. As a consequence of this zonal segregation, metabolic diseases tend to manifest within the zone in which the derangement appears.
Although much of the expression pattern is conserved between rodent and human liver zonation, some variations in metabolic compartmentalization exist owing to differences in metabolic demands4. Specifically, only 35.3% of all genes expressed in human liver exhibit similar expression to those in mice, suggesting the existence of unique genetic networks and transcriptional regulation11,12. For example, GLUL and CPS1 participate in nitrogen metabolism and have overlapping expression in pericentral and periportal regions, respectively, in rat liver13, whereas the human liver contains an intermediate zone where neither enzyme is present. These inherent genetic and molecular differences present a need for a human system to model development and disease.
Several studies indicate that zonation is maintained by the availability of nutrients and oxygenation status delimited by the portal and central veins. The candidate signalling cascade responsible for proper zonation of pericentral hepatocytes is the Wnt family, and the Hedgehog and Notch signalling pathways are linked to periportal hepatocytes and cholangiocytes14,15. However, the principal transcriptional regulators of zonal fate determination have yet to be defined, hindering the ability to effectively model zonal hepatocyte differentiation in human tissues.
Ascorbate, an antioxidant that is essential for hepatocyte development16, regulates the expression of several zone 1-specific genes. Periportal hepatocytes are principally responsible for functions including gluconeogenesis17, cholesterol synthesis18 and fatty acid oxidation2 potentiated by ascorbate, whereas lipogenesis, attributed to pericentral hepatocytes, is inhibited by ascorbate2,14. By contrast, bilirubin, a metabolic waste product of haem19, enriches metabolic activities in the pericentral areas. For example, bilirubin can promote the expression of zone 3-enriched CYP enzymes directly20,21 or indirectly through activation of Wnt signalling3,22. These lines of evidence suggest that ascorbate and bilirubin can prime differential zone-specific programs.
Here we developed a dual organoid system by combining ascorbate- and bilirubin-primed progenitors derived from human induced pluripotent stem (hiPS) cells). As pseudogenization of l-gulonolactone oxidase (GULO) causes loss of ascorbate synthesis in humans23, we took advantage of a Tet-inducible Gulo knock-in hiPS cell24, which was used to evoke periportal identity, and exposed standard hiPS cell lines to bilirubin to prime the pericentral lineage. The transcriptomic, epigenetic and functional profile of the generated organoids support the emergence of multi-zonal phenotypes and functions that ameliorate fatal liver dysfunction upon transplantation in an immunosuppressed rodent model.
Intracellular ascorbate specifies CPS1+ Z1-HLOs
The ODS rat has a genetic defect in hepatic Gulo that impairs hepatic metabolism25. To test for the role of Gulo in zonal identity, we first stained the key periportal and pericentral markers GLS2 and glutamine synthetase (GS) with or without ascorbate supplementation. Between 7 and 14 days after ascorbate deprivation, the GLS2-expressing periportal hepatocyte fraction was significantly reduced, whereas the GS-expressing pericentral fraction modestly increased (Extended Data Fig. 1a). To examine its role in zone-priming effect in human, we next used hiPS cell differentiation. We first established an inducible hiPS cell line with the murine Gulo transgene and a P2A-mCherry sequence inserted into the AAVS1 locus with a Tet-inducible system24. These Gulo-hiPS cells were used to induce posterior foregut cells based on published protocols26–28 and generate putative zone 1 human liver organoids (Z1-HLOs) by continued doxycycline (Dox) induction beginning on day 17 (Fig. 1a and Extended Data Fig. 1b). Presumptive Gulo expression was paralleled by the mCherry expression. In the ascorbate-deprived condition, normal hiPS cells did not properly differentiate into human liver organoids (HLOs), whereas Gulo-hiPS cells generated healthy viable HLOs (Fig. 1b and Extended Data Fig. 1b). The expression of Dox-induced Gulo contributed to higher cellular antioxidant concentrations and lower reactive oxygen species (ROS) levels when compared with ascorbate supplements in medium (Extended Data Fig. 1c–e). These Z1-HLOs exhibited higher expression of genes associated with zone 1 such as FAH, HPD and SCD (Extended Data Fig. 1f). Compared with control HLOs (without Dox induction or low-dose bilirubin treatment), the Z1-HLOs showed higher expression of urea cycle genes such as ACSS2, ASL, CPS1 and OTC similar to expression in primary human hepatocytes (PHHs) (Extended Data Fig. 1f). Enzyme-linked immunosorbent assay (ELISA) showed that the Z1-HLOs synthesized higher levels of albumin compared to control HLOs and PHHs, a prominent characteristic of periportal hepatocytes (Extended Data Fig. 1g). Notably, the Z1-HLOs expressed higher levels of CPS1 and ACSS2 proteins compared with control HLOs (Extended Data Fig. 1h). Overall, these data suggest that functional Gulo induction with increased intracellular ascorbate primes differentiation of Z1-HLOs into cells that resemble CPS1+ periportal hepatocytes.
Fig. 1 |. Engineering hiPS cell-derived mZ-HLOs.
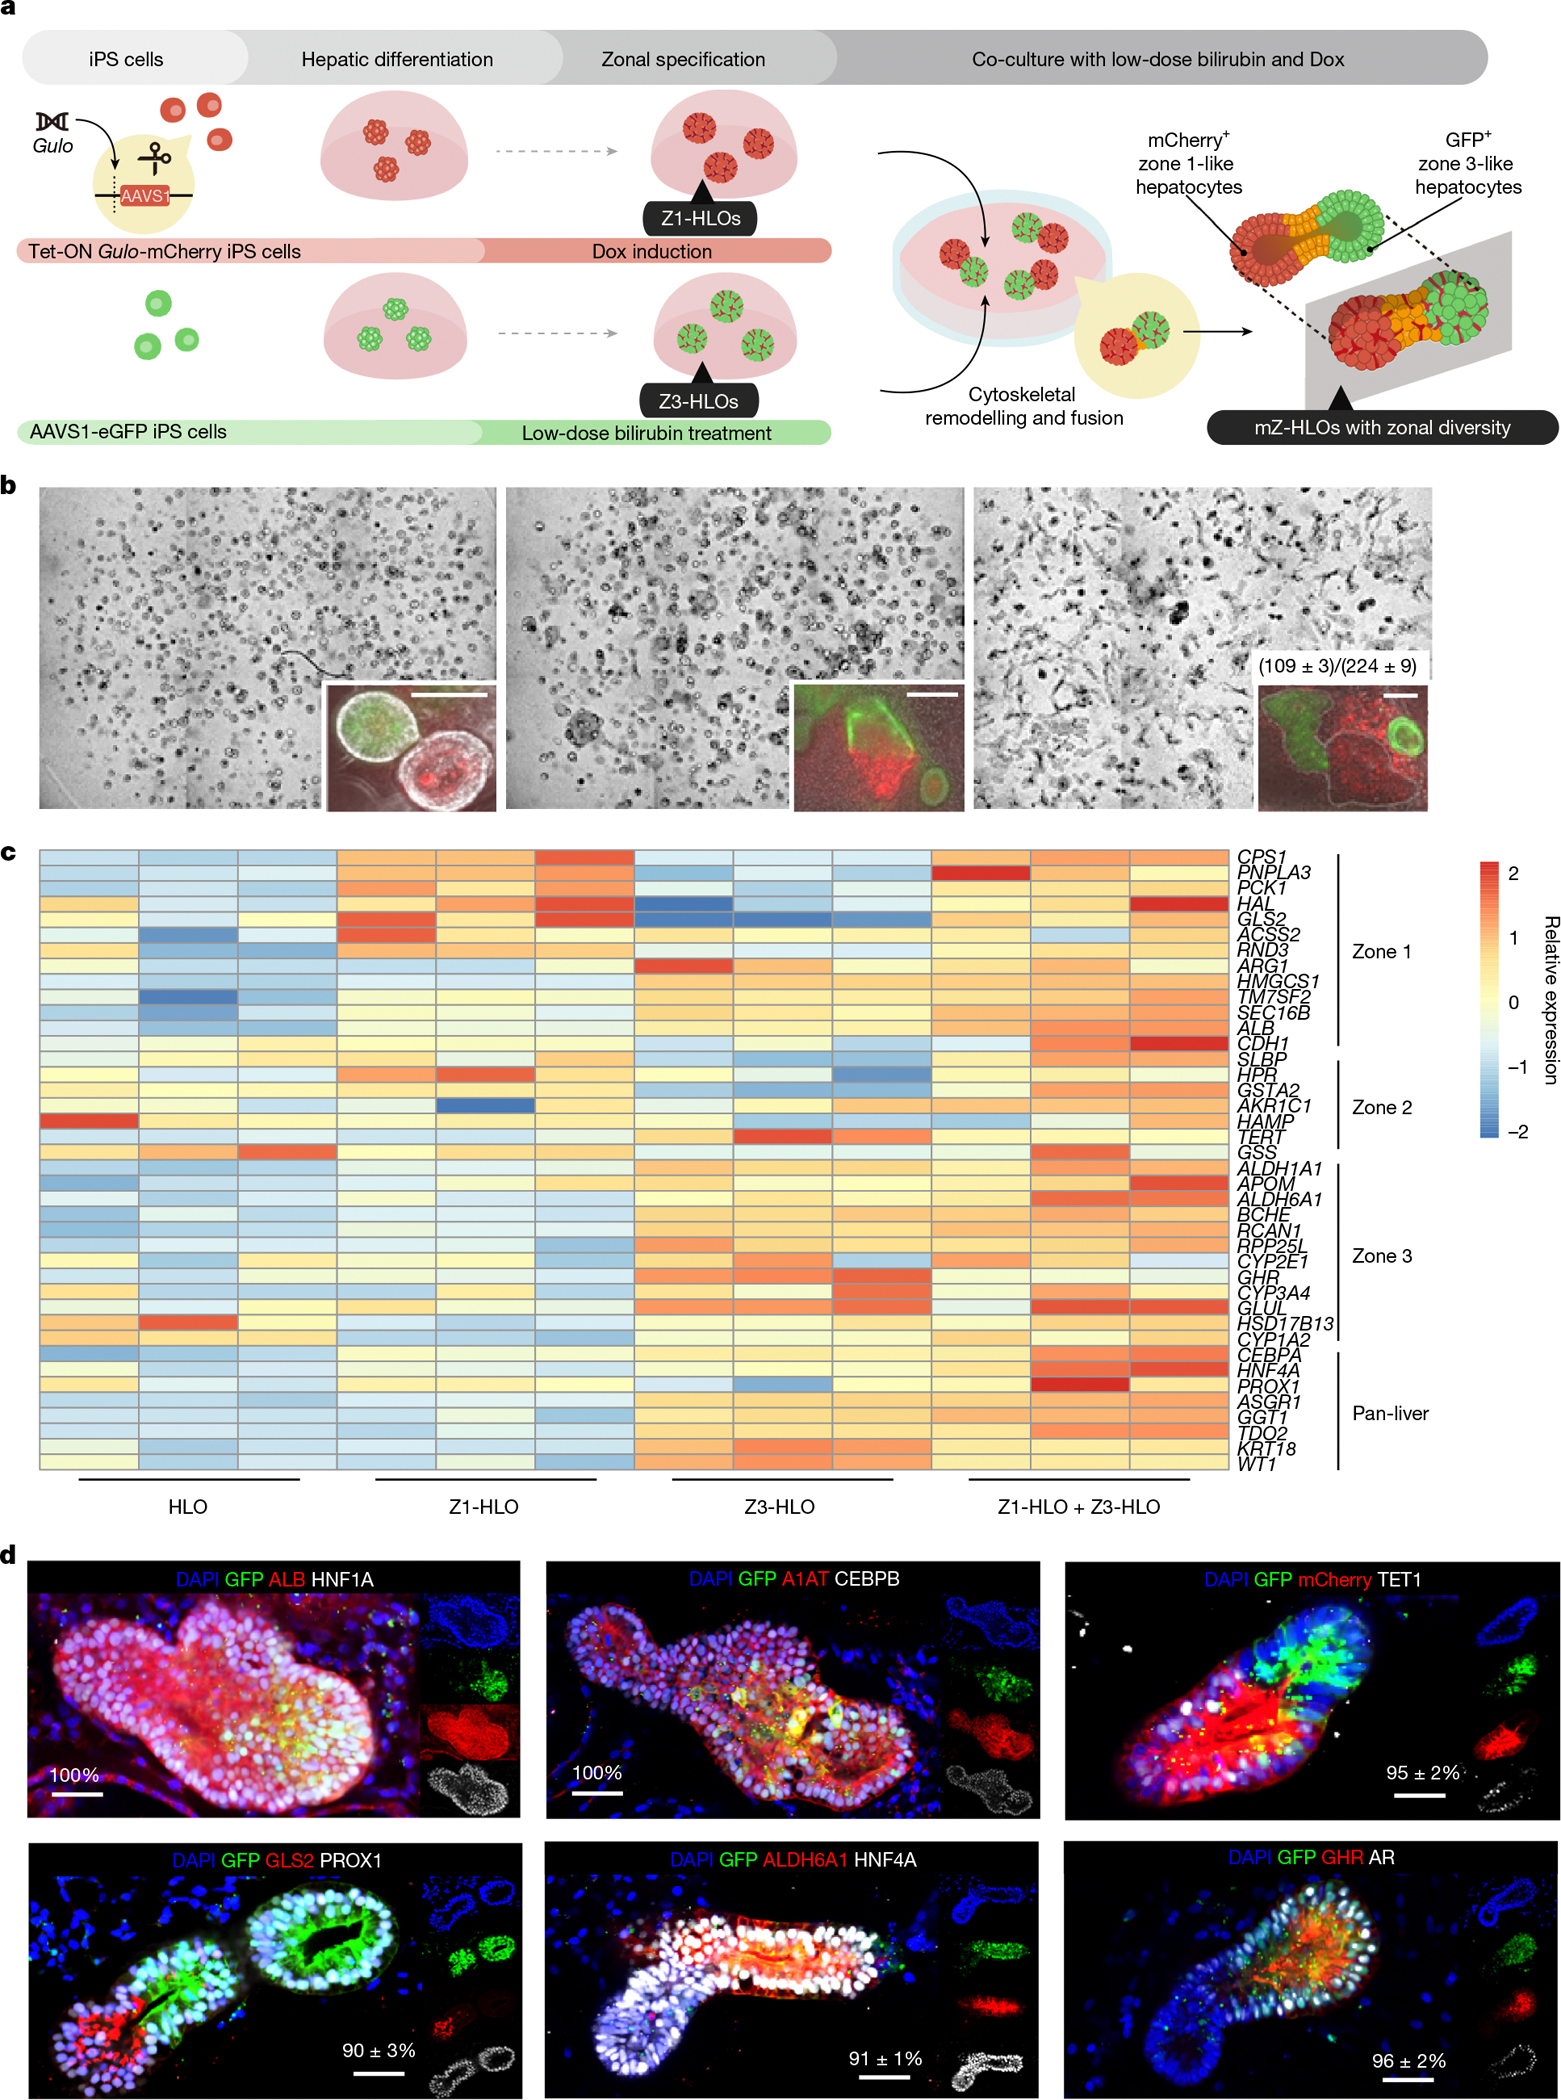
a, Schematic for development of mZ-HLOs from Dox-induced Z1-HLOs and low-dose bilirubin-treated Z3-HLOs. b, Top, brightfield images of progression of bilirubin-induced fusion from day 1 to day 7. Top inset, fluorescent images of progression of organoid fusion from day 1 to day 7. Numbers on the bar indicate the ratio of correctly fused organoids to the total number of organoids. Scale bars, 200 μm. c, Heat map of fused organoids compared to Z1-HLOs, Z3-HLOs and control HLOs, depicting expression of zonally expressed genes in the fused organoids. d, Immunofluorescence images of mZ-HLOs for pan-liver, zone 1 and zone 3 markers. Scale bars, 200 μm. Numbers on the bar indicate the percentage of fused organoids that exhibit expression of one or both of the indicated antigens. In c,d, n = 3 independent experiments for each condition.
Extracellular bilirubin specifies GLUL+ Z3-HLOs
In parallel, we treated a batch of HLOs expressing constitutive GFP with bilirubin at around day 20 and found that 1 mg l−1 concentration enabled the highest level of cell survival in the HLOs (Fig. 1a and Extended Data Fig. 2a,b). Morphological analysis of the organoids revealed that they were more compact, resulting in a smaller irregular lumen (Fig. 1c and Extended Data Fig. 2c,d). The bilirubin-treated HLOs expressed more genes associated with zone 3, such as ALDH6A1, OATP2 and GHR, and are hereafter referred to as zone 3 HLOs (Z3-HLOs) (Extended Data Fig. 2e). Additionally, the Z3-HLOs expressed zone 3-specific ALDH1A2, GLUL, HIF1A and SREBF1, at higher levels compared with control HLOs and similar to expression in PHHs (Extended Data Fig. 2f). Moreover, these Z3-HLOs exhibited higher CYP3A4 and CYP1A2 activity than control HLOs, Z1-HLOs and PHHs (Extended Data Fig. 2g). Finally, the Z3-HLOs expressed pericentral-specific GLUL and NR3C1 proteins (Extended Data Fig. 2h). Together, these data suggest that exposure to 1 mg l−1 bilirubin facilitates differentiation of hiPS cells to GLUL+ pericentral hepatocytes.
To further profile Z1-HLOs and Z3-HLOs, we used RNA-sequencing (RNA-seq) analysis. We found that pan-hepatocyte genes such as A1AT, HNF4A and CEBPA were consistently expressed in Z1-HLOs and Z3-HLOs. Z3-HLOs, however, expressed more pericentral-specific genes, such as GHR, BCHE and RCAN1, whereas Z1-HLOs expressed ACSS2, SLBP and RND3 but lacked expression of widespread markers such as ARG1 and interzonal markers such as AKR1C1 and APOM (Extended Data Fig. 2i). PHH cultures have been used to show that allyl alcohol and acetaminophen are toxic to zone 1 and zone 3 cells, respectively, owing to differential alcohol and drug metabolism29. Consistently, we observed that Z1-HLOs were sensitive to allyl alcohol and Z3-HLOs were sensitive to acetaminophen, as evidenced by the increased caspase-3 activity and reduced cell viability (Extended Data Fig. 2j,k). These indicated the acquisition of zone 1- or zone 3-like identities in HLOs under specific inductive conditions.
Assembling mZ-HLOs
Next, we sought to generate a compartmentalized dual-zone organoid system (Fig. 1a). Upon further evaluation, we observed that persistent bilirubin and Dox treatment induced the HLOs to self-assemble together, and that this effect was dependent on the organoid density (Extended Data Fig. 3a,b). Real-time imaging showed that individual organoids fused together by interaction of cytoskeletal proteins, while maintaining a continuous lumen (Extended Data Fig. 3c). We observed that with continuous 1 mg l−1 bilirubin treatment, the HLOs tend to fuse together, as indicated by the increase in mean segment length (Extended Data Fig. 3d). Approximately 75% of these bilirubin-treated organoids underwent fusion accompanied by increased Notch activity (Extended Data Fig. 3e,f). With inhibition of Notch signalling and ezrin, the organoids did not fuse together, suggesting a role of Notch and ezrin in cytoskeletal rearrangements (Extended Data Fig. 3f,g). Conversely, fewer than 5% of HLOs fused when treated with the Notch signalling inhibitor DAPT (N-[N-(3,5-difluorophenacetyl)-l-alanyl]-S-phenylglycine t-butyl ester) or the ezrin inhibitor NSC668394. Thus, bilirubin-induced Notch and ezrin signalling activate cytoskeletal rearrangements to induce fusion. Fused organoids expand canalicular connectivity, as observed in a fluorescently labelled bile acid analogue transport assay (Extended Data Fig. 3h). Quantification of self-assembly efficiency indicated the preferential fusion efficiency in the cell line derived HLOs as follows: Z3-HLO–Z3-HLO (60%), Z3-HLO–Z1-HLO (35%) and Z1-HLO–Z1-HLO (5%) (Extended Data Fig. 3i).
We further characterized self-assembled organoids generated from the bilirubin-treated Z3-HLOs and the Dox-treated Z1-HLOs (Fig. 1b). The fused organoids showed more comprehensive expression of zone 1, 2 and 3 and pan-liver markers (ACSS2, ALDH6A1, AKR1C1 and HNF4A) by bulk RNA-seq (Fig. 1c). Over the course of 10 days, most fused organoids generated structures with bilirubin in the lumen (Extended Data Fig. 4a). These putative multi-zonal HLOs (mZ-HLOs) had an mCherry+ zone 1 and a GFP+ zone 3 side and expressed the pan-liver markers A1AT and PROX1 along the entire axis (Extended Data Fig. 4b). The mZ-HLOs also expressed the pan-hepatocyte markers ALB, HNF1A, A1AT, CEBPB, PROX1, HNF4A and TUBA1A (Fig. 1h and Extended Data Fig. 4c). They maintained a interconnected structure, indicated by the basal marker CTNNB1, and a continuous lumen, indicated by the apical marker ZO-1 (Extended Data Fig. 4c). Immunofluorescence also confirmed protein expression in three distinct regions within the newly generated mZ-HLOs: ARG1-positive, TERT-positive and AHR-positive regions, consistent with periportal, interzonal and pericentral zonal marker expression, respectively (Extended Data Fig. 4c). Zone-specific liver markers such as apical MRP2 and nuclear SLBP indicated variable hepatic characters, and only a small proportion of the cells expressed the cholangiocyte marker CK7 (Extended Data Fig. 4c). Furthermore, the mCherry+ zone 1 side expressed the zone 1 markers: TET1 and GLS2, whereas the GFP+ zone 3 side expressed the zone 3 markers ALDH6A1, GHR and AR (Fig. 1d). These staining patterns were consistent with the spatial patterning of TUBA1A, CK7, SLBP, GLS2, ALDH6A1, ARG1, TERT, AHR and MRP2 expression in human liver tissue (Extended Data Fig. 4d).
snRNA-seq of mZ-HLOs reveal zonal features
To elucidate the populations in the mZ-HLOs, we analysed the samples using single-nucleus RNA-seq (snRNA-seq) and retained 120,195 high-quality nuclei following stringent filtering for downstream analysis. The mZ-HLOs contained distinct populations: SERPINA1+ hepatocytes (55%), KRT7+ cholangiocytes (11%), PECAM1+ endothelial cells (12%), LYZ+ macrophages (7%), COL1A1+ stellate cells (7%) and CD44+ mesenchyme (8%) that exhibited discrete gene-expression profiles (Extended Data Fig. 5a,b). We aimed to characterize the different hepatocyte identities, illuminate their functionally relevant gene sets and explore their developmental trajectory using the snRNA-seq dataset. Using unsupervised clustering and hepatocyte expression profiles, we identified pericentral (28%) and periportal (24%) hepatocytes, as well as a hepatoblast population (30%) and two distinct interzonal hepatocyte populations (18%) (Fig. 2a). Hepatoblasts were the most immature population in mZ-HLOs and were enriched for fetal markers such as AFP and other mitogenic markers such as IGF2 and MAP2K2, which regulate the growth and differentiation of the cells. Interzonal hepatocytes are known for expressing glutathione and DNA repair enzymes, and express TERT and GSS. Finally, the periportal hepatocytes expressed GLS2, CPS1, OTC, ACSS2 and ARG1, and the pericentral population expressed GLUL, CYP2E1, HIF1A, ALDH1A2, ALDH6A1 and AR (Fig. 2b and Extended Data Fig. 5c–e). TAT, HAMP and CYP3A4 expression was localized in the periportal, interzonal and pericentral populations as cross-referenced by a primary liver spatial transcriptomic dataset (Fig. 2a and Extended Data Fig. 6a–c). The cholangiocyte marker KRT7 was expressed at a low level in the hepatoblast population only (Fig. 2b), and TTR and SERPINA1 expression was observed throughout the populations (Fig. 2b).
Fig. 2 |. Single-cell analysis of mZ-HLOs.

a, Uniform manifold approximation and projection (UMAP) plot with the major populations (hepatoblasts, interzonal-like hepatocytes, pericentral-like hepatocytes and periportal-like hepatocytes) of parenchymal nuclei in mZ-HLOs. Left, Velocyto force field showing the average differentiation trajectories (velocity) for nuclei located in different parts of the UMAP plot. Right, pseudotime trajectory graph showing the differentiation trajectory for nuclei in the UMAP plot. Colours represent the pseudotime development stage. b, Feature plots for pan-hepatocyte markers TTR and SERPINA1; cholangiocyte marker KRT7; zone 1 markers mCherry, GLS2, CPS1 and OTC; zone 2 markers GSS, TERT and AKR1C1; and zone 3 markers GFP, GLUL, CYP2E1 and HIF1A. c, UMAPs for human hepatocytes from hiPS cell-derived liver organoid cell atlas coloured by organoid source and cell type. UMAPs displaying the maximum (max.) Spearman correlation of fetal liver (left) and adult liver (right) dataset. HLBO, human liver bud organoid; HO, hepatic organoid; VHLO, vascularized human liver organoid. d, Expression of genes related to zone-specific functions in each population. The size of the circle indicates the percentage of nuclei in each population expressing each gene. The colour represents the average expression level for the indicated gene.
Additionally, we integrated our mZ-HLO dataset with multiple published adult and fetal hepatocyte snRNA-seq datasets30–33. Integration with the dataset from Andrews et al.30 revealed a significant overlap of mZ-HLO-derived periportal, interzonal and pericentral hepatocytes with their primary counterparts, and the hepatoblast population was clearly separated out into a different cluster (Extended Data Fig. 6d). Our periportal population expressed GLS2, CDH1, CPS1 and TET1 and our pericentral population expressed ALDH1A2, GHR, GLUL and HIF1A, as in the Andrews et al. dataset, and our interzonal profile also resembled their data (Extended Data Fig. 6e). Considering all four datasets30–33, we found substantial overlaps, particularly among the zonal hepatocytes (Extended Data Fig. 6f). There were noticeable overlaps between adult liver zonal populations and mZ-HLO zonal hepatocytes, particularly in pericentral and periportal hepatocytes in terms of GLUL and GLS2 expression (Extended Data Fig. 6g). The mZ-HLOs also contain a hepatoblast population that is found in fetal liver along with other zonal features.
Furthermore, to benchmark our mZ-HLO model against existing models, we constructed an integrated dataset using a collection of eight publicly available hiPS cell-derived liver organoid28,34–38 and primary33 datasets using neighbourhood graph correlation mapping39,40 (Fig. 2c). With respect to the status of hepatocytes, the mZ-HLOs showed a higher correlation with adult liver (Fig. 2c), although the hepatoblast population exhibited higher correlation with fetal liver tissue.
We next queried the lineage progression into multi-zonal populations using RNA velocity and pseudotime analysis based on the kinetics of the mRNA splicing rate and the expression of each gene (Fig. 2a and Extended Data Fig. 7a,b). Both methods predicted that the zonal hepatocytes originated from hepatoblasts via the interzonal hepatocyte population (Fig. 2a and Extended Data Fig. 7c). Finally, with the goal of predicting the function of these populations we applied gene set enrichment analysis (GSEA) to identify the functional pathways and profiles in each population (Fig. 2d). Hepatoblast and interzonal hepatocyte populations were predicted to be mostly involved in proliferation and differentiation, with interzonal cells being more involved in DNA repair mechanisms. Periportal cells were involved in gluconeogenesis, lipid and glutamine catabolism, ROS and oxygen response, and Notch signalling, whereas pericentral cells were more enriched in xenobiotic and pigment metabolism, glutamine biosynthesis and Wnt signalling (Fig. 2d and Extended Data Fig. 7d). Thus, our self-assembled organoids contain diverse cell types that express zonal hepatocyte markers.
EP300 regulation executes zonal transcription
To understand the differential transcriptional mechanisms leading to zonation, we investigated the epigenetic landscape of the mZ-HLOs. EP300 is a histone acetyltransferase that acetylates enhancer regions and activates transcription leading to hepatoblast differentiation41. EP300 marks poised and active enhancers and activates expression of zonal genes42. Chromatin immunoprecipitation with sequencing (ChIP–seq) analysis of EP300 revealed that mZ-HLOs exhibited increased binding of EP300 at putative enhancer sites compared with control HLOs (Extended Data Fig. 8a). Pan-liver markers such as HNF4A and CTNNB1 had EP300 peaks upstream of the transcription start site (TSS) in all the samples, similar to the PHH dataset in Smith et al.43 (Extended Data Fig. 8b,c). However, many zone-specific genes, such as ACSS2 (zone 1), ALDH6A1 (zone 3) and HPR (zone 2) were recapitulated in mZ-HLOs, whereas Z1-HLOs and Z3-HLOs only had active enhancers upstream of their respective zonal genes (Fig. 3a–c). Furthermore, this pattern was also observed for SLBP (zone 1), GHR (zone 3) and AKR1C1 (zone 2) (Extended Data Fig. 8d–f). GSEA of the peaks revealed enrichment for mixed zonal processes in the mZ-HLOs, whereas the Z1-HLOs and Z3-HLOs exhibited zone-specific enrichment (Fig. 3d and Extended Data Fig. 8g,h). Motif analysis of the peaks also revealed that EP300-bound peaks were enriched for genes that regulate functional differentiation of hepatocytes (HNF1AI, HNF4A and TBX2) (Fig. 3e). We then integrated our RNA-seq dataset with the ChIP–seq dataset examine regulation of upregulated RNA in each condition (Fig. 3f). We identified HIF1A, TBX3 and AHR as top motifs co-occupied by EP300 in Z3-HLOs, whereas TET1, NRF1 and TFEB were top motifs in Z1-HLOs (Fig. 3f). We further found that the TET inhibitor Bobcat339 caused downregulation of ACSS2 and CPS1 in Z1-HLOs and mZ-HLOs. Inhibition of HIF1A with KC7F2 downregulated ALDH6A1 and GLUL (zone 3 markers) expression in mZ-HLOs and Z3-HLOs (Fig. 3g).
Fig. 3 |. Bilirubin and ascorbate regulate EP300 differentially in a spatial manner to evoke zonation.

a, Genome browser view of ACSS2 (a zone 1 gene) showing the EP300 ChIP–seq peak. b, Genome browser view of HPR (a zone 2 gene) showing the EP300 ChIP–seq peak. c, Genome browser view of ALDH6A1 (a zone 3 gene) showing the EP300 ChIP–seq peak. d, Top 10 upregulated Gene Ontology terms (biological process) for the genes bound by EP300 in the mZ-HLOs. e, Motif enrichment analysis of EP300-bound peaks analysed by MEME-ChIP. f, Venn diagram depicting the intersection between EP300-bound peaks and upregulated genes obtained from RNA-seq in Z1-HLOs and Z3-HLOs linked to motif enrichment analysis of EP300-bound peaks for upregulated genes in Dox-treated Z1-HLOs and in bilirubin-treated Z3-HLOs analysed by MEME-ChIP. g, Left, quantitative PCR with reverse transcription (RT–qPCR) of ACSS2 and CPS1 for Z1-HLOs and mZ-HLOs with and without treatment with Bobcat339 (a TET inhibitor). Right, RT–qPCR of ALDH6A1 and GLUL for Z3-HLOs and mZ-HLOs with and without treatment with KC7F2 (a HIF1A inhibitor). Data are mean ± s.d.; n = 9 independent experiments.
For in vivo verification of the role of EP300 in zonal hepatocyte development, we injected an adenovirus encoding short hairpin RNA (shRNA) targeting Ep300 into rat pups via the retro-orbital route at postnatal day 0 (P0) to 1 (P1) (Extended Data Fig. 9a). This resulted in impaired liver development with excess proliferation and deficient differentiation of hepatocytes, causing portal and central vein ambiguity—that is, zonal impairment. This was further demonstrated in the disrupted porto–central polarity, as evident in aberrant expression of PROX1, ARG1 and GLUL. Some hepatic cells lost PROX1 nuclear specificity or expression, and ARG1 and GLUL was sporadic and non-zone-specific compared with the zone-specific expression in control liver (Extended Data Fig. 9a,b). We also compared gene-expression profiles in Z1-HLO and Z3-HLO with size-fractionated freshly isolated PHHs44. Z1-HLOs showed similar expression of ACSS2, ALB, ASL, CPS1 and OTC to periportal hepatocytes that were less than 20 μm in size (H20) (Extended Data Fig. 9c). Conversely, Z3-HLOs expressed ALDH1A2, ALDH6A1, GLUL, HIF1A and SREBF1 similar to pericentral hepatocytes less than 40 μm in size (H40) (Extended Data Fig. 9d). Using human zonally enriched PHHs, sequential chromatin immunoprecipitation with PCR (ChIP–reChIP–PCR) and sequential chromatin immunoprecipitation with quantitative PCR (ChIP–reChIP–qPCR) showed that H20 cells had increased binding of TET1 upstream of ACSS2, whereas H40 cells had increased binding of HIF1A upstream of ALDH6A1, similar to our Z1-HLOs and Z3-HLOs, respectively (Extended Data Fig. 9e,f). Together, these results suggested that EP300 co-ordinates with other transcription factors to mediate preferential activation and repression of zone-specific programs (Extended Data Fig. 9g).
Zone-specific programs work in concert
Nitrogen metabolism in the liver, whereby ammonia is removed in the form of urea or glutamine, occurs across multiple zones7. The urea cycle and glutathione metabolism pathways are intricately linked and required for proper nitrogen handling7. As we developed an organoid model with dual zonal functionality, we tested whether the mZ-HLOs could perform multi-zonal nitrogen metabolism. The mZ-HLOs express high levels of the urea cycle genes CPS1, OTC and ARG1 and the detoxification genes GSTA2, ALDH1A2 and GLUL in response to 10 mM NH4Cl, compared with PHHs and control HLOs (Fig. 4a–c). This enables mZ-HLOs to synthesize high levels of glutathione, and this glutathione synthesis can be inhibited by buthionine sulfoximine (BSO) (Fig. 4d). mZ-HLOs therefore metabolize large quantities of ammonia, and BSO inhibits ammonia removal (Fig. 4e). This was reflected in the high levels of urea in mZ-HLOs and the loss of urea production with BSO treatment (Fig. 4f). However, ammonia levels remained lower in mZ-HLOs relative to control—the mZ-HLOs exhibited high glutathione S-transferase (GST) and glutamine synthesis activity (Fig. 4g,h), enabling them to upregulate glutamine synthesis to remove excess ammonia following BSO treatment (Fig. 4i).
Fig. 4 |. Interzonal-dependent nitrogen handling in mZ-HLOs.

a, RT–qPCR of OTC and CPS1 (zone 1 genes) for mZ-HLOs, Z1-HLOs, Z3-HLOs, control HLOs and PHH in response to 10 mM NH4Cl. b, RT–qPCR of ARG1 (zone 1 and 2 gene) and GSTA2 (zone 2 gene) for mZ-HLOs, Z1-HLOs, Z3-HLOs, control HLOs and PHH in response to 10 mM NH4Cl. c, RT–qPCR of ALDH1A2 and GLUL (zone 3 genes) for mZ-HLOs, Z1-HLOs, Z3-HLOs, control HLOs and PHH in response to 10 mM NH4Cl. d, Glutathione assay for mZ-HLOs with and without BSO treatment, compared with Z1-HLOs, Z3-HLOs, control HLOs and PHH. CTG, CellTiter-Glo. e, Ammonia assay for mZ-HLOs with and without BSO treatment, compared to Z1-HLOs, Z3-HLOs, control HLOs and PHH. f, Urea assay for mZ-HLOs with and without BSO treatment, compared to Z1-HLOs, Z3-HLOs, control HLOs and PHH. g, GST assay for mZ-HLOs with and without BSO treatment, compared to Z1-HLOs, Z3-HLOs, control HLOs and PHH. h, Glutamine synthetase activity assay for mZ-HLOs with and without BSO treatment, compared to Z1-HLOs, Z3-HLOs, control HLOs and PHH. i, Glutamine assay for mZ-HLOs with and without BSO treatment, compared to Z1-HLOs, Z3-HLOs, control HLOs and PHH. In a–c, data are mean ± s.d.; n = 9 independent experiments. In d,f,i, n = 9 independent experiments; in box plots, the middle line is the median, the bottom and top hinges correspond to the first and third quartiles, and the top and bottom whiskers extend from the hinge to the largest and smallest value, respectively, no further than 1.5 times the interquartile range from the hinge. In g,h, data are mean ± s.e.m.; n = 9 independent experiments. One-way ANOVA with multiple comparisons and Tukey’s correction (a–f,i).
Furthermore, as lipid and glucose metabolism are maintained differentially by the zonal hepatocytes, we investigated whether the mZ-HLOs exhibit a similar metabolic balance4,45. Consequently, we performed a triglyceride assay that showed that mZ-HLOs had intermediate levels of triglyceride compared with Z1- and Z3-HLOs. Treatment with the acetyl-CoA carboxylase inhibitor firsocostat resulted in inhibition of lipid biosynthesis and the lowest levels of triglyceride, owing to the high lipase activity of the mZ-HLOs (Extended Data Fig. 10a,b). For glucose metabolism, we examined glucose levels—mZ-HLOs had intermediate levels of glucose compared with other zonal HLOs. Treatment with fructose 1,6-bisphosphatase inhibitor (FBPi) inhibited the gluconeogenetic process, resulting in lower levels of glucose owing to enhanced glycolytic activity of the mZ-HLOs (Extended Data Fig. 10c,d). Thus mZ-HLOs are able to maintain dual both zonal functionality and interzonal-dependent functions that are native to nitrogen, glucose and lipid metabolism in the human liver.
Finally, we sought to test zone-specific damage-induced responses upon treatment with allyl alcohol and acetaminophen (Extended Data Fig. 11a). Allyl alcohol induced positive expression of Ki-67 in the GFP-negative region, starting at the intermediate region. Conversely, acetaminophen treatment resulted in Ki-67 expression primarily in the GFP-positive regions (Extended Data Fig. 11b,c). This resulted in elongation of the GFP-negative ARG1 region and the GFP-positive GLUL region following treatment with allyl alcohol and acetaminophen, respectively (Extended Data Fig. 11b,d). Furthermore, Z1-HLOs exhibited zone 3 features, as evident in switching of CPS1 and TET1 expression to GLUL and NR3C1 expression at day 25 following Dox withdrawal and persistent bilirubin treatment starting at day 20, when zone 1 features started to appear (Extended Data Fig. 11e). This switch was also reflected in reduced expression of ACSS2 and increased expression of ALDH1A2 following Dox withdrawal and bilirubin treatment (Extended Data Fig. 11f). Overall, this suggests that zone-specific damage responses and plasticity can be observed in our mZ-HLOs.
Transplanting mZ-HLOs alleviates biliary disease
To determine multi-zonal functionality in vivo, we evaluated post-transplant metabolic performance of mZ-HLOs in ammonium and bilirubin removal relative to a singular zonal-HLO system. In choosing a model, we adopted bile duct ligation because it causes hyperammonaemia and hyperbilirubinaemia, leading to the progression of total hepatic dysfunction46. The ligation results in large accumulation of bilirubin and ammonia in the serum that accelerates liver injury47. As the mZ-HLOs exhibit dual zonal functionality, we explored whether mZ-HLOs could be used in an in vivo setting for the amelioration of disease. We transplanted the mZ-HLOs orthotopically on the liver in close proximity of the portal vein using fibrin glue as a scaffold in bile duct ligated Il2rg-deficient, Rag1-deficient rats and observed them for 30 days (Fig. 5a). The mZ-HLO-transplanted rats had a higher survival rate compared with Z3-HLO-, Z1-HLO- or sham-transplanted rats (Fig. 5b). The transplanted rats exhibited approximately 350 ng ml−1 peak human albumin in their serum at day 20, indicating functional engraftment (Fig. 5c). Moreover, the transplanted mZ-HLOs were observed to invade into the hepatic parenchyma and retained their structure, as indicated by the TUBA1A and ASGR1 stain (Extended Data Fig. 12a,b). These partially integrated mZ-HLOs retained their mCherry and GFP expression and also expressed ARG1 and GLUL (Extended Data Fig. 12c). The Z1-HLOs integrated into the parenchyma of the liver more efficiently when transplanted through the portal vein route, whereas the Z3-HLOs integrated better near the central vein by retrograde transplantation via the inferior vena cava route48 (Extended Data Fig. 12d). Consistent with in vitro performance, we observed reduced levels of bilirubin and ammonia at day 20 most prominently in mZ-HLO-transplanted groups (Fig. 5d,e). Overall, our data indicate that the transplantation of mZ-HLOs offers better metabolic performance in removing excess ammonia and bilirubin than non-multi-zonal tissue transplant.
Fig. 5 |. Orthotopic transplantation of mZ-HLOs improves multiple hepatocyte functions.

a, Schematic of orthotopic transplantation of HLOs in bile duct ligated immunocompromised RRG rats. b, Kaplan–Meier survival curve for Z1-HLO, Z3-HLO and mZ-HLO-transplanted bile duct ligated RRG rats compared to sham. n = 9 independent experiments. log-rank test. Tx, treatment group. c, Human albumin ELISA on blood serum collected from rats at different time points after transplantation. Data are mean ± s.e.m.; n = 9 independent experiments. d, Bilirubin assay on blood serum collected from rats at different time points after transplantation. Data are mean ± s.e.m.; n = 9 independent experiments. e, Ammonia assay on blood serum collected from rats at different time points after transplantation. Data are mean ± s.e.m.; n = 9 independent experiments.
Discussion
Combined synthesis and degradation of a multitude of metabolites requires compartmentalization, a feature that is achieved in the liver by a process called zonation49. In zonation, hepatocytes are specialized into periportal hepatocytes (zone 1) located near the portal vein, pericentral hepatocytes (zone 3) near the central vein, and a small population of interzonal hepatocytes in the intermediate region13,50. Despite several attempts using primary and stem cell-derived hepatocytes, the emergence of multi-zone-dependent functions in human hepatic models has been unclear51,52. Here we have developed a platform for studying development and zonal functionality using human liver organoids from hiPS cells. Our data suggest that bilirubin and ascorbate are able to drive epigenetic and transcriptional programs for development of zonal hepatocytes.
Our snRNA-seq dataset showed divergent parenchymal populations including hepatoblasts, and interzonal, pericentral and periportal hepatocyte-like cells, which were annotated based on aforementioned datasets and well-known genetic markers32,53. Moreover, we find that compared with a primary liver snRNA-seq dataset, the zonal hepatocyte populations are highly concordant with subpopulations found in mZ-HLOs, with the exception of the hepatoblast population. The genes and pathways activated in zonal subpopulations are largely in agreement with existing knowledge, however, we note a few discrepancies, such as lower expression of TTR, CEBPB, APOA1 and ARG1 compared with publicly available datasets derived from primary liver. The discrepancy is possibly owing to immaturity or differences between snRNA-seq and single-cell RNA-seq. Our developmental lineage predictions supported the assertion made by He et al.54 that zonal hepatocytes originate from hepatoblasts after differentiation through interzonal hepatocytes. However, this model only depicts the development of early zonal liver. Adult hepatocytes have been reported to transdifferentiate into different zonal hepatocytes55. Consistent with this idea, alternating zonal-priming treatment at day 20 induces switching of zone 1 and zone 3 phenotypes; however, this plastic nature is lost beyond day 25 of organoid development when the zonal features start to become more pronounced. Regardless, recent evidence suggests that interzonal hepatocytes are the primary source of zonal hepatocytes during liver regeneration, which is very similar to our mZ-HLO model53,54. Therefore, significant advances need to be made to address this trans-differentiation and regenerative capability.
The epigenetic landscape determines differentiation into zonal hepatocytes in the liver56. EP300, a histone acetyltransferase, is one such epigenetic modifier that acetylates enhancer regions and activates transcription leading to hepatoblast differentiation41,42,. Similarly, our data suggest that EP300 binds to enhancers upstream of zonal genes in a context-dependent manner to differentially activate gene expression similar to previously published PHH studies. The integrated RNA-seq and ChIP–seq showed that the top targets were HIF1A and TET1 in the Dox-treated Z1-HLOs and bilirubin-treated Z3-HLOs, respectively. Developmentally, Tet1 deletion impairs periportal identity and function, while repressing the pericentral characteristics regulated through Hedgehog signalling2,14. Conversely, recent studies have demonstrated that bilirubin possesses signalling properties that can activate HIF and Wnt signalling cascades3,57, which are important for pericentral hepatocytes58. Following such developmental patterns, mZ-HLOs exposed to inhibitors specific to HIF1A and TET1 lead to the loss of zonal identities2,14. Moreover, a rat small interfering RNA model revealed that EP300 is integral to zonal development. Finally, freshly isolated size-fractionated PHHs showed that H20 had a TET1 binding site upstream of ACSS2, and H40 had a HIF1A binding site upstream of ALDH6A1 that was identical in our mZ-HLOs. These results corroborate the developmental role of HIF1A and TET1 in executing zonal programs; therefore future endeavours will also be necessary to examine other transcription factors, including HNF1A, HNF4A and TBX2, to evaluate their roles in liver development.
Hepatocyte transplantation has been used to treat liver diseases, but the difficulty in obtaining compatible primary human hepatocytes makes this an impractical approach59,60. Most therapeutic proof-of-concepts have aimed at correcting monogenic conditions by targeting one particular disease parameter. Our mZ-HLO model is endowed with zonal functionality that ameliorated multiple aspects of the liver failure in vivo in a bile duct ligated immunodeficient rat model. We found significant reductions in serum bilirubin and ammonia levels as detected in the rat, and serum protein albumin was secreted. These data translate to increased survival in rats that received mZ-HLO transplantation when compared to sham. Notably, zone 1- or zone 3-primed organoid transplant offer improvements in either hyperammonaemia or hyperbilirubinaemia, resulting in reduced survival benefit. Furthermore, the mZ-HLOs integrated into the parenchyma of the rat liver in a tubular morphology, while retaining their zonal characteristics. The Z1-HLOs showed a preferential integration near the portal vein, whereas the Z3-HLOs exhibited higher affinity for the central vein region. Finally, mZ-HLOs engrafted into the resident liver, maintained zonal-specific functionality and augmented the survival rate in rats following bile duct ligation.
Overall, this multi-zonal liver organoid system provides an advanced in vitro model that recapitulates hepatic zonation, offering new opportunities to investigate liver development, metabolic homeostasis, disease progression and, ultimately, precision therapies.
Online content
Any methods, additional references, Nature Portfolio reporting summaries, source data, extended data, supplementary information, acknowledgements, peer review information; details of author contributions and competing interests; and statements of data and code availability are available at https://doi.org/10.1038/s41586-025-08850-1.
Methods
Animal experiments
All animal experiments were conducted with the approval of the Institutional Review Board (IRB) and Institutional Animal Care and Use Committee (IACUC) of the Cincinnati Children’s Hospital Medical Center. Adult Il2rg-deficient, Rag1-deficient RRG (SD/Crl) rats (breeding pairs, 9–12 weeks old) were housed in standard rat cages with paper bedding and maintained at a temperature of 20–24 °C and relative humidity of 45–55%, under a 12 h:12 h light:dark cycle. All animals had ad libitum access to Dox chow before study. All animals were treated in accordance with the guidelines and regulations of the institution. Three- or four-week-old male ODS (ODS/Shi Jcl-od/od) rats were purchased from CLEA Japan. They were housed in individual cages and maintained at temperature and humidity with 12 h of light exposure each day from 07:00 to 19:00. They were given free access to water and a purified diet. The compositions of the diet (ascorbic acid (AsA) 0 mg kg−1, AsA-free diet) and with or without 2% AsA (Wako-Fujifilm) included water. After 1 or 2 weeks of feeding, the rats were anaesthetized with isoflurane and sampling liver with a perfusion fix of 4% paraformaldehyde (Nacalai). Animal care and experimental procedures were approved by the Animal Research Committee of Institute of Science Tokyo (approval number A2023554).
Human samples
All human samples including human foreskin fibroblasts and human liver samples were collected with informed consent from the corresponding patients and the approval of the Institutional Review Board (IRB) of the Cincinnati Children’s Hospital Medical Center.
Gulo editing
The murine Gulo (l-gulonolactone oxidase) cDNA sequence was retrieved from NCBI. The 5′ linker and Kozak sequence were added to the start of the sequence, with HA tags to the end of the sequence. Additionally, a P2A-mCherry was added after the HA tag and a 3′ linker to the very end. The custom gene was then synthesized and cloned into the pAAVS1-NDi-CRISPRi (Gen1) PCSF#117 vector using the restriction sites AflII and AgeI. The vector has a TetON system and a neomycin resistance selectable marker was then inserted using Gateway technology.
Gulo-hiPS cell generation and general hiPS cell maintenance
Experiments using hiPS cells were approved by the Ethics Committees of Cincinnati Children’s Hospital Medical Center. The 1383D6 used in this study was kindly provided by CiRA, Kyoto University. The hiPS cells 72.3 and 72.3-GFP were obtained from patient foreskin fibroblasts and reprogrammed into hiPS cells by Cincinnati Children’s Hospital Medical Center pluripotent stem cell core. The PCSF#117 vector with the modified Gulo sequence was then inserted into the AAVS1 locus of the 72.3 hiPS cell line using a lentiviral mediated CRISPR–Cas9. The correct clones were then selected using G418. The surviving clones were then verified for correct insertion, random insertion and copy number using PCR, and verified by DNA sequencing. The hiPS cells were then maintained on Laminin iMatrix-511 Silk (Reprocell) coated cell culture plates and maintained with StemFit Basic04 Complete Type (Ajinomoto) medium with Y-27632 (Stem Cell Technologies). The cells were passaged every 7 days with Accutase (Sigma-Aldrich) until passage 40 (p40).
Organoid generation
The p40 cells were plated on a 24-well plate coated with Laminin iMatrix-511 Silk at a density of 2 × 10⁵ cells per well and maintained with Stemfit medium with Y-27632. On day 2, the medium was replaced with fresh Stemfit. The following day, the cells were treated with RPMI 1640 (Gibco) medium mixed with activin A (Shenandoah Biotechnology) and BMP4 (R&D Systems) to generate definitive endoderm. On the 4th day, the medium was replaced with RPMI, activin A and 0.2% defined FBS (HyClone) which was changed to 2% defined FBS on day 5. From day 6 to day 8, the cells were fed with FGF-4 (Shenandoah Biotechnology) and CHIR99021 (PeproTech) in Adv. DMEM (Advanced DMEM/F-12 (Gibco) with B27 (Gibco), N2 (Gibco), 10 mM HEPES (Gibco), 2 mM l-glutamine (Gibco) and GA-1000 (Lonza)) to induce posterior foregut. On day 9, the cells were dissociated into a single-cell suspension using Accutase treatment. This single-cell suspension was then mixed with 50% Matrigel and 50% endodermal progenitor (EP) expansion medium and plated as 50-μl drops in a 6-well plate. These cells were fed with EP medium every 48 h for 4 days to generate organoids. These organoids were then treated with Adv. DMEM and 2 μM retinoic acid (RA) (Sigma-Aldrich) every 48 h for 4 days to specify the hepatic lineage. The organoids were then fed with Hepatocyte Culture Medium (HCM) (Lonza), HGF (PeproTech), Oncostatin M (PeproTech) and dexamethasone (Sigma-Aldrich) every 3–4 days to generate HLOs and passaged as necessary.
Generating mZ-HLOs with zonal diversity
For generation of multi-zonated structures, the immature HLOs were treated with low concentration bilirubin (1 mg l−1) in HCM on day 20. The bilirubin treatment was maintained with every medium change onwards by keeping the cells at 37 °C in 5% CO2 with 95% air. The Z1-HLOs were maintained with Dox starting at day 17 and co-cultured on day 22 with the bilirubin-treated 72.3-GFP (GFP+) Z3-HLOs in a 1:1 ratio at higher density—that is, 2× the number of organoids—with continuous bilirubin and Dox treatment in HCM to obtain chimeric organoids that had dual zonal characteristics. These mZ-HLOs and HLOs were visualized by using fluorescent microscopy BZ-X810 (Keyence) and collected for downstream analysis. Images were analysed with Fiji (v.1.53 f) for morphometric and quantitative measurements.
Live-cell imaging and functional assay
For live imaging of organoids, the CellDiscoverer 7 (Zeiss) was used to image every 30 min for 7 days. Observing organoid fusion necessitated looking at the cytoskeleton, the HLOs were incubated with 2 drops per ml NucBlue (Hoechst 33342) (Invitrogen, R37605) and 1 μM Cytoskeleton Kit (SiR-Actin and SiR-Tubulin) (Cytoskeleton, CYSC006) and imaged over 5 days. For functional assay of lipid transport, the HLOs were incubated with fresh medium containing 50 nM choly-lysyl-fluorescein (CLF) (Corning, 451041) before imaging every 30 min for 2 days.
RNA extraction, RT–qPCR and RNA sequencing
RNA was isolated using the RNeasy mini kit (Qiagen). Reverse transcription was carried out using the High-Capacity cDNA Reverse Transcription Kit for RT-PCR (Applied Biosystems) according to manufacturer’s protocol. Quantitative PCR was carried out using TaqMan Gene Expression Master Mix (Applied Biosystems) on a QuantStudio 5 Real-Time PCR System (Applied Biosystems). All the samples were amplified with TaqMan Gene Expression Assays and normalized with 18S ribosomal RNA endogenous control. Human primary hepatocytes (Lonza HUCPG and Sigma-Aldrich MTOXH1000) were used as PHH control. For RNA sequencing the service was outsourced to Novogene, the extracted RNA quality was evaluated with an Agilent 2100 Bioanalyzer (Agilent). A sequence library was prepared using a TruSeq Stranded mRNA kit (Illumina) and sequenced using NovaSeq 6000 (Illumina). Reads were aligned to human genome assembly hg38 and quantified using the quasi-mapper Salmon (v.1.8.0). Gene-expression analysis was performed using the R Bioconductor package DESeq2 (v.1.36.0). The read count matrix was normalized by size factors, and a variance stabilizing transformation (VST) was applied to the normalized expression data. The data was visualized using clusterProfiler (v.4.4.2) and pheatmap (v.1.0.12) packages.
ChIP–reChIP, ChIP–PCR, ChIP–qPCR, ChIP–seq and analysis
Chromatin immunoprecipitation (ChIP) experiments were performed using the High Sensitivity ChiP Kit (Abcam, ab185913). In brief, organoids were fixed with PFA and whole chromatin was prepared and then sonicated to an optimal size of 300 bp, which was confirmed by gel electrophoresis. Chromatin was used for immunoprecipitation with either EP300 antibody (ab14984) or IgG1 isotype control. For the ChIP-reChIP, ACSS2 (Abcam, ab133543) and ALDH6A1 (Abcam, ab12618) antibodies were crosslinked to Protein A Dynabeads (Invitrogen, 10002D). The ChIP assay was then carried out on extracts from organoids as described above. At the end of the first ChIP, DNA was eluted with elution buffer supplemented with 10 mM DTT. The eluate was then diluted in 2 volumes of wash buffer supplemented with 1× Protease Inhibitor Cocktail and 1 mM DTT. The 2nd ChIP assay was then carried out as described above. For ChIP sequencing, the service was outsourced to MedGenome, the quality of the DNA was analysed with Qubit (Invitrogen) and TapeStation (Agilent). A sequence library was prepared using a NEB Next Ultra II DNA kit and sequenced using NovaSeq 6000 (Illumina). Reads were trimmed and quality-checked using TrimGalore (v.0.6.6) and then aligned to hg38 using bwa (v.0.7.17). The aligned files were filtered, sorted and indexed using SAMtools (v.1.15.1), and unmapped and low quality (MAPQ < 30) reads were discarded. The duplicates were then marked and removed with Picard (v.2.27.3). For visualization, deepTools (v.3.5.1) was used to generate BigWig files which were visualized using IGV (v.2.13.0). Peaks were identified using MACS2 (v.2.2.7.1) and annotated with ChIPseeker (v.1.32.0) to generate BED and BEDgraph files for visualization with IGV. For differential binding analysis, DiffBind (v.3.6.1) was used to call statistically significant differential peaks after normalization and differential regions were selected based on DESeq2 method false discovery rate-corrected q-value of 0.05. Heat map and profile plots were generated with EnrichedHeatmap (v.1.26.0). The functional analyses of Gene Ontology term and KEGG pathway were performed using cluster-Profiler. De novo motif analysis was then carried out on centred 100-bp regions from the peak summits using MEME Suite (v.5.4.1).
snRNA-seq and analysis
For snRNA-seq, 25–30 mg samples were pulverized with liquid nitrogen and nuclei were prepared using Nuclei EZ Lysis buffer (NUC-101; Sigma-Aldrich) as described by Wu et al.61 with addition of 0.04% BSA/PBS in the final buffer. The nuclei were filtered through a 10-μm filter, sorted, and counted before the library was generated using the Chromium 3′ v3 GEM Kit (10x Genomics, CG000183RevC). Sequencing was performed by the CCHMC DNA Sequencing core using the NovaSeq 6000 (Illumina) sequencing platform with an S4 flow cell to obtain approximately 320 million reads per sample. The demultiplexing, barcode processing, gene counting, and aggregation were done and the fastq files were aligned to the GRCh38 human reference transcriptome using cellranger v.7.0.1, alevin-fry v.0.8.0, and starsolo v.2.7.9a. to extract the unique molecular identifiers (UMIs) and nuclei barcodes. SoupX v.1.6.0 was used to remove ambient RNA and other technical artefacts from the count matrices. The UMIs were quantified per-gene and per-nuclei for normalization. The dataset was then analysed using Seurat v.4.2.0 in RStudio v.4.1.1. Quality control was then carried out by using filtering parameters where nuclei with fewer than 200 or more than 4,000 features or more than 0.5% mitochondrial genes were discarded. In the end, 45,223 parenchymal nuclei were isolated out from a total of 120,195 nuclei. The dataset was then normalized, and the top 2,000 highly variable genes were selected using the VST method. The dataset was then scaled, and principal components analysis was run for dimensional reduction. Elbow plots and JackStraw plots were then used to determine the number of principal components to be used. The nuclei were then clustered using Louvain algorithm and k-nearest neighbours. UMAP projections were then used to visualize the clusters. Nulcei clusters were annotated based on gene-expression levels of known markers and markers detected in previously published datasets32,53. GSEA was then carried out using clusterProfiler v.4.4.2; the rank files were then extracted to group highly related pathways to the specific clusters in Cytoscape v.3.9.1. For integration, previously published dataset was merged with our dataset, normalized, integration features and anchors were computed, scaled, dimensions reduced, clusters created and finally projected as UMAP reductions. For trajectory analysis, monocle3 v.1.2.9 was used to convert the dataset to ‘cds’ objects, partitions were created, the trajectory graph was learnt in an unsupervised fashion, and finally the nulcei were ordered in psuedotime. Concurrently, the dataset was imported into scanpy v.1.9.1 as ‘anndata’ and trajectory was analysed using scvelo v.0.2.4 by projecting the computed RNA velocity onto the previously generated UMAP reduction.
Integrated dataset of published human liver organoids and primary liver reference
For integration eight different protocol-based hiPS cell-derived liver organoid and four primary adult and fetal datasets were collected according to the descriptions in the original publications28,34–38. In brief, we obtained available data (either raw FASTQ files, count matrices, H5AD, or Cell Ranger outputs such as filtered_feature_bc_matrix files) for each organoid from databases such as GEO, ArrayExpress, and the Human Cell Atlas. For FASTQ files, we used Cell Ranger to align and quantify the sequencing reads with the same parameters described in the original publication, generating UMI count data. Subsequent data processing was performed in Seurat using default settings. We curated metadata for all organoid data, including cell barcodes, sample names, cell type annotations, and cell cycle phase. We normalized and combined the public organoid data with our mZ-HLO data. Concurrently, we identified the top 3,000 variable genes from the primary liver data and applied these to the organoid dataset. Cell type annotations were based on the original publication and assigned into hepatocytes, hepatoblasts, endothelial cells, cholangiocytes, macrophage, mesenchyme, and stellate cells, which were added as new metadata. Using Seurat RPCA integration, we integrated the organoid data comprising 29,526 cells and the primary liver data comprising 8,656 cells. The same configurations were used to integrate the mZ-HLO dataset. After integration, we performed Louvain clustering and re-annotated cell types based on the expression of known marker genes. For further comparative analyses, we used the integrated organoid data as the query and the primary liver data as the reference. To benchmark our mZ-HLO model against existing models, we used the miloR and scrabbitr R packages39,40 to compute neighbourhood graphs, compare neighbourhoods based on similar features, and map neighbourhood comparison defined by k-nearest neighbours graph using UMAP embeddings for primary adult and fetal liver dataset. The neighbourhood correlations were computed using 3,000 highly variable genes that were found in the highly variable genes in either adult or fetal primary liver compared as reference. The transcriptional similarity graph was computed using 30-dimensional nearest neighbours and UMAP embeddings of cells, while other parameters were implemented as default.
Adenovirus-mediated gene silencing of p300 in vivo
The BLOCK-iT adenoviral RNA interference expression system (Invitrogen) was used to construct adenoviral shRNA for p300 and scrambled shRNA as previously described62. Rat pups aged about P0–P1 were then placed on a sterile heating pad, sanitized using isopropyl alcohol and iodine tincture to clean the skin surface. Finally, a 32G 1-inch needle was used to inject the adenoviruses (10 μg = 1.25 × 10¹³ vg) via the retro-orbital route. The rat pups were then returned to the mother by rubbing them with the nesting material to prevent pup rejection. Finally, the pups were killed, and the livers were collected at age P5, as most pups died at P7, to be fixed in 4% PFA and stained.
Isolation of freshly isolated PHH for benchmarking
A fresh healthy human transplant rejected liver was collected and cut into 1-g pieces. The liver pieces were chopped into a fine paste like consistency and submerged in Liver Digest Medium (Gibco, 17703034) for 15 min at 37 °C to isolate single cells44. The cells were then passed through a 100-μm strainer on ice and centrifuged at 50g for 3 min at 4 °C. Next the H40 fraction was isolated by passing the cells through a 40-μm strainer on ice again, while the H20 fraction was isolated by passing the cells through a 20-μm strainer on ice. Finally, the isolated cells were immediately used for gene-expression profiling using RT–qPCR and epigenetic profiling by ChIP.
Organoid transplantation
The HLOs and mZ-HLOs were collected right after co-culture on day 23 and dissociated into chunks by repeated pipetting, washed with PBS and resuspended with HCM containing 2% FBS and CEPT cocktail to increase viability. On the day of surgery, the RRG rats were fully anaesthetized, and an exploratory laparotomy was performed via midline incision followed by bowel evisceration to expose the portal triad, including the portal vein. The bile duct was ligated using nylon suture proximally and distally. The HLOs and mZ-HLOs (5 × 10⁶ cells) were then transplanted orthotopically at the base of the liver in close proximity to the portal vein using TISSEEL fibrin glue (Baxter). Conversely, for Z1-HLO and Z3-HLO affinity testing, the HLOs were injected through the portal vein or inferior vena cava using a 32G 1-inch needle in a 200-μl infusion. Bleeding was controlled by application of a bulldog clamp distal to the site of injection. The incision was then closed in two layers with 5–0 vicryl-coated surgical sutures (Ethicon) and GLUture (Zoetis) and buprenorphine (0.1 mg kg−1) was administered as an analgesic. The animal was maintained on ad libitum Dox chow until the day of collection. Blood was collected regularly by the retro-orbital method as needed before the liver was collected on day 30. For antegrade and retrograde intravenous transplantation, the RRG rats were fully anaesthetized, and an exploratory laparotomy was performed as described previously for transplantation through two different routes: portal vein (antegrade) or inferior vena cava (retrograde)48. With the portal vein or inferior vena cava exposed, a 32G 1-inch needle was used to inject 3 × 10³ organoids (roughly 5 × 10⁵ cells) in a 200-μl infusion into the portal vein. Bleeding was controlled by application of a bulldog clamp distal to the site of injection. This also assisted with preferential flow into the liver. Excessive blood loss was controlled by application of a SURGICEL SNoW Absorbable Hemostat (Ethicon). The incision was then closed in two layers with 5–0 vicryl-coated surgical sutures (Ethicon) and GLUture (Zoetis) and buprenorphine (0.1 mg kg−1) was administered as an analgesic. The animal was then maintained on Dox (20 mg kg−1) and tacrolimus injections every 3–4 days until the day of collection. Blood was collected regularly by the retro-orbital method as needed.
Immunostaining
The organoid samples were fixed with 4% paraformaldehyde for 2 h and washed with PBS for 10 mins three times. The samples were hydrated and permeabilized with 0.1% Triton X-100/PBS and then blocked with 5% normal donkey serum. The samples were incubated with primary and secondary antibodies (as listed in Supplementary Table 1) overnight at 4 °C with gentle shaking. The samples were counterstained with DAPI, washed with PBS and cleared with refractive index matching solution (RIMS) as needed. Finally, the samples were imaged on Nikon A1R Inverted LUNV Confocal Laser Scanning Microscope.
Protein expression assays
Albumin secretion was measured by collecting 200 μl of the supernatant from the HLOs cultured in HCM and stored at −80 °C until use. The supernatant was assayed with Human Albumin ELISA Quantitation Set (Bethyl Laboratories) according to the manufacturer’s instructions. For murine GULO expression assay, the organoids were dissociated and washed with PBS. The cells were then lysed with RIPA Lysis and Extraction Buffer and Halt Protease and Phosphatase Inhibitor Cocktail (Thermo Scientific) to extract total protein and assayed with Mouse GULO/l-Gulonolactone Oxidase ELISA Kit (MyBioSource.com, MBS2890736) according to the manufacturer’s instructions.
Metabolite assays
Bilirubin levels were measured by collecting the supernatant from HLOs treated with bilirubin and serum from the rats. The supernatant and serum were assayed with Bilirubin Assay Kit (Total and Direct, Colorimetric) (abcam, ab235627) and Bilirubin Assay Kit (Sigma-Aldrich, MAK126) according to the manufacturer’s instructions. Cellular antioxidant levels were measured by collecting the HLOs, washing in PBS, and plating them into a 96-well assay plate. The levels were then quantified using Cellular Antioxidant Assay Kit (ab242300) according to the manufacturer’s instructions. The nitrogen related metabolite assays were carried out by collecting the HLOs, washing in PBS, and plating them into a 96-well assay plate. The glutathione, ammonia, urea, glutamine, glucose, and triglyceride levels were then assayed by using the corresponding glutathione, ammonia, urea, glutamine, glucose, and triglyceride assay kits (abcam ab65322, ab83360, ab83362, ab197011, ab65333, ab65336) according to the manufacturer’s instructions.
Metabolic activity assays
CYP3A4 and CYP1A2 assays were performed by collecting the HLOs, washing in PBS, plating them into a 96-well assay plate, and treating them with rifampicin and omeprazole respectively for 24 h. The assays were then performed using P450-Glo CYP3A4 and CYP1A2 Assay (Promega, V8802 and V8422) and normalized using CellTiter-Glo Luminescent Cell Viability Assay (G7572) according to the manufacturer’s instructions. The Notch1 assay was carried out by transfecting the HLOs with the experimental, reporter and negative vectors from the Human Notch1 Pathway Reporter kit (amsbio, 79503) using Lipofectamine 3000 and Opti-MEM I according to the manufacturer’s instructions. Dual Luciferase Assay System (amsbio, 60683–2) for Notch1 assay was then used to measure the Firefly luciferase activity and compared to Renilla luciferase activity to normalize the transfection efficiency. The luciferase assay indicates Notch activity using a CSL (CBF1/RBPJK) luciferase reporter vector, Notch pathway responsive reporter. Notch1 is cleaved by gamma secretase and NICD is released into the nucleus which is detected by the luciferase reporter as active Notch signalling. The nitrogen metabolism related enzyme assays were carried out by collecting the HLOs, washing in PBS, and plating them into a 96-well assay plate. The GS activity and GST activity levels were then assayed by using the Glutamine Synthetase Activity, Glutathione S Transferase Activity, Lipase Activity, and Glucokinase Activity Assay Kit (abcam ab284572, ab65325, ab102524, ab273303) according to the manufacturer’s instructions. The apoptosis assay was carried out by lysing the HLOs and assaying the lysate with a Caspase-3 Assay Kit (Colorimetric) (ab39401) according to the manufacturer’s instructions. Finally, rat serum was assayed with AST and ALT Activity Assay Kit (Sigma-Aldrich, MAK055 and MAK052) and quantified by a BioTek Synergy H1 plate reader.
Zonal toxicity assay
The HLOs were induced with 3-MC (50 μM) for alcohol degradation and drug conjugation metabolism 24 h prior to the toxicity assay. After induction a toxic dose of the zone 1 toxin allyl alcohol (200 μM) was supplemented for 2 h at 37 °C. On the other hand, a toxic dose of the zone 3 toxin acetaminophen (10 mM) was supplemented for 4 h at 37 °C on different batches. However, for the mZ-HLO regenerative potential assay the toxins were incubated for 1 h at 37 °C. Subsequently, organoids were supplied with fresh medium and the organoids were fixed after 24 h in 4% PFA and stained. The cultures were then tested for caspase-3 activity using the cellular lysate collected from the organoid culture. Separately, the cultures were also tested for viability using CellTiter-Glo Luminescent Cell Viability Assay.
Plasticity assay
The HLOs were treated with Dox starting at day 17 and some organoids were fixed in 4% PFA before Dox withdrawal on day 20. On day 20 one group of organoids were continually treated with Dox every 2–3 days, whereas another group was withdrawn from Dox and treated with continuous low-dose bilirubin until day 25. On day 25 the organoids were collected for extraction of RNA, while some organoids were fixed and stained for zonal markers using immunostaining and visualized using a fluorescent microscope.
Quantification and statistical analysis
Statistical analyses were mainly performed using R software v.4.2.0 with unpaired two-tailed Student’s t-test, one-way ANOVA and post hoc Tukey’s test. Statistical analyses for non-normally distributed measurements were performed using non-parametric Kruskal–Wallis and post hoc Dunn–Holland–Wolfe test. For comparisons between unpaired groups, when groups were independent and the data was right skewed and censored, non-parametric log-rank test was performed. P values of <0.05 were considered statistically significant. n refers to biologically independent replicates. The image analyses were non-blinded. Using G*Power software, for each experiment, we determined the minimum sample size to collect the data for using the preliminary effect sizes, α = 0.05 and power = 0.8. For data from each experiment, we also conducted a post hoc power analysis to determine whether our design had sufficient power. We had sufficient power (power > 0.8) for all our experiments.
Extended Data
Extended Data Fig. 1 |. Intracellular redox management enables CPS1+ hepatocyte specification in HLOs.

a) H&E histology, GLS2 IHC, and GS IHC images of liver sections are shown in panels from ODS od/od (GULO mutant) rat treated with 0.2% Ascorbic acid (AsA), ODS od/od rat treated without AsA. Scale bars indicate 100 μm. The graph shows the GLS2 or GS positive area ratio versus the hematoxylin positive area in ODS od/od (GULO mutant) rat treated with 0.2% Ascorbic acid (AsA) and ODS od/od rat treated without AsA. Data points are shown for GLS2 area at portal vein (37 portal vein sections of + AsA rats, 27 portal vein sections of - AsA rats) and GS area in 8 images of +/− AsA rat. b) Schematic for development of Z1-HLOs and doxycycline induction to induce CPS1+ hepatocyte specification (left). Brightfield and fluorescence images of mCherry expression in ascorbate depleted Dox (100 ng/ml) treated Z1-HLOs compared to HLOs with ascorbic acid depletion at D20 and control HLOs (right). c) ELISA for mGULO protein concentration in Dox treated Z1-HLOs compared to control HLOs. (n = 9 independent experiments). d) Cellular Antioxidant concentration in Dox treated Z1-HLOs compared to control HLOs. (n = 9 independent experiments). e) ROS levels in Dox treated and extracellular ascorbate induced Z1-HLOs compared to control HLOs. (n = 9 independent experiments). f) RT-qPCR of genes for Z1-HLOs. (mean ± SD and n = 9 independent experiments). g) Albumin ELISA for Z1-HLOs treated with Dox compared to control HLOs and PHH normalized by cell viability. (n = 9 independent experiments). h) Immunofluorescence images of Dox treated Z1-HLOs for CPS1, ACSS2 and CDH1 compared to control HLOs and primary liver. Scale bar indicates 200 μm. (n = 3 independent experiments). In c-e, g data are represented as boxplots where the middle line is the median, the lower and upper hinges correspond to the first and third quartiles, the upper and lower whisker extends from the hinge to the largest and smallest value respectively no further than 1.5 × IQR from the hinge (where IQR is the inter-quartile range). c-e, f, g, one-way ANOVA with multiple comparisons and Tukey’s correction.
Extended Data Fig. 2 |. Low dose bilirubin promotes GLUL+ hepatocyte specification in HLOs.

a) Schematic for low dose bilirubin treatment and Z3-HLO development to induce GLUL+ expression. b) Cell viability assay with different concentration of bilirubin to titrate dose for maximal viability. (n = 9 independent experiments). c) Brightfield image of Z3-HLOs treated with low dose bilirubin (1 mg/L) compared to control, and luminal outline using ImageJ, arrows indicate luminal projections that are similar to bile canaliculi found in human liver. Scale bar indicates 200 μm. d) Comparison of size and circularity of lumen of the control and 1 mg/L bilirubin treated Z3-HLOs. (Data is mean ± SD, n = 9 independent experiments). e) Heatmap of Zone 3 genes from RNAseq dataset for bilirubin treated Z3-HLOs compared to control. f) RT-qPCR of genes for Z3-HLOs. (mean ± SD and n = 9 independent experiments). g) CYP3A4 activity assay in response to Rifampicin in control, Z1-, Z3-HLOs, and PHH (left). CYP1A2 activity assay in response to Omeprazole in control, Z1-, Z3-HLOs, and PHH (right). (n = 9 independent experiments). h) Immunofluorescence images of Z3-HLOs for GLUL, NR3C1 and CDH1 compared to control HLOs and primary liver. Scale bar indicates 200 μm. (n = 3 independent experiments). i) Heatmap of Z1- and Z3- HLOs depicting expression of zonal genes and lack of consensus expression of markers such as ARG1 and AKR1C1. j) Caspase 3 activity assay in Z3-HLOs (left) and cell viability assay in Z3-HLOs compared to Z1-HLOs after treatment with Zone 1 toxin (right). (n = 9 independent experiments). k) Caspase 3 activity assay in Z3-HLOs (left) and cell viability assay in Z3-HLOs compared to Z1-HLOs after treatment with Zone 3 toxin (right). (n = 9 independent experiments). In b, g, j, k data are represented as boxplots where the middle line is the median, the lower and upper hinges correspond to the first and third quartiles, the upper and lower whisker extends from the hinge to the largest and smallest value respectively no further than 1.5 × IQR from the hinge (where IQR is the inter-quartile range). b,f, g,j,k one-way ANOVA with multiple comparisons and Tukey’s correction. d, Kruskal–Wallis test (left) and unpaired two-tailed Student’s t-test (right).
Extended Data Fig. 3 |. Bilirubin induced fusion requires close proximity and cytoskeletal signaling.

a) Brightfield images of bilirubin induced fusion in high density HLOs compared to low density and no bilirubin treatment. Scale bar indicates 200 μm. b) Comparison of mean segment length in high density HLOs compared to low density and no bilirubin treatment. (n = 9 independent experiments). c) Brightfield and live staining images (NucBlue: Blue, Cytoskeleton: White) show progression of organoid fusion after continued treatment with bilirubin (1 mg/L). Scale bar indicates 200 μm. (n = 3 independent experiments). d) Comparison of mean segment length of the HLOs from D1 to D7. (n = 9 independent experiments). e) NOTCH activity assay in bilirubin treated HLOs compared to control. (n = 9 independent experiments). f) Percentage of fused organoids after bilirubin treatment in DAPT (Notch inhibitor) and NSC (Ezrin Inhibitor, NSC668394) treated HLOs compared to control. (n = 9 independent experiments). g) Brightfield images of bilirubin induced fused HLOs compared to DAPT or NSC668394 treatment and control HLOs. Scale bar indicates 200 μm. (n = 3 independent experiments). h) CLF assay for self-assembled organoids compared to control. Scale indicates 200 μm. (n = 3 independent experiments). i) Percentage of fused organoids for each type of organoid. (n = 9 independent experiments). In e data is represented as boxplot where the middle line is the median, the lower and upper hinges correspond to the first and third quartiles, the upper and lower whisker extends from the hinge to the largest and smallest value respectively no further than 1.5 × IQR from the hinge (where IQR is the inter-quartile range). b,d, Kruskal-Wallis with multiple comparisons and Dunn-Holland-Wolfe correction. e, unpaired two-tailed Student’s t-test. i, one-way ANOVA with multiple comparisons and Tukey’s correction.
Extended Data Fig. 4 |. Immunostaining of mZ-HLOs compared to neonatal liver show similar features.

a) Brightfield images of fused HLOs following continued treatment with bilirubin compared to single dose treatment after 10 days. (n = 3 independent experiments). b) Immunofluorescence images (bottom) of mZ-HLOs depicting GFP, mCherry, PROX1 and A1AT. Scale bar indicates 200 μm. (n = 3 independent experiments). c) Immunofluorescence images of mZ-HLOs for pan liver markers: TUBA1A, CTNBB1, luminal marker: ZO-1 (depicting continuous lumen); Zone 1 markers: ARG1 and SLBP; Zone 2 marker TERT; Zone 3 markers: AHR, and MRP2; and Cholangiocyte marker CK7. Scale bar indicates 200 μm. Numbers on the bar indicate the percentage of fused organoids that express dual and single positivity for the indicated antigen staining. (n = 3 independent experiments). d) Immunohistochemistry images of neonatal liver sections for pan liver marker TUBA1A; Cholangiocyte marker CK7; Zone 1 markers: ARG1, SLBP, and GLS2; Zone 2 marker TERT; and Zone 3 markers: AHR, ALDH6A1 and MRP2. Scale bar indicates 200 μm. (P: Portal vein, C: Central vein). (n = 3 independent experiments).
Extended Data Fig. 5 |. Single cell profiling of mZ-HLOs indicate the emergence of zonal like populations.

a) UMAP plot with the major populations (hepatocytes, cholangiocytes, endothelial cells, macrophages, stellate cells, and mesenchyme) of all nuclei in mZ-HLOs. b) Distinct expression profile all populations in mZ-HLOs. The size of the circle indicates the percentage of nuclei in each population expressing each gene. The color represents the average expression level for the indicated gene. c) Heatmap showing scaled mean expression of all genes in each cluster. Top 10 marker genes in each cluster have been added as labels. d) Expression of known hepatoblast and zonal hepatocyte marker genes in each population. e) Violin plot for expression of AFP (hepatoblast gene), GSS (interzonal hepatocytes), GHR (pericentral hepatocyte), and GLS2 (periportal hepatocyte).
Extended Data Fig. 6 |. Pseudo-spatial profiling of mZ-HLOs show similarity of zonal expression to primary liver tissue.

a) Spatial plot for TAT (zone 1), HAMP (zone 2), and CYP3A4 (zone 3) markers in 10X Xenium healthy human liver dataset (publicly available dataset). b) UMAP plot of mZ-HLO with hepatocyte populations (top) and distribution of replicate data (bottom). c) Feature plot for TAT (zone 1), HAMP (zone 2), and CYP3A4 (zone 3) markers. d) UMAP plot for zonal hepatocyte populations from primary liver (Andrews et al.30) and mZ-HLOs integrated together (top). UMAP plot depicting distribution for total hepatocyte populations from primary liver and mZ-HLOs integrated together (bottom). e) Expression of known hepatoblast and zonal hepatocyte marker genes in mZ-HLOs benchmarked against Andrews et al.30 snRNAseq dataset. f) UMAP plot for all cell types (inset: sample distribution) from primary liver datasets and mZ-HLOs integrated together. g) Feature plot for GLS2 (zone 1), HAMP (zone 2), and GLUL (zone 3) markers.
Extended Data Fig. 7 |. RNA velocity and pseudotime analysis in mZ-HLOs.

a) Phase portrait of AFP, GLUL, and GLS2 depicting the dynamics of the gene splicing in the nuclei with the velocity and expression of AFP, GLUL, and GLS2 in nuclei as feature plots. b) SOM (Self Organizing Map) of single-nuclei transcriptome-derived zonation profiles for mZ-HLOs based on the different populations. c) Boxplot showing the pseudotime of each nuclei population in mZ-HLOs. d) Pathway enrichment analysis examining which cellular pathways represented in the hepatoblast, pericentral, periportal, and interzonal hepatocyte populations. Circles (nodes) represent pathways, sized by the number of genes included in that pathway. Related pathways, indicated by light blue lines, are grouped into a theme (black circle) and labeled. Intra-pathway and inter-pathway relationships are shown in light blue and represent the number of genes shared between each pathway. In c data is represented as boxplot where the middle line is the median, the lower and upper hinges correspond to the first and third quartiles, the upper and lower whisker extends from the hinge to the largest and smallest value respectively no further than 1.5 × IQR from the hinge (where IQR is the inter-quartile range), while data beyond the end of the whiskers are outlying points that are plotted individually.
Extended Data Fig. 8 |. EP300 differentially regulates zonal genes in mZ-HLOs in conjunction to distinct transcription factors.

a) Peak density plots showing EP300 bound loci, a marker of active enhancers. Profile plot of all peaks are in the top panel. b) Genome browser view of HNF4A (pan marker) showing the EP300 ChIPseq peak. c) Genome browser view of CTNNB1 (pan marker) showing the EP300 ChIPseq peak. d) Genome browser view of SLBP (zone 1 gene) showing the EP300 ChIPseq peak. e) Genome browser view of AKR1C1 (zone 2 gene) showing the EP300 ChIPseq peak. f) Genome browser view of GHR (zone 3 gene) showing the EP300 ChIPseq peak. g) Top 10 upregulated Gene Ontology terms (Biological Process) for the gene regulated bound by EP300 in the Z1-HLOs. h) Top 10 upregulated Gene Ontology terms (Biological Process) for the gene regulated bound by EP300 in the Z3-HLOs.
Extended Data Fig. 9 |. EP300 and partner transcription factors are important for zonal liver development.

a) Experimental timeline for testing role of EP300 in zonal liver development using Ad-shp300 (adenoviral vector for p300 shRNA, top). H&E stain for sections from rat liver injected with Ad-shSCR (adenoviral vector for scrambled shRNA, middle) and Ad-shp300 (adenoviral vector for p300 shRNA, bottom). Scale bar indicates 200 μm. (P: Portal vein, C: Central vein). b) ICH stain for PROX1, ARG1, and GLUL of sections from rat liver injected with Ad-shSCR (adenoviral vector for scrambled shRNA, top) and Ad-shp300 (adenoviral vector for p300 shRNA, bottom). Scale bar indicates 200 μm. (P: Portal vein, C: Central vein). c) RT-qPCR of ALB, ACSS2, ASL, CPS1, and OTC (zone 1) gene for Z1- and Z3-HLOs compared to freshly isolated PHH, H20 (20 um periportal hepatocytes) and H40 (40 um pericentral hepatocytes) (Data is mean ± SD, n = 9 independent experiments). d) RT-qPCR of ALDH1A2, ALDH6A1, HIF1A, SREBF1, and GLUL (zone 3) gene for Z1- and Z3-HLOs compared to freshly isolated PHH, H20 (20 um periportal hepatocytes) and H40 (40 um pericentral hepatocytes) (Data is mean ± SD, n = 9 independent experiments). e) EP300-TF ChIP-reChIP-PCR for H20 (20 um periportal hepatocytes) and H40 (40 um pericentral hepatocytes). (n = 3 independent experiments). f) EP300-TF ChIP-reChIP-qPCR for samples in (e). Data are mean ± SD, n = 9 independent experiments. g) Schematic for bilirubin and ascorbate mediated distinct epigenetic regulation leading to differential gene expression. c, d, one-way ANOVA with multiple comparisons and Tukey’s correction. f, unpaired two-tailed Student’s t-test.
Extended Data Fig. 10 |. Interzonal dependent lipid and glucose metabolism in mZ-HLOs.

a) Triglyceride assay for mZ-HLOs with and without Firsocostat treatment compared to Z1-, Z3-, control HLOs, and PHH (n = 9 independent experiments). b) Lipase activity assay for mZ-HLOs with and without Firsocostat treatment compared to Z1-, Z3-, control HLOs, and PHH (n = 9 independent experiments). c) Glucose assay for mZ-HLOs with and without FBPi treatment compared to Z1-, Z3-, control HLOs, and PHH (n = 9 independent experiments). d) Glucokinase activity assay for mZ-HLOs with and without FBPi treatment compared to Z1-, Z3-, control HLOs, and PHH (n = 9 independent experiments). In a, c data are represented as boxplots where the middle line is the median, the lower and upper hinges correspond to the first and third quartiles, the upper and lower whisker extends from the hinge to the largest and smallest value respectively no further than 1.5 × IQR from the hinge (where IQR is the inter-quartile range). a,c, one-way ANOVA with multiple comparisons and Tukey’s correction.
Extended Data Fig. 11 |. mZ-HLOs exhibit zone specific regenerative potential in response to toxins.

a) Experimental timeline for testing zonal regenerative potential of mZ-HLOs in response to zone specific toxins. b) Immunofluorescence images of mZ-HLOs for proliferative marker Ki-67, GLUL, ARG1 and HAMP in response to Allyl Alcohol (Zone 1 toxin, left). Immunofluorescence images of mZ-HLOs for proliferative marker Ki-67, GLUL and ARG1 in response to Acetaminophen (Zone 3 toxin). Scale bar indicates 200 μm. c) Comparison of Ki-67 + nuclei in different fluorescent regions in response to zone specific toxins. (Data is mean ± SD, n = 9 independent experiments). d) Comparison of length of different fluorescent regions in response to zone specific toxins. (Data is mean ± SD, n = 9 independent experiments). e) Immunofluorescence images of CPS1, TET1, GLUL, NR3C1, and mCherry in Z1-HLOs with Dox treatment and after Dox withdrawal and persistent bilirubin treatment at D20 and 25. Scale bar indicates 200 μm. f) RT-qPCR of ACSS2, CPS1, ALDH1A2 and GLUL gene for Z3-HLOs with Dox (Dox +) and with bilirubin after Dox withdrawal (Dox − Bilirubin +) compared to control HLOs (Data is mean ± SD, n = 9 independent experiments). c, d, unpaired two-tailed Student’s t-test. f, one-way ANOVA with multiple comparisons and Tukey’s correction.
Extended Data Fig. 12 |. mZ-HLOs invade into the liver parenchyma of RRG rats after transplantation.

a) Immunofluorescence images for human TUBA1A of mZ-HLOs transplanted in RRG rat liver. Scale bar indicates 200 μm. (n = 3 independent experiments). b) Immunofluorescence images for human ASGR1 of mZ-HLOs transplanted in RRG rat liver. Scale bar indicates 200 μm. (n = 3 independent experiments). c) Immunofluorescence images for GFP, mCherry, human ARG1 and GLUL of mZ-HLOs transplanted in RRG rat liver. Scale bar indicates 200 μm. (n = 3 independent experiments). d) Immunofluorescence images for human ASGR1 of Z1 and Z3-HLOs transplanted in RRG rat liver through the portal vein and inferior vena cava. Scale bar indicates 200 μm. Numbers on the bar indicate the ratio of the area of integrated organoids and total area of the liver parenchyma in view in 103 pixel2 (Data is mean ± SD, n = 9 independent experiments).
Supplementary Material
Additional information
Supplementary information The online version contains supplementary material available at https://doi.org/10.1038/s41586-025-08850-1.
Acknowledgements
The authors thank A. Kodaka for scientific illustration materials; N. Saiki for bioinformatic support; Y.-C. Hu and C. Mayhew for Gulo-edited hiPS cell generation; all members of the Takebe, Zorn, Helmrath and Wells laboratories for their support and feedback; A. Potter for expertise in single-cell isolation and troubleshooting; and the thesis committee (J. A. Bezerra, V. Hwa, R. C. C. Quillin, J. Tchieu and J. M. Wells) for their continued support of H.A.R. and constructive criticism. We acknowledge the CCHMC Confocal Imaging Core (RRID:SCR_022628), Pathology Research Core (RRID:SCR_022637), Pluripotent Stem Cell Facility (RRID:SCR_022634), Transgenic Animal and Genome Editing Core (RRID:SCR_022642), Veterinary Services Facility, and Single Cell Genomics Core (RRID:SCR_022653) for providing gene-expression profiling and analysis. Human liver and pancreas were received from the islet cell laboratory of A. N. Balamurugan. We extend our deepest gratitude to the courageous families who generously donated their loved one’s organs and tissues for biomedical research. Thanks to Network of Hope, Louisville/Cincinnati; and Lifeline of Ohio, Columbus for supporting these special families. This work was supported by Cincinnati Children’s Research Foundation CURE grant, the Falk Transformational Award Program, New York Stem Cell Foundation, NIH Director’s New Innovator Award (DP2 DK128799–01) and R01DK135478 to T.T. This work was also supported by an NIH grant UG3/UH3 DK119982, Cincinnati Center for Autoimmune Liver Disease Fellowship Award, PHS Grant P30 DK078392 (Integrative Morphology Core and Pluripotent Stem Cell and Organoid Core) of the Digestive Disease Research Core Center in Cincinnati, Takeda Science Foundation Award, Mitsubishi Foundation Award, Cannon Foundation Award and by Japan Agency for Medical Research and Development (AMED) under grant numbers: JP24bm1223006, JP24ym0126809, JP21bm0404045, JP18fk0210037, JP18bm0704025, JP23gm1610005, JP23fk0210106, JP24gm1210012, JP24fk0210150 and JP21fk0210060, JST Moonshot: JPMJMS2022 and JPMJMS2033, JSPS KAKENHI: JP18H02800, 19K22416, 21H04822 and World Premier International Research Center Initiative (WPI) PRIMe, MEXT, Japan.
Footnotes
Competing interests The authors declare no competing interests.
Reporting summary
Further information on research design is available in the Nature Portfolio Reporting Summary linked to this article.
Data availability
The RNA-seq, ChIP–seq and snRNA-seq data reported in this paper have been deposited to NCBI Gene Expression Omnibus (GEO) with the following accession number: GSE222654. Publicly available datasets were downloaded from the following sources: Camp et al.34 (GSE96981), Guan et al.35 (GSE154883), Harrison et al.36 (GSE245379), Hess et al.37 (GSE207889), Shinozawa et al.28 (GSE141183), Zhang et al.38 (GSE188541) and Smith et al.43 (PRJNA239635). For primary adult and fetal datasets, we downloaded H5AD data deposited in the Human Cell Atlas (https://collections.cellatlas.io/liver-development). The hg38 human reference genome is available at NCBI Genome under accession number GCF_000001405.26. Source data are provided with this paper.
Code availability
Reference codes for bioinformatics analyses can be found at https://github.com/hasanwraeth/Multi-zonal-Liver-Organoids-from-Human-Pluripotent-Stem-Cells.
References
- 1.Ben-Moshe S & Itzkovitz S Spatial heterogeneity in the mammalian liver. Nat. Rev. Gastroenterol. Hepatol. 16, 395–410 (2019). [DOI] [PubMed] [Google Scholar]
- 2.Kang J et al. Simultaneous deletion of the methylcytosine oxidases Tet1 and Tet3 increases transcriptome variability in early embryogenesis. Proc. Natl Acad. Sci. USA 112, E4236–E4245 (2015). [DOI] [PMC free article] [PubMed] [Google Scholar]
- 3.Kim SG et al. Bilirubin activates transcription of HIF-1α in human proximal tubular cells cultured in the physiologic oxygen content. J. Kor. Med. Sci. 29, S146–S154 (2014). [DOI] [PMC free article] [PubMed] [Google Scholar]
- 4.Martini T, Naef F & Tchorz JS Spatiotemporal metabolic liver zonation and consequences on pathophysiology. Annu. Rev. Pathol. Mech. Dis. 18, 439–466 (2023). [DOI] [PubMed] [Google Scholar]
- 5.Bartl M et al. Optimality in the zonation of ammonia detoxification in rodent liver. Arch. Toxicol. 89, 2069–2078 (2015). [DOI] [PubMed] [Google Scholar]
- 6.Husson A, Brasse-Lagnel C, Fairand A, Renouf S & Lavoinne A Argininosuccinate synthetase from the urea cycle to the citrulline–NO cycle. Eur. J. Biochem. 270, 1887–1899 (2003). [DOI] [PubMed] [Google Scholar]
- 7.Häussinger D Nitrogen metabolism in liver: structural and functional organization and physiological relevance. Biochem. J 267, 281–290 (1990). [DOI] [PMC free article] [PubMed] [Google Scholar]
- 8.van Straten G et al. Aberrant expression and distribution of enzymes of the urea cycle and other ammonia metabolizing pathways in dogs with congenital portosystemic shunts. PLoS ONE 9, e100077 (2014). [DOI] [PMC free article] [PubMed] [Google Scholar]
- 9.McNaughton L et al. Distribution of nitric oxide synthase in normal and cirrhotic human liver. Proc. Natl Acad. Sci. USA 99, 17161–17166 (2002). [DOI] [PMC free article] [PubMed] [Google Scholar]
- 10.Baldelli S et al. Glutathione and nitric oxide: key team players in use and disuse of skeletal muscle. Nutrients 11, 2318 (2019). [DOI] [PMC free article] [PubMed] [Google Scholar]
- 11.Yu Y et al. A comparative analysis of liver transcriptome suggests divergent liver function among human, mouse and rat. Genomics 96, 281–289 (2010). [DOI] [PubMed] [Google Scholar]
- 12.Jiang C et al. Comparative transcriptomics analyses in livers of mice, humans, and humanized mice define human-specific gene networks. Cells 9, 2566 (2020). [DOI] [PMC free article] [PubMed] [Google Scholar]
- 13.Cunningham RP & Porat-Shliom N Liver zonation—revisiting old questions with new technologies. Front. Physiol. 12, 732929 (2021). [DOI] [PMC free article] [PubMed] [Google Scholar]
- 14.Kolbe E et al. Mutual zonated interactions of Wnt and Hh signaling are orchestrating the metabolism of the adult liver in mice and human. Cell Rep. 29, 4553–4567.e4557 (2019). [DOI] [PubMed] [Google Scholar]
- 15.Wahlicht T et al. Controlled functional zonation of hepatocytes in vitro by engineering of Wnt signaling. ACS Synth. Biol. 9, 1638–1649 (2020). [DOI] [PubMed] [Google Scholar]
- 16.Nejak-Bowen KN, Zeng G, Tan X, Cieply B & Monga SP Beta-catenin regulates vitamin C biosynthesis and cell survival in murine liver. J. Biol. Chem. 284, 28115–28127 (2009). [DOI] [PMC free article] [PubMed] [Google Scholar]
- 17.Bacchus H, Heiffer MH & Altszuler N Potentiating effect of ascorbic acid on cortisone-induced gluconeogenesis. Proc. Soc. Exp. Biol. Med. 79, 648–650 (1952). [DOI] [PubMed] [Google Scholar]
- 18.Greene YJ, Harwood HJ & Stacpoole PW Ascorbic acid regulation of 3-hydroxy-3-methylglutaryl coenzyme A reductase activity and cholesterol synthesis in guinea pig liver. Biochim. Biophys. Acta 834, 134–138 (1985). [DOI] [PubMed] [Google Scholar]
- 19.Creeden JF, Gordon DM, Stec DE & Hinds TD Jr. Bilirubin as a metabolic hormone: the physiological relevance of low levels. Am. J. Physiol. Endocrinol. Metab 320, E191–E207 (2021). [DOI] [PMC free article] [PubMed] [Google Scholar]
- 20.Gazzin S et al. Bilirubin accumulation and Cyp mRNA expression in selected brain regions of jaundiced Gunn rat pups. Pediatr. Res. 71, 653–660 (2012). [DOI] [PubMed] [Google Scholar]
- 21.Tanii H et al. Induction of cytochrome P450 2A6 by bilirubin in human hepatocytes. Pharmacol. Pharm 4, 182–190 (2013). [Google Scholar]
- 22.Ma R, Martínez-Ramírez AS, Borders TL, Gao F & Sosa-Pineda B Metabolic and non-metabolic liver zonation is established non-synchronously and requires sinusoidal Wnts. eLife 9, e46206 (2020). [DOI] [PMC free article] [PubMed] [Google Scholar]
- 23.Cui J, Pan YH, Zhang Y, Jones G & Zhang S Progressive pseudogenization: vitamin C synthesis and its loss in bats. Mol. Biol. Evol. 28, 1025–1031 (2011). [DOI] [PubMed] [Google Scholar]
- 24.Reza HA et al. Synthetic augmentation of bilirubin metabolism in human pluripotent stem cell-derived liver organoids. Stem Cell Rep. 18, 2071–2083 (2023). [DOI] [PMC free article] [PubMed] [Google Scholar]
- 25.Horio F, Ozaki K, Yoshida A, Makino S & Hayashi Y Requirement for ascorbic acid in a rat mutant unable to synthesize ascorbic acid. J. Nutr. 115, 1630–1640 (1985). [DOI] [PubMed] [Google Scholar]
- 26.Kimura M et al. En masse organoid phenotyping informs metabolic-associated genetic susceptibility to NASH. Cell 185, 4216–4232.e4216 (2022). [DOI] [PMC free article] [PubMed] [Google Scholar]
- 27.Ouchi R et al. Modeling steatohepatitis in humans with pluripotent stem cell-derived organoids. Cell Metab. 30, 374–384.e376 (2019). [DOI] [PMC free article] [PubMed] [Google Scholar]
- 28.Shinozawa T et al. High-fidelity drug-induced liver injury screen using human pluripotent stem cell-derived organoids. Gastroenterology 160, 831–846.e810 (2021). [DOI] [PMC free article] [PubMed] [Google Scholar]
- 29.McCarty WJ, Usta OB & Yarmush ML A microfabricated platform for generating physiologically-relevant hepatocyte zonation. Sci. Rep. 6, 26868 (2016). [DOI] [PMC free article] [PubMed] [Google Scholar]
- 30.Andrews TS et al. Single-cell, single-nucleus, and spatial rna sequencing of the human liver identifies cholangiocyte and mesenchymal heterogeneity. Hepatol. Commun. 6, 821–840 (2022). [DOI] [PMC free article] [PubMed] [Google Scholar]
- 31.Aizarani N et al. A human liver cell atlas reveals heterogeneity and epithelial progenitors. Nature 572, 199–204 (2019). [DOI] [PMC free article] [PubMed] [Google Scholar]
- 32.MacParland SA et al. Single cell RNA sequencing of human liver reveals distinct intrahepatic macrophage populations. Nat. Commun. 9, 4383 (2018). [DOI] [PMC free article] [PubMed] [Google Scholar]
- 33.Wesley BT et al. Single-cell atlas of human liver development reveals pathways directing hepatic cell fates. Nat. Cell Biol. 24, 1487–1498 (2022). [DOI] [PMC free article] [PubMed] [Google Scholar]
- 34.Camp JG et al. Multilineage communication regulates human liver bud development from pluripotency. Nature 546, 533–538 (2017). [DOI] [PubMed] [Google Scholar]
- 35.Guan Y et al. A human multi-lineage hepatic organoid model for liver fibrosis. Nat. Commun. 12, 6138 (2021). [DOI] [PMC free article] [PubMed] [Google Scholar]
- 36.Harrison SP et al. Scalable production of tissue-like vascularized liver organoids from human PSCs. Exp. Mol. Med. 55, 2005–2024 (2023). [DOI] [PMC free article] [PubMed] [Google Scholar]
- 37.Hess A et al. Single‐cell transcriptomics stratifies organoid models of metabolic dysfunction‐associated steatotic liver disease. EMBO J. 42, e113898 (2023). [DOI] [PMC free article] [PubMed] [Google Scholar]
- 38.Zhang CJ et al. A human liver organoid screening platform for DILI risk prediction. J. Hepatol. 78, 998–1006 (2023). [DOI] [PMC free article] [PubMed] [Google Scholar]
- 39.Dann E, Henderson NC, Teichmann SA, Morgan MD & Marioni JC Differential abundance testing on single-cell data using k-nearest neighbor graphs. Nat. Biotechnol. 40, 245–253 (2022). [DOI] [PMC free article] [PubMed] [Google Scholar]
- 40.Ton M-LN et al. An atlas of rabbit development as a model for single-cell comparative genomics. Nat. Cell Biol. 25, 1061–1072 (2023). [DOI] [PubMed] [Google Scholar]
- 41.Thakur A et al. Hepatocyte nuclear factor 4-alpha is essential for the active epigenetic state at enhancers in mouse liver. Hepatology 70, 1360–1376 (2019). [DOI] [PMC free article] [PubMed] [Google Scholar]
- 42.Raisner R et al. Enhancer activity requires CBP/P300 bromodomain-dependent histone H3K27 acetylation. Cell Rep. 24, 1722–1729 (2018). [DOI] [PubMed] [Google Scholar]
- 43.Smith RP et al. Genome-wide discovery of drug-dependent human liver regulatory elements. PLoS Genet. 10, e1004648 (2014). [DOI] [PMC free article] [PubMed] [Google Scholar]
- 44.Ölander M et al. Hepatocyte size fractionation allows dissection of human liver zonation. J. Cell. Physiol. 236, 5885–5894 (2021). [DOI] [PubMed] [Google Scholar]
- 45.Kang SWS et al. A spatial map of hepatic mitochondria uncovers functional heterogeneity shaped by nutrient-sensing signaling. Nat. Commun. 15, 1799 (2024). [DOI] [PMC free article] [PubMed] [Google Scholar]
- 46.Mariotti V, Strazzabosco M, Fabris L & Calvisi DF Animal models of biliary injury and altered bile acid metabolism. Biochim. Biophys. Acta 1864, 1254–1261 (2018). [DOI] [PMC free article] [PubMed] [Google Scholar]
- 47.Claeys W et al. A mouse model of hepatic encephalopathy: bile duct ligation induces brain ammonia overload, glial cell activation and neuroinflammation. Sci. Rep. 12, 17558 (2022). [DOI] [PMC free article] [PubMed] [Google Scholar]
- 48.Goto Y, Ohashi K, Utoh R, Yamamoto M & Okano T Hepatocyte transplantation through the hepatic vein: a new route of cell transplantation to the liver. Cell Transplant. 20, 1259–1270 (2011). [DOI] [PubMed] [Google Scholar]
- 49.Paris J & Henderson NC Liver zonation, revisited. Hepatology 76, 1219–1230 (2022). [DOI] [PMC free article] [PubMed] [Google Scholar]
- 50.Scheidecker B et al. Induction of in vitro metabolic zonation in primary hepatocytes requires both near-physiological oxygen concentration and flux. Front. Bioeng. Biotechnol. 8, 524 (2020). [DOI] [PMC free article] [PubMed] [Google Scholar]
- 51.Bartl M et al. Model-based optimization to explain liver zonation in nitrogen metabolism. In 55th International Scientific Colloquium 235–240 (TU Ilmenau, 2021). [Google Scholar]
- 52.Harrison SP et al. Liver organoids: recent developments, limitations and potential. Front. Med 10.3389/fmed.2021.574047 (2021). [DOI] [PMC free article] [PubMed] [Google Scholar]
- 53.Wei Y et al. Liver homeostasis is maintained by midlobular zone 2 hepatocytes. Science 371, eabb1625 (2021). [DOI] [PMC free article] [PubMed] [Google Scholar]
- 54.He L et al. Proliferation tracing reveals regional hepatocyte generation in liver homeostasis and repair. Science 371, eabc4346 (2021). [DOI] [PubMed] [Google Scholar]
- 55.Li W, Li L & Hui L Cell plasticity in liver regeneration. Trends Cell Biol. 30, 329–338 (2020). [DOI] [PubMed] [Google Scholar]
- 56.Brosch M et al. Epigenomic map of human liver reveals principles of zonated morphogenic and metabolic control. Nat. Commun. 9, 4150 (2018). [DOI] [PMC free article] [PubMed] [Google Scholar]
- 57.Xu W et al. Hypoxia activates Wnt/β-catenin signaling by regulating the expression of BCL9 in human hepatocellular carcinoma. Sci. Rep. 7, 40446 (2017). [DOI] [PMC free article] [PubMed] [Google Scholar]
- 58.Kietzmann T Metabolic zonation of the liver: the oxygen gradient revisited. Redox Biol. 11, 622–630 (2017). [DOI] [PMC free article] [PubMed] [Google Scholar]
- 59.Iansante V, Mitry RR, Filippi C, Fitzpatrick E & Dhawan A Human hepatocyte transplantation for liver disease: current status and future perspectives. Pediatr. Res. 83, 232–240 (2018). [DOI] [PubMed] [Google Scholar]
- 60.Reza HA, Okabe R & Takebe T Organoid transplant approaches for the liver. Transpl. Int. 34, 2031–2045 (2021). [DOI] [PMC free article] [PubMed] [Google Scholar]
References
- 61.Wu H, Kirita Y, Donnelly EL & Humphreys BD Advantages of single-nucleus over single-cell RNA sequencing of adult kidney: rare cell types and novel cell states revealed in fibrosis. J. Am. Soc. Nephrol. 30, 23–32 (2019). [DOI] [PMC free article] [PubMed] [Google Scholar]
- 62.He L et al. Transcriptional co-activator p300 maintains basal hepatic gluconeogenesis. J. Biol. Chem. 287, 32069–32077 (2012). [DOI] [PMC free article] [PubMed] [Google Scholar]
Associated Data
This section collects any data citations, data availability statements, or supplementary materials included in this article.
Supplementary Materials
Data Availability Statement
The RNA-seq, ChIP–seq and snRNA-seq data reported in this paper have been deposited to NCBI Gene Expression Omnibus (GEO) with the following accession number: GSE222654. Publicly available datasets were downloaded from the following sources: Camp et al.34 (GSE96981), Guan et al.35 (GSE154883), Harrison et al.36 (GSE245379), Hess et al.37 (GSE207889), Shinozawa et al.28 (GSE141183), Zhang et al.38 (GSE188541) and Smith et al.43 (PRJNA239635). For primary adult and fetal datasets, we downloaded H5AD data deposited in the Human Cell Atlas (https://collections.cellatlas.io/liver-development). The hg38 human reference genome is available at NCBI Genome under accession number GCF_000001405.26. Source data are provided with this paper.