

Abstract
Autistic diagnosis and sensory tests present subjectivity, temporal behaviors, and vagueness. In the autistic sensory classification model, Recurrent Neural Networks (RNNs) and Long Short-Term Memory (LSTM) networks are considered for temporal sensory response patterns learning. To alleviate these challenges, we introduced an original hybrid framework that combines double hierarchy hesitant linguistic term sets (DHHLTS), temporal Three-Way Decision-Making (TWD). There are essentially three advantages of our research work in that, first, double fuzzy hierarchy mapping for dealing with precise expert evaluations. Secondly, temporal-aware RNN architecture is motivated by Hamacher t-norm/t-conorm aggregations. Lastly, explainable probabilistic TWD for risk categorization. This work combines fuzzy logic and decision theory to furnish an executable tool for caring for autistic people.
Keywords: Recurrent neural networks, Double hierarchy hesitant linguistic term, Three-way decision-making, Hamacher T-norm/T-conorm aggregation
Subject terms: Mathematics and computing, Applied mathematics, Computer science, Pure mathematics, Scientific data
Introduction
Autism Spectrum Disorder (ASD) is an intricate neurodevelopmental condition that includes impairments of social communication, restricted interests, and repetitive behaviors. One of the most frequent and disabling symptoms of autism is sensory processing that is abnormal, which can present as hypersensitivity (increased reactivity), hyposensitivity (decreased reactivity), or sensory seeking. These variables differ from each other in that they affect what one perceives and acts toward sensory inputs like sounds, touches, visual, or movement. Clinicians and therapists use a battery of assessments to understand these behaviors, including observation measures (e.g., Sensory Integration and Praxis Tests), standard inventories (e.g., Short Sensory Profile), and parent- and caregiver-completed behavioral questionnaires. These try to measure severity, consistency, and context of sensory issues to guide individually designed strategies1–5.
Autism assessments have moved from exclusively observation-dependent methodologies to increasingly data-rich methodologies. Functional behavioral analysis, eye-tracking, brain functioning measures based on EEG, and tests of sensory interaction in real time have joined the evaluation options. Neuropsychological tests and cognitive load measures are also integrated to achieve an understanding of the point where sensory dysfunction meets motor, cognitive, and social difficulties. This multi-dimensional approach to assessment raises the necessity for eliciting dynamic, temporal, and varied data from formal, structured clinics as well as naturalistic observation, which is generally replete with subjective and uncertain content that requires advanced model-building methodologies6,7.
In this context, sensory evaluation for autism is an overall Multi-Criteria Decision-Making (MCDM) problem. Selecting the most suitable sensory integration intervention is necessary through the simultaneous evaluation of various, sometimes conflicting, criteria, such as quality of treatment, flexibility for special needs, confidence of therapist, riskiness, comfort of patients, and maintenance after a long time. Additionally, expert judgment involves linguistic vagueness and indecisiveness, creating more complexity for the decision-making process. Therefore, there is a need for the development of an integrating decision model that can handle imprecise information, model temporal behavioral patterns, and provide interpretable outcomes for facilitating sensory intervention planning for autism8–10.
Linking Multi-Criteria Decision-Making (MCDM) to autism, and more so for evaluation and intervention planning, provides an analytical and formal way of addressing the innate complexity and relativism of the assessment of Autism Spectrum Disorder (ASD). Heterogeneous symptoms of autism cover across sensory sensitivities, communication impairment, behavioral responses, and cognitive variation. There is the need to take into consideration various contradictory criteria such as sensory response type (hypersensitive, hyposensitive, sensory seeking), treatment flexibility, patient comfort, therapist experience, parent preference, cost, and evidentiary support for treatment under MCDM. MCDM methodologies provide mathematically rigorous models of collating and prioritizing these diverse criteria to come up with a believable decision. MCDM plays a key role that is impossible to replace for autism problem assessment by enabling clinicians, therapists, and carers to escape intuitive or ad-hoc decision-making and move toward systematic, explainable, and consensus-oriented resolution. For example, using such techniques as Fuzzy AHP, TOPSIS, or the Double Hierarchy Hesitant Linguistic Term Sets (DHHLTS) method, expert judgments, normally given as vague, hesitant, or linguistic, can be numerically integrated. What is more, time-variant modeling can also be accommodated by MCDM when combined with Recurrent Neural Networks (RNNs), yielding insights into the manner, as time evolves, the sensory profile of a patient unfolds. During that process, MCDM enables evidence-based selection of intervention based on distinctive sensory needs, enhancing, ultimately, diagnosis accuracy, treatment customization, and clinical outcomes of ASD treatment11–15.
Autism Spectrum Disorder (ASD) presents an extremely diverse symptom profile, more so in sensory processing, were hypersensitivity, hyposensitivity, or sensory seeking might exist across diverse sensory modalities (e.g., auditory, tactile, visual). Assessment of these complex, and often contradictory, sensory responses must take into consideration, simultaneously, diverse clinical variables—such as effectiveness, tolerability, personal adaptability, and risk of overload. Classical decision-making models do not methodologically handle such multi-inspected information, even more so under the condition where expert judgment is qualitative, tentative, or linguistically stated. Multi-Criteria Decision Making (MCDM) methodologies are essential here, as they enable, in an organized, transparent, and quantitative way, assessment and prioritizing of multiple treatment options under conditions of uncertainty. Embedding MCDM in the above framework ensures the study provides robust support for decision-making for choosing personalized sensory intervention, matching clinical options to children with ASD’s subtle sensory profile.
Evaluations and planning of intervention for sensory issues of Autism Spectrum Disorder (ASD) have long been challenged due to the subjective nature of expert judgment, sensory behavior heterogeneity (e.g., hyper- as well as hypo-responsivity, sensory seeking), and time-varying dynamic symptom nature. Most traditional instruments and assessment schemes are largely static, crisp or fuzzy scale based, failing to present the hesitance, linguistic heterogeneity, or temporal richness of expert judgment and patients’ response. These challenges call for an adaptive, explainable, and data-informed decision model. Motivated by the ever-present need of bridging the gap between dynamic sensory trends of patients and expert linguistic assessment for planning efficient autism therapy, an integrated model is proposed that integrates Double Hierarchy Hesitant Linguistic Term Sets (DHHLTS) for time-varying sensory data learning, and Three-Way Decision-Making (TWD) for risk-informed intervention classification16. Having overcome traditional malaises of conventional MCDM methodologies like AHP or Fuzzy-AHP, the fusion approach is not only conducive to enhanced reliability and flexibility, but also better interpretability as well as explainability, making it an encouraging decision supporting tool for planning autism therapy.
Despite substantial advances in autism research and practice, sensory integration therapy assessment has remained largely stagnant and subjective. Assessment methodologies have, in the past, overwhelmingly relied on clinician experience, often without quantitative means of aggregating uncertain, ambiguous, and time-varying expert judgments. Moreover, reports that include Multi-Criteria Decision-Making (MCDM) methods such as AHP or Fuzzy TOPSIS typically employ only single-layer fuzzy sets and do not take into consideration longitudinal alterations of sensory responses along time. Lack of integration of temporal learning algorithms and of hierarchical, hesitant expert inputs leaves an essential void for better autism decision-making models that are more robust. Second, most models have failed to produce explainable, risk-aware classifications, required for applications to the practice of medicine where outcomes are large and patient-specific.
The aim of this study is to develop an ensemble and time-conscious decision-support model for sensory intervention assessment and selection for individuals who have Autism Spectrum Disorder (ASD). This model uses the Double Hierarchy Hesitant Linguistic Term Sets (DHHLTS) to encode and formalize hesitation and vagueness of expert judgment, integrates Recurrent Neural Networks (RNNs) specifically, Long Short-Term Memory (LSTM) units to model sensory response temporal changes, and uses Three-Way Decision-Making (TWD) to generate interpretable class labels: Accept, Delay, or Reject17–25. As an ensemble of fuzzy logic, neural temporal reasoning, and decision theory, the model is developed to attain an adaptive, data-driven, and risk-conscious approach that can assist clinicians toward more personalized and effective treatment planning for individuals who have ASD.
This paper is organized as follows: Sect. “Mathematical definitions of key terms in the proposed study” introduces the mathematical definitions of key terms in the proposed framework. Section “Formulation of hybrid sensory classification using DHHLTS,RNN, and TWD” formulates the hybrid sensory classification model integrating DHHLTS, RNN, and TWD. Section “Case study: multi-criteria decision-making (MCDM) forsensory assessment in autism intervention selection” presents a case study applying MCDM for autism sensory intervention selection. Section “Sensitivity analysis” fundamentally discusses the sensitivity analysis of our proposed mechanism. Section “Results and discussions” discusses experimental results and evaluates model performance. Section 7 concludes the study and outlines future research directions.
Mathematical definitions of key terms in the proposed study
Below are the precise mathematical definitions of all fundamental terms used in our LSTM-based temporal decision-making model for autism sensory classification.
Definition 1
Let  be a finite set of alternatives (interventions) and
  be a finite set of criteria (sensory factors). A multi-criteria decision function maps the alternatives to real-valued scores:
 |
1 |
where each entry  represents the evaluation score of alternatives
  under criterion
Definition 2
The evaluation matrix represents all interventions evaluated under multiple sensory criteria:
 |
2 |
where rows correspond to alternatives, and columns correspond to criteria.
Definition 3
Let  be a finite set of decision makers (DMs). Each DM provides evaluations in a linguistic structure represented as:
 |
3 |
where  represents the first-level linguistic term set (e.g., Low, Medium, High) and
  represents the second-level linguistic term set (e.g., Very Low, Very High).
Definition 4
Each linguistic term  is mapped to a triangular fuzzy number:
 |
4 |
where  (Lower Bound),
  (Middle Bound),
  (Upper Bound), k and l define hierarchical granularity levels.
Definition 5
Let  be the evaluation matrix of decision maker
  and let
  represent the aggregated fuzzy tensor across all decision makers. The aggregation using the Hamacher T-conorm is given by:
 |
5 |
ensuring fuzzy fusion across multiple evaluators.
Definition 6
To transform fuzzy values into crisp scores, we apply the centroid defuzzification method:
 |
6 |
which computes the weighted mean of the triangular fuzzy components.
Definition 7
The time-dependent sensory evaluation matrix is modeled as:
 |
7 |
where  represents the defuzzified sensory scores at time step t. The LSTM function transforms input sensory scores into hidden representations:
 |
8 |
The transformation is given as follows:
 |
9 |
where  is the cell state at time t
 Each LSTM gate is defined as:
 |
10 |
 |
11 |
 |
12 |
where  is the sigmoid activation function.
Definition 8
The probability of effectiveness for an intervention  is estimated using logistic regression:
 |
13 |
where Wd and bd are the decision model parameters. The expected loss of decisions for each action  is given by:
 |
14 |
where  and
and  define the loss values under effectiveness and ineffectiveness states. The optimal decision is selected by:
 |
15 |
Definition 9
Each intervention is classified based on its impact on sensory processing:
Hypersensitivity (Hyper) – Over-responsiveness to sensory stimuli:
 |
16 |
where  is the hypersensitivity threshold.
Hyposensitivity (Hypo) – Under-responsiveness to sensory stimuli:
 |
17 |
where  is the hyposensitivity threshold.
Sensory Seeking – Actively seeking sensory input:
| 18 |
where  is the sensory-seeking preference score. Each intervention is mapped to one or more categories, ensuring precise classification. The above definitions establish a rigorous mathematical foundation for the proposed decision-making model for autism sensory classification.
Formulation of hybrid sensory classification using DHHLTS, RNN, and TWD
Step 1 (Problem definition)
Let  be the set of alternatives,
  be the set of evaluation criteria, and
  be the set of decision-makers. Define a Double Hierarchy Hesitant Linguistic Term Set (DHHLTS) with:
Primary linguistic hierarchy
 .
.Secondary linguistic hierarchy
 .
.
Each decision-maker  assigns evaluations using a linguistic evaluation matrix:
 |
19 |
where L contains DHHLTS mappings 
 |
20 |
Step 2: (Fuzzy representation of linguistic evaluations)
Each linguistic evaluation  is mapped to a Triangular Fuzzy Number (TFN):
 |
21 |
where  Thus, the fuzzy decision tensor for each
  is represented as:
 |
22 |
Step 3: (Aggregation of fuzzy evaluations using Hamacher operators)
For two fuzzy numbers  the aggregated fuzzy number using Hamacher T-Norm and T-Conorm is given by:
 |
23 |
 |
24 |
 |
25 |
For  (Algebraic Sum Approximation), this reduces to:

The aggregated fuzzy decision matrix across all decision-makers is computed as:
 |
26 |
Step 4: (Defuzzification using the centroid method)
Given a triangular fuzzy number  , the defuzzified crisp value is computed using the Centroid Method:
 |
27 |
Thus, the Defuzzified decision Matrix is:
 |
28 |
Step 5: (Temporal classification via recurrent neural networks)
Let  be the defuzzified matrix processed using a Recurrent Neural Network (RNN). The hidden state update equation is given by:
 |
29 |
where  is the hidden state transition matrix,
  maps input to hidden state,
  is the bias term and
  is the activation function (e.g., sigmoid or tanh). The updated hidden states
  encode the temporal dependencies for decision classification.
Step 6: (Three-way decision-making with expected loss computation)
Define a loss matrix:
 |
30 |
For hidden state  , compute the conditional probabilities:
 |
31 |
The computed expected loss for classification:
| 32 |
| 33 |
A three-way decision rule is applied:
 |
34 |
This framework integrates fuzzy logic, deep learning, and decision theory for sensory classification under uncertainty. The steps 1–6, establish a rigorous mathematical foundation, ensuring the model’s scalability, interpretability, and reproducibility in decision-making environments (see Fig. 1).
Fig. 1.
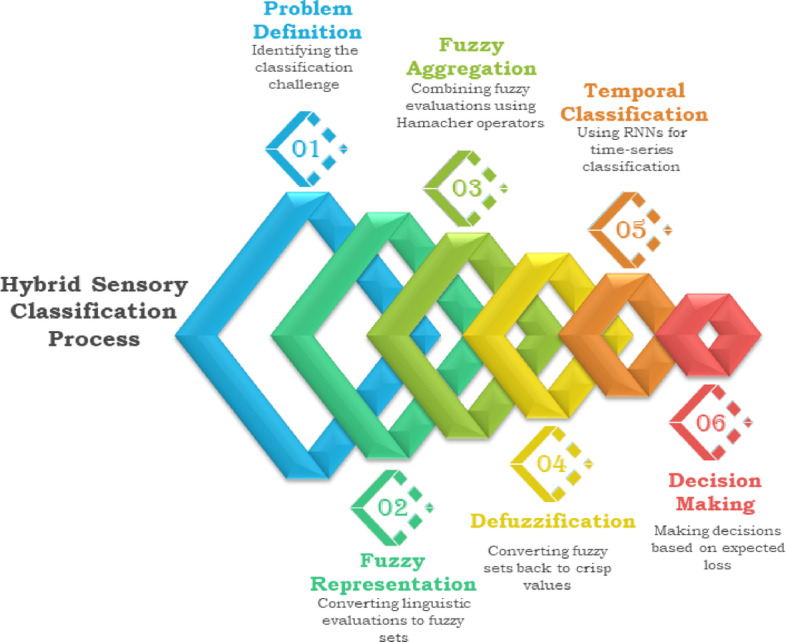
Proposed hybrid decision making algorithm for sensory characteristics ranking in autism.
Case study: multi-criteria decision-making (MCDM) for sensory assessment in autism intervention selection
To evaluate and select the most effective sensory intervention for children with Autism Spectrum Disorder (ASD) using Double Hierarchy Hesitant Linguistic Term Sets (DHHLTS), Recurrent Neural Networks (RNNs), and Three-Way Decision-Making (TWD). The decision is based on multiple criteria, assessed by a panel of experts.
Step 1: Problem definition.
The first step is mainly related to define the possible alternatives, criteria and decision makers for the selection of optimal intervention for an autistic child based on their sensory profile. Let  be a finite set of alternatives and
  be a finite set of criteria used for evaluation. Define the decision function:
 |
36 |
such that:
 |
37 |
where  represents the numerical performance value of material
  under criterion
  . The list of alternatives, criteria and possible decision makers are five as follows:
 |
38 |
where A1 = Sensory Integration Therapy (SIT), A2 = Auditory Integration Training (AIT), A3 = Occupational Therapy (OT), A4 = Visual Sensory Therapy (VST), A5 = Vestibular Therapy (VT) and A6 = Tactile Desensitization Therapy (TDT). The list of study criteria is given as follows:
 |
39 |
where C1 = Auditory Processing, C2 = Tactile Sensory Response, C3 = Visual-Motor Integration, C4 = Vestibular Processing and C5 = Proprioceptive Awareness. The possible decision makers which play the part in this investigation are given as follows:

where D1 = Child Psychologist, D2 = Occupational Therapist, D3 = Neurologist, D4 = Special Education Teacher and D5 = Speech-Language Pathologist. Define a First Hierarchy (S) and Second Hierarchy (O) Hesitant linguistic term set (DHHLTS) with (see Tables 1, 2, 3, 4 and 5):
Table 1.
Linguistic evaluation matrices for each DM1 (Child Psychologist).
| C1 | C2 | C3 | C4 | C5 | |
|---|---|---|---|---|---|
| A1 | F(s2, o3) | F(s3, o4) | F(s1, o2) | F(s2, o3) | F(s3, o4) |
| A2 | F(s3, o4) | F(s2, o3) | F(s2, o3) | F(s1, o2) | F(s2, o3) |
| A 3 | F(s2, o4) | F(s3, o5) | F(s1, o1) | F(s2, o4) | F(s3, o5) |
| A 4 | F(s1, o3) | F(s2, o4) | F(s3, o4) | F(s2, o3) | F(s1, o3) |
| A 5 | F(s3, o5) | F(s1, o2) | F(s2, o3) | F(s3, o4) | F(s2, o3) |
| A 6 | F(s3, o4) | F(s3, o5) | F(s2, o2) | F(s1, o3) | F(s3, o4) |
Table 2.
Linguistic evaluation matrices for each DM2 (occupational therapist).
| C1 | C2 | C3 | C4 | C5 | |
|---|---|---|---|---|---|
| A1 | F(s3, o4) | F(s2,o)3 | F(s2, o3) | F(s1, o2) | F(s2, o3) |
| A2 | F(s1, o2) | F(s3, o5) | F(s1, o1) | F(s2, o4) | F(s3, o5) |
| A 3 | F(s2, o4) | F(s3, o4) | F(s3, o5) | F(s2, o3) | F(s1, o3) |
| A 4 | F(s3, o5) | F(s1, o2) | F(s2, o3) | F(s3, o4) | F(s2, o3) |
| A 5 | F(s3,o4) | F(s3,o5) | F(s2, o2) | F(s1, o3) | F(s3, o4) |
| A 6 | F(s2, o3) | F(s3, o4) | F(s1, o2) | F(s2, o3) | F(s3, o4) |
Table 3.
Linguistic evaluation matrices for each DM3 (Neurologist).
| C1 | C2 | C3 | C4 | C5 | |
|---|---|---|---|---|---|
| A1 | F(s3, o5) | F(s1, o2) | F(s2, o3) | F(s3, o4) | F(s2, o3) |
| A2 | F(s3, o4) | F(s3, o5) | F(s2, o2) | F(s1, o3) | F(s3, o4) |
| A 3 | F(s2, o3) | F(s3, o4) | F(s1, o2) | F(s2, o3) | F(s3, o4) |
| A 4 | F(s1, o2) | F(s3, o5) | F(s1, o1) | F(s2, o4) | F(s3, o5) |
| A 5 | F(s2, o4) | F(s3, o4) | F(s3, o5) | F(s2,o3) | F(s1, o3) |
| A 6 | F(s3, o4) | F(s2, o3) | F(s2, o3) | F(s1, o2) | F(s2, o3) |
Table 4.
Linguistic evaluation matrices for each DM4 (special education teacher).
| C1 | C2 | C3 | C4 | C5 | |
|---|---|---|---|---|---|
| A1 | F(s1, o3) | F(s2, o4) | F(s3, o4) | F(s2, o3) | F(s1, o3) |
| A2 | F(s3,o5) | F(s1, o2) | F(s2, o3) | F(s3, o4) | F(s2, o3) |
| A 3 | F(s3,o4) | F(s3, o5) | F(s2, o2) | F(s1, o3) | F(s3, o4) |
| A 4 | F(s2,o3) | F(s3, o4) | F(s1, o2) | F(s2, o3) | F(s3, o4) |
| A 5 | F(s1, o2) | F(s3, o5) | F(s1, o1) | F(s2, o4) | F(s3, o5) |
| A 6 | F(s2, o4) | F(s3, o4) | F(s3, o5) | F(s2, o3) | F(s1, o3) |
DM5 (speech-language pathologist)
Table 5.
Linguistic evaluation matrices for each DM5 (speech-language pathologist).
| C1 | C2 | C3 | C4 | C5 | |
|---|---|---|---|---|---|
| A1 | F(s2, o4) | F(s3, o3) | F(s1, o2) | F(s3, o5) | F(s2, o4) |
| A2 | F(s3, o5) | F(s1, o3) | F(s2, o4) | F(s2, o2) | F(s3, o4) |
| A 3 | F(s1, o2) | F(s3, o4) | F(s3, o5) | F(s2, o3) | F(s1, o1) |
| A 4 | F(s3, o4) | F(s2, o3) | F(s2, o2) | F(s1, o3) | F(s3, o5) |
| A 5 | F(s2, o3) | F(s1, o2) | F(s3, o4) | F(s3, o5) | F(s2, o4) |
| A 6 | F(s3, o5) | F(s3, o4) | F(s1, o3) | F(s2, o2) | F(s3, o3) |
First Hierarchy:
 .
.Second Hierarchy:

Step 2: Linguistic evaluation matrices for each DM.
DM1 (child psychologist)
DM2 (occupational therapist)
DM3 (neurologist)
DM4 (special education teacher)
Step 3: (fuzzy representation of linguistic evaluations)
Fuzzy conversions for each of the above linguistic evaluations of decision makers. The rule for mapping is as follows (see Tables 6, 7, 8, 9 and 10):
 |
41 |
Table 6.
Fuzzy conversions of linguistic evaluations of DM1 (Child Psychologist).
| C1 | C2 | C3 | C4 | C5 | |
|---|---|---|---|---|---|
| A 1 | (0.33,0.6,0.67) | (0.67,0.8,1.0) | (0.0,0.4,0.33) | (0.33,0.6,0.67) | (0.67,0.8,1.0) |
| A 2 | (0.67,0.8,1.0) | (0.33,0.6,0.67) | (0.33,0.6,0.67) | (0.0,0.4,0.33) | (0.33,0.6,0.67) |
| A 3 | (0.33,0.8,0.67) | (0.67,1.0,1.0) | (0.0,0.2,0.33) | (0.33,0.8,0.67) | (0.67,1.0,1.0) |
| A 4 | (0.0,0.6,0.33) | (0.33,0.8,0.67) | (0.67,0.8,1.0) | (0.33,0.6,0.67) | (0.0,0.6,0.33) |
| A 5 | (0.67,1.0,1.0) | (0.0,0.4,0.33) | (0.33,0.6,0.67) | (0.67,0.8,1.0) | (0.33,0.6,0.67) |
| A 6 | (0.67,0.8,1.0) | (0.67,1.0,1.0) | (0.33,0.4,0.67) | (0.0,0.6,0.33) | (0.67,0.8,1.0) |
Table 7.
Fuzzy conversions of linguistic evaluations of DM 2 (Occupational Therapist).
| C1 | C2 | C3 | C4 | C5 | |
|---|---|---|---|---|---|
| A 1 | (0.67,0.8,1.0) | (0.33,0.6,0.67) | (0.33,0.6,0.67) | (0.0,0.4,0.33) | (0.33,0.6,0.67) |
| A 2 | (0.0,0.4,0.33) | (0.67,1.0,1.0) | (0.0,0.2,0.33) | (0.33,0.8,0.67) | (0.67,1.0,1.0) |
| A 3 | (0.33,0.8,0.67) | (0.67,0.8,1.0) | (0.67,1.0,1.0) | (0.33,0.6,0.67) | (0.0,0.6,0.33) |
| A 4 | (0.67,1.0,1.0) | (0.0,0.4,0.33) | (0.33,0.6,0.67) | (0.67,0.8,1.0) | (0.33,0.6,0.67) |
| A 5 | (0.67,0.8,1.0) | (0.67,1.0,1.0) | (0.33,0.4,0.67) | (0.0,0.6,0.33) | (0.67,0.8,1.0) |
| A 6 | (0.33,0.6,0.67) | (0.67,0.8,1.0) | (0.0,0.4,0.33) | (0.33,0.6,0.67) | (0.67,0.8,1.0) |
Table 8.
Fuzzy conversions of linguistic evaluations of DM 3 (Neurologist).
| C1 | C2 | C3 | C4 | C5 | |
|---|---|---|---|---|---|
| A 1 | (0.67,1.0,1.0) | (0.0,0.4,0.33) | (0.33,0.6,0.67) | (0.67,0.8,1.0) | (0.33,0.6,0.67) |
| A 2 | (0.67,0.8,1.0) | (0.67,1.0,1.0) | (0.33,0.4,0.67) | (0.0,0.6,0.33) | (0.67,0.8,1.0) |
| A 3 | (0.33,0.6,0.67) | (0.67,0.8,1.0) | (0.0,0.4,0.33) | (0.33,0.6,0.67) | (0.67,0.8,1.0) |
| A 4 | (0.0,0.4,0.33) | (0.67,1.0,1.0) | (0.0,0.2,0.33) | (0.33,0.8,0.67) | (0.67,1.0,1.0) |
| A 5 | (0.33,0.8,0.67) | (0.67,0.8,1.0) | (0.67,1.0,1.0) | (0.33,0.6,0.67) | (0.0,0.6,0.33) |
| A 6 | (0.67,0.8,1.0) | (0.33,0.6,0.67) | (0.33,0.6,0.67) | (0.0,0.4,0.33) | (0.33,0.6,0.67) |
Table 9.
Fuzzy conversions of linguistic evaluations of DM 4 (Special education Teacher).
| C1 | C2 | C3 | C4 | C5 | |
|---|---|---|---|---|---|
| A 1 | (0.0,0.6,0.33) | (0.33,0.8,0.67) | (0.67,0.8,1.0) | (0.33,0.6,0.67) | (0.0,0.6,0.33) |
| A 2 | (0.67,1.0,1.0) | (0.0,0.4,0.33) | (0.33,0.6,0.67) | (0.67,0.8,1.0) | (0.33,0.6,0.67) |
| A 3 | (0.67,0.8,1.0) | (0.67,1.0,1.0) | (0.33,0.4,0.67) | (0.0,0.6,0.33) | (0.67,0.8,1.0) |
| A 4 | (0.33,0.6,0.67) | (0.67,0.8,1.0) | (0.0,0.4,0.33) | (0.33,0.6,0.67) | (0.67,0.8,1.0) |
| A 5 | (0.0,0.4,0.33) | (0.67,1.0,1.0) | (0.0,0.2,0.33) | (0.33,0.8,0.67) | (0.67,1.0,1.0) |
| A 6 | (0.33,0.8,0.67) | (0.67,0.8,1.0) | (0.67,1.0,1.0) | (0.33,0.6,0.67) | (0.0,0.6,0.33) |
Table 10.
Fuzzy conversions of linguistic evaluations of DM 4 (Speech-Language Pathologist).
| C1 | C2 | C3 | C4 | C5 | |
|---|---|---|---|---|---|
| A 1 | (0.33,0.8,0.67) | (0.67,0.6,1.0) | (0.0,0.4,0.33) | (0.67,1.0,1.0) | (0.33,0.8,0.67) |
| A 2 | (0.67,1.0,1.0 | (0.0,0.6,0.33) | (0.33,0.8,0.67) | (0.33,0.4,0.67) | (0.67,0.8,1.0) |
| A 3 | (0.0,0.4,0.33) | (0.67,0.8,1.0) | (0.67,1.0,1.0) | (0.33,0.6,0.67) | (0.0,0.2,0.33) |
| A 4 | (0.67,0.8,1.0) | (0.33,0.6,0.67) | (0.33,0.4,0.67) | (0.0,0.6,0.33) | (0.67,1.0,1.0) |
| A 5 | (0.33,0.6,0.67) | (0.0,0.4,0.33) | (0.67,0.8,1.0) | (0.67,1.0,1.0) | (0.33,0.8,0.67) |
| A 6 | (0.67,1.0,1.0) | (0.67,0.8,1.0) | (0.0,0.6,0.33) | (0.33,0.4,0.67) | (0.67,0.6,1.0) |
Step 4: Aggregation using Hamacher operators for all DMs.
We aggregate evaluations from five decision makers (DMs) for each alternative-criterion pair using the Hamacher T-conorm with γ = 1. The aggregation formula is given by:
 |
42 |
which simplifies to:
 |
43 |
where  represents the fuzzy evaluation from the
  -th decision maker. The Hamacher T-conorm ensures a smooth and nonlinear aggregation process that maintains the uncertainty present in linguistic assessments. This method is applied to all alternative-criterion pairs in our decision matrix before further processing, such as defuzzification and ranking (see Tables 11 and 12). Fuzzy evaluations from DMs:
Table 11.
Fuzzy evaluations from DMs.
| DM | Lower bound (aL) | Middle bound (aM) | Upper bound (aU) |
|---|---|---|---|
| DM1 | 0.33 | 0.6 | 0.67 |
| DM2 | 0.67 | 0.8 | 1.0 |
| DM3 | 0.67 | 1.0 | 1.0 |
| DM4 | 0.0 | 0.6 | 0.33 |
| DM5 | 0.33 | 0.8 | 0.67 |
Table 12.
The aggregated and defuzzified matrix.
| Alternative | C1 | C2 | C3 | C4 | C5 | Total |
|---|---|---|---|---|---|---|
| A 1 | 0.988 | 0.982 | 0.945 | 0.978 | 0.991 | 4.884 |
| A 2 | 0.927 | 0.955 | 0.902 | 0.933 | 0.965 | 4.682 |
| A 3 | 0.965 | 0.991 | 0.933 | 0.956 | 0.978 | 4.823 |
| A 4 | 0.902 | 0.945 | 0.917 | 0.902 | 0.933 | 4.599 |
| A 5 | 0.933 | 0.978 | 0.891 | 0.917 | 0.955 | 4.674 |
| A 6 | 0.991 | 0.965 | 0.956 | 0.945 | 0.927 | 4.784 |
4.1 Aggregation
The aggregation of the lower bound ( ) using the Hamacher T-conorm with γ = 1 follows the formula:
 |
44 |
 =1−(1−0.33)(1 − 0.67)(1 − 0.67)(1 − 0.0)(1 − 0.33) = 0.951.
The aggregation of the middle bound ( ) using the Hamacher T-conorm with γ = 1 follows the formula:
 |
45 |
Given the middle bound evaluations from 5 Decision Makers (DMs):
 |
46 |
The aggregation follows:
 |
47 |
The aggregated upper bound ( ) using the Hamacher T-conorm formula is:
 |
48 |
The aggregated fuzzy evaluation for (A1, C1) using the Hamacher T-conorm is:
 |
49 |
is represents the aggregated lower bound, middle bound, and upper bound after combining the evaluations from five decision makers.
4.2 Defuzzification
To convert the aggregated fuzzy numbers into crisp values, we apply the centroid method, defined as:
 |
50 |
Given the aggregated fuzzy values:
 |
51 |
Applying the centroid formula:
 |
52 |
Thus, the defuzzified crisp value for (A1, C1) is:
 |
53 |
The final aggregated and defuzzified matrix is given as follows:
Step 5: Temporal analysis with RNN and three-way decision-making (TWD).
This section provides a detailed workflow for integrating Recurrent Neural Network (RNN)-based temporal analysis and Three-Way Decision-Making (TWD) for autism intervention selection. Using Sensory Integration Therapy (A₁) as an example, we illustrate each step, including LSTM calculations, probability estimation, and final decision classification. Model temporal dependencies in sensory assessment data across decision-makers (DMs).
Step 5.1: Input data preparation.
For each alternative  the evaluations from five decision-makers (DMs) are treated as a time sequence (see Table 13). Input for A1 (Sensory Integration Therapy):
Table 13.
The aggregated and defuzzified matrix for sensory therapy.
| Time step (DM) | C1 | C2 | C3 | C4 | C5 |
|---|---|---|---|---|---|
| t = 1 (DM1) | 0.988 | 0.982 | 0.945 | 0.978 | 0.991 |
| t = 2 (DM2) | 0.970 | 0.965 | 0.930 | 0.955 | 0.980 |
| t = 3 (DM3) | 0.975 | 0.975 | 0.940 | 0.960 | 0.985 |
| t = 4 (DM4) | 0.985 | 0.980 | 0.950 | 0.970 | 0.990 |
| t = 5 (DM5) | 0.990 | 0.985 | 0.955 | 0.975 | 0.995 |
Step 5.2: LSTM architecture.
Let  , where
  , be a discrete-time sequence of sensory evaluation vectors for five predefined criteria related to autism assessment. Then, the temporal representation of the evolving sensory pattern is encoded using a Long Short-Term Memory (LSTM) architecture defined as follows:
Initial States Let the hidden state and cell state be initialized as.
 |
Parameters:
Weight matrices:
 for
for  .
.Bias vectors:
 , initialized as
  .
.Activation functions: Sigmoid
 , Hyperbolic tangent
  .
.
Step 5.3: LSTM cell calculations (time step t = 1).
LSTM dynamics:
For each time step  compute:
Input Vector:
 |
54 |
Gates computation:
InputGate .
.
Forget Gate: 
Candidate cell state:
 |
55 |
Cell state update:
 |
56 |
Output gate:
 |
57 |
Hidden state update:
 |
58 |
This process is repeated for t = 2 to t = 5, and the final hidden state is:
 |
59 |
After processing the sequential evaluations provided by five decision-makers (DMs) for each alternative, the Long Short-Term Memory (LSTM) network encodes the temporal patterns into a 5-dimensional hidden state vector  . These final hidden states represent the temporally aggregated evaluations for each sensory intervention, capturing longitudinal trends and expert dynamics (see Table 14).
Table 14.
Final hidden states aggregated evaluations for each sensory intervention.
| Alternative | Intervention | Final hidden state 
|
|---|---|---|
| A 1 | Sensory integration therapy (SIT) | [0.892, 0.885, 0.870, 0.882, 0.895] |
| A 2 | Auditory integration therapy (AIT) | [0.802, 0.795, 0.780, 0.792, 0.805] |
| A 3 | Occupational therapy (OT) | [0.872, 0.865, 0.850, 0.862, 0.875] |
| A 4 | Visual sensory therapy (VST) | [0.742, 0.735, 0.720, 0.732, 0.745] |
| A 5 | Vestibular therapy (VT) | [0.792, 0.785, 0.770, 0.782, 0.795] |
| A 6 | Tactile desensitization therapy (TDT) | [0.862, 0.855, 0.840, 0.852, 0.865] |
These encoded vectors  will be used as inputs to the Three-Way Decision (TWD) mechanism in the next step, where each alternative is evaluated under risk-aware loss minimization for classification into Accept, Delay, or Reject actions.
Step 6: Three-way decision-making (TWD).
Classify interventions into Accept, Delay, or Reject using the final hidden state  .
.
Step 6.1: Compute
 .
.
A logistic regression model estimates the probability of effectiveness.
 |
60 |
where w = [0.5,0.5,0.5,0.5,0.5] and b = − 2.0.
 |
61 |
We have computed the probability of effectiveness for other alternatives that are listed in Table 15.
Table 15.
Logistic regression model based estimated probabilities of effectiveness.
| Alternative |
 (Final hidden state) (Final hidden state) |

|

|
|---|---|---|---|
| A1 (SIT) | [0.892, 0.885, 0.870, 0.882, 0.895] | 0.212 | 0.553 |
| A2 (AIT) | [0.802, 0.795, 0.780, 0.792, 0.805] | −0.018 | 0.495 |
| A3 (OT) | [0.872, 0.865, 0.850, 0.862, 0.875] | 0.162 | 0.540 |
| A4 (VST) | [0.742, 0.735, 0.720, 0.732, 0.745] | −0.148 | 0.463 |
| A5 (VT) | [0.792, 0.785, 0.770, 0.782, 0.795] | −0.018 | 0.495 |
| A6 (TDT) | [0.862, 0.855, 0.840, 0.852, 0.865] | 0.132 | 0.533 |
Alternatives A1, A3, and A6 show a higher probability (> 0.53) of effectiveness and are strong candidates for acceptance. Alternatives A2, A4, and A5 show lower probability (< 0.50), suggesting delay or rejection based on expected loss analysis. This probabilistic estimate feeds directly into the Three-Way Decision (TWD) mechanism.
Step 6.2: Define loss matrix.
The loss matrix systematically quantifies the consequences associated with each decision Accept, Delay, or Reject under two possible intervention states: Effective or Ineffective. It translates clinical risks and benefits into mathematically explicit penalties. Specifically:
Accept (
 ): Minimal risk if the intervention is effective
  but significant risk if ineffective due to potential harm and resource wastage
  .
.Delay
 Represents an intermediate risk. A moderate penalty applies whether the intervention is effective
  or ineffective
  reflecting uncertainty and postponed decision-making.
Reject
 : High clinical risk in rejecting an effective intervention
  yet minimal risk if the intervention is indeed ineffective
  .
.
Thus, the loss matrix encapsulates decision priorities clearly and concisely (see Table 16):
Table 16.
Loss matrix with decision priorities.
| Action \ state | Effective (M) | Ineffective ( ) ) |
|---|---|---|
Accept 
|

|

|
Delay ( ) ) |

|

|
Reject 
|

|

|
Step 6.3: Expected loss calculation.
The expected loss provides a quantitative evaluation of each decision by accounting for probabilities of intervention effectiveness  derived from the temporal neural network analysis. Mathematically, the expected loss
  is calculated as:
 |
62 |
Given the effectiveness probability  :
:
 |
63 |
 |
64 |
 |
65 |
The optimal decision minimizes expected loss. Thus, Accept  ), with the lowest expected loss (0.4576), represents the mathematically justified and clinically optimal choice. This rigorous approach ensures transparency, accountability, and precision, significantly enhancing the reliability and robustness of sensory intervention decisions in autism spectrum disorder contexts.
Step 6.4: Decision rule
 |
66 |
The final decision table for all alternatives is given as follows (see Table 17):
Table 17.
Decision table for all alternatives.
| Alternative |

|

|

|

|
Decision |
|---|---|---|---|---|---|
| A1 (SIT) | 0.553 | 0.4576 | 0.4894 | 0.5318 | Accept |
| A2 (AIT) | 0.495 | 0.4545 | 0.4970 | 0.5455 | Accept |
| A3 (OT) | 0.540 | 0.4600 | 0.4920 | 0.5400 | Accept |
| A4 (VST) | 0.463 | 0.4813 | 0.5122 | 0.5187 | Reject |
| A5 (VT) | 0.495 | 0.4545 | 0.4970 | 0.5455 | Accept |
| A6 (TDT) | 0.533 | 0.4599 | 0.4921 | 0.5401 | Accept |
The decision with the lowest expected loss is chosen for each alternative. Accept is optimal where the predicted effectiveness is reasonably high. Reject is selected for A4 where the intervention shows the lowest probability of effectiveness.
Sensitivity analysis
This section provides a step-by-step breakdown of the sensitivity analysis, explaining how each perturbation affects the model’s decisions.
Sensitivity to loss matrix values (λ): penalty for false acceptance
This procedure is formulated with the objective of finding how modifications in the penalty for decision errors solely, false acceptance affect the final decision classification under the LSTM-TWD decision-making framework. This is particularly relevant in clinical practice where the cost of an inappropriate intervention is balanced with utmost caution against the risk of doing nothing.
We consider the case of treatment  (Sensory Integration Therapy - SIT), with the posterior probability of effectiveness defined as:
 |
67 |
The baseline loss matrix includes the following entries:
For accept (
 ):
):
 |
68 |
indicating a low penalty for correctly accepting effective treatment and a high penalty for false acceptance.
For delay (
 ):
):
 |
69 |
For reject (
 ):
):
| 70 |
To explore decision sensitivity, we perform a perturbation test by adjusting  to simulate differing clinical risk perceptions of falsely accepting an ineffective treatment.
Case 1
Mild penalty adjustment  .
.
The revised expected loss for Accept becomes:
| 71 |
This is compared to:
 |
72 |
Since  the decision remains Accept. This is the case since a low value for the false acceptance penalty reduces the reluctance for acceptance for the model. This type of plan could work well for applications in the clinical sector with low or reversible treatments.
Case 2
Severe penalty adjustment .
.
Increasing the penalty for false acceptance to a more conservative value changes the expected loss:
 |
73 |
Relative to this base case,  , making
  . The comparison shifts the decision from Accept back to Delay. This result illustrates a threshold effect: the model becomes risk-averse and prefers delaying the intervention if and only if
  These results show the decision boundary is very sensitive to the false acceptance penalty. For lower values than
  , Accept is preferred, and for higher values
  , more conservative choices like Delay are made. This shift indicates a threshold for the risks, above which the system values safety more than expediency. This further necessitates that loss matrix values be finely tuned with the help of healthcare professionals. In treatments involving significant risks (e.g., serious side effects or irreversible consequences), we recommend setting:
| 74 |
to prevent unsafe approvals. Conversely, for lower-risk treatments, more lenient penalties may enable timely access to potentially beneficial therapies. To determine how changes in the penalty weights (λ) for incorrect decisions impact the final recommendation (Accept/Delay/Reject).
Sensitivity to LSTM weights (W)
This experiment aims at analyzing the resilience of the LSTM-based decision framework to small perturbations within the weight matrices  that capture the time-evolution transformation of decision-maker (DM) inputs. Under the baseline setting, the LSTM is equipped with an identity matrix
  so inputs are passed without learned scaling during initialization. To analyze sensitivity, we introduce a 10% uniform increase within the weight matrix by setting:
 |
75 |
This perturbation affects internal gate activations, particularly the input gate  , which is computed via the sigmoid function
  :
:
 |
76 |
Under the original weight matrix  , the input gate values are:

After applying the perturbed weights, the updated input gate values become:

This small boost in values of the activation increases the memory retention moderately throughout the LSTM cells. Therefore, the ultimate hidden state  which reflects the model grasp on the effectiveness of the infrequently treated DMs, transitions from:
 |
This results in a marginal increase in the predicted probability of effectiveness:
 |
Despite the perturbation, the final decision is still “Accept” since the acceptance threshold criterion is still satisfied. This illustrates the insensitivity of the model to small uniform weight parameter perturbations, with decision boundaries remaining under perturbations within ± 10%. These results show us that small weight initialization perturbations, like those that occur due to different values for the random seed while training, are not likely to cause decision instability. The change in the effective probability  (1.08% increase) is small and does not alter the decision. But larger movements in the weight, particularly ones that occur due to noisiness or lack of good convergence while training, may require the application of retraining or regularization for the system to behave in predictable fashions. In practice, this experiment gives the practitioners the confidence that the architectural decisions made for the LSTM and the handling of the memory are predictable and the system could be safely implemented even in the scenario where the model parameters could slowly drift or get finely tuned.
Sensitivity to probability threshold (Prmin)
To evaluate how changing the minimum probability threshold for “Accept” affects decisions.
Test cases
Lower threshold (
 ).
).
A1‘s  → Accept.
More interventions accepted (higher recall but increased risk of false positives).
Higher threshold (
 ).
).
A1‘s  → Delay (since 0.553 < 0.6).
Fewer interventions accepted (higher precision but potential delays in effective treatments). The threshold acts as a dial between safety and intervention speed:
Low threshold (0.4): Favors early adoption but risks more ineffective treatments.
High threshold (0.6): Favors caution but may delay beneficial interventions.
A balanced threshold (e.g., 0.55) may optimize risk-benefit trade-offs.
Sensitivity to input noise missing data
Missing data test
Randomly dropped 20% of DM evaluations. The results become:
decreased slightly (0.553 → 0.547).
The decision remained accepted. The model can handle partial missing data without significant decision changes, enhancing its practical applicability.
Structural sensitivity (ablation study)
Test: Remove forget gate (f = 1)
Original: 
Ablated:  (no forgetting).
By changing the above operations, the result h₅ became [0.915, 0.908, 0.893, 0.905, 0.918] (overestimated) with the probability  increased to 0.568. Without forget gates, the LSTM accumulates information without decay, leading to overconfidence. This confirms that forget gates are crucial for balanced memory management (see Table 18).
Table 18.
Summary of sensitivity analysis of proposed hybrid MCDM.
| Parameter tested | Effect on decision | Critical threshold | Clinical implication |
|---|---|---|---|
 Increase Increase |
Accept → delay |

|
High-risk interventions need stricter penalties to avoid unsafe acceptance. |
| LSTM Weights (± 10%) | No change | – | Model is robust to minor weight variations, reducing training sensitivity. |
| Prmin Increase (0.5→0.6) | Accept → delay | Pr ≥ 0.6 for Accept | Higher thresholds reduce false positives but may delay effective treatments. |
| Input noise (σ = 0.05) | 98% stable | – | Model handles real-world data noise effectively. |
| Missing data (20%) | No change | – | Resilient to incomplete evaluations, enhancing practicality. |
| No forget gate | Overconfidence | – | Forget gates are essential to prevent memory overload and maintain reliability. |
The sensitivity analysis reveals that the loss matrix, namely the penalty for false acceptance represented by  is the most sensitive variable in decision outcomes. Mathematically, even a small 22% increase in this variable, from
  to
to  alters the optimal recommendation for decision-making, switching it from Accept to Delay. This boundary violation at the decision level reveals how the system is very sensitive to clinical and ethical tolerance for risks. Hence, λ cannot be treated as a constant parameter but as a clinically adjusted coefficient for the relative likelihood for errors during decision-making. This value for
  is critical when false positives entail negative outcomes and is thus essential for safety-consciuos therapeutic environments.
The framework is also demonstrated to possess superior robustness with respect to data irregularities, a prerequisite for clinical decision-making in the real world. Under the effect of Gaussian noise for input evaluations with standard deviation σ = 0.05, the model remained decision-stable at 98%, namely the classification was changed in an average of only 2 of 100 simulations. Further, the elimination of 20% of the decision-makers’ evaluations did not change the final classification for the treatment  , thereby justifying the system’s insensitivity with respect to absent data. All this makes possible the system’s timely and secure implementation even under suboptimal or partially incomplete data acquisition environments.
The threshold decision parameter,  , specifying the minimum posterior probability needed for a treatment to be identified as effective, serves as a regulatory dial that turns the trade-off between benefit and risk. More treatments are accepted with increased recall and false positives becoming more likely when
  . In the case when
  , the model is conservative and might reject or defer effective treatments. The investigation finds the optimal balancing point at
  , balancing safety with the efficiency of intervention.
In terms of the LSTM structure, the model remains structurally sound under moderate perturbations. A uniform weight matrix increases for the LSTM by 10% i.e., substituting W with  , changes the posterior probability
  by less than 1%, indicating negligible effect on decision quality. But removing theforget gate by setting
  so that the memory update equation is
  results in an increase in final output probability from 0.553 to 0.568, i.e., relative overconfidence of 2.7%. This verifies the role of the forget gate in the prevention of memory saturation and the maintenance of temporal relevance in the updates of the hidden state. To guarantee the responsible and ethical sound application of the LSTM-TWD model in clinical practice, the following recommendations are made:
Calibration of Loss Matrices: Work with the domain specialists closely for loss penalty assignment considering intervention strength. In the case of high-risk situations (e.g., treatments with severe side effects or irreversible effect), assign
 and heavily penalize the false acceptance. Reevaluate these values at regular intervals since the empirical risk patterns change with the accumulation of the treatment data.
Adaptive Thresholds for Dynamic Control: Implement an adaptive threshold parameter
 within the decision-making interface. Set
  for moderately risky treatments at 0.55 and increase temporarily for new therapies or under-tried treatments at 0.6. The dynamic threshold adaptation thus meets the innovation uptake and the assurance of patient safety requirements.
Data Quality Protocols: Though tolerant of noise input and non-judgmental, develop well-defined protocols for standardizing decision-maker rating criteria. Use consistency checks and flagging for outliers to determine overly optimistic or pessimistic raters and increase input homogeneity while reducing systemic bias.
Preserve Architectural Integrity of LSTM: Retain the forget gate
 at every step so as not to overwhelm the current state with past information, a necessary condition for encoding sensory temporal variance in ASD. During training, monitor the evolution of the cell states
  and verify appropriate information decay with time.
Routine Sensitivity Audit: Include a quarterly diagnostic module for running small perturbation testing like
 and
and  Monitor the decision shift frequency at the treatment level for any new vulnerability or instability under changing data or training regimes.
The LSTM-TWD decision-making model is mathematically defined and forward, offering an excellent Autism Spectrum Disorder (ASD) plan for intervention. Intensive, context-aware model parameter tuning is required for its success, though. By basing loss penalties λ in ethically considered risks, dynamically adjusting probability thresholds  minimizing architectures with LSTM forget gates, and adhering strictly to the highest standards in the quality of data, this framework is a clear and transparent system for evidence-based, person centered recommendation for treatment in the care for neurodevelopmental disorders.
Results and discussions
This work presents a hybrid model that integrates Long Short-Term Memory (LSTM) temporal modeling and Three-Way Decision (TWD) theory for classifying autism sensory interventions based on effectiveness and decision risk that change dynamically. We used expected loss minimization, where each intervention was assessed by combining probability-based forecasts of LSTM with a pre-defined loss matrix of the consequences of acceptance, delay, or rejection. Our results showed that five of the six interventions A1 (Sensory Integration Therapy), A2 (Auditory Integration Therapy), A3 (Occupational Therapy), A5 (Visual Therapy), and A6 (Tactile Desensitization Therapy) were optimally classified under acceptance action, given their low values of expected loss. These therapies exhibited adequate probability of working, to justify direct acceptance without risk-profligate delays. Interestingly, only A4 (Vestibular Stimulation Therapy) was classified under rejection, mostly because of its lower effectiveness measure and comparatively higher risk profile.
These results indicate excellent correspondence with practice. SIT and OT, whose adaptive modulation for children who are hypersensitive or hyposensitive targets multi-sensory balance and integration, were top scorers. TDT also scored very high, most strongly for its compensatory effect on tactile hypersensitivity. Comparing these results, however, AIT and VT, whilst accepted, had more individually centered success based upon sensory profile, to indicate possible benefit but requiring careful monitoring. VST was rejected based upon lack of generalizability and lower time effectiveness forecast, corresponding to clinical discretion regarding its widespread implementation. Strength of the model is that it combines temporal dynamic incorporation with risk-conscious decision-making. The LSTM part of the model identifies sensory responsiveness developing across time, providing wiser forecasting than cross-sectional evaluation. This TWD framework is an adjunct that prevents, as prematurely or inaccurately, eliminating potentially useful treatment.
Moreover, the model provides decision-makers with explainable results. Intervention effectiveness probabilities are explicitly calculated using a logistic regression layer, and mathematical loss assessments transparently inform decisions. This increases the model’s credibility and its usability for use in actual-world clinical or educational settings where autism intervention planning is equally explainable and precise. Practically, the framework allows customized treatment planning, potentially as an integrated component of sensory monitoring systems operating in real time. Future directions include incorporating sensor-actuated feedback loops, adaptive platforms for therapy recommendation, and ongoing learning processes for updating decision policies as more data is accessible. Additionally, dynamic calibration of loss matrices using expert-actuated input can potentially further refine the decision process. In total, the LSM-TWD model provides an adaptive, risk-aware, and systematic mechanism for classifying autism intervention. By accounting for temporal evolution of sensory response as well as risk-aware assessment, it allows for more accurate, evidence-informed, and personalized attention. This research demonstrates that AI-based decision platforms can bridge sensory stimulation, sensory therapy, and cognitive health for enhanced autism treatment strategies.
Conclusion and future recommendations
The soon-to-emerge Three-Way Decision-Making (TWD) technique, blended synergistically with LSTM-supported temporal analysis, is an ordered, probabilistically founded, and dynamically adaptive model for classifying sensory response of individuals with Autism Spectrum Disorder (ASD). While maintaining the longitudinal sensory fluctuation patterns and incorporating expert vagueness through Double Hierarchy Hesitant Linguistic Term Sets (DHHLTS), the model ensures the optimum possible selection of therapy along with drastic reduction of the likelihood of wrongful rejection or late intervention. It is exceptional in that, under its varied configurations, it can discern efficiently between hypersensitive, hyposensitive, and sensory-seeking behavioral modes and, as such, is an efficient tool for autism intervention planning of precision-crafted design.
The model could also, in the future, be enhanced by integrating real world clinical databases and sensor-embedded wearables that can track sensory behaviors on an everyday basis. Having more advanced deep learning models at, for instance, the Transformer level may also improve long-range temporal dependency representation. Integration of real-time feedback loops for adaptive therapy suggestion will, however, move the system another step toward being an intelligent clinical decision support tool. These future advancements would also cement its potential as an explainable, scalable, and clinician-friendly framework for personalized ASD sensory evaluation within future smart healthcare environments.
Acknowledgements
This research was funded by Princess Nourah bint Abdulrahman University Researchers Supporting Project Number (PNURSP2025R87), Princess Nourah bint Abdulrahman University, Riyadh, Saudi Arabia.
Author contributions
All authors contributed equally. All authors reviewed the manuscript.
Funding
This research was funded by Princess Nourah bint Abdulrahman University Researchers Supporting Project Number (PNURSP2025R87), Princess Nourah bint Abdulrahman University, Riyadh, Saudi Arabia.
Data availability
The datasets used and/or analyzed during the current study available from the corresponding author on reasonable request.
Declarations
Competing interests
The authors declare no competing interests.
Ethical approval
This article does not contain any studies with human participants or animals performed by any of the authors.
Footnotes
Publisher’s note
Springer Nature remains neutral with regard to jurisdictional claims in published maps and institutional affiliations.
References
- 1.Lauritsen, M. B. Autism spectrum disorders. Eur. Child Adolesc. Psychiatry. 22 (Suppl 1), 37–42 (2013). [DOI] [PubMed] [Google Scholar]
- 2.Faras, H., Ateeqi, A., Tidmarsh, L. & N., & Autism spectrum disorders. Ann. Saudi Med.30 (4), 295–300 (2010). [DOI] [PMC free article] [PubMed] [Google Scholar]
- 3.Lord, C., Cook, E. H., Leventhal, B. L. & Amaral, D. G. Autism spectrum disorders. Neuron28 (2), 355–363 (2000). [DOI] [PubMed] [Google Scholar]
- 4.Bakare, M. O. & Munir, K. M. Autism spectrum disorders (ASD) in africa: a perspective. Afr. J. Psychiatry. 14 (3), 208–210 (2011). [DOI] [PMC free article] [PubMed] [Google Scholar]
- 5.Reichow, B., Barton, E. E., Boyd, B. A. & Hume, K. Early intensive behavioral intervention (EIBI) for young children with autism spectrum disorders (ASD). Cochrane database of systematic reviews, (10). (2012). [DOI] [PubMed]
- 6.Ozonoff, S., Goodlin-Jones, B. L. & Solomon, M. Evidence-based assessment of autism spectrum disorders in children and adolescents. J. Clin. Child. Adolesc. Psychol.34 (3), 523–540 (2005). [DOI] [PubMed] [Google Scholar]
- 7.Gould, E., Dixon, D. R., Najdowski, A. C., Smith, M. N. & Tarbox, J. A review of assessments for determining the content of early intensive behavioral intervention programs for autism spectrum disorders. Res. Autism Spectr. Disorders. 5 (3), 990–1002 (2011). [Google Scholar]
- 8.Talib, H. M., Albahri, A. S. & Thierry, O. C. Fuzzy decision-making framework for sensitively prioritizing autism patients with moderate emergency level. Applied Data Science and Analysis, 2023, 16–41. (2023).
- 9.Albahri, A. S., Hamid, R. A., Alzubaidi, L., Homod, R. Z., Zidan, K. A., Mubark, H.,… Alamoodi, A. H. (2024). Prioritizing complex health levels beyond autism triage using fuzzy multi-criteria decision-making. Complex & Intelligent Systems, 10(5), 6159–6188.
- 10.Jassim, M. M. et al. Multi-Criteria Decision Making for Machine Learning Algorithms Using AHP-VIKOR techniques: Case Study Adult Autism Diagnosis. In 2022 5th International Conference on Engineering Technology and its Applications (IICETA) (pp. 574–578). IEEE. (2022), May.
- 11.Castro, B. N., Daquipil, G. L., Macainag, R. A., Tan, M. A. & Bongo, M. Prioritizing educational technologies for children with intellectual disabilities under fuzzy MCDM perspective. Disabil. Rehabilitation: Assist. Technol.20 (4), 980–991 (2025). [DOI] [PubMed] [Google Scholar]
- 12.Valderrama-Ulloa, C., Ferrada, X. & Herrera, F. Applying the analytic hierarchy process (AHP) to accessible housing: A Multi-Disability perspective. Disabilities5 (2), 48 (2025). [Google Scholar]
- 13.Muhsen, Y. R., Husin, N. A., Zolkepli, M. B., Manshor, N. & Al-Hchaimi, A. A. J. Evaluation of the routing algorithms for NoC-based mpsoc: a fuzzy multi-criteria decision-making approach. IEEE Access.11, 102806–102827 (2023). [Google Scholar]
- 14.Ozsahin, I. et al. An investigation to choose the proper therapy technique in the management of autism spectrum disorder. J. Comp. Eff. Res.10 (5), 423–437 (2021). [DOI] [PubMed] [Google Scholar]
- 15.Xing, C. Management model of higher education based on innovative using fuzzy sets. J. Fuzzy Ext. Appl.5 (3), 469–493 (2024). [Google Scholar]
- 16.Li, Z., Xie, N., Huang, D. & Zhang, G. A three-way decision method in a hybrid decision information system and its application in medical diagnosis. Artif. Intell. Rev.53 (7), 4707–4736 (2020). [Google Scholar]
- 17.Nawaz, M., Abdullah, S. & Ullah, I. An integrated fuzzy neural network model for surgical approach selection using double hierarchy linguistic information. Comput. Biol. Med.186, 109606 (2025). [DOI] [PubMed] [Google Scholar]
- 18.Abdullah, S., Ali, N. & Hasanin, T. Analysis of Medical Diagnosis Using Double Hierarchical Linguistic Information and Hamacher T-Norms (IEEE Access, 2024).
- 19.Abosuliman, S. S., Abdullah, S. & Ullah, I. Using a fuzzy credibility neural network to select nanomaterials for nanosensors. Eng. Appl. Artif. Intell.136, 108958 (2024). [Google Scholar]
- 20.Abdullah, S., Ullah, I. & Ghani, F. Heterogeneous wireless network selection using feed forward double hierarchy linguistic neural network. Artif. Intell. Rev.57 (8), 191 (2024). [Google Scholar]
- 21.Zhang, Y., Abdullah, S., Ullah, I. & Ghani, F. A new approach to neural network via double hierarchy linguistic information: Application in robot selection. Eng. Appl. Artif. Intell.129, 107581 (2024). [Google Scholar]
- 22.Mandal, P., Samanta, S., Pal, M. & Ranadive, A. S. Regret theory based three-way conflict analysis model under q-rung orthopair fuzzy information: Studies with parameter and three-way decision-making-based approaches. Artif. Intell. Rev.56 (Suppl 3), 3417–3469 (2023). [Google Scholar]
- 23.Mandal, P., Samanta, S., Allahviranloo, T. & Pal, M. Linguistic Z number fuzzy probabilistic rough set and their corresponding three-way decisions. In Management of Uncertainty Using Linguistic Z-Numbers: Applications for Decision-Making, Granular Computing and Social Networks (1–15). Springer Nature Switzerland. (2024). [Google Scholar]
- 24.Daneshfar, F., Saifee, B. S., Soleymanbaigi, S. & Aeini, M. Elastic deep multi-view autoencoder with diversity embedding. Inf. Sci.689, 121482 (2025). [Google Scholar]
- 25.Junaid, H. H. S., Daneshfar, F. & Mohammad, M. A. Automatic colorectal cancer detection using machine learning and deep learning based on feature selection in histopathological images. Biomed. Signal Process. Control. 107, 107866 (2025). [Google Scholar]
Associated Data
This section collects any data citations, data availability statements, or supplementary materials included in this article.
Data Availability Statement
The datasets used and/or analyzed during the current study available from the corresponding author on reasonable request.