

Abstract
Voltage-dependent L-type Ca2+ channels play important functional roles in many excitable cells. We present a three-dimensional structure of an L-type Ca2+ channel. Electron cryomicroscopy in conjunction with single-particle processing was used to determine a 30-Å resolution structure of the channel protein. The asymmetrical channel structure consists of two major regions: a heart-shaped region connected at its widest end with a handle-shaped region. A molecular model is proposed for the arrangement of this skeletal muscle L-type Ca2+ channel structure with respect to the sarcoplasmic reticulum Ca2+-release channel, the physical partner of the L-type channel for signal transduction during the excitation-contraction coupling in muscle.
Voltage-gated Ca2+ channels play essential roles in many crucial intracellular processes such as muscle contraction, secretion, synaptic transmission, and gene expression by modulating Ca2+ influx in response to the depolarization of the plasma membrane. The voltage-gated L-type Ca2+ channel from the skeletal muscle binds dihydropyridines and is frequently referred to as the dihydropyridine receptor. This protein is enriched in transverse tubule (t-tubule) membranes where it functions as both a voltage-dependent Ca2+ channel and a voltage sensor to signal the sarcoplasmic reticulum (SR) skeletal muscle ryanodine receptor (RyR1) to open and to initiate muscle contraction (1). Mutations in this protein produce the human diseases malignant hyperthermia and hypokalemic periodic paralysis (2).
The skeletal muscle Ca2+ channel is a hetero-oligomeric protein complex composed of five subunits arranged in a 1:1:1:1:1 stoichiometry: α1, 170 kDa; α2, 150 kDa; δ, 17–25 kDa; β, 52 kDa; and γ, 32 kDa (3–8). A separate gene encodes each subunit with one exception. The δ-subunit arises from proteolysis at the C terminus of the α2/δ primary polypeptide. Although the α1-subunit has been shown to carry the characteristic pharmacological and functional properties of the Ca2+ channel for voltage sensing, ion permeability, and drug binding (for reviews, see refs. 9–11), complete receptor function (including targeting and modulation) requires the presence of all subunits.
Cloning and sequence analysis revealed that the α1-subunit of the voltage-gated Ca2+ channel exhibits a similar transmembrane arrangement with two other voltage-operated ion channels, Na+ and K+ channels. The Na+ and Ca2+ channels each putatively have four homologous domains (12, 13). Each domain consists of six putative transmembrane (TM) segments, with TM4 possessing highly conserved positive charges that are thought to be the voltage sensor. A similar arrangement is found in the K+ channel, except that each domain is in a single subunit of the homotetramer. Recently, the 19-Å resolution structure of the voltage-operated Na+ channel was determined by electron cryomicroscopy to be a bell-shaped structure with a square-shaped cytoplasmic region 135 Å in height, 100 Å in side length, and a putative membrane-spanning domain resembling a half-sphere with a diameter of 65 Å (14). Based on sequence similarity, the voltage-gated ion channels are likely to exhibit a similar three-dimensional (3D) architecture.
Despite intensive research into pharmacological, biochemical, functional, and structural aspects of voltage-dependent Ca2+ channels, the molecular architecture of the channel complex is still unknown. Early studies using electron microscopy of freeze-dried, rotary-shadowed purified Ca2+ channel revealed ellipsoidal particles with dimensions of 160 × 220 Å (15). In the t-tubule of skeletal muscle, the voltage-operated Ca2+ channels are arranged in groups of four, designated as tetrads, which are coupled to every other Ca2+-release channel in the SR (16). This arrangement allows a conformational change of Ca2+ channel to elicit the opening of the Ca2+-release channel. To understand excitation-contraction (E-C) coupling at the molecular level, it will be necessary to obtain 3D information for the voltage-gated Ca2+ channel.
We present the 3D reconstruction of the voltage-gated L-type Ca2+ channel, determined by electron cryomicroscopy and computer image processing. The results from this study provide further structural insights into the molecular mechanisms of E-C coupling in muscle.
Materials and Methods
Materials.
All biochemical reagents used in this study were analytical grade and were purchased from Sigma. Reagents for electrophoresis and molecular weight standards were purchased from Bio-Rad. The mouse monoclonal antibody specific for β-subunit of the skeletal muscle Ca2+ channel was purchased from Becton Dickinson Transduction Laboratories (San Jose, CA); the monoclonal anti-α1 and anti-α2 Ca2+ channel antibodies were purchased from Affinity BioReagents (Golden, CO); the monoclonal anti-γ Ca2+ channel antibody was generated in our laboratory by using purified Ca2+ channel.
Protein Preparation.
Skeletal muscle membranes were prepared from rabbit fast-twitch skeletal muscle, as described in Hawkes et al. (17). Homogeneous preparations of the skeletal muscle Ca2+ channel suitable for studies by electron microscopy were purified by using WGA-Affi-Gel column and DEAE-Trisacryl M ion exchange as described (18) with some modifications to adapt this procedure for structural studies. Protease inhibitors (100 μM PMSF/1 μM aminobenzamidine/1 μM pepstatin A/1 μg/ml leupeptin/1 μg/ml aprotinin) were included in all buffers used throughout the preparations of microsomal membranes and Ca2+ channel. Microsomal membranes (2 mg/ml) were solubilized with 1% digitonin in 50 mM Mops, pH 7.4/185 mM NaCl. After incubation for 45 min at 4°C, insoluble material was removed by centrifugation at 100,000 × g for 30 min, and the supernatant was collected. The solubilized membranes were applied to a 10-ml WGA-Affi-Gel-10 column equilibrated with 0.1% digitonin/20 mM Mops, pH 7.4/50 mM NaCl. The detergent concentration in all subsequent buffers was 0.1% digitonin. The column was washed intensively with 20 mM Mops, pH 7.4/0.1% digitonin/50 mM NaCl to remove unbound material. The Ca2+ channel was eluted with 30 ml of 200 mM N-acetylglucosamine (GlcNAc)/20 mM Mops, pH 7.4/0.1% digitonin/50 mM NaCl. The GlcNAc-eluted fractions of the Ca2+ channel were pooled and loaded onto a DEAE-Trisacryl M column equilibrated with 20 mM Mops, pH 7.4/0.1% digitonin/20 mM NaCl. The DEAE-Trisacryl column was eluted with a step gradient 50 mM, 100 mM, 200 mM, 300 mM NaCl in 20 mM Mops, pH 7.4/0.1% digitonin. The column fractions were analyzed by SDS/PAGE. The purified protein was stored in 30-μl aliquots at −80°C in buffer containing at least 5% sucrose and thawed only once for specimen preparation for electron microscopy.
SDS/PAGE, Immunoblotting, and Protein Quantification.
SDS/PAGE was performed with 10% gel according to the method of Laemmli (19) under reducing (125 mM DTT in sample buffer) and nonreducing conditions (10 mM N-ethylmaleimide in sample buffer without DTT). Gels were either stained with Coomassie blue R-250 or analyzed by immunoblotting. Linear gradient gels (5–20%) were Coomassie-stained and analyzed with Bio-Rad Fluoro-S MultiImager for subunit composition.
For immunoblots, proteins were transferred to 0.45 μm Immunobilion-P membranes (Millipore) at 20 V for 15–18 h at 4°C in transfer buffer [10% (vol/vol) methanol/10 mM CAPS, pH 11.0]. Blots were treated with subunit-specific antibodies and were developed with alkaline phosphate-conjugated goat anti-mouse IgG antibodies (Kirkegaard & Perry Laboratories).
Protein concentrations were determined by the method of Lowry et al. (20) with BSA as a standard.
Specimen Preparation for Electron Microscopy.
Negatively stained specimens were prepared by using a standard single droplet procedure on thin continuous carbon film (21). The negative stain was 1% aqueous uranyl acetate.
Ice-embedded specimens were prepared as described (22): 5 μl of the purified Ca2+ channel (0.1–0.2 mg/ml) was applied to a copper grid with a holey carbon film covered with a continuous carbon film, blotted with filter paper, and rapidly plunged into liquid ethane as described by Dubochet et al. (24).
Electron Microscopy.
Electron microscopy of frozen-hydrated samples was performed by using a JEOL1200 electron microscope operated at 100 kV. The vitrified specimen was transferred under liquid nitrogen to a Gatan cryo-holder by using a Gatan cryotransfer system and observed at −164°C. Low electron-dose (≈15 e/Å; ref. 2) images were recorded on Kodak SO-163 film at a nominal magnification of ×50,000. Use of a 100 kV instrument such as this one provides high contrast for initial low-resolution reconstructions. The higher contrast helps to reduce possible ambiguity when reconstructing an asymmetric particle for the first time.
The electron microscopy of the Ca2+ channel negatively stained with uranyl acetate was also performed with a JEOL1200 electron microscope equipped with a high tilt eucentric goniometer stage. Single tilt-axis series images of negatively stained samples were recorded on Kodak SO-163 film at 100 kV and at a magnification of ×50,000. The angular range of the tilt series was ± 60° with 10° increments.
Tomographic Reconstruction of the Ca2+ Channel.
Tomographic reconstruction of individual particles from the negatively stained tilt series was performed by using EMAN (25). Particles were selected near the tilt axis from each image in the tilt series, producing a set of particles, each of which had all views from the tilt series. The particles then were visually assessed, and any particle with substantial impinging mass in any orientation or other obvious problems was discarded, leaving a set of 40 particles for tomographic reconstruction. Each particle was reconstructed independently by determining the tilt axis and the known tilt increment to provide the orientations. Because this was a single-tilt experiment, there was a large missing Fourier wedge in each particle reconstruction. To improve the quality of the overall model, the individual 3D models were mutually aligned and averaged. This technique was designed only to produce a model of approximately the correct size and overall shape for use as a starting model in a nontomographic single-particle reconstruction.
Image Analysis and 3D Reconstruction.
Electron micrographs of ice-embedded Ca2+ channel particles were digitized on a Zeiss scanner at 7 μm and then median filtered to 14 μm, producing a final sampling of 2.8 Å/pixel. Selected particles were further scaled to 5.6 Å/pixel. The models presented were produced by using standard procedures in the EMAN (25) software suite.
Individual particle images (120 × 120 pixels) were interactively selected from digitized electron micrographs. Micrograph quality was assessed by examining the average power spectrum of a set of particles selected from each micrograph with CTFIT (EMAN's contrast transfer function determination software). Because x-ray scattering data were not available, an approximate structure factor was determined by combining curves calculated by fitting the individual micrographs at low resolution (below ≈1/50 Å) with a canonical curve determined from a combination of similarly sized PDB models with different folds at high resolution. This structure-factor curve was used solely to determine more consistently contrast-transfer function (CTF) parameters of the individual micrographs, and this procedure produced an adequate curve for this purpose. CTF correction then was performed by using normal EMAN methodologies (26). Phase flipping was performed on particles before reconstruction, and amplitude corrections were performed automatically as part of the refinement process based on the parameters determined earlier with CTFIT. Our data consisted of 12,889 particle images selected from 24 electron micrographs. The defocus of the images used for image processing was estimated to be in the range of 1.1–3.2 μm underfocus. The generated low-resolution tomographic 3D map of the negatively stained sample was used as an initial model in the refinement procedure. Resolution was assessed by generating two semi-independent reconstructions from even and odd numbered particles and by using the standard 0.5 Fourier-shell correlation (FSC) criterion (27).
The 3D reconstructions of the Ca2+ channel were visualized and manipulated by using IRIS EXPLORER (Numerical Algorithms Group, Oxford) and VIS5D software (http://vis5d.sourceforge.net). Surfaces of the 3D reconstructions were rendered at a variety of threshold levels to assess the significance of features observed in 3D reconstructions (28).
Results
Biochemical Purity.
Purified skeletal muscle L-type Ca2+ channel was prepared as described (18). The identity of the bands seen in SDS polyacrylamide gels of the purified Ca2+ channel was confirmed by Western blotting with monoclonal subunit-specific antibodies (Fig. 1B). The presence of the δ-subunit in the purified channel complex has been confirmed by the shift of the band corresponding to the α2 in the SDS/PAGE under nonreducing vs. reducing conditions (Fig. 1A). Note that the entire α2 band undergoes this shift, suggesting that there is one δ for each α2-subunit. Densitometric analysis of the Coomassie blue-stained gels revealed the stoichiometric ratio of 1.0:1.0:0.9:1:0.9 for the α1-, α2-, β-, γ-, and δ-subunits in the purified protein samples, supporting a previously published 1:1:1:1:1 stoichiometry for the skeletal Ca2+ channel (3, 4, 8, 15). This finding suggests that the protein we have isolated has the structural integrity suitable for electron cryomicroscopy and single-particle analysis.
Fig 1.

(A) Coomassie-stained SDS/5–20% PAGE of purified Ca2+ channel under reducing (lane 2) and nonreducing conditions (lane 3). Lane 1, molecular weight standards. (B) Immunoblot analysis of the purified Ca2+ channel with monoclonal anti-α1 (lane 2), anti-β (lane 3), anti-γ (lane 4), and anti-α2 (lane 5) antibodies was performed as described in Materials and Methods.
3D Reconstruction.
A representative section of an electron micrograph of ice-embedded Ca2+ channel is shown in Fig. 2. A variety of roughly circular particles can be seen clearly. Because of the apparent similarity of different views of the Ca2+ channel, we elected to perform a simple tomographic reconstruction of negatively stained samples to use as an initial model for 3D refinement. Forty individual particles were reconstructed tomographically, and the individual reconstructions were aligned in 3D and averaged together. This average then was used as the starting model for the ice-embedded samples without any stain in a standard EMAN (25, 26) single-particle reconstruction and refinement. The final map (Fig. 3) is determined to a ≈30-Å resolution by using the standard 0.5 FSC criterion on 3D models generated from two independent sets of ice-embedded particle images.
Fig 2.
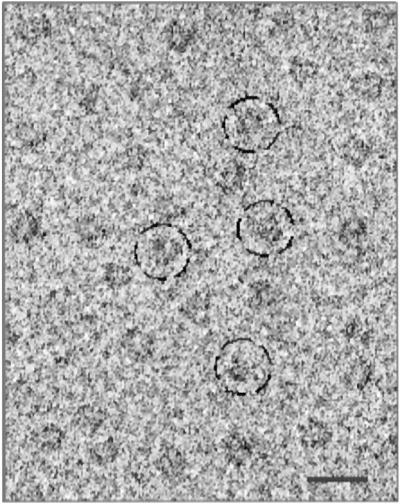
Representative field of an electron micrograph of ice-embedded voltage-gated L-type Ca2+ channel. The channel particles are randomly oriented in the frozen-hydrated specimen. Some individual channel particles are circled. (Bar = 250 Å.)
Fig 3.

(A) Surface representation of the 3D reconstruction of the voltage-gated Ca2+ channel. (Center) Front view. All other views were obtained by rotation of the front view along the horizontal axis (Top and Bottom) or around the vertical axis (Left and Right). The surface is rendered to enclose a volume corresponding to a molecular mass of 430 kDa, assuming a protein density of 1.35 g/cm3. (B) Sections (5.6 Å) of the final 3D model showing internal density distributions. The sections are in the same orientation as the isosurface view in A Top and start from the bottom of the heart as it appears in A Center.
With any asymmetric model, there is a concern that the refinement may have converged to an incorrect model that is still fairly consistent with the data at low resolution. To address this potential concern, we generated four random 3D maps with similar sizes and radial mass distributions to the Ca2+ channel model but completely different shapes. Each of these models was used as a starting model for a normal refinement against the raw data. All four of these randomized models converged to a structure nearly identical to the original refined 3D structure, supporting our assertion that the presented structure is accurate. This test is far more robust than typical tests of initial model dependence, in which the initial model is slightly perturbed or a spurious mass is added. It also demonstrates that an accurate tomographic model was, in fact, unnecessary, because even randomized starting models converge to the same shape.
Structural Features in 3D Reconstruction.
The 3D reconstruction reveals an asymmetric structure consisting of two major regions: a heart-shaped and a handle-shaped region (Fig. 3A). These two regions are connected to each other at an oblique angle, making a continuous structure roughly 115 Å × 130 Å × 120 Å (Fig. 3A). The heart-shaped region measures about 120 Å in height and 115 Å in width (Fig. 3A Left, Center, and Right). The handle-shaped region connects to the upper lobes of the heart-shaped region and has a height of 60 Å and a thickness ranging from 30 to 50 Å. A cavity 30 Å in diameter appears between the two regions. The asymmetry of the molecule is apparent in the serial sections of the 3D map (Fig. 3B).
Discussion
Structural Segmentation into Subdomains.
We have tentatively assigned densities within the 3D map for two major channel polypeptides, α1 and α2/δ, based on the predicted size and proposed topological arrangement of the channel subunits in the t-tubule membrane (Fig. 4A). However, our current 30 Å resolution reconstruction does not yet allow for an absolute delineation of subunit boundaries.
Fig 4.

(A) A membrane topology model of the voltage-gated Ca2+ channel. (B) The 3D reconstruction is partitioned into two regions based on molecular mass and membrane topology of the Ca2+ channel subunits. The relative volumes of these substructures were estimated by assuming a molecular mass of the channel complex of 430 kDa. The volume most likely to contain the α2/δ-subunits is indicated in green.
The Ca2+ channel α1 polypeptide with a molecular mass of 170 kDa shares significant sequence similarity (55%) and a potentially similar transmembrane structure with the α-subunit of the Na+ channel. The transmembrane region of both channels is comprised of four homologous domains, predicted to be oriented in a pseudo-fourfold symmetric fashion in the membrane. Because of the presence of auxiliary subunits in the Ca2+ channel assembly, it exhibits no symmetry (Fig. 3B), in contrast to the monomeric Na+ channel. The second major Ca2+ channel polypeptide α2/δ is a transmembrane disulfide-linked glycoprotein dimer with the α2-subunit (150 kDa) localized entirely extracellularly; the δ-subunit (17 kDa) exhibits one TM domain, anchoring the α2 peptide in the membrane (13).
By using this information, we have segmented the 3D structure of Ca2+ channel into two regions as shown in Fig. 4B. The large heart-shaped region has a volume corresponding to a mass of about 280 kDa (65% of total volume) that we propose accounts for the main pore-forming α1-subunit associated with the smaller γ- and β-subunits (32 and 52 kDa, respectively). The heart-shaped region of our current structure of the Ca2+ channel has a size compatible with the bell-shaped structure of the Na+ channel (14).
At this resolution, we were not able to reveal fourfold symmetrical features or any cavity through the heart-shaped region which might be interpreted as the channel pore. The α2/δ complex most likely accounts for the smaller handle-shaped region with an estimated mass of 140 kDa (≈35% of total volume) and may extend into part of the large region comprising the heart-shaped structure.
Model of Subdomain Assignment to Extracellular and Transmembrane Regions.
By considering the delineations of the channel complex, we expect different areas of the structure to be exposed to extracellular, transmembrane, or cytoplasmic milieus. Membrane topology predicts that the largest portion of the L-type Ca2+ channel complex with a molecular mass over 230 kDa is located extracellularly. This portion includes the glycosylated α2-subunit, extracellular loops of the α1- and γ-subunits, and the N terminus of the δ-subunit.
The volume of the handle-shaped structure and the upper lobes of the heart-shaped structure correspond to a mass of about 260 kDa (Fig. 4B), which may account for the extracellular portion of the channel assembly. The remaining volume, corresponding to roughly 170 kDa, would then contain the cytoplasmically located β-subunit and cytoplasmic and transmembrane regions of the α1-, γ-, and δ-subunits. Therefore, we propose the heart-shaped structure includes the voltage-sensitive transmembrane region of the L-type Ca2+ channel.
In our model, the Ca2+ channel is situated with the wide part of the heart exposed to the extracellular region, whereas the wide part of the Na+ channel is cytoplasmic (14). This orientation of the Ca2+ channel is the same as that the voltage-gated K+ channel (29), which also shares a high-sequence homology with both the Na2+ and Ca2+ channels.
This orientation of the Ca2+ channel in the t-tubule membrane is in agreement with the orientation of the channel complex deduced from the two-dimensional (2D) image analysis of negatively stained images of the L-type Ca2+ channel (30). The 2D-projection images of the Ca2+ channel produced by Murata et al. (30) showed an asymmetric structure of a rod-like domain decorated with a small protrusion on one end. After α2/δ was removed, the structure resembled a hollow trapezoid, suggesting that the decoration at the top of the intact protein was α2/δ. Also, an antibody raised against β-subunit was observed to bind to the edge of the nondecorated part of the main rod of the Ca2+ channel complex. This position of bound antibody would correspond to the region located within the heart-shaped structure in our 3D reconstruction, distant from the handle-shaped assembly.
Implications for E-C Coupling.
E-C coupling is a process that links electrical stimulation of muscle to the release of Ca2+ from the SR. Although E-C coupling proceeds by different mechanisms in cardiac and skeletal muscles, the two main elements of the coupling process are present in each tissue: the voltage-gated L-type Ca2+ channel, localized in the t-tubule membrane, and the Ca2+-release channel localized in the junctional membrane of the SR. The L-type Ca2+ channel can exist in three voltage-dependent, functionally distinct states: closed or resting, activated or open, and inactivated. Upon depolarization, the Ca2+ channel undergoes conformational changes from resting to open state within milliseconds and then inactivates rapidly. Repolarization is necessary to return to the resting state again. The Ca2+ channel, isolated from depolarized membranes in our studies, most likely exists in its inactivated conformation.
The skeletal muscle L-type Ca2+ channel is distinct from other voltage-gated Ca2+ channels with respect to its organization in the triad junction. It has been proposed that the skeletal L-type Ca2+ channel is physically coupled with RyR1. This model is supported by freeze-fracture studies of muscle fibers showing the formation of characteristic clusters of four Ca2+ channels overlaying every other RyR1 (16, 31–33). Current evidence in favor of a physical coupling includes coimmunoprecipitation of solubilized voltage-gated Ca2+ channel and RyR1 (34), as well as identification of sequences of the Ca2+ channel α1-subunit (the II-III loop, the III-IV loop, and the C-terminal) and the RyR1 (Arg-1076–Asp-1112) that are involved in physical interactions (35–42). It has been suggested that the interaction between the voltage-gated L-type Ca2+ channel and RyR1 involves the “orthograde” signal from Ca2+ channels to RyR1s in order to open RyR1s and a “retrograde” signal from RyR1s to Ca2+ channels in order to prevent Ca2+ channel inactivation (23).
The 3D molecular architecture of a native triad complex still remains to be determined. Our structure of skeletal muscle voltage-gated Ca2+ channel gives some clues to the layout of Ca2+ channel/RyR1 complex. Taking into account the predicted membrane topology of the Ca2+ channel, we propose that the narrow base of the heart-shaped domain represents the region where the voltage-gated Ca2+ channel of the t-tubule membrane is coupled with the Ca2+-release channel of the SR membrane (Fig. 5). The clamp-like subdomains of RyR1 are located ≈180 Å apart at four corners in the square-shaped cytoplasmic region. This distance is consistent with the center-to-center spacing of the Ca2+ channels in the tetrads above RyR1 (33), making the clamps likely sites of this protein–protein coupling. These clamp-like domains also undergo significant conformational changes upon opening of the Ca2+-release channel (22, 23). Based on this information, we place the Ca2+ channels above the clamp-shaped domains of the Ca2+-release channel. However, we recognize that the Ca2+ channel may be rotated around its vertical axis from our current model.
Fig 5.

Proposed model for physical coupling between the voltage-gated L-type Ca2+ channel and RyR1 in skeletal muscle. A mushroom-shaped structure of the RyR1 with a bulky cytoplasmic domain (22, 23) is shown to couple through its four clamp-shaped subdomains with a tetrad of Ca2+ channels located in the t-tubule membrane. (A) Freeze-fracture electron image of a tetrad of the Ca2+ channel (courtesy of Cecilia Paolini and Clara Franzini-Armstrong, Univ. of Pennsylvania, Philadelphia). (B) End-on view showing the extracellular face of the tetrad coupled with the cytoplasmic domain of RyR1; one Ca2+ channel is shown as a transparent surface. (C) Side view with a fourfold axis of RyR1 in the image plane.
In summary, we present the structure of the skeletal muscle voltage-dependent Ca2+ channel and a model of its interaction with its partner in E-C coupling, the SR Ca2+-release channel. Elucidation of the structures of these proteins is a major step toward defining the molecular details of E-C coupling and determining the mechanisms by which mutations in these proteins produce human diseases such as malignant hyperthermia and hypokalemic periodic paralysis.
Acknowledgments
We thank Clara Franzini-Armstrong and Cecilia Paolini (University of Pennsylvania, Philadelphia) for generously providing an electron image of freeze-fractured tetrad of the voltage-gated L-type Ca2+ channel, and D. B. Halling (Baylor College of Medicine) for helpful comments in manuscript preparation. This work was supported by National Institutes of Health Grants AR41802, AR44864 (to S.L.H.), and P41RR02250 (to W.C.), and grants from the Muscular Dystrophy Association (to I.I.S. and S.L.H.).
Abbreviations
SR, sarcoplasmic reticulum
RyR1, skeletal muscle ryanodine receptor
t-tubule, transverse tubule
3D, three dimensional
E-C, excitation-contraction
References
- 1.Rios E., Ma, J. J. & Gonzalez, A. (1991) J. Muscle Res. Cell Motil. 12, 127-135. [DOI] [PubMed] [Google Scholar]
- 2.McCarthy T. V., Quane, K. A. & Lynch, P. J. (2000) Hum. Mutat. 15, 410-417. [DOI] [PubMed] [Google Scholar]
- 3.Campbell K. P., Leung, A. T. & Sharp, A. H. (1988) Trends Neurosci. 11, 425-430. [DOI] [PubMed] [Google Scholar]
- 4.Catterall W. A., Seagar, M. J. & Takahashi, M. (1988) J. Biol. Chem. 263, 3535-3538. [PubMed] [Google Scholar]
- 5.Glossmann H. & Striessnig, J. (1988) Vitam. Horm. 44, 155-328. [DOI] [PubMed] [Google Scholar]
- 6.Glossmann H., Striessnig, J., Hymel, L. & Schindler, H. (1988) Ann. N.Y. Acad. Sci. 522, 150-161. [DOI] [PubMed] [Google Scholar]
- 7.Ellis S. B., Williams, M. E., Ways, N. R., Brenner, R., Sharp, A. H., Leung, A. T., Campbell, K. P., McKenna, E., Koch, W. J., Hui, A., et al. (1988) Science 241, 1661-1664. [DOI] [PubMed] [Google Scholar]
- 8.Jay S. D., Sharp, A. H., Kahl, S. D., Vedvick, T. S., Harpold, M. M. & Campbell, K. P. (1991) J. Biol. Chem. 266, 3287-3293. [PubMed] [Google Scholar]
- 9.McDonald T. F., Pelzer, S., Trautwein, W. & Pelzer, D. J. (1994) Physiol. Rev. 74, 365-507. [DOI] [PubMed] [Google Scholar]
- 10.Melzer W., Herrmann-Frank, A. & Luttgau, H. C. (1995) Biochim. Biophys. Acta 1241, 59-116. [DOI] [PubMed] [Google Scholar]
- 11.Catterall W. A. (2000) Annu. Rev. Cell Dev. Biol. 16, 521-555. [DOI] [PubMed] [Google Scholar]
- 12.Isom L. L., De Jongh, K. S. & Catterall, W. A. (1994) Neuron 12, 1183-1194. [DOI] [PubMed] [Google Scholar]
- 13.Catterall W. A. (1995) Annu. Rev. Biochem. 64, 493-531. [DOI] [PubMed] [Google Scholar]
- 14.Sato C., Ueno, Y., Asai, K., Takahashi, K., Sato, M., Engel, A. & Fujiyoshi, Y. (2001) Nature (London) 409, 1047-1051. [DOI] [PubMed] [Google Scholar]
- 15.Leung A. T., Imagawa, T., Block, B., Franzini-Armstrong, C. & Campbell, K. P. (1988) J. Biol. Chem. 263, 994-1001. [PubMed] [Google Scholar]
- 16.Block B. A., Imagawa, T., Campbell, K. P. & Franzini-Armstrong, C. (1988) J. Cell Biol. 107, 2587-2600. [DOI] [PMC free article] [PubMed] [Google Scholar]
- 17.Hawkes M. J., Diaz-Munoz, M. & Hamilton, S. L. (1989) Membr. Biochem. 8, 133-145. [DOI] [PubMed] [Google Scholar]
- 18.Hamilton S. L., Hawkes, M. J., Brush, K., Cook, R., Chang, R. J. & Smilowitz, H. M. (1989) Biochemistry 28, 7820-7828. [DOI] [PubMed] [Google Scholar]
- 19.Laemmli U. K. (1970) Nature (London) 227, 680-683. [DOI] [PubMed] [Google Scholar]
- 20.Lowry O. H., Rosenbrough, N. J., Farr, A. L. & Randall, R. J. (1951) J. Biol. Chem. 193, 265-275. [PubMed] [Google Scholar]
- 21.Saito A., Inui, M., Radermacher, M., Frank, J. & Fleischer, S. (1988) J. Cell Biol. 107, 211-219. [DOI] [PMC free article] [PubMed] [Google Scholar]
- 22.Serysheva I. I., Orlova, E. V., Chiu, W., Sherman, M. B., Hamilton, S. L. & van Heel, M. (1995) Nat. Struct. Biol. 2, 18-24. [DOI] [PubMed] [Google Scholar]
- 23.Nakai J., Sekiguchi, N., Rando, T. A., Allen, P. D. & Beam, K. G. (1998) J. Biol. Chem. 273, 13403-13406. [DOI] [PubMed] [Google Scholar]
- 24.Dubochet J., Adrian, M., Chang, J. J., Homo, J. C., Lepault, J., McDowall, A. W. & Schultz, P. (1988) Q. Rev. Biophys. 21, 129-228. [DOI] [PubMed] [Google Scholar]
- 25.Ludtke S. J., Baldwin, P. R. & Chiu, W. (1999) J. Struct. Biol. 128, 82-97. [DOI] [PubMed] [Google Scholar]
- 26.Ludtke S. J., Jakana, J., Song, J., Chuang, D. T. & Chiu, W. (2001) J. Mol. Biol. 314, 241-250. [DOI] [PubMed] [Google Scholar]
- 27.van Heel M. (1987) Ultramicroscopy 21, 95-100. [DOI] [PubMed] [Google Scholar]
- 28.Serysheva I. I., Schatz, M., van Heel, M., Chiu, W. & Hamilton, S. L. (1999) Biophys. J. 77, 1936-1944. [DOI] [PMC free article] [PubMed] [Google Scholar]
- 29.Sokolova O., Kolmakova-Partensky, L. & Grigorieff, N. (2001) Structure (London) 9, 215-220. [DOI] [PubMed] [Google Scholar]
- 30.Murata K., Odahara, N., Kuniyasu, A., Sato, Y., Nakayama, H. & Nagayama, K. (2001) Biochem. Biophys. Res. Commun. 282, 284-291. [DOI] [PubMed] [Google Scholar]
- 31.Ferguson D. G., Schwartz, H. W. & Franzini-Armstrong, C. (1984) J. Cell Biol. 99, 1735-1742. [DOI] [PMC free article] [PubMed] [Google Scholar]
- 32.Franzini-Armstrong C. & Kish, J. W. (1995) J. Muscle Res. Cell Motil. 16, 319-324. [DOI] [PubMed] [Google Scholar]
- 33.Protasi F., Franzini-Armstrong, C. & Flucher, B. E. (1997) J. Cell Biol. 137, 859-870. [DOI] [PMC free article] [PubMed] [Google Scholar]
- 34.Marty I., Robert, M., Villaz, M., DeJohngh, K. S., Lai, Y., Catterall, W. A. & Ronjat, M. (1994) Proc. Natl. Acad. Sci. USA 91, 2270-2274. [DOI] [PMC free article] [PubMed] [Google Scholar]
- 35.Nakai J., Dirksen, R. T., Nguyen, H. T., Pessah, I. N., Beam, K. G. & Allen, P. D. (1996) Nature (London) 380, 72-75. [DOI] [PubMed] [Google Scholar]
- 36.Lu X., Xu, L. & Meissner, G. (1994) J. Biol. Chem. 269, 6511-6516. [PubMed] [Google Scholar]
- 37.el-Hayek R., Antoniu, B., Wang, J., Hamilton, S. L. & Ikemoto, N. (1995) J. Biol. Chem. 270, 22116-22118. [DOI] [PubMed] [Google Scholar]
- 38.Tanabe T., Beam, K. G., Adams, B. A., Niidome, T. & Numa, S. (1990) Nature (London) 346, 567-569. [DOI] [PubMed] [Google Scholar]
- 39.Grabner M., Dirksen, R. T., Suda, N. & Beam, K. G. (1999) J. Biol. Chem. 274, 21913-21919. [DOI] [PubMed] [Google Scholar]
- 40.Leong P. & MacLennan, D. H. (1998) J. Biol. Chem. 273, 29958-29964. [DOI] [PubMed] [Google Scholar]
- 41.Slavik K. J., Wang, J. P., Aghdasi, B., Zhang, J. Z., Mandel, F., Malouf, N. & Hamilton, S. L. (1997) Am. J. Physiol. 272, C1475-C1481. [DOI] [PubMed] [Google Scholar]
- 42.Sencer S., Papineni, R. V., Halling, D. B., Pate, P., Krol, J., Zhang, J. Z. & Hamilton, S. L. (2001) J. Biol. Chem. 276, 38237-38241. [DOI] [PubMed] [Google Scholar]