Abstract
Under sustained pumping, kinetics of macroscopic nonlinear biochemical reaction systems far from equilibrium either can be in a stationary steady state or can execute sustained oscillations about a fixed mean. For a system of two dynamic species X and Y, the concentrations nx and ny will be constant or will repetitively trace a closed loop in the (nx, ny) phase plane, respectively. We study a mesoscopic system with nx and ny very small; hence the occurrence of random fluctuations modifies the deterministic behavior and the law of mass action is replaced by a stochastic model. We show that nx and ny execute cyclic random walks in the (nx, ny) plane whether or not the deterministic kinetics for the corresponding macroscopic system represents a steady or an oscillating state. Probability distributions and correlation functions for nx(t) and ny(t) show quantitative but not qualitative differences between states that would appear as either oscillating or steady in the corresponding macroscopic systems. A diffusion-like equation for probability P(nx, ny, t) is obtained for the two-dimensional Brownian motion in the (nx, ny) phase plane. In the limit of large nx, ny, the deterministic nonlinear kinetics derived from mass action is recovered. The nature of large fluctuations in an oscillating nonequilibrium system and the conceptual difference between “thermal stochasticity” and “temporal complexity” are clarified by this analysis. This result is relevant to fluorescence correlation spectroscopy and metabolic reaction networks.
Keywords: fluorescence correlation spectroscopy, limit cycle, nanobiochemistry, nonequilibrium steady state, random walk
The past decade has witnessed rapid growth of a host of optical methods for studying biochemical reactions on a mesoscopic level. By mesoscopic we mean a system with one or a few reactant molecules in a solvent. It is microscopic with respect to the chemical reactants, but there are millions of molecules of the aqueous solvent. Many of the new optical methods—e.g., single-molecule enzymology (1, 2), single-molecule Raman scattering (3), and single-particle tracking (4, 5) and detection (6)—can be considered to derive conceptually from fluorescence correlation spectroscopy (FCS) (7), which was initially developed three decades ago (8, 9). The fundamental idea behind FCS is that one can obtain kinetic information about a biochemical reaction by observing microscopic concentration fluctuations (10) and can deduce kinetic properties from a statistical analysis of the stochastic “noisy” data. Although FCS was originally developed for studying systems in equilibrium, it is also applicable to studies of nonequilibrium steady-state (NESS) kinetics. The new optical methods open up the possibility of directly measuring the kinetics of mesoscopic chemical reaction systems far from equilibrium. Of particular interest are systems that either reside in steady states with constant reactant concentrations or execute systematic oscillations. How is the distinction between the oscillating and steady behavior influenced in mesoscopic systems by the spontaneous fluctuations of the reactants?
FCS was originally developed in terms of a theory for linear kinetics. This theory, in parallel with that for macroscopic fast relaxation kinetics of chemical reactions (11, 12), is widely applicable because the equilibrium concentration fluctuations deviate from their macroscopic mean values only slightly. Recently developed optical methods, however, allow measurement of large fluctuations in mesoscopic systems that contain few reactant molecules under NESS condition. This breakthrough in laboratory technology on “living” biochemical systems immediately raises theoretical questions about the nature of concentration fluctuations in nonlinear biochemical reactions.
It is now well established that nonlinear chemical and biochemical reactions can have sustained periodic oscillations in an open system that exchanges reactant(s) and product(s) with appropriate sources and sinks (13). One conceptual example is the following simple reaction (14) derived from glycolysis (15) and the Brusselator (16):
 |
in which A and B have fixed concentrations. In the present study, we focus on chemical reaction systems in a “stirred vessel” and completely neglect the molecular diffusion. Chemical reactions that involve inhomogeneous concentrations in space will be studied in a later work. The traditional macroscopic chemical kinetics based on the law of mass action gives
 |
in which nx and ny are the numbers of X and Y molecules in the reaction vessel. It can be shown (see Appendix Appendix) that when
 |
the reactions in the open system have a NESS:
 |
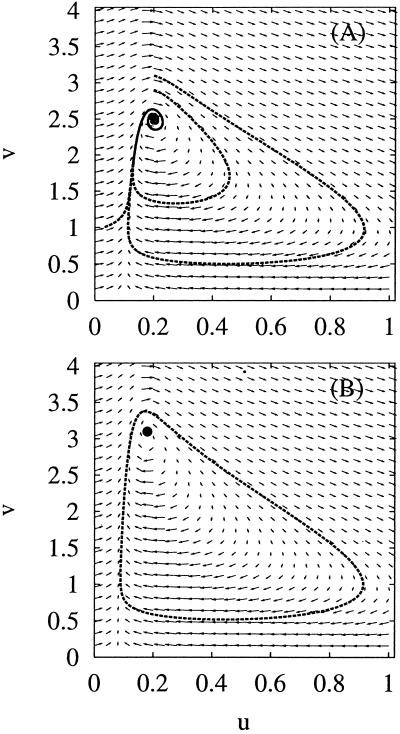
By steady state, we mean the concentrations do not change with time; by nonequilibrium, we mean there is a sustained nonzero flux from B → Y → X → A. In reality, a cycle has to be completed, since the sink and the source are to be “drained” and replenished: moving A → B. The parameter α is a measure of the amount of energy being “pumped” into the system. When α > 1 in Eq. 3, the system 1 oscillates with a defined period (Appendix Appendix). Then, if the system starts at the concentrations given in Eqs. 4, it will remain at those concentrations. If the reaction system starts at other concentrations, however, no matter how close they are to the values in 4, it will eventually settle into oscillatory, periodic kinetics. This is an important mathematical statement; in reality, however, when α > 1 the unstable steady state (4) has no relevance. If we visualize the reaction in the plane of (nx, ny), the steady state corresponds to a single point; the periodic oscillation corresponds to a closed loop (see Fig. 1), which is also called a limit cycle (17).
Fig 1.
Two views of the force field F. The abscissa and ordinate scale are the normalized numbers of molecules for X and Y: u = σnx, v = σny. (A) a = 0.1, b = 0.1. Thus (uss, vss) = (0.2, 2.5), α = 0; the steady state is attractive. (B) a = 0.08, b = 0.1. Thus (uss, vss) = (0.18, 3.1), α = 3.4: the steady state (the black dot) is unstable. The closed loop is attractive when α > 1 (bifurcation).
What happens to the reaction system 1 when there are only small numbers of reactant molecules so that there are significant concentration fluctuations caused by thermal agitation? What are the differences in the behavior of the mesoscopic system when α > 1 and α < 1, conditions that elicit oscillatory or steady behavior in macroscopic systems? How are the stochastic dynamics of the mesoscopic system related to those of its macroscopic counterpart? Can optical methods such as FCS detect chemical oscillations from direct measurements of reactant concentration fluctuations? More fundamentally, in the presence of significant thermal fluctuations, do periodic reactant oscillations retain their identity in a mesoscopic system containing few reactant molecules?
This paper attempts to answer these general questions and to illustrate features of mesoscopic NESS and oscillating systems by using reaction 1 as an example. These issues have practical as well as theoretical significance. With the intense interest in cellular metabolic networks and their regulation after sequencing of the human genome, noninvasive optical methods such as FCS are beginning to provide novel approaches for investigating biochemical networks both in vitro and in living cells (18–21). Combined with experimental measurements of concentration fluctuations based on FCS and related methods, the theory of NESS for mesoscopic systems will become increasingly important in biochemistry.
Our analysis is based on mathematical methods drawn from nonlinear dynamics (14, 22), stochastic processes (23, 24), and partial differential equations (25, 26). To facilitate the presentation of this analysis to the general audience, we have summarized the more mathematical material in appendices. Finally, some biochemical systems can exhibit even chaotic behavior (17). The role of molecular concentration fluctuations in these systems is complex and its analysis is outside the scope of the present work. Whether deterministic chaos retains its meaning under molecular fluctuation is still controversial (27, 28). The temporal complexity of a dynamical system depends on the dimensionality of its phase space—i.e., on the number of variable chemical components in the system. In systems with two-dimensional phase space, sustained oscillation is possible but not chaotic dynamics; this is the focus of our current analysis. For systems with phase space dimension higher than 2, there is a finite probability of nonrecurrence; this corresponds to chaotic behavior in dynamical systems.
Stochastic Model for Nonlinear Biochemical Reaction
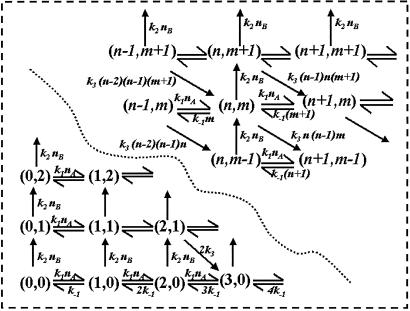
If the numbers of molecules of X and Y, nx and ny, participating in the biochemical reaction 1 are small, one can no longer describe the system in a deterministic fashion as having nx of X and ny of Y at time t. Rather, one describes the stochastic system by the probability of having nx X and ny Y at time t in terms of a probability distribution function, P(nx, ny, t). The stochastic kinetics can be depicted by the schematics shown in Fig. 2. At any given time t, the system has the numbers of X and Y molecules (nx, ny). The random variables nx and ny can change only by +1 or −1. Therefore, the stochastic kinetics of the reaction system, moving on the grid points in Fig. 2, resembles a random walk on the two-dimensional lattice (29). The stochastic fluctuations in nx and ny are analogous to a Brownian motion in the (nx, ny) plane introduced in the previous section (Fig. 1).
Fig 2.
Schematic diagram for the stochastic kinetics of a nonlinear biochemical reaction (1), which exhibits macroscopic periodic oscillation. (nx, ny), the numbers of molecules of X and Y in the system, define a phase point that moves on the grid as a random walker. The chemical rate constants define the rates of transition from one grid point to the next. This figure should be compared with Fig. 1 to see the similarity between the stochastic and deterministic kinetics.
From each state (a grid point in Fig. 2) the system can undergo transitions governed by specific rate constants to any of four possible neighboring states. Therefore, writing the kinetic equation for this stochastic system is straightforward as for a first-order reaction system, and one obtains the dynamic equation for the probability distribution, equivalent to a concentration:
 |
 |
In the theory of probability, this type of random-walk model with variable rate constants is called a birth–death process, which is a special class of Markov process (23, 29). It is also known as a stochastic compartmental system (30).
Just as a random walk can be approximately described by a diffusion equation, Eq. 5 can also be approximated by a diffusion equation with an anisotropic diffusion tensor D in a force field F (Appendix Appendix):
 |
where
 |
 |
in which u, v, τ, a, and b are nondimensionalized nx, ny, t, nA, and nB, respectively, and σ = u/nx = v/ny. Note the diffusion here is in the abstract phase space (Fig. 2) rather than real physical space. The parameter σ characterizes the “goodness” of the diffusion (continuous) approximation for the (discrete) random walk; it also links the microscopic stochastic model with its macroscopic counterpart. For very large nx and ny, σ = 0 and Eq. 6 reduces to Eq. 2 (Appendix Appendix). Therefore, the stochastic model is a generalization that contains the traditional deterministic kinetics as a limiting case. The stochastic model is not an alternative to the deterministic kinetics, it is a more complete kinetic description that is capable of modeling reactions with and without fluctuations.
There is a competition between the first and second terms in Eq. 6, representing the stochastic and the underlying deterministic behavior of the overall kinetics. These two terms are also correlated with the parameter for “stochasticity,” σ, and the parameter for “irreversibility,” α. A system in a steady state far from equilibrium, strongly driven with large α (k2nB ≫ k1nA), will have a smaller thermal fluctuations in relative terms. Irreversibility, which is necessary for oscillatory kinetics, can suppress thermal fluctuations and make even a biochemical system with few reactant molecules behave as a deterministic system. We believe that this property, which is different from the law of large numbers, will be significant for biological signal transduction and error correction.
Mesoscopic NESS and Macroscopic Biochemical Oscillation
The Brownian motion model from the preceding section for the stochastic kinetics of biochemical reaction 1 provides the following picture: the “Brownian particle” (nx, ny)(t) moves stochastically in a two-dimensional space, with its probability distribution, Pss(nx, ny), being the steady-state solution to Eq. 6. However, there are several essential differences between this “Brownian particle” in force field F (Eq. 7) and the usual isotropic planar Brownian motion (31).
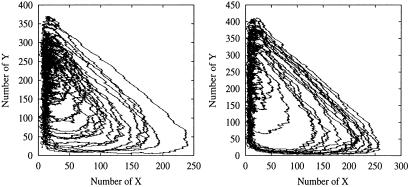
First, the Brownian motion is anisotropic; scalar diffusion coefficients are replaced by a diffusion tensor D. More importantly, the Brownian particle exhibits a tendency to wind around a center clockwise (Figs. 3 and 4). On average, this motion is determined by a vector field J, the flux,
 |
The stream-lines of the vector J are all circular loops, since in a steady state ∂P/∂t = ∇⋅J = 0. This is the defining character of a NESS: in an equilibrium, J(u, v) ≡ 0 for every (u, v) (32).
Fig 3.
Two examples of stochastic trajectories (Eq. 5) for α = 0 (Left) and α = 3.4 (Right). The two examples correspond to those in Fig. 1. σ = 0.01. The simulation is carried out for the Markov process by using the minimal-process method (29).
Fig 4.
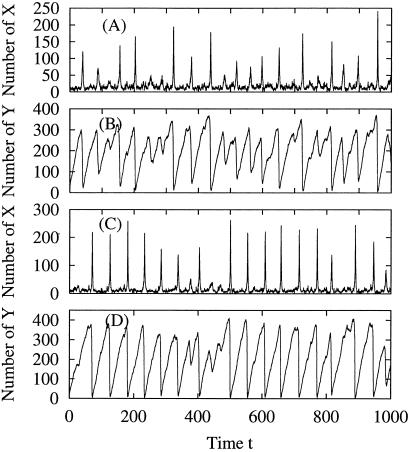
Fluctuations in nx(t) and ny(t) correspond to the trajectories in Fig. 3. Similar oscillations are seen for the system with α < 1 [α = 0 (A and B)] as for the one with α > 1 [α = 3.4 (C and D)] although the oscillations appear slightly more regular in the latter than the former. The data suggest the possibility of stochastic resonance without periodic forcing in driven biochemical reactions (42).
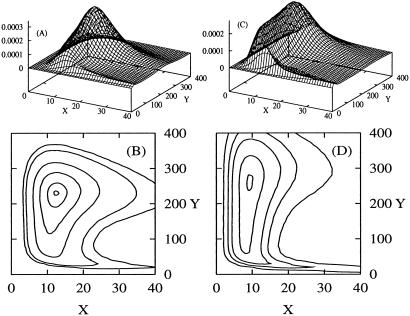
The extremum of Pss can be a maximum, a minimum, or a saddle point. When α < 1, the stochastic kinetics shows a unimodal distribution for Pss with its peak located approximately at (n , n
, n ) (Fig. 5 A and B). For α > 1, however, the distribution does not necessarily lose its unimodality (Fig. 5 C and D). Therefore there is no obvious manifestation in the mesoscopic system of the bifurcation seen in the corresponding macroscopic system. The difference is only quantitative. As the number of reactant molecules increases and σ decreases, however, the distribution loses its unimodality and so bifurcates for α > 1 (Appendix Appendix). This is the deterministic limit of the stochastic model.
Fig 5.
Pss(nx, ny) for α = 0 (A and B) and α = 3.4 (C and D). From the contour plots (B and D) we see that a single maximum is retained for α > 1. Both distributions have peaks approximately at the location of the steady state in the corresponding deterministic kinetics (Fig. 1). The calculations are based on a = 0.1 for A and B and a = 0.08 for C and D. For both b = 0.1, σ = 0.01 and α = (b − a)/(b + a)3.
As we have seen, the mesoscopic dynamics of a chemical reaction with a small number of reactant molecules can be characterized as the stochastic movement of a “random walker” governed both by its probability distribution P(nx, ny), which specifies probabilistically the location of the walker, and by the circular field J, which specifies where the walker is likely to move (Eq. 6). Because J has zero divergence, it is a circular vector field. When the system is mesoscopic (nx and ny small), the probability distribution Pss(nx, ny) is not sharply peaked. Then the system can be far enough from the fixed point (n , n
, n ) so that its circular motion is apparent for α < 1 as well as for α > 1. When the system is macroscopic (large nx and ny) and when α < 1, the probability distribution Pss(nx, ny) is sharply peaked and exclusively concentrated at (n
 , n
, n ) at which J = 0 coincides precisely with F = 0 (Eq. 8: J = 0 if ∇Pss = F = 0). Hence, under this condition the circular motion of the phase point cannot be seen.
However, it can be shown that for α > 1, the distribution loses it maximality (Appendix Appendix), corresponding to the unstable steady state in the macroscopic kinetics. In this case, the macroscopic system is confined to a single loop, the limit cycle. Pss(nx, ny) has its minimum at the unstable fixed point where, again, is the location at which F = 0 and ∇Pss = 0, as well as the center around which the Brownian particle winds.
Therefore, for a sufficiently small system, the stochastic fluctuations completely overwhelm the “deterministic” behavior of its macroscopic counterpart. A microscopic system in a NESS executes cyclic trajectories even when the macroscopic counterpart does not oscillate. As the system increases in size and as the effects of fluctuations decrease, however, its behavior becomes more deterministic.
It is also interesting to point out that the microscopic stochastic model for nonlinear reaction 1 immediately yields a formula for calculating the heat dissipation of the nonlinear biochemical reaction (33). In fact, with the stochastic model, a nonlinear nonequilibrium thermodynamics can be developed based on the formalism of stochastic macromolecular mechanics (33, 34).
Concentration Fluctuation and Its Time Correlation Function
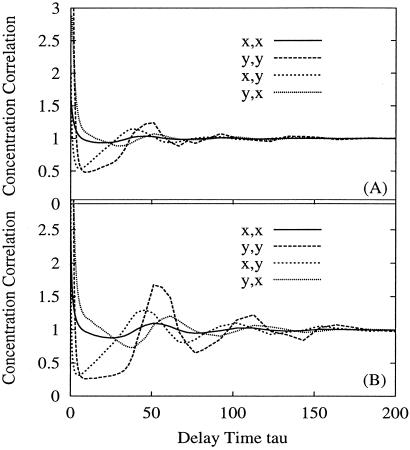
We have shown that the stochastic trajectory of concentration fluctuations (nz, ny) exhibits circular Brownian motion in a NESS. We have further shown that the distribution function for the Brownian motion, Pss(nx, ny), can lose its maximality and unimodality when the macroscopic kinetics becomes oscillatory. Both these observations are based on having simultaneous measurements on nx(t) and ny(t). Fig. 6 shows the auto- and cross-correlation functions between nx(t) and ny(t). Again, while there are quantitative difference between the situations for α = 0 and α = 3.4, they are qualitatively the same. Note that in NESS, the cross-correlation functions 〈nx(t)ny(t + τ)〉 ≠ 〈ny(t)nx(t + τ)〉. For the dynamics of an irreversible biochemical reaction system in the mesoscopic world (1) circular motion is a necessary characteristic of NESS even when the corresponding macroscopic system shows no sign of oscillation. The circular motion is intimately related to the circular flux balance in a NESS, in contrast to the detailed balance in an equilibrium. Thus, circular motions epitomize temporal irreversibility and organization.
Fig 6.
Time correlation functions for concentration fluctuations in Fig. 4. In A α = 0 and in B α = 3.4. The pairs of symbols “η,ξ” by the keys indicate the correlation function Gηξ(τ) = 〈nη(t)nξ(t + τ)〉/〈nη〉〈nξ〉, where η and ξ can be x and y. It is seen that cross-correlation functions Gxy(τ) ≠ Gyx(τ).
Nature of Large Fluctuations in NESS
The statement that irreversibility can suppress thermal fluctuation in a NESS seems to contradict the well-known fact that fluctuations in NESS are larger, not smaller, than that in an equilibrium (35, 36). A well-known biological example of large fluctuations in NESS is the dynamic instability of microtubule assembly driven by GTP hydrolysis (37). The present analysis suggests an insightful resolution to this paradox. As we have shown, with significant irreversible pumping, the biochemical reaction can have a macroscopic oscillation, which can be mathematically identified from the convection terms in Eq. 6, when σ = 0. The thermal fluctuation, by definition, is the variation around this macroscopic time-dependent oscillation (38, 39). However, in mathematical terms, the stochastic fluctuation in a stationary process is the fluctuation around its time-independent mean. Therefore the stochastic fluctuation, which is composed of a deterministic process with temporal complexity and the thermal stochasticity will be large in a NESS with severe pumping.
FCS and related methods can be used to characterize these phenomena experimentally. In its original form FCS was applied to both first- and higher-order chemical reaction systems, assuming that nonlinear systems could be analyzed in linearized form. This was based on the assumption that spontaneous concentration fluctuations should be small. With the recent advance of optical methods to the single molecule level, however, it may be important to take account of the possibility that concentration changes corresponding to the appearance or disappearance even of one reactant molecule could be relatively large. The analytical approach presented here represents a first step in this direction. In the past most FCS experiments have been carried out by measuring the fluorescence emitted from molecules in an open region illuminated by a laser beam. The analysis presented here is for closed chemical reaction systems; FCS measurements can be carried out on small closed systems. Further work is required to extend this approach to the analysis of FCS measurements on open systems
We shall also point out that the important distinction between thermal fluctuations and temporal complexity is known to physicists such as van Kampen (40) and the Tomitas (41), who termed the nonlinear bifurcation to a limit cycle “hard mode instability.” The discrete nature of chemical reactions with few molecules gives rise to a stochastic model from first principles and obviates the ambiguity in the phenomenological Kramer–Moyal expansion (40). We intend to introduce this type of nonequilibrium analysis into biochemical research. Conversely, we hope the fluctuation measurements in biochemical reactions will enrich the fundamental physics of “living” systems.
The deterministic, time-dependent process underlying the large NESS fluctuations can be experimentally discerned. With a sufficiently large number of measurements of the NESS fluctuations, both Pss(nx, ny) and J(nx, ny) can be experimentally reconstructed, and the trajectory of J with maximal probability will then be the deterministic time-dependent process, corresponding to the macroscopic kinetics. Hence, with the appearance of a limit cycle or more complex kinetics, the thermal fluctuations are in fact reduced, accompanied by an increase in the temporal complexity of the corresponding deterministic kinetics. This, we suspect, is the origin of self-organization in nonlinear nonequilibrium systems (16).
Analysis of Deterministic Oscillatory Reaction
The ordinary differential equations (2) for the nonlinear biochemical reaction (1) can be nondimensionalized with u = σnx, v = σny, σ =  , τ = k−1t, and become
 |
where a = (k1/k−1) nA, b =
 nB. The pair of equations has a steady state at uss = a + b, vss = b/(a + b)2 and its linear relaxation kinetics determines the stability of the steady state:
 |
The determinant of the matrix (a + b)2 > 0, which means the real parts of its two eigenvalues have the same sign. The stability of (uss, vss), hence, is determined by the trace of the matrix, the sum of the two eigenvalues, being negative:
 |
When Eq. 11 is negative—i.e., α < 1—the concentrations of X and Y in reaction 1 approach constant values (n , n
, n ). However, when Eq. 11 is positive—i.e., α > 1—the steady state becomes unstable. It can be shown further (14) that the reaction does not go to any constant nx and ny. Rather both nx and ny exhibit periodic oscillations (Fig. 1B). In mathematical terms, a confined set covering the unstable steady state can be found (14), and by the Poincaré–Bendixson theorem (22) there is a limit cycle.
Diffusion Equation for Stochastic Kinetics
Eq. 5 describes a random walk on a two-dimensional lattice shown in Fig. 2. It can be treated approximately as a Brownian motion in a plane. Mathematically, if one notices that P(nx + 1, ny) − P(nx − 1, ny) ≈ 2∂P(nx, ny)/∂nx, P(nx, ny + 1) − P(nx, ny − 1) ≈ 2∂P(nx, ny)/∂ny, P(nx + 1, ny) − 2P(nx, ny) + P(nx − 1, ny) ≈ ∂2P(nx, ny)/∂n , etc., Eq. 5 can be approximated by a rather complicated partial differential equation (24, 38) similar to a diffusion equation:
 |
 |
 |
 |
 |
 |
If we again introduce the nondimensional variables u, v, τ, etc. as in Appendix Appendix, the equation will be in the compact form
 |
where u ≥ 0 and v ≥ 0, with “anisotropic diffusion coefficient” and force field
 |
 |
σ is a natural parameter for characterizing the order of the approximation, bridging the microscopic stochastic model with its macroscopic counterpart (9). For σ = 0, the Brownian motion is reduced to the deterministic motion ∂P/∂τ + ∇⋅(FP) = 0, where F is the right-hand side of deterministic kinetic equation 9. This appendix is a specific example of the general theory of stochastic chemical reaction, called stochastic Boltzmann equation, developed extensively by Keizer (38).
Brownian Motion in a Bifurcating Force Field
Here we suppose that the number of reactant molecules is sufficiently large that the approximation in Eq. 6 is valid. The result of this section does not apply to Fig. 5, where the number of molecules are small. The force field in Eq. 12
 |
does not have a potential function—i.e., no function U(u, v) such that F = −∇U, which can be shown by noting ∂Fu/∂v ≠ ∂Fv/∂u. It can be shown that with nonconservative force F Eq. 12 must approach to a NESS (32). The probability distribution function in the NESS, Pss(u, v), is the steady-state solution to Eq. 12.
The extremum of Pss(u, v) is located exactly at (uss, vss) where F = 0. To show this, we note the steady-state J in Eq. 8 satisfies ∇⋅J = 0; hence it has closed trajectory within any small domain containing (u*, v*) where J = 0. Then by the Dulac theorem ∇⋅(J/Pss) = 0 at (u*, v*), which means ∇Pss = 0 at (u*, v*) since Pss ≠ 0. Therefore, ∇Pss = 0, F = 0, and J = 0 coincide.
If we denote (u*, v*) the location of the extremum of Pss(u, v), then in its neighborhood we have:
 |
In Eq. 15 the diffusion tensor D is positive definite. The ∇2 P-matrix, which is symmetric, determines the curvature of Pss(u, v,) at its extremum. The ∇F-matrix is the linear expansion of the force field around (u*, v*), whose determinant is always positive; when its trace changes sign, both its eigenvalues change signs simultaneously. Since the trace of the ∇J-matrix (last terms in Eq. 15) is always zero, the traces of the remaining two matrices change sign simultaneously since D and Pss are positive. The trace of ∇F-matrix determines the stability of the fixed point and the ∂2P-matrix determines the curvature of function P. Therefore, the bifurcation condition implies Pss(u*, v*) loses its maximality. In other words, the condition for unstable steady state in the deterministic kinetics corresponds to the Pss in the diffusion model (6) being not unimodal. The maximum at (u*, v*) can change to a minimum or a saddle point. If Pss(u*, v*) becomes a minimum, then the NESS distribution Pss(u, v) is ring modal.
Acknowledgments
We thank Prof. J. D. Murray for carefully reading the manuscript and M. Cooksey for helpful discussions.
Abbreviations
FCS, fluorescence correlation spectroscopy
NESS, nonequilibrium steady state
This paper was submitted directly (Track II) to the PNAS office.
References
- 1.Xie X. S. & Lu, H. P. (1999) J. Biol. Chem. 274, 15967-15970. [DOI] [PubMed] [Google Scholar]
- 2.Qian, H. & Elson, E. L. (2002) Biophys. Chem., in press. [DOI] [PubMed]
- 3.Nie S. & Emory, S. R. (1997) Science 275, 1102-1106. [DOI] [PubMed] [Google Scholar]
- 4.Finzi L. & Gelles, J. (1995) Science 267, 378-380. [DOI] [PubMed] [Google Scholar]
- 5.Qian H. & Elson, E. L. (1999) Biophys. J. 76, 1598-1605. [DOI] [PMC free article] [PubMed] [Google Scholar]
- 6.Xu X.-H. & Yeung, E. S. (1997) Science 275, 1106-1109. [DOI] [PubMed] [Google Scholar]
- 7.Eigen M. & Rigler, R. (1994) Proc. Natl. Acad. Sci. USA 91, 5740-5747. [DOI] [PMC free article] [PubMed] [Google Scholar]
- 8.Magde D., Elson, E. L. & Webb, W. W. (1972) Phys. Rev. Lett. 29, 705-708. [Google Scholar]
- 9.Elson E. L. & Magde, D. (1974) Biopolymers 13, 1-27. [DOI] [PubMed] [Google Scholar]
- 10.Elson E. L. & Webb, W. W. (1975) Annu. Rev. Biophys. Bioeng. 4, 311-334. [DOI] [PubMed] [Google Scholar]
- 11.Eigen M. & de Maeyer, L. C. (1963) in Technique of Organic Chemistry, eds. Friess, S. L., Lewis, E. S. & Weissberger, A. (Wiley, New York), Vol. 8, Part 2, pp. 895–1054. [Google Scholar]
- 12.Schwarz G. (1968) Rev. Mod. Phys. 40, 206-218. [Google Scholar]
- 13.Goldbeter A., (1997) Biochemical Oscillations and Cellular Rhythms: The Molecular Bases of Periodic and Chaotic Behaviour (Cambridge Univ. Press, London).
- 14.Murray J. D., (1991) Mathematical Biology (Springer, New York), 2nd and Corrected Ed., pp. 140–166.
- 15.Sel'kov E. E. (1968) Eur. J. Biochem. 4, 79-86. [DOI] [PubMed] [Google Scholar]
- 16.Nicolis G. & Prigogine, I., (1977) Self-Organization in Non-equilibrium Systems (Wiley, New York).
- 17.Hess B. & Markus, M. (1987) Trends Biochem. Sci. 12, 45-48. [Google Scholar]
- 18.Schwille P., Haupts, U., Maiti, S. & Webb, W. W. (1999) Biophys. J. 77, 2251-2265. [DOI] [PMC free article] [PubMed] [Google Scholar]
- 19.Cluzel P., Surette, M. & Leibler, S. (2000) Science 287, 1652-1655. [DOI] [PubMed] [Google Scholar]
- 20.Kohler R. H., Schwille, P., Webb, W. W. & Hanson, M. R. (2000) J. Cell Sci. 113, 3921-3930. [DOI] [PubMed] [Google Scholar]
- 21.Arkin A., Shen, P. & Ross, J. (1997) Science 277, 1275-1279. [Google Scholar]
- 22.Perko L., (2001) Differential Equations and Dynamical Systems (Springer, New York).
- 23.Karlin S. & Taylor, H. M., (1975) A First Course in Stochastic Processes (Academic, New York).
- 24.van Kampen N. G., (1992) Stochastic Processes in Physics and Chemistry (Elsevier/North–Holland, New York).
- 25.Risken H., (1984) The Fokker-Planck Equation (Springer, New York).
- 26.Wang Z. X. & Guo, D. R., (1989) Special Functions (World Scientific, Singapore).
- 27.Fox R. F. & Keizer, J. (1991) Phys. Rev. A 43, 1709-1720. [DOI] [PubMed] [Google Scholar]
- 28.Nicolis G. & Balakrishnan, V. (1992) Phys. Rev. A 46, 3569-3573. [DOI] [PubMed] [Google Scholar]
- 29.Gillespie D. T., (1992) Markov Processes: An Introduction for Physical Scientists (Academic, San Diego).
- 30.Jacquez J. A., (1996) Compartmental Analysis in Biology and Medicine (BioMedware, Ann Arbor, MI).
- 31.Qian H., Sheetz, M. P. & Elson, E. L. (1991) Biophys. J. 60, 910-921. [DOI] [PMC free article] [PubMed] [Google Scholar]
- 32.Qian H. (1998) Phys. Rev. Lett. 81, 3063-3066. [Google Scholar]
- 33.Qian H. (2002) J. Phys. Chem. 106, 2065-2073. [Google Scholar]
- 34.Qian H. (2002) Phys. Rev. E 65, 016102. [DOI] [PubMed] [Google Scholar]
- 35.Jülicher F., Ajdari, A. & Prost, J. (1997) Rev. Mod. Phys. 69, 1269-1281. [Google Scholar]
- 36.Bak P., Tang, C. & Wiesenfeld, K. (1988) Phys. Rev. A 38, 364-374. [DOI] [PubMed] [Google Scholar]
- 37.Mitchison T. & Kirschner, M. (1984) Nature (London) 312, 237-241. [DOI] [PubMed] [Google Scholar]
- 38.Keizer J., (1987) Statistical Thermodynamics of Nonequilibrium Processes (Springer, New York), pp. 307–351.
- 39.Keizer J. & Tilden, J. (1989) J. Phys. Chem. 93, 2811-2816. [Google Scholar]
- 40.van Kampen N. G. (1963) J. Math. Phys. 4, 190-194. [Google Scholar]
- 41.Tomita K. & Tomita, H. (1974) Prog. Theor. Phys. 51, 1731-1749. [Google Scholar]
- 42.Qian H. & Qian, M. (2000) Phys. Rev. Lett. 84, 2271-2274. [DOI] [PubMed] [Google Scholar]


