

Abstract
Background
Canine cognitive dysfunction (CCD) is a naturally occurring disease in aged dogs that shares behavioral and pathological similarities with Alzheimer’s disease (AD). Despite this, in vivo imaging of CCD has been limited, and to our knowledge, no studies have investigated the use of diffusion tensor imaging (DTI) to assess brain atrophy in this condition. The primary aim of this study was to determine whether DTI could detect differences in white matter microstructure between aged dogs with CCD and cognitively healthy aged dogs. A secondary aim was to evaluate correlations between DTI parameters and cognitive scores derived from the Canine Dementia Scale (CADES). We hypothesized that dogs with CCD would show lower fractional anisotropy (FA) and higher mean diffusivity (MD), axial diffusivity (AxD), and radial diffusivity (RD) in the corpus callosum (CC) and thalamus. We further hypothesized that these changes would correlate with cognitive dysfunction severity.
Results
DTI revealed significant differences in white matter diffusivity between CCD and cognitively healthy aged dogs. Dogs with CCD had higher MD in the thalamus compared to healthy controls (CCD: 0.00063 mm2/s, IQR 0.00062-0.00066; n = 20, Healthy: 0.00060 mm2/s, IQR 0.00060-0.00063; n = 10; p = 0.022). CADES scores positively correlated with MD in the CC (rho=0.343, p = 0.0471) and thalamus (rho=0.483, p = 0.0038), and with RD in the thalamus (rho=0.416, p = 0.0144).
Conclusions
These results demonstrate that DTI can detect changes in white matter integrity in the canine brain in both CCD and cognitively healthy aged dogs. Our findings suggest that axonal degeneration, as reflected by increased MD and RD values, correlates with worsening cognitive impairment. These patterns align with findings reported in Alzheimer’s disease and support the potential use of DTI to monitor neuropathological progression in dogs with CCD. Overall, our results highlight the utility of DTI in characterizing structural brain changes associated with CCD and reinforce the translational relevance of CCD as a model for AD. Further research is required to determine whether DTI can reliably differentiate CCD from normal aging in clinical settings.
Supplementary Information
The online version contains supplementary material available at 10.1186/s12917-025-04973-9.
Keywords: Diffusion imaging, Diffusion tensor imaging, Dementia, Cognitive dysfunction, Aging, Cognitive aging
Background
Canine cognitive dysfunction (CCD) is a progressive neurodegenerative disorder that affects 14%- 35% of the aged dogs and mirrors Alzheimer’s disease (AD) in behaviour and pathology [1]. Shared pathological changes between CCD and AD include amyloid-β (Aβ) plaques, cerebral atrophy, ventricular enlargement, and axonal degradation [1–3] Canines seem to be a promising model for AD due to their spontaneous development of neuropathological changes and shared environmental risk factors with humans [4]. Cognitive changes due to CCD include disorientation, sleep-wake disturbance, and house-soiling, all of which are relatively easy to identify and monitor by owners as disease severity progress [4, 5]. However, advanced imaging studies—particularly diffusion tensor imaging (DTI)—are still needed to validate dogs as a robust Alzheimer’s disease model.
Conventional MRI studies in both AD and CCD have previously reported cortical or hippocampal atrophy, ventricular enlargement, and diffuse white-matter signal change, but these macroscopic findings cannot reveal microstructural injury [6–8]. Diffusion tensor imaging (DTI) has been shown to be promising for evaluating microstructural white matter integrity in humans with AD [9, 10]. DTI measures the directionality and magnitude of the diffusion of water molecules in a tissue and can characterize demyelination and axonal degradation throughout the brain [11–13]. Studies have suggested that DTI can differentiate AD from normal brain aging and may serve as a biomarker for the risk of AD in patients with mild cognitive impairment (MCI) [14–16]. However, there is a lack of consensus about the efficacy of DTI in distinguishing AD from aging pathology [17, 18]. More research is needed to establish which white matter regions differ significantly in DTI indices between AD and aging brains in humans.
DTI has been used to characterize various neurological diseases in canines, including spinal cord injury, idiopathic epilepsy, and degenerative myelopathy, with mixed success in differentiating healthy from diseased dogs [19–21]. A recent study investigating white matter changes in aging canine brains reported distinct alterations in DTI indices compared to healthy controls in the parietal and temporal regions, corpus callosum (CC), midbrain, and fornix [22]. To date, no study has used DTI to characterize white matter integrity in dogs with CCD.
Accordingly, the primary aim of this study was to quantify differences in white-matter microstructure between aged dogs with canine cognitive dysfunction (CCD) and cognitively healthy aged dogs using diffusion tensor imaging (DTI). A secondary aim was to determine whether DTI metrics correlate with cognitive-impairment severity, as measured by the Canine Dementia Scale (CADES). We hypothesized that CCD would be associated with lower fractional anisotropy (FA) and higher mean diffusivity (MD), axial diffusivity (AxD), and radial diffusivity (RD) in the corpus callosum and thalamus, and that these alterations would increase with higher CADES scores.
Results
Cohort characterization
Twenty dogs had Canine Dementia Scale (CADES) scores >8 (62.5%) and were, therefore, categorized as having signs of CCD: eight male castrated (40%) and 12 female spayed (60%) dogs with ages ranging from 8.8-15.2 years (12.4±1.81 years, mean±SD) and weights ranging from 6.3 to 35.5 kg (17.2±8.25 kg). Twelve dogs were categorized as cognitively healthy (37.5%): eight male castrated (66.7%) and four female spayed (33.3%) dogs with ages ranging from 8 to 14.5 years (10.4±2.29 years) and weights ranging from 7.4 to 44.4 kg (26.7±13.0 kg). The mean scores of the CADES survey for the CCD and healthy groups were 43.7±20.6 and 2.17±2.62, respectively. Within the CCD group, five were characterized as mild CCD (CASED score 8-23), four characterized as moderate CCD (CADES score 24-44), and eleven were characterized as severe CCD (CADES score 45-95). Common behavioural changes within the CCD group include wandering at night, inappropriate urination, increased irritability, and anxiety. Demographic information and CADES survey scores are summarized in Table 1, while Additional file 1 provides the individual demographic data and changes in DTI indices for each patient.
Table 1.
Summary of demographic information and CADES scores for healthy and CCD dogs
| Variable | Healthy (n = 12) | CCD (n = 20) |
|---|---|---|
| Sex (MC/FS) | 8 (66.7%)/4 (33.3%) | 8 (40%)/12 (60%) |
| Age, years (mean ± SD) | 10.4 ± 2.29 | 12.4 ± 1.81 |
| Weight, kg (mean ± SD) | 26.7 ± 13.0 | 17.2 ± 8.25 |
| CADES score (mean ± SD) | 2.17 ± 2.62 | 43.7 ±20.6 |
Abbreviations: CCD canine cognitive dysfunction, MC male castrated, FS female spayed, CADES canine dementia scale
ROI quality and inter-observer agreement
Prior to analysis, three samples were excluded because of severe dorsal-ventral warping, and two additional dogs were removed from the thalamic analysis after distortion prevented reliable ROI placement, leaving 20 CCD and 10 healthy images for thalamic ROIs. Interobserver agreement for all ROIs is summarized in Table 2 as intraclass correlation coefficients (ICCs) with 95% confidence intervals.
Table 2.
Intrerobserver analysis comparing subjective data collection from two regions
| Corpus Callosum | Thalamus | |||||
|---|---|---|---|---|---|---|
| DTI Index | ICC | ICC.Lower | ICC.Upper | ICC | ICC.Lower | ICC.Upper |
| FA | 0.851 | 0.720 | 0.924 | 0.387 | 0.041 | 0.651 |
| MD | 0.890 | 0.788 | 0.944 | 0.636 | 0.367 | 0.808 |
| AxD | 0.831 | 0.685 | 0.914 | 0.508 | 0.191 | 0.730 |
| RD | 0.878 | 0.767 | 0.938 | 0.587 | 0.298 | 0.779 |
Abbreviations: FA fractional anisotropy, MD mean diffusivity, AxD axial diffusivity, RD radial diffusivity, ICC intraclass correlation coefficient
Group differences in DTI metrics
All collected DTI variables (FA, MD, AxD and RD) were evaluated for normality. Normal quantile-quantile plots demonstrated that the DTI variables were not normally distributed. As a result, the Wilcoxon rank sum test was performed to compare the median of each DTI variable between the CCD group and the healthy group. Figure 1 summarizes the DTI metrics for the corpus callosum (CC) while Fig. 2 presents the corresponding thalamic metrics. According to this analysis, the median MD in the thalamus in dogs with CCD was significantly greater than that observed in healthy dogs (CCD: 0.00063 mm2/s, IQR 0.00062-0.00066; n = 20, Healthy: 0.00060 mm2/s, IQR 0.00060-0.00063; n = 10; p = 0.022).
Fig. 1.

Median fractional anisotropy (FA), mean diffusivity (MD), axial diffusivity (AxD), and radial diffusivity (RD) in the corpus callosum (CC) in healthy and CCD dogs. Error bars represent inter-quartile range (IQR). No significant difference between healthy group and CCD groups
Fig. 2.
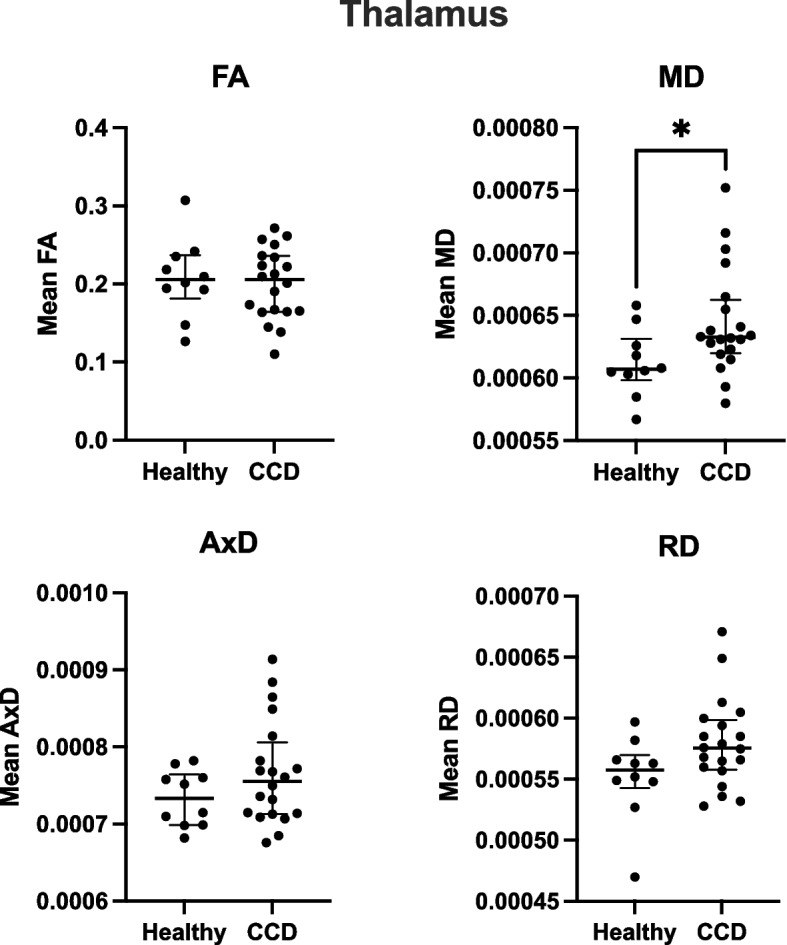
Median fractional anisotropy (FA), mean diffusivity (MD), axial diffusivity (AxD), and radial diffusivity (RD) in the thalamus in healthy and CCD dogs. Error bars represent inter-quartile range (IQR). Significant difference observed in MD between healthy and CCD group (p = 0.022)
Correlation with CADES scores
Spearman’s rank correlation was computed to assess the relationship between CADES scores and DTI parameters. CADES scores correlated positively with MD in the corpus callosum (rho=0.343, p = 0.0471) and MD and RD in the thalamus (rho=0.483, p = 0.0038; rho=0.416, p = 0.0144, respectively).
Post-hoc power analysis
Post-hoc power analysis was performed for each DTI parameter (FA, MD, AxD, RD) in the CC and thalamus using α = 0.05. The results of post-hoc power analysis can be seen in Table 3. The “Power” column shows the statistical power our current sample achieved, whereas the “n.80” and “n.90” columns indicate the sample size required to reach 80% or 90% power, respectively, at the same effect size. These results demonstrate that larger cohorts are needed to detect reliable group differences in most metrics. Additionally, they suggest that thalamic MD and RD may be the most promising parameters for distinguishing CCD from healthy ageing dogs.
Table 3.
Post-hoc power analysis for DTI Indexes between CCD and healthy groups
| Corpus Callosum | Thalamus | |||||
|---|---|---|---|---|---|---|
| DTI Index | Power | n.80 | n.90 | Power | n.80 | n.90 |
| FA | 0.1423 | 144 | 192 | 0.0690 | 598 | 800 |
| MD | 0.2589 | 66 | 87 | 0.5566 | 24 | 31 |
| AxD | 0.0709 | 613 | 821 | 0.2742 | 54 | 72 |
| RD | 0.2154 | 62 | 110 | 0.4879 | 28 | 37 |
Abbreviations: DTI diffusion tensor imaging, CCD canine cognitive dysfunction, FA fractional anisotropy, MD mean diffusivity, AxD axial diffusivity, RD radial diffusivity
Discussion
We compared 20 dogs with CCD with 12 similarly aged healthy dogs to investigate differences in white matter microstructure in a canine model of cognitive decline. We found a positive correlation between cognitive decline, evaluated by the CADES survey, and two DTI parameters, MD in both the CC and thalamus, and RD in the thalamus. Additionally, we found an increase in the mean MD in the thalamus of dogs with CCD compared to healthy controls. These findings indicate that DTI can detect differences in axonal integrity between dogs with CCD and cognitively healthy aged dogs, and that axonal integrity may decrease as the severity of cognitive dysfunction increases. Although further research is required to determine the feasibility of DTI as a diagnostic tool for CCD, our research reveals the applicability of DTI to investigate diffusivity changes in brains with CCD which could reveal the broader use of CCD as a translational model for AD.
The values of mean fractional anisotropy (FA), mean diffusivity (MD), axial diffusivity (AxD), and radial diffusivity (RD) provide insight into white matter integrity and are indicative of white matter degradation or demyelination [23]. Lower FA and greater RD and MD have been reported in aging and AD, which is thought to reflect decreased myelination, disruption of axonal structure, and overall rarefaction of white matter tissue [23–25]. In a recent study, human patients with AD—identified by lower Modified Mini-Mental State Examination (MMMSE) and Clinical Dementia Rating (CDR) scores—showed widespread increases in MD and decreases in FA within major white matter tracts including the splenium, cingulum, and arcuate fasciculus [14]. A comparable pattern emerged in our CCD cohort: higher CADES scores correlated with increased MD in the thalamus and splenium of the CC. These converging observations suggest that CCD and AD shares some microstructural features, supporting further exploration of canines with CCD as a translation model for human AD.
The corpus callosum (CC) is the largest fibre bundle connecting the two cerebral hemispheres and plays an important role in interhemispheric processing. CC atrophy can be detected in early-stage AD [26, 27], which may explain why patients with AD struggle to perform tasks requiring interhemispheric processing [28]. Throughout our study, the splenium of the CC was well defined and easily differentiated on the FA map, resulting in consistent delineation of the CC for ROI selection. A positive correlation was observed between CADES scores and MD in the CC (p = 0.0471), indicating that cognitive deficits appear to be correlated with increased MD in the CC. Similarly, AD research has found that DTI analysis of the splenium of the CC in patients with AD compared to controls shows significant increases in MD, AxD and RD values [29]. Another study found that patients with AD have increased MD in the splenium of the CC [30]. The positive correlation observed in our study between the CADES scores and MD in the CC emphasizes the promising use of DTI to quantify changes in axonal integrity associated with decreasing cognitive function.
The thalamus is a well-defined region within the brain that plays an important role in memory and emotional processing through its axonal connection to the Papez Circuit [31]. There is evidence that the loss of episodic memory can be correlated with degeneration of the Papez circuit, which involves the limbic thalamus [32]. The thalamus is known to be affected by AD pathology, specifically neurofibrillary changes [33, 34], and canine studies have shown elevated tau pathology in the Papez circuit and limbic thalamus in dogs with CCD [35]. In this study, we found an increase in mean MD in the thalamus in dogs with CCD compared to non-CCD aged controls (p = 0.022). Additionally, the DTI findings in the thalamus showed a positive correlation between CADES scores and MD (p = 0.0038) and RD (p = 0.0144) values, indicating a correlation between increased axonal diffusivity and worsening cognitive decline. Studies of the white matter tracts in the thalamus of patients with AD revealed lower FA and greater RD, compared to controls [36]. Another study showed that patients with severe stages of AD have decreased FA and increased MD in thalamic connectivity regions, including the fornix, anterior thalamic radiation, and left posterior thalamic radiation, compared to healthy controls [37]. Our analysis indicated that as signs of cognitive decline worsen, thalamic diffusivity increases and anisotropy decreases, which corresponds with human DTI data from aging and Alzheimer’s neuroimaging studies.
The main limitation of this study is its modest sample size, which resulted in low post-hoc power for most DTI metrics (Table 3) and required pooling mild, moderate, and severe CCD cases into a single group. Future studies should recruit larger cohorts and analyze dogs with varying CCD severity separately to clarify stage-specific white-matter changes. Additionally, dogs differentially express cognitive impairment signs based on varying factors—larger sized dogs showed a lower incidence of CCD risk while smaller sized dogs, dolichocephalic breeds, and purebreds had a higher CCD risk prevalence [38]. As the scope of CCD research increases, it will be essential to examine the effect of size and breed on CCD severity and therefore neuroimaging parameters. Although our study was underpowered, the promising results of this pilot study suggest that larger populations should be included in future studies on the use of DTI as a diagnostic tool for CCD and a monitoring parameter in dogs, which will ultimately help validate dogs as an appropriate model for AD research.
Low resolution and distortion of the magnetic resonance images limited the ability to delineate various regions in the brain, excluding analysis of other important structures. The acquisition of an image in the opposite phase-encoding direction was not originally included due to technical errors in magnetic resonance imaging (MRI) data acquisition. The addition of the phase-encoding sequence to the protocol will allow for the use of topup [39, 40] in the MRI preprocessing steps, which will result in decreased anterior to posterior distortion of the brain, increasing the integrity of brain structures. Additionally, this step would also allow for the use of eddy, a more advanced form of eddy_correct, which will further correct for eddy movement artifacts [41].
Finally, this study focused exclusively on DTI and did not include volumetric MRI, blood biomarkers, or post-mortem confirmation of CCD; integrating those modalities will be essential for comprehensive validation of the canine model. Despite these constraints, our findings provide encouraging proof-of-concept for using DTI to detect microstructural brain changes in CCD.
Future investigations will include the use of DTI sequences to characterize differences in indices between healthy young, healthy aged, mildly cognitively impaired, moderately cognitively impaired, and severely cognitively impaired dogs. Histopathology of brain regions, serum, and cerebrospinal fluid biomarkers will be analyzed and compared to changes in DTI parameters to further characterize differences between the groups listed above. Based on past studies, the following anatomical structures will be analyzed using DTI, which may reveal more significant changes: prefrontal, temporal, parietal, entorhinal, occipital cortices, and limbic structures [2, 3, 42].
Comparison of DTI parameters with biomarkers may also provide insight into the severity of disease and further develop the diagnostic role of DTI and other potential diagnostic criteria for CCD, as well as understand the utility of DTI as a monitoring tool for the dog model in AD therapeutic drug trials. Slightly elevated liver enzymes (aspartate aminotransferase and alanine transaminase), decreased sodium and chloride, and increased neurofilament light chain levels in blood serum have been found in dogs with mild cognitive impairments compared to aging dogs and young controls [43]. Amyloid-β concentrations in the plasma may also provide insight into the severity of cognitive impairment; one study revealed that an increased ratio of total Aβ40 to Aβ42 in serum could effectively differentiate dogs with mild cognitive impairment from healthy and severely cognitively impaired dogs [44]. Thus, comparing levels of amyloid beta in the blood to DTI parameters may provide insight into how diffusivity changes throughout the progression of disease from mild to severe cognitive impairment. Overall, integrating biomarker data with DTI findings may enhance the diagnostic accuracy and monitoring capabilities for CCD. This combined approach could also strengthen the utility of CCD as a translational model for Alzheimer’s disease (AD).
Conclusion
This study demonstrates that DTI can detect changes in white matter microstructure in dogs with CCD, specifically in the CC and thalamus. We observed positive correlations between CADES scores and MD and RD values, indicating that axonal integrity declines with increased severity of cognitive impairment. These findings align with patterns observed in Alzheimer’s disease (AD) and support the potential of CCD as a translational model for AD research. Despite technical limitations and a small samples size, our results establish a foundation for future studies investigating DTI as a diagnostic and monitoring tool in aging canine populations. Further research with larger cohorts and complementary biomarkers is warranted to validate these findings and improve the understanding of CCD pathophysiology.
Methods
Subjects
Thirty-two canine subjects were prospectively recruited from client populations at the Colorado State University Veterinary Teaching Hospital, Fort Collins, CO, USA, between 8/19/2021 and 2/10/2023. All aspects of this study were approved by the Colorado State University Institutional Animal Care and Use Committee and the Clinical Review Board (IACUC protocol numbers: 4106 and 3384). Informed consent to perform MR imaging under general anesthesia and use of data for study was obtained from all owners prior to the procedure. Euthanasia was not performed as a part of this study. There were 16 castrated males and 16 spayed females from 17 different breeds: American Pit Bull Terrier (n = 1), Australian Shephard (2), Blue Tick Hound (1), Border Collie (2), Boxer (1), Chesapeake Bay Retriever (1), Cocker Spaniel (2), Dachshund (1), German Shepherd (2), German Shorthaired Pointer (1), Labrador Retriever (2), Miniature Poodle (1), Pug (3), Rhodesian Ridgeback (1), Shih Tzu (1), Weimaraner (1), and mixed breed (9). Due to the limited nature of literature regarding diffusion tensor imaging of CCD, priori sample size calculation could not be performed. Results of this study can guide future sample size calculations.
The participants were divided into two groups based on neurological examination and questionnaire scoring. A previously published and validated owner-directed survey, the Canine Dementia Scale (CADES), was used to determine the cognitive health of the dogs (5). The CADES questionnaire contains 17 questions related to changes in dogs’ behavior, including spatial orientation, social orientation, social interactions, sleep-wake cycles, and house soiling. Normal aging scores range between 0–7 points, mild cognitive impairment between 8–23 points, moderate cognitive impairment between 24–44 points and severe cognitive impairment between 45–95 points. Dogs with scores >8 on the CADES surveys were categorized as dogs as having some signs of CCD, while dogs with scores between 0-7 were categorized as cognitively healthy. All dogs were greater than 8 years of age. Neurological examination and anatomical magnetic resonance imaging (MRI) analysis to rule out cognitive decline due to structural pathology were performed by a board-certified veterinary neurologist (S.M) or a veterinary neurology resident (M.U.), both of whom were blinded to the CADES scores.
Magnetic Resonance Imaging (MRI) acquisition
Magnetic Resonance Imaging of the dogs was performed under general anesthesia by a board-certified veterinary anesthesiologist. It is standard practice to anesthetize dogs for MR imaging. All dogs recovered uneventfully after the MRI sequences were acquired. Animals were premedicated with methadone (0.1-0.5 mg/kg) or butorphanol (0.1-0.5 mg/kg). Preoxygenation and monitoring equipment was placed prior to induction (as tolerated). Propofol (2-5 mg/kg) and midazolam (0.1-0.2 mg/kg) were administered intravenously. Mechanical ventilation began immediately after induction to prevent an increase in carbon dioxide. They were maintained using isoflurane or sevoflurane with continuous propofol infusion (100-400 mcg/kg/min). Heart rate and rhythm, body temperature, direct arterial blood pressure, end-tidal carbon dioxide and oxygen saturation levels were monitored throughout the procedure. MRI was performed using a 3.0T Siemens Skyra (Siemens Healthcare GmbH, Erlangen, Germany) whole-body scanner (70 cm bore diameter) operating at 45 mT/m amplitude at 200 T/m/s slew-rate. The subjects were placed in dorsal recumbency with their Head centered in a 15-channel receive-transmit knee coil. Diffusion tensor images were acquired in the transaxial plane (TR=3120, TE=112.40, flip angle=78°, isometric voxel size of 1.64 ´ 1.64 ´ 1.90 mm, in-plane field of view=213 mm, matrix size 130 mm ´ 130 mm with 138 gradient directions, b=0 and 2000 s/mm2).
Diffusion MRI preprocessing
Diffusion weighted imaging (DWI) data were corrected for eddy distortion and motion using eddy_correct [45] in FMRIB’s Software Library (FSL) [40]. Brain masks were created using the Brain Extraction Tool (BET) [46] in FSL to separate the brain from surrounding tissues, using the indices of -m, -f 0.85 and -R.
A DTI model was fitted to the data using FMBRIB’s Diffusion Toolbox 5.0 in FSL, creating voxelwise tensor maps for fractional anisotropy (FA), mean diffusivity (MD), radial diffusivity (RD) and axial diffusivity (AxD) [47, 48]. FA is the measure of directionality of diffusion in a tissue, with values ranging from 0 (isotropic) to 1 (anisotropic). In white matter, anisotropic diffusion is due to the presence of membranes, as well as myelination [25]. The MD reflects the magnitude of the total diffusion in a voxel, regardless of directionality. AxD is the diffusion parallel to the primary diffusion direction, while RD is the diffusion perpendicular to the primary diffusion direction [12, 49].
All images were visually inspected at each step of image processing. Diffusion tensor images that had severe distortion were excluded from the study due to difficulty and uncertainty in identifying the targeted brain region of interest.
Region of interest definition
Prior to region of interest (ROI) selection, the study was blinded and randomized. Clinical Trials Coordinator was aware of group allocation throughout the study and unblinded data post MRI analysis. To overcome the anatomical and brain size variations across the dog subjects, manual ROI selection was performed using the Fsleyes edit mode [50]. The following regions were considered for analysis due to histopathological changes observed in dogs with CCD [3]: thalamus, hippocampus, corpus callosum, fornix, and cortex. Image distortion and low resolution inhibited consistent delineation of the hippocampus, fornix, and cortical regions. Therefore, the splenium of the corpus callosum (CC) and thalamus were selected as ROIs because of feasibility of voxel selection based on consistent MRI quality/resolution. Veterinary neurology resident (M.U.) and veterinary neurology research assistant (J.H.) individually selected voxels for the ROIs for each image sample, and after all analyses were completed, the average of the two ROIs for each image was used. All images were visually inspected, and datasets with severe distortion that prevented reliable ROI delineation in the CC or thalamus were marked for exclusion.
Four voxels from the splenium of the CC and eight voxels from the thalamus were included in the ROI to minimize contamination from extraneous structures while maximizing the data points included within the mean of each parameter. Transverse sections of the FA map were used for visualization of structures, and color FA map was used to enhance visibility of axonal tracts and avoid contamination of the internal capsule when selecting voxels of the thalamus ROI and ventricles when selecting voxels for the CC ROI [51]. Figure 3 shows an example ROI of the CC (A and B) and thalamus (C and D) using black and white and color FA maps. The mean data were extracted from the ROIs using fslmeants. The mean FA, MD, AxD, and RD were acquired for the CC and thalamus of each subject.
Fig. 3.

Regions of interest (ROIs) on diffusion-tensor images from a cognitively healthy, aged dog. A Fractional anisotropy (FA) map with ROI drawn around the splenium of the corpus callosum (CC). B Corresponding color-encoded FA map showing the same CC ROI; principal diffusion directions appear red (left-right), green (dorsal-ventral) and blue (cranial-caudal), highlighting the left-right-oriented callosal fibers (red). C and D ROI of thalamus drawn on FA map and FA color map, respectively
Statistics
The statistical analyses were performed by statistician (T. Z.), veterinary neurology resident (M.U.), and veterinary neurology research assistant (J.H) using R statistical software (R Core Team, 2023) and GraphPad Prism (GraphPad Prism 10.5.0 for macOS, GraphPad Software, Boston, Massachusetts, USA, www.graphpad.com).
All continuous variables were screened for normality with the Shapiro–Wilk test. Because DTI variables were non-normally distributed, group differences (CCD vs healthy) were assessed with the two-sided Wilcoxon rank-sum test. Correlations between Canine Dementia Scale (CADES) scores and DTI parameters (FA, MD, AxD, RD) were evaluated using Spearman’s rank correlation coefficient (ρ).
Inter-observer reliability for region-of-interest (ROI) measurements was quantified with a two-way random-effects intraclass correlation coefficient (ICC, single measures, absolute agreement) and interpreted as poor (<0.50), moderate (0.50–0.75), good (0.75–0.90), or excellent (>0.90).
Post-hoc power calculations (80 % and 90 % targets) were performed for each DTI parameter in the corpus callosum (CC) and thalamus to estimate the sample size required for future studies. The significance level was set at α = 0.05; no multiple-comparison correction was applied because the study was exploratory.
Supplementary Information
Abbreviations
- Aβ
Amyloid-β
- AD
Alzheimer’s disease
- AxD
Axial diffusivity
- BET
Brain Extraction Tool
- CADES
Canine Dementia Scale
- CC
Corpus callosum
- CCD
Canine cognitive dysfunction
- DTI
Diffusion tensor imaging
- DWI
Diffusion-weighted imaging
- FA
Fractional anisotropy
- FS
Female spayed
- MC
Male castrated
- MCI
Mild cognitive impairment
- MD
Mean diffusivity
- MRI
Magnetic resonance imaging
- RD
Radial diffusivity
- ROI
Region of interest
Authors’ contributions
JH performed MRI preprocessing, ROI selection, data analysis and was a major contributor in writing the manuscript. MU performed ROI selection, data analysis, statistical analysis, and was a major contributor in writing the manuscript. MA performed neurological examinations. TZ performed statistical analysis. JAM and AZB revised article for intellectual content. SM was a major contributor in writing the manuscript and revised the article for intellectual content. All authors read and approved manuscript.
Funding
This work was supported by the Institute of Cannabis Research CSU Pueblo award (ICY-FY22-McGrath). They did not play a role in design, analysis or reporting of this study.
Data availability
The datasets used and/or analysed during the current study are available from the corresponding author on reasonable request. Stephanie McGrath (stephanie.mcgrath@colostate.edu)
Declarations
Ethics approval and consent to participate
The study was approved by the Colorado State University Institutional Animal Care and Use Committee and the Clinical Review Board (IACUC protocol numbers: 4106 and 3384). Informed consent to perform MR imaging under general anesthesia and use of data for study was obtained from all owners prior to the procedure.
Consent for publication
Not applicable.
Competing interests
The authors declare no competing interests.
Footnotes
Publisher's Note
Springer Nature remains neutral with regard to jurisdictional claims in published maps and institutional affiliations.
References
- 1.Dewey CW, Davies ES, Xie H, Wakshlag JJ. Canine cognitive dysfunction: pathophysiology, diagnosis, and treatment. Vet Clin North Am Small Anim Pract. 2019;49(3):477–99. [DOI] [PubMed] [Google Scholar]
- 2.Prpar Mihevc S, Majdič G. Canine cognitive dysfunction and Alzheimer’s disease - two facets of the same disease? Front Neurosci. 2019;13:604. [DOI] [PMC free article] [PubMed] [Google Scholar]
- 3.Hines AD, McGrath S, Latham AS, Kusick B, Mulligan L, Richards ML, et al. Activated gliosis, accumulation of amyloid β, and hyperphosphorylation of tau in aging canines with and without cognitive decline. Front Aging Neurosci. 2023;15:1128521. [DOI] [PMC free article] [PubMed] [Google Scholar]
- 4.MacQuiddy B, Moreno JA, Kusick B, McGrath S. Assessment of risk factors in dogs with presumptive advanced canine cognitive dysfunction. Front Vet Sci. 2022;9: 958488. [DOI] [PMC free article] [PubMed] [Google Scholar]
- 5.Madari A, Farbakova J, Katina S, Smolek T, Novak P, Weissova T, et al. Assessment of severity and progression of canine cognitive dysfunction syndrome using the canine dementia scale (CADES). Appl Anim Behav Sci. 2015;171:138–45. [Google Scholar]
- 6.Dewey CW, Rishniw M, Johnson PJ, Platt S, Robinson K, Sackman J, et al. Canine cognitive dysfunction patients have reduced total hippocampal volume compared with aging control dogs: a comparative magnetic resonance imaging study. Open Vet J. 2021;10(4):438–42. [DOI] [PMC free article] [PubMed] [Google Scholar]
- 7.van de Pol LA, Hensel A, van der Flier WM, Visser PJ, Pijnenburg YA, Barkhof F, et al. Hippocampal atrophy on MRI in frontotemporal lobar degeneration and Alzheimer’s disease. J Neurol Neurosurg Psychiatry. 2006;77(4):439–42. [DOI] [PMC free article] [PubMed] [Google Scholar]
- 8.Nestor SM, Rupsingh R, Borrie M, Smith M, Accomazzi V, Wells JL, et al. Ventricular enlargement as a possible measure of Alzheimer’s disease progression validated using the Alzheimer’s disease neuroimaging initiative database. Brain. 2008;131(Pt 9):2443–54. [DOI] [PMC free article] [PubMed] [Google Scholar]
- 9.Stěpán-Buksakowska I, Keller J, Laczó J, Rulseh A, Hort J, Lisý J, et al. Diffusion tensor imaging in Alzheimer disease and mild cognitive impairment. Neurol Neurochir Pol. 2012;46(5):462–71. [DOI] [PubMed] [Google Scholar]
- 10.Madden DJ, Bennett IJ, Burzynska A, Potter GG, Chen NK, Song AW. Diffusion tensor imaging of cerebral white matter integrity in cognitive aging. Biochim Biophys Acta. 2012;1822(3):386–400. [DOI] [PMC free article] [PubMed] [Google Scholar]
- 11.O’Donnell LJ, Westin CF. An introduction to diffusion tensor image analysis. Neurosurg Clin N Am. 2011;22(2):185–96, viii. [DOI] [PMC free article] [PubMed] [Google Scholar]
- 12.Jones DK, Leemans A. Diffusion tensor imaging. Methods Mol Biol. 2011;711:127–44. [DOI] [PubMed] [Google Scholar]
- 13.Aung WY, Mar S, Benzinger TL. Diffusion tensor MRI as a biomarker in axonal and myelin damage. Imaging Med. 2013;5(5):427–40. [DOI] [PMC free article] [PubMed] [Google Scholar]
- 14.Esrael SMAM, Hamed AMM, Khedr EM, Soliman RK. Application of diffusion tensor imaging in Alzheimer’s disease: quantification of white matter microstructural changes. Egypt J Radiol Nucl Med. 2021;52(1):89. [Google Scholar]
- 15.Magalhães TNC, Casseb RF, Gerbelli CLB, Pimentel-Siva LR, Nogueira MH, Teixeira CVL, et al. Whole-brain DTI parameters associated with tau protein and hippocampal volume in Alzheimer’s disease. Brain Behav. 2023;13(2): e2863. [DOI] [PMC free article] [PubMed] [Google Scholar]
- 16.Stone DB, Ryman SG, Hartman AP, Wertz CJ, Vakhtin AA, AsDNI. Specific white matter tracts and diffusion properties predict conversion from mild cognitive impairment to Alzheimer’s disease. Front Aging Neurosci. 2021;13. [DOI] [PMC free article] [PubMed]
- 17.Kavcic V, Ni H, Zhu T, Zhong J, Duffy CJ. White matter integrity linked to functional impairments in aging and early Alzheimer’s disease. Alzheimers Dement. 2008;4(6):381–9. [DOI] [PMC free article] [PubMed] [Google Scholar]
- 18.Head D, Buckner RL, Shimony JS, Williams LE, Akbudak E, Conturo TE, et al. Differential vulnerability of anterior white matter in nondemented aging with minimal acceleration in dementia of the Alzheimer type: evidence from diffusion tensor imaging. Cereb Cortex. 2004;14(4):410–23. [DOI] [PubMed] [Google Scholar]
- 19.Beckmann KM, Wang-Leandro A, Steffen F, Richter H, Dennler M, Bektas R, et al. Diffusion tensor-based analysis of white matter in dogs with idiopathic epilepsy. Front Vet Sci. 2023. 10.3389/fvets.2023.1325521. [DOI] [PMC free article] [PubMed] [Google Scholar]
- 20.Lewis MJ, Shomper JL, Williamson BG, Vansteenkiste DP, Bibi KF, Lim SHY, et al. Brain diffusion tensor imaging in dogs with degenerative myelopathy. J Vet Intern Med. 2021;35(5):2342–9. [DOI] [PMC free article] [PubMed] [Google Scholar]
- 21.Liu CB, Yang DG, Li J, Qin C, Zhang X, Liu J, et al. Diffusion tensor imaging reveals brain structure changes in dogs after spinal cord injury. Neural Regen Res. 2023;18(1):176–82. [DOI] [PMC free article] [PubMed] [Google Scholar]
- 22.Barry EF, Loftus JP, Luh WM, de Leon MJ, Niogi SN, Johnson PJ. Diffusion tensor-based analysis of white matter in the healthy aging canine brain. Neurobiol Aging. 2021;105:129–36. [DOI] [PubMed] [Google Scholar]
- 23.Burzynska AZ, Preuschhof C, Bäckman L, Nyberg L, Li SC, Lindenberger U, et al. Age-related differences in white matter microstructure: region-specific patterns of diffusivity. Neuroimage. 2010;49(3):2104–12. [DOI] [PubMed] [Google Scholar]
- 24.Toepper M. Dissociating normal aging from Alzheimer’s disease: a view from cognitive neuroscience. J Alzheimers Dis. 2017;57(2):331–52. [DOI] [PMC free article] [PubMed] [Google Scholar]
- 25.Le Bihan D, Mangin JF, Poupon C, Clark CA, Pappata S, Molko N, et al. Diffusion tensor imaging: concepts and applications. J Magn Reson Imaging. 2001;13(4):534–46. [DOI] [PubMed] [Google Scholar]
- 26.Raghavan S, Przybelski SA, Reid RI, Graff-Radford J, Lesnick TG, Zuk SM, et al. Reduced fractional anisotropy of the genu of the corpus callosum as a cerebrovascular disease marker and predictor of longitudinal cognition in MCI. Neurobiol Aging. 2020;96:176–83. [DOI] [PMC free article] [PubMed] [Google Scholar]
- 27.Teipel SJ, Bayer W, Alexander GE, Zebuhr Y, Teichberg D, Kulic L, et al. Progression of corpus callosum atrophy in Alzheimer disease. Arch Neurol. 2002;59(2):243–8. [DOI] [PubMed] [Google Scholar]
- 28.Qiu Y, Liu S, Hilal S, Loke YM, Ikram MK, Xu X, et al. Inter-hemispheric functional dysconnectivity mediates the association of corpus callosum degeneration with memory impairment in AD and amnestic MCI. Sci Rep. 2016;6(1):32573. [DOI] [PMC free article] [PubMed] [Google Scholar]
- 29.Nir TM, Jahanshad N, Villalon-Reina JE, Toga AW, Jack CR, Weiner MW, et al. Effectiveness of regional DTI measures in distinguishing Alzheimer’s disease, MCI, and normal aging. NeuroImage: Clinical. 2013;3:180–95. [DOI] [PMC free article] [PubMed] [Google Scholar]
- 30.Oishi K, Mielke MM, Albert M, Lyketsos CG, Mori S. DTI analyses and clinical applications in Alzheimer’s disease. J Alzheimers Dis. 2011;26 Suppl 3(Suppl 3):287-96. [DOI] [PMC free article] [PubMed]
- 31.Weininger J, Roman E, Tierney P, Barry D, Gallagher H, Murphy P, et al. Papez’s forgotten tract: 80 years of unreconciled findings concerning the thalamocingulate tract. Front Neuroanat. 2019. 10.3389/fnana.2019.00014. [DOI] [PMC free article] [PubMed] [Google Scholar]
- 32.Adesnik H, Naka A. Cracking the function of layers in the sensory cortex. Neuron. 2018;100(5):1028–43. [DOI] [PMC free article] [PubMed] [Google Scholar]
- 33.Villain N, Desgranges B, Viader F, de la Sayette V, Mézenge F, Landeau B, et al. Relationships between hippocampal atrophy, white matter disruption, and gray matter hypometabolism in Alzheimer’s disease. J Neurosci. 2008;28(24):6174–81. [DOI] [PMC free article] [PubMed] [Google Scholar]
- 34.Braak H, Braak E. Neuropathological stageing of Alzheimer-related changes. Acta Neuropathol. 1991;82(4):239–59. [DOI] [PubMed] [Google Scholar]
- 35.Abey A, Davies D, Goldsbury C, Buckland M, Valenzuela M, Duncan T. Distribution of tau hyperphosphorylation in canine dementia resembles early Alzheimer’s disease and other tauopathies. Brain Pathol. 2021;31(1):144–62. [DOI] [PMC free article] [PubMed] [Google Scholar]
- 36.Wen Q, Mustafi SM, Li J, Risacher SL, Tallman E, Brown SA, et al. White matter alterations in early-stage Alzheimer’s disease: a tract-specific study. Alzheimers Dement (N Y). 2019;11:576–87. [DOI] [PMC free article] [PubMed] [Google Scholar]
- 37.Zhu QY, Bi SW, Yao XT, Ni ZY, Li Y, Chen BY, et al. Disruption of thalamic connectivity in Alzheimer’s disease: a diffusion tensor imaging study. Metab Brain Dis. 2015;30(5):1295–308. [DOI] [PubMed] [Google Scholar]
- 38.Turcsán B, Kubinyi E. Differential behavioral aging trajectories according to body size, expected lifespan, and head shape in dogs. Geroscience. 2024;46(2):1731–54. [DOI] [PMC free article] [PubMed] [Google Scholar]
- 39.Andersson JL, Skare S, Ashburner J. How to correct susceptibility distortions in spin-echo echo-planar images: application to diffusion tensor imaging. Neuroimage. 2003;20(2):870–88. [DOI] [PubMed] [Google Scholar]
- 40.Smith SM, Jenkinson M, Woolrich MW, Beckmann CF, Behrens TE, Johansen-Berg H, et al. Advances in functional and structural MR image analysis and implementation as FSL. Neuroimage. 2004;23(Suppl 1):S208-19. [DOI] [PubMed] [Google Scholar]
- 41.Zhuang J, Hrabe J, Kangarlu A, Xu D, Bansal R, Branch CA, et al. Correction of eddy-current distortions in diffusion tensor images using the known directions and strengths of diffusion gradients. J Magn Reson Imaging. 2006;24(5):1188–93. [DOI] [PMC free article] [PubMed] [Google Scholar]
- 42.Youssef SA, Capucchio MT, Rofina JE, Chambers JK, Uchida K, Nakayama H, et al. Pathology of the aging brain in domestic and laboratory animals, and animal models of human neurodegenerative diseases. Vet Pathol. 2016;53(2):327–48. [DOI] [PubMed] [Google Scholar]
- 43.Vikartovska Z, Farbakova J, Smolek T, Hanes J, Zilka N, Hornakova L, et al. Novel diagnostic tools for identifying cognitive impairment in dogs: behavior, biomarkers, and pathology. Front Vet Sci. 2020;7: 551895. [DOI] [PMC free article] [PubMed] [Google Scholar]
- 44.Stylianaki I, Polizopoulou ZS, Theodoridis A, Koutouzidou G, Baka R, Papaioannou NG. Amyloid-beta plasma and cerebrospinal fluid biomarkers in aged dogs with cognitive dysfunction syndrome. J Vet Intern Med. 2020;34(4):1532–40. [DOI] [PMC free article] [PubMed] [Google Scholar]
- 45.Andersson JLR, Sotiropoulos SN. An integrated approach to correction for off-resonance effects and subject movement in diffusion MR imaging. Neuroimage. 2016;125:1063–78. [DOI] [PMC free article] [PubMed] [Google Scholar]
- 46.Smith SM. Fast robust automated brain extraction. Hum Brain Mapp. 2002;17(3):143–55. [DOI] [PMC free article] [PubMed] [Google Scholar]
- 47.Behrens TE, Woolrich MW, Jenkinson M, Johansen-Berg H, Nunes RG, Clare S, et al. Characterization and propagation of uncertainty in diffusion-weighted MR imaging. Magn Reson Med. 2003;50(5):1077–88. [DOI] [PubMed] [Google Scholar]
- 48.Behrens TE, Berg HJ, Jbabdi S, Rushworth MF, Woolrich MW. Probabilistic diffusion tractography with multiple fibre orientations: what can we gain? Neuroimage. 2007;34(1):144–55. [DOI] [PMC free article] [PubMed] [Google Scholar]
- 49.Winklewski PJ, Sabisz A, Naumczyk P, Jodzio K, Szurowska E, Szarmach A. Understanding the physiopathology behind axial and radial diffusivity changes-what do we know? Front Neurol. 2018;9:92. [DOI] [PMC free article] [PubMed] [Google Scholar]
- 50.McCarthy Pa, Cottaar Ma, Webster Ma, Fitzgibbon Sa, Craig M. fslpy. 3.10.0 ed: Zenodo; 2022.
- 51.Goga C, Firat Z, Brinzaniuc K, Florian I. Meyer’s loop anatomy demonstrated using diffusion tensor MR imaging and fiber tractography at 3T. Acta Med Marisiensis. 2014. 10.2478/amma-2014-0045. [Google Scholar]
Associated Data
This section collects any data citations, data availability statements, or supplementary materials included in this article.
Supplementary Materials
Data Availability Statement
The datasets used and/or analysed during the current study are available from the corresponding author on reasonable request. Stephanie McGrath (stephanie.mcgrath@colostate.edu)