Abstract
The transfer of oxygen from air to blood in the lung involves three processes: ventilation through the airways, diffusion of oxygen in the air phase to the alveolar surface, and finally diffusion through tissue into the capillary blood. The latter two steps occur in the acinus, where the alveolar gas-exchange surface is arranged along the last few generations of airway branching. For the acinus to work efficiently, oxygen must reach the last branches of acinar airways, even though some of it is absorbed along the way. This “screening effect” is governed by the relative values of physical factors like diffusivity and permeability as well as size and design of the acinus. Physics predicts that efficient acini should be space-filling surfaces and should not be too large. It is shown that the mammalian acini fulfill these requirements, small mammals being more efficient than large ones both at rest and in exercise.
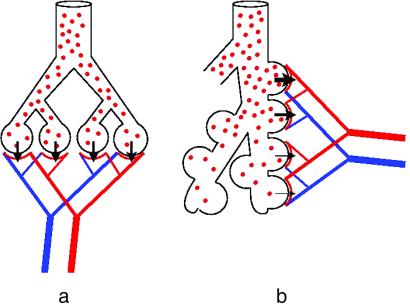
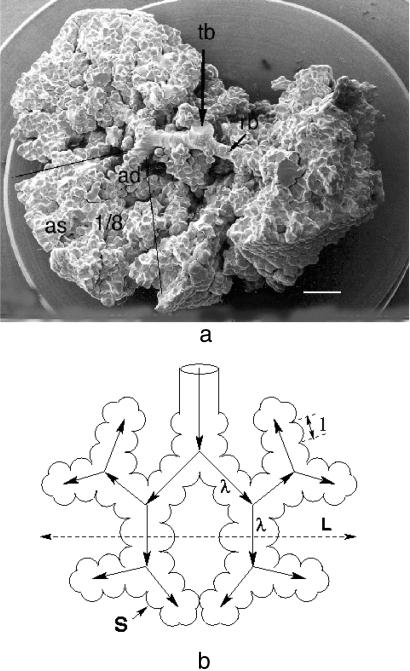
To exchange oxygen and carbon dioxide, blood and air must be brought into close contact over a large surface area, nearly the size of a tennis court, in the human lung (1). For this process to be efficient, an important consideration is how the blood capillary units are arranged with respect to the airways. In the commonly used model, the capillary network is wrapped around the bubble-shaped terminal airway segments (Fig. 1a) so that all gas-exchange units have identical characteristics, which is not what is found. In the mammalian lung, the gas-exchange units are arranged as lateral chambers, so-called alveoli, along about six to nine of the most peripheral generations of the branched airway tree, which form an acinus (1, 2) (Figs. 1b and 2b). Whereas all capillary units are independently perfused with blood in parallel, the ventilation of the alveoli along the acinar airways is in series, some being close to the entrance and others at the periphery of the airways (Fig. 1). Efficient gas exchange therefore depends crucially on ensuring adequate oxygen supply to all capillary gas-exchange units within the acinus, whether they be centrally located near the entrance or deep at the periphery of the acinus. This condition is important because, due to the dichotomous branching mode, about half the gas-exchange surface of an acinus is located in its last generation.
Fig 1.
Models of ventilation–perfusion relationship in the mammalian pulmonary gas exchanger. (a) Parallel ventilation/parallel perfusion. (b) Serial ventilation/parallel perfusion.
Fig 2.
(a) Pulmonary acinus seen in scanning electron micrograph of silicon rubber cast of human lung. Air enters gas exchanger at transitional bronchioles (tb) that branch into respiratory bronchioles (rb) and then alveolar ducts (ad) and sacs (as). Lines shown approximate limits of 1/8 subacinus. Note the dense packing of alveoli, which corresponds to a fractal dimension of the acinar surface close to 3. (Bar = 1 mm.) (Modified after ref. 11.) (b) Schematic geometric structure of mammalian acinus built as dichotomous tree with branches of length λ. The acinus size is called L, and the alveoli diameter is called ℓ.
A number of problems must be noted that will affect the efficiency of gas exchange in the lung:
As the airway tree branches by irregular dichotomy, the total airway cross section increases exponentially as branching progresses by generations (0 < Z < 23). As a consequence, air flow velocity U falls as air moves deeper, until the air flow velocity becomes smaller than the oxygen diffusion velocity in air; this transition occurs about at the entrance of the airways into the acinus (1, 3).
In the most peripheral or acinar airway generations (17 ≤ Z ≤ 23) (1, 2), oxygen diffuses into quasistatic air driven by the gradient established by O2 extraction at the alveolar surface and its transfer to the red blood cells in the capillaries (4).
As O2 diffuses along the acinar airways, it is progressively extracted at the gas-exchange surface along the longitudinal diffusion path (Fig. 1b). Meanwhile, the oxygen partial pressure decreases. This process, referred to below as “screening,” is important because it determines how much O2 reaches the deepest alveoli, where the largest part of the gas-exchange surface is located.
The Phenomenon of Diffusion Screening in Acinar Airways.
Screening is a classical phenomenon that occurs in systems that obey the Laplace equation, the stationary form of the diffusion equation (5):
 |
Here, screening means that part of the O2 that diffuses along the acinar airway is absorbed on the alveolar surfaces along the path, because a molecule starting at a diffusion source has a higher probability to hit the surface of the wall on the most accessible regions than deeper in the structure. If membrane permeability is large, the O2 molecules are absorbed at the very first hits and cannot reach the deeper regions. These regions would then be of no use; they are screened. In contrast, if the permeability is small, molecules will be absorbed only after many collisions with the wall (6). They then have a fair chance to reach the deeper regions, and the entire acinar surface will be effective for gas exchange.
In mammalian lungs, there are two possible situations with respect to screening in the acinus:
(i) For a given geometry, screening occurs if permeability is large enough.
(ii) For a given permeability, screening occurs if the acinus is large enough.
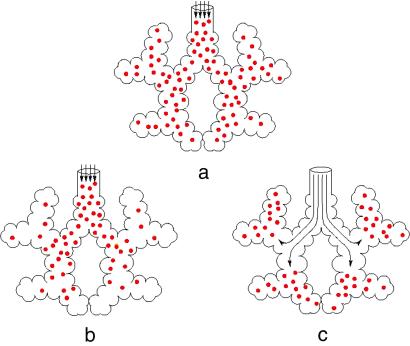
But for a given permeability and geometry, screening can disappear even in a large acinus if the diffusion source is moved inside the system by increased ventilation, so that diffusion now feeds a smaller subsystem. As shown below, this is the case for the human lung working in exercise conditions. These various situations are qualitatively described in Fig. 3.
Fig 3.
Three possible modes for the functioning of the acinus. The end of the arrows schematically depicts the convection/diffusion transition region. (a) For infinite diffusivity, the oxygen concentration would be uniform. (b) The real situation at rest: there is gradient in the oxygen concentration so that the acinus works poorly. (c) The real situation in exercise: increased ventilation brings the diffusion source deeper inside the acinus; the entire acinus is working with maximal efficiency. Note that half the gas-exchange surface is in the last generation.
The net O2 transfer is therefore determined by three factors: the oxygen diffusivity in air, DO2,air; the membrane permeability for oxygen, WO2; and acinar morphometry. The permeability WO2 determines the flux CO2,air × S × WO2 across a flat membrane of area S separating the air space from the capillary blood with O2 concentration CO2,air uniform at the surface and zero concentration on the other side as oxygen is captured by erythrocytes and removed by blood flow. In this simplified picture, the binding of oxygen by the erythrocytes is supposed to be sufficiently effective that the red blood cells act as an oxygen sink. The effective permeability of the membrane of thickness τ is determined by the dissolution of oxygen at the gas–membrane surface and by its diffusion across the barrier. Calling β the solubility of oxygen in water and DO2,water its diffusivity in the membrane (close to the one in water and plasma), the permeability can be written WO2 = β × DO2,water/τ. The membrane thickness τ is measured from the alveolar surface to that of the red cells (7).
From these quantities, we derive a parameter that has the dimension of a length
 |
which allows comparison of the conductance to reach a crumpled surface with the conductance to cross this surface. In this comparison, two geometric factors are involved: the total surface area S and the diameter L of the smallest sphere that encloses the surface. The conductance to reach the surface is of order Yreach ≈ DO2,air × L, whereas the conductance to cross is Ycross = WO2 × S. Then, depending on the physical and geometrical parameters (DO2,air, WO2) and (L, S), the conductance to cross will be smaller or larger than the conductance to reach if Λ is either larger or smaller than S/L. In geometrical terms, the ratio of the surface area to its diameter is the average total length Lp (p, perimeter) of a random plane section of the surface (8). Then, in physical terms, Λ corresponds to the maximal perimeter length of a planar cut of the exchange surface on which screening effects can be neglected, hence its designation as “unscreened perimeter length.” The role of Λ as “unscreened perimeter length” has been thoroughly studied in D = 2, theoretically, numerically, and experimentally (6, 9–11).
The transition between the screened and unscreened regimes then occurs when Λ ≈ S/L. This criterion now allows comparison of the morphometric S/L data to the physical scale Λ. For the mammalian lung, Λ can be estimated as follows. The solubility β of oxygen in water is 1.41 nmol⋅cm−3⋅torr−1 (1 torr = 133 Pa) or 2.4⋅10−2 molecule per unit volume of water for one molecule per unit gas volume. The barrier thickness varies slightly between different mammalian species (7) around τ ≈ 10−4 cm. Using the diffusivity of oxygen in air (DO2,air = 0.2 cm2⋅s−1) and in water (DO2,water = 33.10−6 cm2⋅s−1) (at 37°C), one obtains Λ(cm) = 2.53 × 10⁵ × τ(cm). The value of Λ for mammals is then of order Λ ≈ 20 cm.
The value of Λ is compared with the morphometry of real acini in Table 1. Interestingly, one observes that the mammalian acinar perimeters Lp are of the same order as Λ; they vary by no more than a factor of 2 from mouse to human. The human acinus is comparatively very large, so that Λ is much smaller than the acinus perimeter. However, we should rather consider what has been called a 1/8 subacinus as the gas-exchange unit (12) (see Fig. 2a), because, as shown below, in human lungs the transition between convection and diffusion occurs at generation 17, which is the entrance point to the 1/8 subacinus. This subacinus is hence more comparable to acini in other species (13). For this 1/8 subacinus, Λ is again of the order of Lp.
Table 1.
Morphometric and physical parameters for acini in various mammals
| Parameter
|
Species | ||||
|---|---|---|---|---|---|
| Mouse
|
Rat
|
Rabbit
|
Human | ||
| Acinus | 1/8 subacinus | ||||
| Acinus volume, Va, 10−3⋅cm3 | 0.41 | 1.70 | 3.40 | 187 | 23.4 |
| Acinus surface Sa, cm2 | 0.42 | 1.21 | 1.65 | 69 | 8.63 |
| Average membrane thickness τ, 10−4 cm | 0.60 | 0.75 | 1.0 | 1.1 | 1.1 |
| Unscreened length Λ, cm | 15.2 | 18.9 | 25.3 | 27.8 | 27.8 |
| Acinus size La = Va1/3, cm | 0.074 | 0.119 | 0.150 | 0.572 | 0.286 |
| Acinus perimeter Lp ≈ Sa/La, cm | 5.6 | 10.2 | 11.0 | 120.6 | 30 |
| Alveolus size ℓ ≈ 4 Va/Sa, 10−4 cm | 39 | 56 | 82 | 162 | 162 |
| Reduced perimeter Lp/ℓ | 717 | 910 | 670 | 7,600 | 925 |
| Λ/Lp | 2.7 | 1.85 | 2.3 | 0.93 | |
| Hilbert acinus efficiency (generation 4) | 0.21 | 0.17 | 0.19 | 0.11 | |
In fact, as will be shown below, for a branched geometry like that of the acinus, there is still significant screening when Λ is of the order of Lp, but the very fact that the morphometric perimeters Lp are found to be of the order of Λ, the ratio of transport parameters, indicates that lung design is adjusted to avoid strong screening.
Acinus Efficiency and Its Consequence—Smaller Is Better: Example of the Hilbert Acinus.
Under conditions where there is no screening, the exchange conductance increases linearly with the acinar surface area. To describe such a convoluted surface as that of the acinus, it is convenient to introduce fractal geometry (14–16). For a self-similar fractal surface of fractal dimension Df, if the smaller flat element has a size ℓ, the total area S is of order (14) ℓ2(L/ℓ) . In the case of the acinus, ℓ would correspond to the typical diameter of an alveolus. The conductance is then Ycross = WO2ℓ2(L/ℓ)
 . For given alveoli and acinus sizes, a surface with Df = 3 optimizes the flux and Ycross = WO2L3/ℓ. This result corresponds to the intuitive idea that, if a large exchange surface is needed, a space-filling surface with Df = 3 will be most efficient (17). The geometry of the mammalian acinus agrees with this notion (12, 13). But if one thinks of optimized exchangers, one should take into account that the exchange must take place in the finite volume of the chest. Therefore, optimizing the lung exchanger should really be optimizing the conductance per unit volume or specific conductance Yspec = Ycross/L3 = WO2/ℓ. Because WO2 is roughly invariant between the species, the specific conductance WO2/ℓ is larger in small animals with smaller alveoli. Smaller mammals are then more efficient if no screening occurs.
In contrast, under high permeability conditions, part of the acinar surface may not be active because it is screened; this passive fraction increases with acinus size, so that the specific conductance decreases as the size of the acinus becomes too large.
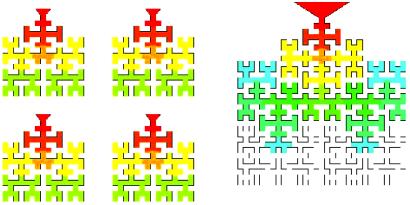
To study the effect of size, we introduce a simple two-dimensional model for the lung acinus that we call the “Hilbert acinus.” Its geometry is suggested by the structure of the Hilbert curve, one of the first examples of a space-filling curve (15, 16) in D = 2. Hilbert acini of generations 3 and 4 are shown in Fig. 4. With unit length ℓ, their respective perimeter length is Lp,3/ℓ = 213 and Lp,4/ℓ = 853. The Hilbert acinus exhibits some of the topological properties of real acini. It is a branched structure with narrow access that gives access to larger and larger surfaces. The Hilbert acinus that corresponds best to the real acini is that of generation 4. This choice derives either from the ratio Lp/ℓ by using morphological data for the animals quoted in Table 1 or from the values of the average acinus volumes and surfaces Va and Sa by using the approximation Sa ≈ 4 (ℓ)2 (La/ℓ)3, from which ℓ ≈ 4 Va/Sa. This value is based on the stereological parameter surface-to-volume ratio (8) and is intuitively related to the model situation of the Hilbert acinus: if the acinus is considered as a dense set of cubes of side ℓ, on average about four of the cube faces are used (18). From the data of Table 1, one obtains Lp/ℓ of order 700–900, which justifies the choice of the fourth generation Hilbert acinus to model the mammalian acini.
Fig 4.
The Hilbert geometry acinus model. (Left) Four Hilbert acini of generation 3. (Right) One Hilbert acinus of generation 4, illustrating the concept of “smaller is better,” and why the lung has to be branched to be efficient. Color shows oxygen concentration gradient from inspired air (red) to zero (white). In the same volume (here surface), four acini of generation 3 are more efficient than one acinus of generation 4.
The oxygen conductance Y(Λ) of this Hilbert acinus model has to be computed numerically by using finite elements numerical solution of the Laplace equation with a triangular Delaunay–Voronoi tessellation and a P1-finite elements scheme (19). The unscreened perimeter length Λ is mathematically introduced through the boundary condition (11):
 |
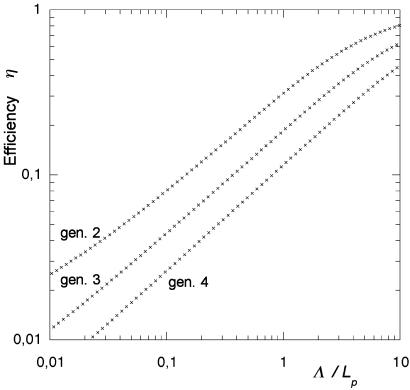
For the “Hilbert lung” of fourth generation, the mesh consisted in 27,753 triangles and 16,149 nodes. The computation of the Laplacian field for a given boundary condition (one L value) is of order 1 min on a Hewlett–Packard C160 workstation. The conductance can be expressed as Y(Λ) = W⋅Lp⋅η(Λ). Because (W⋅Lp) is the conductance without screening (for infinite Λ), the quantity η(Λ) ≤ 1 represents the acinus efficiency: it measures the fraction of the perimeter (or surface) that really works. Its dependence on Λ is shown in Fig. 5 for generations 2–4 of the Hilbert acinus. One observes two regimes: for small Λ/Lp, the efficiencies follow a power law with an exponent of order 0.6, and smaller Hilbert acini have larger efficiency. For very large Λ, the efficiency is 1. Realistic values of Λ/Lp for the acini of the lung are of the order of 2–5, as seen in Table 1. For each animal, the acinus efficiency can then be found from Fig. 5. One obtains efficiencies on the order of 10–20%. Screening then has a strong effect on the effective flux. As discussed below, this is what happens at rest.
Fig 5.
Efficiency η(Λ) of Hilbert acini of generations 2–4 versus the normalized unscreened perimeter length Λ/Lp. For small Λ, the efficiency increases with a power law of exponent close to 0.6. Larger acini are less efficient than smaller ones. For very large Λ, which corresponds to DO2,air/WO2 >>Lp, the efficiency saturates to 1.
The conclusion is that, for the acini to be optimized, their size should not be too large or, in other words: “smaller is better.” This result is independent of the model considered, because screening is a fundamental physical effect. The “smaller is better” concept is illustrated in Fig. 4, where the activity of four Hilbert acini of generation 3 is compared with that of one acinus of generation 4 occupying the same surface (for the same value Λ/ℓ = 200). The O2 concentration distribution is shown with colors decreasing from red to blue. The larger acinus model has lower O2 concentrations in the large peripheral part than the four smaller acini.
As a consequence, lung design must be based on a branched airway system that can feed a great number of not-too-large acini. There is then a direct link between different concepts: (i) the efficiency is maximized; (ii) there is no screening, so that the entire membrane works uniformly; and (iii) the individual small acini can work efficiently. Note, however, that the units should not be too small either, lest the system lose some of its flexibility, as explained below.
The Acinus Peclet Number and the Allometric Behavior of the Metabolic Rates.
In exercise, the high rates of O2 uptake require a high efficiency of the gas exchanger (1, 20), which could be hampered if a significant degree of screening occurs. This requirement raises the question whether the increased ventilation occurring in exercise reduces screening effects. We submit that this is the case, because of moving the transition point between convection and diffusion deeper into the acinus.
For a duct of diameter d, this transition is determined by the Peclet number P = U/{DO2,air/d}, the ratio of the flow velocity U to the diffusion velocity D/d. Depending on whether P is larger or smaller than 1, the transport is because of either ventilation or diffusion (21–23).
This common definition, however, is misleading here because in the acinus, oxygen has to spread into the acinar space and diffuse to the bottom of the alveolar sacs along the branched duct system. To find the transition from convection to diffusion in this specific acinar geometry, we propose introducing an “acinus Peclet number” Pa, which compares U with the mean diffusion velocity to reach the deeper regions of the acinus. At any branching generation Z, the distance to cross to the end of the sacs is of order (Zmax − Z)λ, where λ is the mean length of an acinar duct (Fig. 2). The “acinus Peclet number” Pa is then defined as
 |
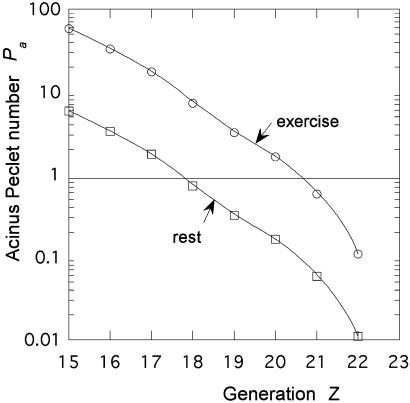
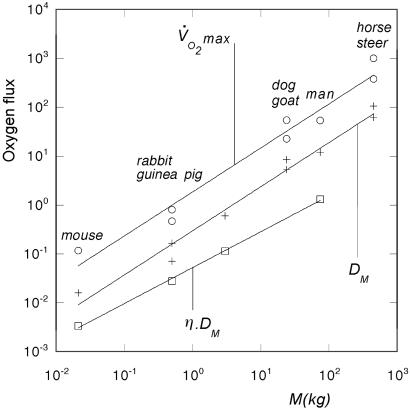
where the flow velocity U(Z) at stage Z is found from the branched airway morphometry (1, 2). This velocity depends on the breathing regime. For humans under exercise conditions, the air velocity is increased by a factor of order 10 above rest at all levels of the airway tree (1, 3). The resulting values of Pa are shown in Fig. 6 for the human lung. One observes that the convection–diffusion transition (Pa = 1) occurs for (Zmax − Z) of order 5 at rest and 2 in exercise. Using an average (Zmax − Z) value of order 2, one can estimate that the part of the exchanger where O2 is moved purely by diffusion has a volume of the order of Va/16 ≈ 1.4⋅10−3⋅cm3. The corresponding surface is also divided by 16, whereas the diameter L is divided by 2.5. The perimeter Lp of such a subregion of the acinus is then of order 2.3 cm, now much smaller than the length Λ ≈ 30 cm (Table 1). This evaluation suggests that, under exercise conditions, the region beyond Z = 21 may behave as an optimized (i.e., unscreened) diffusion cell. In these conditions, the total lung diffusive conductance is DM = WO2 × SL = β⋅DO2,water × SL/τ, where SL is the total acinar surface of the lung (7). This quantity can be computed from morphometric data and compared with the experimental metabolic rates in exercise V̇O2max shown in Table 2. The allometric plots of Fig. 7 demonstrate that both V̇O2max and DM follow a power law relation with the same slope close to 0.9. It is well established that the allometric slope of V̇O2max is steeper than that of resting VO2 (1, 20, 24).
Fig 6.
Variation of the human acinus Peclet number at exercise and at rest as a function of the depth in the acinar pathway. One observes a large shift between rest and exercise. The transition from convection to diffusion is moved from generation 18 to 21.
Table 2.
Morphometric data, membrane conductance DM, and maximal oxygen consumption V̇O2max for mammalian lungs
| Species | Mass, kg | Acinar surface SL, m2 | Membrane thickness τ, μm | DM, ml/sec⋅torr | V̇O2max, ml/sec | V̇O2max/DM, torr |
|---|---|---|---|---|---|---|
| Mouse | 0.021 | 0.0935 | 0.61 | 0.016 | 0.117 | 7.31 |
| Guinea pig | 0.5 | 0.7 | 1.02 | 0.0707 | — | 4.87 |
| Rat | 0.5 | 1.21 | 0.75 | 0.165 | 0.805 | 6.57 |
| Rabbit | 3 | 5.86 | 1.0 | 0.604 | — | — |
| Goat | 24 | 58.3 | 1.125 | 5.34 | 22.8 | 4.27 |
| Dog | 24 | 66 | 0.79 | 8.54 | 55.0 | 6.44 |
| Human | 74 | 130 | 1.11 | 5.846 | 54.0 | 4.47 |
| Steer | 450 | 697.5 | 1.15 | 62.45 | 382.5 | 6.12 |
| Horse | 450 | 1,180 | 1.15 | 105.65 | 1,003.5 | 9.49 |
Fig 7.
Allometric relation of oxygen flux to body mass: maximum oxygen consumption at exercise V̇O2max [in ml(standard temperature and pressure)/sec], geometrical diffusing capacity DM, and screened diffusion capacity η⋅DM [both in ml(standard temperature and pressure)/torr⋅sec] in the Hilbert acinus model (data from Tables 1 and 2). The allometric exponents are found to be 0.902, 0.900, and 0.735, respectively.
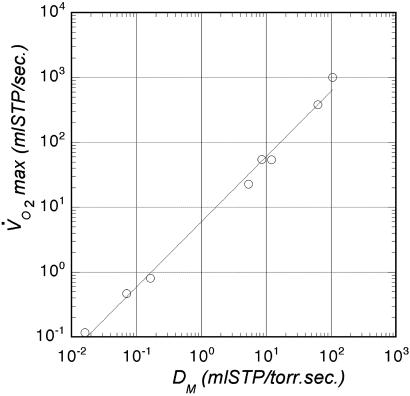
Note that, on the allometric plot, the differences between athletic and nonathletic species like dog/goat and horse/steer (20, 25) appear as an additional uncertainty, because they have the same mass. In that sense, if one wishes to really correlate the purely physiological V̇O2max with the purely geometrical DM, one should plot directly one as a function of the other. This plot is shown in Fig. 8, where we find a slope of 1.005 with tight correlation. This result suggests that the geometric characteristics of the pulmonary gas exchanger are perfectly matched to the maximal rates of O2 uptake in exercise, independent of body size or lifestyle. There is no diffusion screening under these limiting conditions.
Fig 8.
Relation between the physiological V̇O2max and the purely geometrical value of DM. The adjusted exponent is found to be equal to 1.005.
Screening, however, is effective at rest. This fact can be studied by using the efficiency values estimated from the Hilbert model with resting ventilation rates (Table 1). In analogy to the analysis in exercise, we would predict that resting or standard metabolic rates should be proportional to η(Λ) × DM. These values are also plotted in Fig. 7. The best power law fit of η(Λ) × DM versus animal mass yields an exponent 0.73, which is similar to the value of 0.75 found experimentally for the standard metabolic rate of mammals over a wider range of animal mass (26). It is difficult to discuss in greater detail this question, because the efficiency is computed for the Hilbert geometry, which is clearly oversimplified and the range of data points is too small. However, a general trend is apparent: larger animals with their larger acini are subject to a higher degree of screening at rest than smaller animals, a difference that disappears in exercise.
The exponent of 3/4 has been suggested to be an optimal value (27) for hydrodynamic fluid transport in branched systems. Here, the exponent 0.73 cannot be taken to correspond to an optimal value, because it is the result of partial inefficiency.
Note also that the ratio V̇O2max/DM measures an equivalent pressure difference of the order of 5−10 torr, a value smaller than expected by nearly one order of magnitude (1, 28). This discrepancy can be explained by two effects. First, our analysis does not account for the kinetics of O2 binding to hemoglobin (29), which may act as a barrier in series with the membrane diffusion. Second, the cyclic character of the breathing regime should be considered. The above analysis relates only to the inspiration phase of the respiratory cycle when the diffusion source is gradually moved into the acinus. During expiration, however, the conditions are completely different. The convection–diffusion transition point moves toward the bronchi, so that strong diffusion screening should exist during expiration. The peak oxygen flux then corresponds to an unscreened regime only during a fraction of the respiratory cycle, namely when the diffusion source is deep inside the subacinus, i.e., during or at the end of inspiration. In other terms, the effective duty cycle of the system could have a value significantly smaller than 1.
Discussion
The above simplified model neglects several factors that may affect the quantitative conclusions. For instance, because DO2 in tissue is smaller than in water (28), the value of Λ is somewhat underestimated. Also the Hilbert acinus is a two-dimensional model, whereas the real acinus is three-dimensional. But, because the real acinus is also a branched system, the conclusions should still remain essentially correct. Let us therefore mention some of the possible consequences of the existence of screening phenomena in pulmonary acini.
The first consequence is the observed large flexibility in the respiratory flux between rest and exercise. Because real acini are somewhat larger than the “best” acini in terms of diffusion efficiency, there is a gain in oxygen absorption by breathing more deeply, as occurs in exercise. This increased ventilation transfers the diffusion source deeper into the organ and the air feeds smaller subparts of the organ that then become more efficient (see Fig. 3c).
These facts now suggest that considerations of structure–function relations that result in diffusion screening in the acinus may be relevant in some physiological situations related to differences in the size of acini. If acini are small, such as in small animals (13) or in babies (30), the respiratory flexibility between rest and exercise should be more limited. Conversely, when acini become enlarged, such as occurs in the residual lung after pneumonectomy (31), diffusion screening at rest could be exaggerated. In pathological conditions such as emphysema, diffusion screening in the much-enlarged acini may well constitute an additional factor in the impairment of gas exchange. If the permeability of the gas exchanger becomes reduced, such as in some cases of pulmonary edema or fibrosis, screening may be reduced, but this change is of not much benefit, because it is counterfeited by the impairment of gas exchange.
Note that the same considerations can be extended to the gills of fishes (32). As fish breathe in water, Λ is equal to the membrane thickness (of order 40–60 microns). In that case, a convoluted surface would be highly inefficient, which is what is found, because the gills have a regular structure that corresponds to Df = 2 and a size of order Λ.
The lung also has to excrete carbon dioxide, and one should therefore evoke the role of screening in that reversed case. Now the diffusion source is the entire acinus but the value of unscreened perimeter Λ is about 20 times smaller for CO2 than for O2, because the solubility of CO2 is about 20 times larger than that of oxygen. A small Λ value corresponds to strong screening, which means that the acinus is working poorly as a CO2 exchanger, and that the CO2 partial pressure remains high in the deeper and larger parts of the acinus. This could indeed be an important factor to consider in acid-bases regulation (28).
Conclusion
This study was based on theoretical considerations of the purely physicochemical processes of diffusion and permeation of oxygen to and through irregular surfaces, compared with experimental results on the morphometric and physiological properties of mammalian lungs. The essential result of this comparison is that the size and structure of the acini in mammalian lungs are such that strong diffusion screening and a consequent poor efficiency of O2 uptake are avoided. The oxygen diffusivity in air and the permeability characteristics of the alveolar surface determine a critical parameter Λ called the unscreened perimeter length. This physical length has to be related to morphometric characteristics of the acinus, namely to the perimeter of the gas-exchange surface on a planar cut of the acinus. This perimeter must be smaller than Λ to allow O2 to reach even the deepest gas-exchange units. Too large acini would therefore be poorly efficient. This comparison provides a scale to the mammalian acini, up to now considered as a purely empirical morphometric fact. As a consequence, to be efficient, the gas-exchange surface of the lung must be divided into a large number of small acini connected to a branched conducting airway system, which is found to be the case.
Acknowledgments
We thank Dr. Hiroko Kitaoka for useful discussions.
References
- 1.Weibel E. R., (1984) The Pathway for Oxygen (Harvard Univ. Press, Cambridge, MA).
- 2.Weibel E. R. (1997) in The Lung: Scientific Foundations, eds. Crystal, R. G., West, J. B., Weibel, E. R. & Barnes, P. J. (Lippincott–Raven, Philadelphia), Vol. 2, pp. 1061–1071. [Google Scholar]
- 3.Sapoval B., Filoche, M. & Weibel, E. R. (2001) in Branching in Nature, eds. Fleury, V., Gouyet, J. F. & Leonetti, M. (EDP Science, Paris), pp. 225–242.
- 4.Piiper J. (1979) Fed. Proc. 38, 17-21. [PubMed] [Google Scholar]
- 5.Sapoval B. (1994) Phys. Rev. Lett. 73, 3314-3316. [DOI] [PubMed] [Google Scholar]
- 6.Sapoval B. (1994) in Fractals in Biology and Medicine, eds. Nonnenmacher, T. F., Losa, G. A. & Weibel, E. R. (Birkhauser, Basel), pp. 241–249.
- 7.Weibel E. R., Federspiel, W. J., Fryder-Doffey, F., Hsia, C. C., Konig, M., Stalder-Navarro, V. & Vock, R. (1993) Respir. Physiol. 93, 125-149. [DOI] [PubMed] [Google Scholar]
- 8.Weibel E. R., (1980) Stereological Methods (Academic, London), Vol. 2.
- 9.Sapoval B. (1996) in Fractals and Disordered Systems, eds. Bunde, A. & Havlin, S. (Springer, Berlin), pp. 232–261.
- 10.Sapoval B. (1994) Pour la Science 198, 30-37. [Google Scholar]
- 11.Sapoval B., Filoche, M., Karamanos, K. & Brizzi, R. (1999) Eur. Phys. J. B 9, 739-753. [Google Scholar]
- 12.Haefeli-Bleuer B. & Weibel, E. R. (1988) Anat. Rec. 220, 401-414. [DOI] [PubMed] [Google Scholar]
- 13.Rodriguez M., Bur, S., Favre, A. & Weibel, E. R. (1987) Am. J. Anat. 180, 143-155. [DOI] [PubMed] [Google Scholar]
- 14.Mandelbrot B., (1982) The Fractal Geometry of Nature (Freeman, San Francisco).
- 15.Peitgen H.-O., Jürgens, H. & Saupe, D., (1992) Chaos and Fractals (Springer, New York), pp. 388.
- 16.Mandelbrot B., (1978) Fractals: Form, Chance and Dimension (Freeman, San Francisco).
- 17.Sapoval B., (1997) Universalités et Fractales (Flammarion, Paris).
- 18.Kitaoka H., Tamura, S. & Takaki, R. (2000) J. Appl. Physiol. 88, 2260-2268. [DOI] [PubMed] [Google Scholar]
- 19.Bernadou M., George, P. L., Joley, P., Lang, F., Perronnet, A., Soltel, E., Steer, D., Vonderborck, G., Vidroscu, M., et al., (1985) Une Bibliothèque Modulaire d'Éléments Finis (INRIA, Paris).
- 20.Weibel E. R., (2000) Symmorphosis: On Form and Function in Shaping Life (Harvard Univ. Press, Cambridge, MA).
- 21.Incropera F. P. & DeWitt, D. P., (1996) Fundamentals of Heat and Mass Transfer (Wiley, New York).
- 22.Verbanck S., Weibel, E. R. & Paiva, M. (1993) J. Appl. Physiol. 75, 441-451. [DOI] [PubMed] [Google Scholar]
- 23.Paiva M., (1985) Lung Biology in Health and Disease (Dekker, New York), Vol. 25, pp. 221–285. [Google Scholar]
- 24.Taylor C. R., Maloiy, G. M., Weibel, E. R., Langman, V. A., Kamau, J. M., Seeherman, H. J. & Heglund, N. C. (1981) Respir. Physiol. 44, 25-37. [DOI] [PubMed] [Google Scholar]
- 25.Taylor C. R., Karas, R. H., Weibel, E. R. & Hoppeler, H. (1987) Respir. Physiol. 69, 7-26. [DOI] [PubMed] [Google Scholar]
- 26.Schmidt-Nielsen K., (1984) Scaling: Why Is Animal Size So Important? (Cambridge Univ. Press, Cambridge, U.K.).
- 27.West G. B., Brown, J. H. & Enquist, B. J. (1997) Science 276, 122-126. [DOI] [PubMed] [Google Scholar]
- 28.Dejours P., (1981) Principles of Comparative Respiratory Physiology (Elsevier North–Holland, Amsterdam).
- 29.Paiva M. & Engel, L. A. (1985) Respir. Physiol. 62, 257-272. [DOI] [PubMed] [Google Scholar]
- 30.Osborne D. R., Effman, E. L. & Hedlund, L. W. (1983) Am. J. Roentgenol. 140, 449-454. [DOI] [PubMed] [Google Scholar]
- 31.Hsia C. C. W., Herazo, L. F., Fryder-Doffey, F. & Weibel, E. R. (1994) J. Clin. Invest. 94, 405-412. [DOI] [PMC free article] [PubMed] [Google Scholar]
- 32.Beaumont A. & Cassier, P., (1978) Biologie Animale (Dunod Université, Paris), pp. 443.
- 33.Constantinopol M., Jones, J. H., Weibel, E. R., Taylor, C. R., Lindholm, A. & Karas, R. H. (1989) J. Appl. Physiol. 67, 871-878. [DOI] [PubMed] [Google Scholar]
- 34.Gehr P., Bachofen, M. & Weibel, E. R. (1978) Respir. Physiol. 32, 121-140. [DOI] [PubMed] [Google Scholar]
- 35.Hoppeler H., Altpeter, E., Wagner, M., Turner, D. L., Hokanson, J., Konig, M., Stalder-Navarro, V. P. & Weibel, E. R. (1995) Respir. Physiol. 101, 189-198. [DOI] [PubMed] [Google Scholar]
- 36.Hoppeler H., Lindstedt, S. L., Uhlmann, E., Niesel, A., Cruz-Orive, L. M. & Weibel, E. R. (1984) J. Comp. Physiol. B 155, 51-61. [Google Scholar]
- 37.Seeherman H. J., Taylor, C. R., Maloy, G. M. O. & Armstrong, R. B. (1981) Respir. Physiol. 44, 11-24. [DOI] [PubMed] [Google Scholar]
- 38.Weibel E. R., Marques, L. B., Constantinopol, M., Doffey, F., Gehr, P. & Taylor, C. R. (1987) Respir. Physiol. 69, 81-100. [Google Scholar]


