

Abstract
The formation of an active dinitrogenase requires the synthesis and the insertion of the iron-molybdenum cofactor (FeMo-co) into a presynthesized apodinitrogenase. In Azotobacter vinelandii, NafY (also known as γ protein) has been proposed to be a FeMo-co insertase because of its ability to bind FeMo-co and apodinitrogenase. Here we report the purification and biochemical characterization of NafY and reach the following conclusions. First, NafY is a 26-kDa monomeric protein that binds one molecule of FeMo-co with very high affinity (Kd ≈ 60 nm); second, the NafY-FeMo-co complex exhibits a S = 3/2 EPR signal with features similar to the signals for extracted FeMo-co and the M center of dinitrogenase; third, site-directed mutagenesis of nafY indicates that the His121 residue of NafY is involved in cofactor binding; and fourth, NafY binding to apodinitrogenase or to FeMo-co does not require the presence of any additional protein. In addition, we have obtained evidence that suggests the ability of NafY to bind NifB-co, an FeS cluster of unknown structure that is a biosynthetic precursor to FeMo-co.
Nitrogenase catalyzes the reduction of nitrogen gas to ammonium in an ATP- and reductant-dependent reaction. It is one of the best characterized metalloenzymes and is an excellent model for elucidating metalloprotein assembly. Nitrogenase is composed of two oxygen-labile metalloproteins: dinitrogenase and dinitrogenase reductase (1, 2). Dinitrogenase (also termed component I or iron-molybdenum protein) is a 240-kDa α2β2 tetramer of the nifD and nifK gene products (3, 4). Each αβ nitrogenase dimer contains an iron-molybdenum cofactor (FeMo-co)1 and a P cluster (4, 5). Dinitrogenase reductase (also termed component II or iron protein) is a 60-kDa α2 dimer of the nifH gene product that contains a single 4Fe-4S center coordinated between the two subunits (6). In contrast to the α2β2 subunit composition of the mature dinitrogenase, apodinitrogenase (FeMo-co-deficient) from Klebsiella pneumoniae or Azotobacter vinelandii strains with mutations in nifB, nifN, or nifE have a hexameric composition (α2β2γ2). The hexameric apodinitrogenase can be activated in vitro by the simple addition of purified FeMo-co (7, 8). In K. pneumoniae, the γ subunit has been identified as the product of the nifY gene (7, 9), whereas in A. vinelandii it is the product of the non-nif gene termed nafY (nitrogenase accessory factor Y) (10). On the other hand, apodinitrogenase from a ΔnifH mutant strain has a tetrameric composition (α2β2) and is not readily activated by purified FeMo-co (11, 12).
There are three forms of NafY present in extracts of A. vinelandii: an apodinitrogenase-associated form, an unassociated form proposed to exist as a homodimer, and a FeMo-co-associated form (13). NafY serves as a “molecular prop” whose function is to maintain the conformation of the FeMo-co-deficient apodinitrogenase competent for FeMo-co insertion (7, 9, 13, 14). FeMo-co is found buried, and thus inaccessible, within the protein in the mature α2β2 dinitrogenase. It is believed that the maturation of apodinitrogenase occurs in several steps. The α2β2 form of apodinitrogenase is synthesized having an inaccessible FeMo-co site. The FeMo-co site in the α2β2 form is then made accessible through a reaction that requires dinitrogenase reductase and MgATP (11). The dinitrogenase reductase-dependent maturation of apodinitrogenase promotes the binding of γ (NafY) and its conversion to the stabilized α2β2γ2 form. Finally, FeMo-co is inserted, and NafY disassociates from the mature dinitrogenase. Consistent with this notion, it has been recently shown that a deletion in nafY halves the competency of apodinitrogenase for FeMo-co insertion in Azotobacter extracts (10). The ability of NafY to bind separately to free FeMo-co or to apodinitrogenase led Roberts and co-workers (13) to propose that NafY was also a FeMo-co insertase. This proposal remains controversial because it has been shown that NafY is dispensable for the insertion of FeMo-co into apodinitrogenase (10, 15).
We overexpressed NafY in Escherichia coli cells and found that the purified protein has an N-terminal domain and a C-terminal domain. The C-terminal domain of NafY is conserved among the NifX, NifY, VnfX, and NifB family of proteins and has been referred to as the “core domain” of NafY. The core domain is able to bind to FeMo-co but unable to bind to apodinitrogenase (16). The crystal structure of the core domain has been determined and shown to consist of a five-stranded β-sheet flanked by five α-helices (16). Here we report on the biochemical properties of the purified NafY protein and the NafY-FeMo-co complex. We also present data suggesting that the His121 amino acid residue of NafY is involved in FeMo-co binding.
EXPERIMENTAL PROCEDURES
Bacterial Strains and Growth Conditions
A. vinelandii strain DJ (wild type) was obtained from D. R. Dean (Department of Biochemistry, Virginia Technical Institute, Blacksburg, VA). Strain UW146 (nifB-nafY) has been described previously (10). Growth in the presence of molybdate, nif derepression, and cell breakage has been described (17). E. coli DH5α and BL21 (pREP-4) strains were grown in Luria-Bertani medium at 37 °C with shaking (250 rpm). For growth of E. coli on plates, medium solidified with 1.5% agar was used. Antibiotics were used at standard concentrations (18).
Expression and Purification of NafY
Overproduction of NafY in E. coli was accomplished by fusing a nafY gene cartridge to the glutathione S-transferase (GST) gene, whose expression is controlled by a tac promoter. Plasmid pRHB62 contains the nafY gene cartridge ligated into the pGEX-4T-3 plasmid (Amersham Biosciences), which incorporates a thrombin cleavage site to remove GST from the fusion partner. The overproduction of GST-NafY, purification of the NafY fusion protein, and separation of the GST moiety from NafY using thrombin were performed as described previously (16). A typical purification procedure yielded 15 mg of NafY from 500 ml of cell culture. The preparations of purified NafY were supplemented with glycerol to 10% (v/v), made anaerobic through degassing with alternate cycles of vacuum and flushing with argon gas, and frozen as droplets into liquid nitrogen until used.
When pure preparations of the GST-NafY fusion protein were required, the purification protocol was identical to that of NafY, but the incubation with thrombin protease was omitted, and GST-NafY was eluted from the glutathione-Sepharose column with 5 column volumes of 10 mm reduced glutathione in PBS (10 mm Na2HPO4, 1.8 mM KH2PO4, 140 mM NaCl, 2.7 mM KCl, pH 7.4). The eluted GST-NafY protein had some minor protein contaminants at this point, and the preparation was loaded into a 1 cm × 10 cm Mono-Q column (Amersham Biosciences) equilibrated in PBS for further purification. The column was washed with 1 column volume of PBS, and proteins were eluted from the column using a linear 150 –500 mm NaCl gradient in PBS. GST-NafY eluted at about 350 mm NaCl and was estimated to be >95% pure based on SDS-PAGE analysis.
Site-directed Mutagenesis of nafY
Generation of site-directed mutations in nafY was carried out using plasmid pRHB62 as template and the QuikChange kit (Stratagene) according to the manufacturer’s recommendations. The presence of the introduced mutations was confirmed by sequencing. Plasmids pRHB68 (C166S), pRHB69 (C166A), pRHB70 (H121L), pRHB71 (C125A), and pRHB72 (C125A,H188L) were generated. Plasmids encoding NafY variants were transferred to E. coli strain BL21 (pREP-4) by transformation. The overexpression and purification of NafY variants was carried out as described above for the wild-type NafY.
Purification of Other Components
Apodinitrogenase was purified in its NafY-deficient α2β2 form by affinity chromatography utilizing the GST-NafY fusion protein bound to glutathione-Sepharose 4B resin (>95% purity).2 The resultant protein was stored anaerobically in liquid nitrogen until used. Methods for the purification of FeMo-co (19) and NifB-co (20) have been described previously.
Determination of the Native Molecular Mass of NafY
The native molecular mass of NafY was determined by equilibrium sedimentation of pure NafY in 0.2 m sodium phosphate buffer, 0.1 m NaCl, pH 7.5. Equilibrium sedimentation experiments were performed in a Beckman XL-A analytical ultracentrifuge using 12-mm double sector charcoal-filled Epon centerpieces. Three 100-μl samples were prepared by dilution of a dialyzed stock solution with its dialysate to give concentrations of 0.25, 0.5, and 0.75 mg of NafY/ml. 105 μl of dialysate were in the reference sector of each cell. Concentration gradients were recorded at 280 nm every 3–4 h until the gradients were superimposible. Equilibrium data were attained at 10,000 rpm and 17,300 rpm at 20 °C.
Gel filtration chromatography experiments were performed by applying 100 μl of sample (containing 80 μg of NafY) onto a Superose 6, Superdex 200, or a Sephacryl S-200 column connected to an FPLC apparatus (Amersham Biosciences). Columns were 1 cm diameter × 30 cm long. PBS buffer and a 0.5 ml/min flow rate were used. When FeMo-co was included in the analysis, PBS was made anaerobic by sparging with nitrogen for 2 h and then adding 0.1 mm sodium dithionite.
Quantitation of the Affinity of NafY for FeMo-co and Interaction between NafY and NifB-co
The Kd of the NafY-FeMo-co complex was estimated using the equation developed by Lundblad et al. (21), after measuring the changes in the intrinsic fluorescence of NafY upon FeMo-co binding. Fluorescence changes in NafY were recorded at room temperature with a PerkinElmer Life Sciences LS 50 B spectrofluorometer using pure NafY protein in PBS supplemented with 10% glycerol. The instrument settings were: λex = 295 nm; excitation slit, 2.5 nm; λem = 354 nm; and emission slit, 7.5 nm. The values were corrected for dilution and for inner filter effects. The interaction between NafY and NifB-co was studied measuring the changes in the intrinsic fluorescence of NafY because of the presence of increasing concentrations of NifB-co. Fluorescence changes in NafY were recorded as above. The values were corrected for dilution and for inner filter effects.
Determination of the Number of FeMo-co-binding Sites in NafY
Purified NafY and isolated FeMo-co were used to determine the stoichiometry of the binding. All glassware was rinsed with 4 n HCl overnight to remove traces of contaminating molybdenum and iron and then rinsed thoroughly with deionized water. An amount of FeMo-co equivalent to 10 nmol of molybdenum was added to 3 nmol of NafY in 1.35 ml of anaerobic 25 mm Tris-HCl buffer, 1 mm sodium dithionite, pH 7.5. The mixture was incubated for 5 min at room temperature and then applied to a 1 cm × 30 cm Superdex 200 column equilibrated in the same buffer to separate unbound FeMo-co from the NafY-FeMo-co complex. The protein sample was eluted in the same buffer and then subjected to protein and metal analyses. The iron and molybdenum contents of the protein samples were determined at the University of Georgia by inductively coupled plasma mass spectrometry.
SDS-PAGE and Immunoblot Analysis
The procedure for SDS-PAGE has been described (22). Immunoblot analysis was performed as described by Brandner et al. (23). Purified preparations of NafY described in this work were used to raise anti-NafY antibodies at the Polyclonal Antibody Service of the University of Wisconsin-Madison.
Anoxic Native Gel Electrophoresis and Iron Staining
The proteins were separated on anoxic native gels with a 7–16% acrylamide and a 0 –20% sucrose gradient as described (11). When needed, native gels were stained for iron as described previously (24).
Protein Assays
The protein concentrations were determined by the bicinchoninic acid method using bovine serum albumin as standard (25).
EPR Analysis
We performed EPR analysis of the NafY-FeMo-co complex. The complex was generated by mixing an excess of NafY (3.5 mg, 130 nmol) and 50 nmol of FeMo-co in a total volume of 36.5 ml of anaerobic 25 mm Tris-HCl, 1 mm sodium dithionite, pH 7.5 buffer. The complex was then anaerobically concentrated in an Amicon cell, diluted, and reconcentrated with the same buffer until the concentration of N-methylformamide was under 1% (v/v). EPR was performed at a microwave frequency of 9.44 Ghz and a modulation amplitude of 10 millitesla using a Bruker ESP 300E EPR spectrometer equipped with a Bruker ER0815 frequency converter, a Bruker ER041 XG microwave bridge, and a Oxford ITC temperature controller.
RESULTS AND DISCUSSION
Overexpression and Purification of NafY and GST-NafY
The NafY protein from A. vinelandii was produced in E. coli BL21 (pREP-4) cells carrying pRHB62 plasmid as a GST-NafY fusion protein of about 50 kDa. Accumulation of soluble GST-NafY in crude extracts of BL21 cells was achieved in highly aerated cultures after incubation at 30 °C in the presence of 0.2 mm isopropyl-β-d-thiogalactopyranoside (Fig. 1, lane 2). (Incubation of BL21 cells at 37 °C and 1 mm isopropyl-β-d-thiogalactopyranoside resulted in the accumulation of insoluble GST-NafY.) The protocol for purification of NafY involved three steps: glutathione-Sepharose affinity chromatography, in situ digestion with thrombin to separate NafY from the GST moiety, and benzamidine-Sepharose affinity chromatography to remove the thrombin (see “Experimental Procedures” for details). The purity of NafY at the end of the process was determined to be >99% based on SDS-PAGE analysis (Fig. 1, lane 3). The UV-visible absorption spectrum of the as-isolated NafY protein has a single peak with a maximum at 281 nm and is featureless in the 310 –900 nm range (data not shown). The as-isolated NafY protein does not contain significant levels of iron or molybdenum.
Fig. 1. SDS-PAGE analysis of purified NafY and GST-NafY proteins.
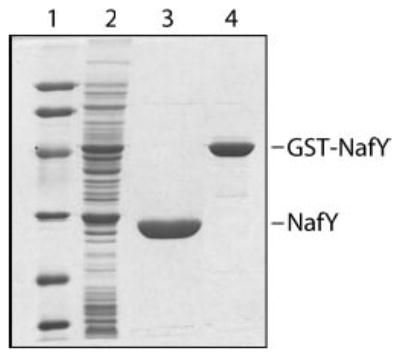
NafY and the GST-NafY fusion protein were purified from recombinant E. coli cells by affinity chromatography to glutathione-Sepharose (see “Experimental Procedures” for details). Lane 1, molecular mass markers (Bio-Rad low range markers: lysozyme, 14.4 kDa; trypsin inhibitor, 21.5 kDa; carbonic anhydrase, 31 kDa; ovalbumin, 45 kDa; serum albumin, 66.2 kDa; and phosphorylase b, 97.4 kDa); lane 2, cell-free extract of E. coli cells overexpressing NafY; lane 3, purified NafY; lane 4, purified GST-NafY fusion protein.
Purification of the GST-NafY fusion protein was performed in two steps: a glutathione-Sepharose affinity chromatography and a Mono-Q anion-exchange chromatography (see “Experimental Procedures”). The purity of GST-NafY at the end of the purification protocol was determined to be >95% based on SDS-PAGE analysis (Fig. 1, lane 4).
Unassociated and FeMo-co-Bound Forms of NafY Are Monomeric
We began characterizing the purified NafY by determining its molecular mass and quaternary structure. Homer et al. (13) had reported that, in cell-free extracts of A. vinelandii, NafY is a dimer of 46 kDa that monomerizes into 23-kDa subunits upon FeMo-co binding. The result was based on gel filtration chromatography using a Sephacryl resin. In the process of determining the molecular masses of the unassociated and the FeMo-co-bound forms of purified NafY, we found that both forms are monomeric under the conditions employed here.
Equilibrium centrifugation experiments were performed because they are less sensitive to protein shape-induced errors than gel filtration. The native molecular mass of NafY was determined in three different samples containing 0.25, 0.5, and 0.75 mg of NafY/ml. Analysis of the equilibrium centrifugation data yielded an average mass of 28,012 ± 134 Da for the unassociated NafY (Fig. 2A). This number is in good agreement with the predicted molecular mass of a NafY monomer as deduced from the nafY gene sequence (26,141 Da) and also with the 26,152 ± 3 Da number obtained by electrospray ionization mass spectrometry on several preparations of purified NafY (data not shown). Importantly, the analysis of the equilibrium centrifugation experiments showed no significant levels of NafY dimer formation in any of the three different concentrations of NafY tested (Keq for the dimer/monomer pair = 0.042 ± 0.008). These results clearly indicate that the unassociated form of NafY is a monomer.
Fig. 2. Molecular mass determination of NafY and the NafY-FeMo-co complex.
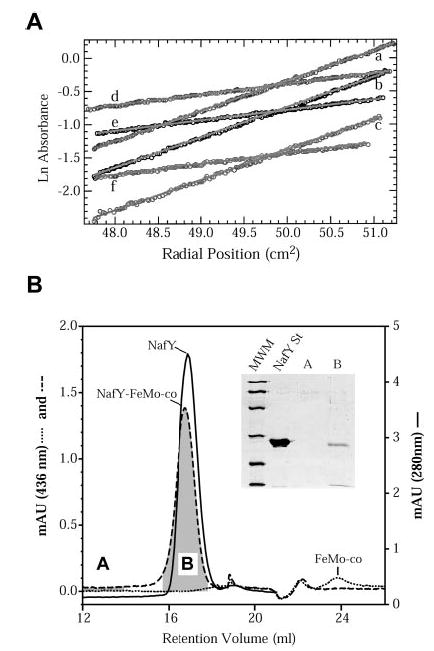
A, equilibrium radial absorbance profiles (circles) and linear fits for analytical ultracentrifugation measured at 10,000 rpm (curves d–f) and 17,300 rpm (curves a–c). NafY concentrations were 0.25 mg/ml (curves c and f), 0.5 mg/ml (curves b and e), and 0.75 mg/ml (curves a and d). B, gel filtration analysis of NafY and the NafY-FeMo-co complex. A Superose 6 FPLC column was used. The elution profile of NafY (solid line) was determined by absorbance at 280 nm. The elution profiles of unbound FeMo-co (dotted line) and NafY-bound FeMo-co (dashed line) were determined by absorbance at 436 nm. Aliquots from fractions A and B were subjected to SDS-PAGE to screen for the presence of NafY. MWM, Bio-Rad low-range molecular mass markers; NafY St, pure NafY loaded as a size standard. The same results were obtained when using a Superdex 200 or Sephacryl S-200 column.
We were not able to determine the molecular mass of the FeMo-co-bound form of NafY by equilibrium centrifugation because of technical problems with the O2 lability of FeMo-co. Therefore, for this analysis we performed gel filtration chromatography on Sephacryl S-200, Superose 6, or Superdex 200 FPLC columns and followed the elution profile of FeMo-co by measuring the absorbance at 436 nm. The NafY-FeMo-co complex is easily generated by mixing pure NafY and FeMo-co in anoxic buffer immediately before the chromatography and is stable during the gel filtration. Surprisingly, the 436-nm signal was detected as a 46-kDa species (Fig. 2B). This 46-kDa species corresponds to NafY-bound FeMo-co as demonstrated by the coelution of NafY and FeMo-co at the same fraction (shown by SDS-PAGE analysis in the inset of Fig. 2B). We also subjected the unassociated form of NafY to gel filtration chromatography under the same conditions and followed the elution profile by absorbance at 280 nm (Fig. 2B). Unassociated NafY behaves as a 44-kDa species. Therefore, both NafY and the NafY-FeMo-co complex exhibit the same retention volume, indicating that NafY does not change its association state upon FeMo-co binding.
The gel filtration results presented here differ from those reported previously. One explanation would be that the form of NafY present in crude extracts of A. vinelandii (studied in Ref. 13) behaves differently from the NafY purified from E. coli cells (studied here). However, this is unlikely because both proteins have identical migration patterns on anoxic native gel electrophoresis (data not shown). Our gel filtration and equilibrium centrifugation results also differ from each other. Although NafY behaves almost as a dimer in gel filtration, it clearly behaves as a monomer during equilibrium centrifugation. Equilibrium centrifugation is far less sensitive than gel filtration to errors because of anomalies in protein shape, and the simplest explanation is that the size of NafY is overestimated when analyzed by gel filtration chromatography because the shape of NafY would be very different from spherical. In any event, the results presented here suggest that: 1) NafY is a monomeric 26-kDa protein and 2) FeMo-co binding to NafY does not alter this monomeric state.
Purified NafY Is Able to Bind FeMo-co
The capability of purified NafY to bind FeMo-co was assayed by means of anoxic native gel electrophoresis. It has previously been shown that the FeMo-co-bound form of NafY migrates faster than the unassociated NafY in native gel electrophoresis of crude extracts of A. vinelandii (13). Here we show that purified NafY also shifts to a more quickly migrating species in native gels upon FeMo-co binding (compare lanes 1 and 2 in Fig. 3A). The presence of FeMo-co in the more quickly migrating species is supported by iron staining of the gel, where only the more quickly migrating species gives a positive iron stain (Fig. 3B, lane 2). Because the oligomerization state of NafY does not change upon FeMo-co binding, the migration shift of NafY in native gels suggests that the protein is either more compact in the presence of FeMo-co or that the net charge on the protein has changed. In addition, NafY mobility shift does not require the presence of any additional protein; therefore NafY alone is sufficient for FeMo-co binding. The GST-NafY fusion protein is also capable of binding FeMo-co and shifting to a more quickly migrating species in anoxic native gel electrophoresis (compare lanes 1 and 2 in Fig. 3B). It seems that the GST moiety of the GST-NafY fusion protein does not obstruct the FeMo-co-binding site present in NafY.
Fig. 3. Gel shift analysis demonstrating binding of purified NafY to FeMo-co.
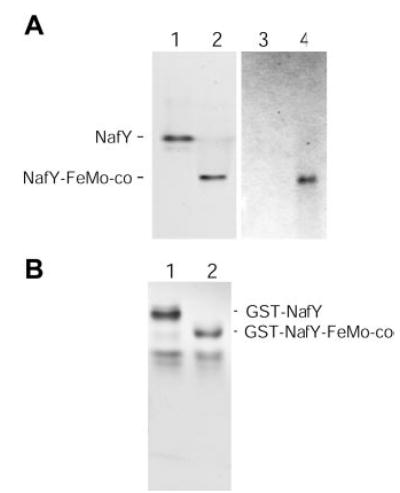
The samples were prepared in anaerobic 9-ml serum vials and contained 10 μg of NafY (or GST-NafY) in 150 μl of anaerobic buffer (25 mm Tris, 10% glycerol, pH 7.5). When indicated NafY was incubated with 1.25 nmol of purified FeMo-co for 5 min on ice to allow the binding of FeMo-co to NafY (A, lanes 2 and 4; B, lane 2). 50-μl samples were subsequently electrophoresed for 20 h in an anoxic native gel. A, anoxic native gel illustrating the shift in NafY mobility upon FeMo-co binding. Lanes 1 and 2 were stained with Coomassie, and lanes 3 and 4 were stained for iron. B, anoxic native gel stained with Coomassie, illustrating the shift in GST-NafY mobility upon FeMo-co binding.
We have also performed EPR analysis of the NafY-FeMo-co complex. The EPR spectrum of NafY-bound FeMo-co at 10 K retains the characteristic S = 3/2 signal (g = 4.42, 3.70, and 1.98) of the dithionite-reduced M center of dinitrogenase and N-methylformamide-extracted free FeMo-co (Fig. 4). Although the EPR spectral components of NafY-FeMo-co are broader than the dinitrogenase M center, the overall spectrum is better defined than free FeMo-co; the sharpening of the spectrum upon complexation of FeMo-co to NafY to is similar to the observed effect of thiophenol addition to free FeMo-co in N-methylformamide (26). The sharp feature at g = 2.03 in the NafY-FeMo-co spectrum is observed in variable amounts in different samples and is not present in the NafY spectrum (data not shown); therefore, it may arise from protic or oxic decomposition of FeMo-co. The small feature at g = 6.0 arises from an electronic excited state also present in the spectra of the M center and free FeMo-co (27). The EPR spectrum of NafY-FeMo-co establishes that no fundamental alteration of the cofactor occurs upon binding to NafY. It is proposed that the sharpness of the S = 3/2 signal from the M center is due to the coordination environment of FeMo-co in dinitrogenase. The broadness of the signal shown in Fig. 4 (curve b) implies that there is structural flexibility for FeMo-co within the complex.
Fig. 4. EPR analysis of the NafY-FeMo-co complex.

The complex was generated and concentrated as described under “Experimental Procedures.” EPR of the NafY-FeMo-co complex (curve b) was recorded at a microwave frequency of 9.44 Ghz, a power of 10 mW, a temperature of 10 K, and a modulation amplitude of 10 mT. The EPR spectra of pure dinitrogenase (curve a) and FeMo-co extracted in N-methylformamide (curve c) were obtained under the same conditions and included for comparison purposes.
NafY Binds One Molecule of FeMo-co with High Affinity
To calculate the dissociation constant of the NafY-FeMo-co complex, we needed to know the number of FeMo-co-binding sites in NafY. To address this question, the following experiment was performed. First, pure NafY was incubated with saturating amounts of FeMo-co to generate a NafY-FeMo-co complex; second, unbound FeMo-co was separated from the NafY-FeMo-co complex by anaerobic gel filtration in a Superdex 200 FPLC column; and third, protein, iron, and molybdenum contents of the fraction containing NafY (and bound FeMo-co) were determined, and their molar ratios were calculated. The result presented in Table I, where the protein:molybdenum:iron molar ratio obtained is close to 1:1:7, strongly suggests that NafY has one FeMo-co-binding site per monomer. In a parallel experiment with no FeMo-co added, the as-purified NafY shows no significant levels of iron and molybdenum.
Table I.
Metal contents of as-purified NafY and the in vitro generated NafY-FeMo-co complex
| Protein sample | Molybdenum | Iron |
|---|---|---|
| mol/mol NafY | mol/mol NafY | |
| NafY | NDa | ND |
| NafY-FeMo-co complexb | 1.2 ± 0.1 | 7.3 ± 1.3 |
ND, there were not detectable metal levels above the blank.
10 nmol of FeMo-co were added to 3 nmol of NafY in 1.35 ml of anaerobic Tris-HCl buffer and incubated for 5 min at room temperature. The mixture was subjected to gel filtration chromatography to remove unbound FeMo-co, and the NafY-FeMo-co complex was collected and subjected to protein and metal analyses. The values are the averages of two assays performed separately.
The fluorescence spectrum of NafY shows an excitation maximum at 283 nm and an emission maximum at 354 nm, indicating that the primary fluorophores are solvent-exposed tryptophanyl residues. The addition of FeMo-co to NafY partially quenched the fluorescence emission of the protein (Fig. 5A). The addition of saturating amounts of FeMo-co to NafY quenches up to 80% of the total fluorescence emission at 354 nm (represented in Fig. 5A by curve c obtained after addition of 4 nmol of FeMo-co to 1.5 nmol of NafY). Fig. 5B shows the titration of NafY fluorescence quenching by FeMo-co after being corrected for nonspecific quenching (see below). The quenching follows a hyperbolic response, and these data were used to determine a Kd of 62 nM for the NafY-FeMo-co complex. For this analysis, we used an equation (21) that takes into account the existence of one FeMo-co-binding site/NafY molecule and a situation of ligand depletion because a very important fraction of the total FeMo-co present in the assay is in the NafY-bound form. We performed parallel control reactions in which tryptophan or ovalbumin was substituting for NafY to subtract the effect of nonspecific quenching from the total quenching observed. The nonspecific quenching is probably due to interfering substances present in our preparations of FeMo-co (such as sodium dithionite) and correlates linearly to the FeMo-co added. A similar nonspecific fluorescence quenching is obtained when O2-denatured FeMo-co is added to NafY, suggesting that only intact FeMo-co binds to NafY (data not shown).
Fig. 5. Quenching of the intrinsic fluorescence of NafY upon FeMo-co binding.
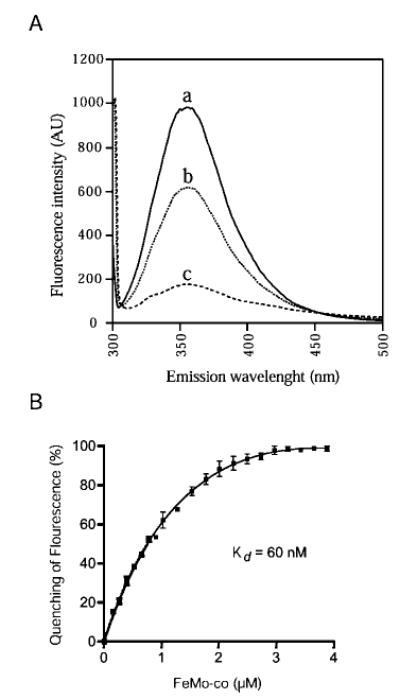
A, fluorescence emission spectra of NafY in the absence and the presence of FeMo-co. The reaction mixtures (1 ml of anoxic PBS, 10% glycerol) include: 1.5 nmol of NafY (curve a), 1.5 nmol of NafY plus 1 nmol FeMo-co (curve b), and 1.5 nmol of NafY plus 4 nmol FeMo-co (curve c). The instrument settings were: λex = 295 nm; excitation slit, 2.5 nm, λem = 300 –500 nm; and emission slit, 7.5 nm. Fluorescence intensity is given in arbitrary units. B, titration of the NafY fluorescence quenching with FeMo-co. The reaction mixtures (1 ml of anoxic PBS, 10% glycerol) include 1.5 nmol of purified NafY and increasing amounts of isolated FeMo-co. The Kd of the NafY-FeMo-co complex was estimated using the equation developed by (21). The instrument settings were: λex = 295 nm; excitation slit, 2.5 nm; λem = 354 nm; and emission slit, 7.5 nm.
In conclusion, these experiments demonstrate that the as-purified NafY protein retains the capability of binding FeMo-co with high affinity (Kd = 62 nm). FeMo-co is labile in an aqueous environment, even if it is kept strictly anaerobic (19). Because of this lability, it is thought to exist in protein-bound forms inside the cells. In extracts of A. vinelandii, FeMo-co accumulates into mature dinitrogenase or in NafY when dinitrogenase is absent. The high affinity of NafY for FeMo-co determined here is therefore not surprising. If the physiological concentration of FeMo-co in the cell lies into the nm range tested here, our results would be consistent with the idea of NafY working as a reservoir that stabilizes FeMo-co before insertion into apodinitrogenase. That being the case, one could expect little accumulation of FeMo-co in a mutant strain lacking both NafY and dinitrogenase. This hypothesis is currently under study.
The His121 Residue of NafY Is Involved in FeMo-co Binding
The α subunit of dinitrogenase binds FeMo-co covalently through the side chains of residues Cys275 (to the distal iron atom) and His442 (to the molybdenum atom). Although NafY and dinitrogenase have different foldings for FeMo-co binding, Cys and His residues on NafY are still good candidates to coordinate the cofactor. NafY has three cysteine residues (Cys125, Cys166, and Cys196) and three histidine residues (His35, His121, and His188). We have substituted for those Cys or His residues in NafY that are conserved (or lie in a conserved region) among NafY homologs (Fig. 6). H121L, C125A, C166A, C166S, and a double C125A,H188L variant of NafY have been generated. It is interesting to note that all the selected residues lie within the core domain of NafY, which has been shown to be sufficient for FeMo-co binding (16). The NafY variants have been overexpressed and purified from E. coli cells following the same protocol used for the wild type. The purity of all NafY-variant preparations was >95% as estimated by SDS-PAGE (Fig. 7).
Fig. 6. Amino acid sequence alignment of members of the NafY family of proteins illustrating the position of the mutated His and Cys residues within NafY.
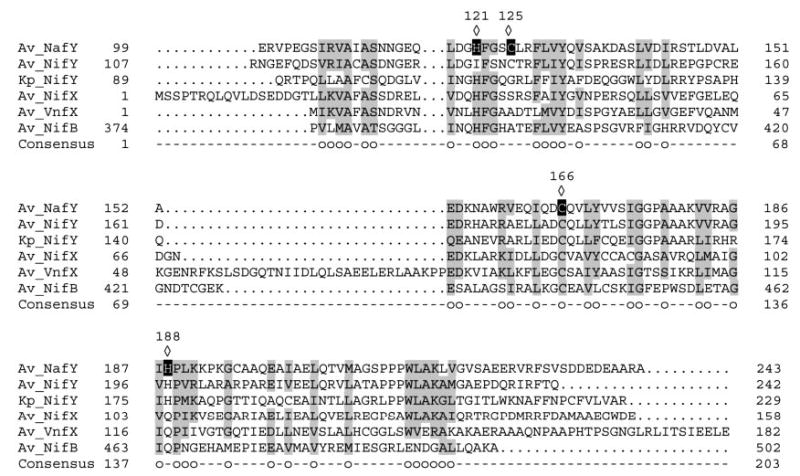
The entire sequence is shown for Av_NifX and Av_VnfX. Alignments of the conserved core domain (16) are shown for Av_NafY, Av_NifY, Kp_NifY, and Av_NifB. The amino acid sequences are indicated by the single-letter code. Gaps were introduced for optimal alignments. The diamonds point to amino acid residues changed by site-directed mutagenesis. The circles indicate amino acid residues identical or similar in five or more of the aligned proteins. Av, A. vinelandii; Kp, K. pneumoniae.
Fig. 7. SDS-PAGE analysis of purified mutant NafY variants.
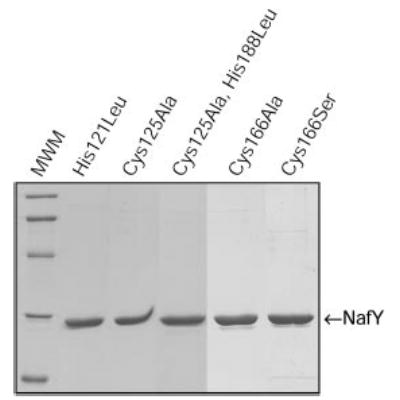
Samples of NafY mutant variants purified from recombinant E. coli cells (see “Experimental Procedures” for details) were resolved by SDS-PAGE and stained with Coomassie Brilliant Blue. The molecular mass standards (MWM) are: 97, 66, 45, 31, and 21 kDa.
The effect of these changes on FeMo-co binding by NafY was assayed by means of anoxic native gel electrophoresis. Each purified NafY variant was incubated with FeMo-co anaerobically for 5 min on ice, and the reaction mix was subjected to electrophoresis. The positions on the native gels of the different unassociated NafY variants (control reactions with no FeMo-co added to NafY) and their corresponding NafY-FeMo-co complexes were visualized by Coomassie staining (Fig. 8). The C125A variant and the C125A,H188L double variant of NafY show the same migration pattern as the wild-type NafY. These mutations have no apparent effect on FeMo-co binding. On the other hand, the H121L variant is clearly affected in its capability to bind FeMo-co (compare second and fourth lanes). Residue His121 is located on the surface of the core domain of NafY (16) and is conserved among NafY homologs with the exception of A. vinelandii NifY (Fig. 6). Our results suggest that His121 of NafY is involved in the coordination of FeMo-co. The analysis of the mutations in residue Cys166 is more complex because they have a partial inability to bind FeMo-co. The substitution of Cys by Ser in position 166 has a more profound effect than the substitution of Cys by Ala, which is difficult to understand if the side chain of Cys166 was coordinating the cofactor. Moreover, residue Cys166 is not solvent-exposed but is somewhat buried inside the core domain of NafY (16), and thus it is unlikely to be a direct ligand to FeMo-co. It is not clear whether the substitutions at position 166 are affecting FeMo-co binding directly or indirectly because of a change on the overall folding of NafY.
Fig. 8. Gel shift analysis of the interaction of purified NafY variants with FeMo-co.
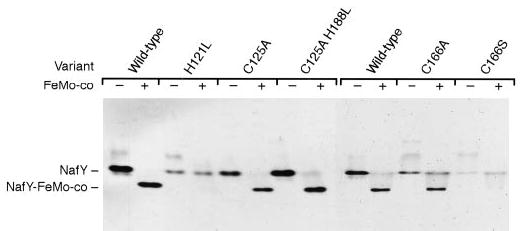
The samples were prepared in anaerobic 9-ml serum vials and contained 10 μg of the purified NafY variant in 150 μl of anaerobic buffer (25 mm Tris, 10% glycerol, pH 7.5). When indicated NafY was incubated with 1.25 nmol of purified FeMo-co for 5 min on ice to allow the binding of FeMo-co to NafY. 50-μl samples were subsequently electrophoresed for 20 h in an anoxic native gel that was finally stained with Coomassie Brilliant Blue.
All NafY variants were tested for apodinitrogenase binding as well. The migration pattern of the variants was identical to that of the wild-type NafY (see below), and it is concluded that none of these mutations affect the binding of NafY to apodinitrogenase (Fig. 9C). This result is not surprising considering that all of these changed residues are within the core domain of NafY, which does not bind to apodinitrogenase in the absence of the first domain. In conclusion, our site-directed mutagenesis data, in combination with the structural data obtained previously (16), suggest that residue His121 of NafY is involved in the coordination of FeMo-co.
Fig. 9. Immunoblot analysis of the interaction between NafY variants and the NafY-deficient α2β2 apodinitrogenase.

The samples were prepared in anaerobic 9-ml serum vials and contained 4 μg of the purified NafY variant in 100 μl of anaerobic buffer (25 mm Tris, 10% glycerol, pH 7.5). When indicated, 1.5 mg of extract from UW146 cells (nifBnafY) was added, and the samples were incubated for 5–10 min on ice to promote the interaction between NafY and apodinitrogenase. 25-μl aliquots were subsequently subjected to electrophoresis for 20 h in anoxic native gels and transferred to nitrocellulose membranes, and immunoblots were developed with antibodies to NafY. A, interaction of NafY and GST-NafY with apodinitrogenase present in extracts of UW146. B, interaction of NafY with purified NafY-deficient α2β2 apodinitrogenase (16 μg). C, interaction of NafY mutant variants with apodinitrogenase present in extracts of UW146.
Purified NafY and GST-NafY Proteins Are Able to Bind to α2β2 Apodinitrogenase from the Mutant Strain UW146 (nifB-nafY)
It is well known that in cell extracts of A. vinelandii NafY (γ) not only binds to FeMo-co but also binds to apodinitrogenase. In fact, cell extracts of the FeMo-co-deficient strain UW45 (nifB) present a stable hexameric apodinitrogenase with an α2β2γ2composition (8). We wanted to know whether our preparations of purified NafY retain this capability. Purified NafY was added to the cell-free extract of the FeMo-co-deficient, NafY-deficient A. vinelandii UW146 strain (nifBnafY) and incubated for 5 min on ice. The mix was electrophoresed on an anoxic native gel, and proteins were transferred to a nitro-cellulose membrane where an immunoblot was developed with antibodies to NafY (Fig. 9A). As expected, there was no reacting material in extracts of mutant UW146 (data not shown). When purified NafY was added to the extract of UW146, NafY shifted from its original nonassociated position to the apodinitrogenase-associated migrating position in the anoxic native gel. This is interpreted as a stable binding between NafY and apodinitrogenase. Interestingly, the GST-NafY fusion protein was also capable of binding apodinitrogenase when added to the extract of UW146, and this property has been used to purify α2β2 apodinitrogenase from UW146 cells.2 This demonstrates that both NafY and the GST-NafY fusion protein can be expressed and purified from E. coli cells and retain the capability to bind apodinitrogenase. Moreover, the interaction of NafY with α2β2 apodinitrogenase does not require the presence of any additional protein, as illustrated by the comigration of both proteins when a sample containing only pure α2β2 apodinitrogenase and NafY is subjected to anoxic native gel electrophoresis (Fig. 9B).
Interaction of NafY with NifB-co
NifB-co, the product of NifB, is an iron-sulfur cluster of unidentified structure that serves as the specific precursor for the biosynthesis of FeMo-co of Mo-nitrogenase, FeV-co of V-nitrogenase, and FeFe-co of Fe-only-nitrogenase (20, 28, 29). It has been previously shown that NifB-co binds to proteins involved in the biosynthesis of FeMo-co, such as NifX (30) and NifNE (31), or the biosynthesis of FeV-co, such as VnfX (32). Because NafY, NifX, and VnfX are homologs (10) and are proposed to have similar structures, the prediction is that NafY would also be able to bind NifB-co. However, no iron or sulfur has been found associated to NafY in the form of NifB-co or other intermediates when studied by anoxic native gel electrophoresis. Labeled iron and sulfur from NifB-co or labeled molybdenum from a FeMo-co precursor have been found associated to NafY only if all the components necessary for FeMo-co biosynthesis are present in the assay mixture (33, 34). These results have been taken as evidence of FeMo-co being synthesized and accumulated on NafY.
We have followed the changes in NafY fluorescence in the presence of NifB-co to detect a possible interaction between them. The addition of increasing amounts of NifB-co to a solution containing 1.5 μm of purified NafY partially quenched the fluorescence emission of NafY in a sigmoidal-like pattern (Fig. 10). An identical control reaction in which ovalbumin was substituting for NafY showed a small fluorescence quenching that correlated linearly to the amount of NifB-co added. This quenching is due to interfering substances present in our preparations of NifB-co. O2-denatured NifB-co failed to quench NafY fluorescence beyond the numbers of the control reaction (data not shown), indicating that the quenching effect on NafY is specifically due to the presence of intact NifB-co in the reaction mix.
Fig. 10. Titration of NafY fluorescence quenching with NifB-co.
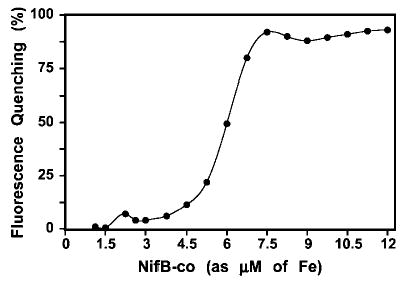
The reactions mixtures include 1.5 nmol of NafY and increasing amounts of isolated NifB-co in 1 ml of anoxic PBS plus 10% glycerol. The instrument settings were: λex = 295 nm; excitation slit, 2.5 nm; λem = 354 nm; and emission slit, 7.5 nm.
Although this result is not definitive proof of a binding between NafY and NifB-co, it strongly suggests that such interaction is taking place. This interaction has not been observed in previous anoxic native gel electrophoresis (33, 34) nor in our native gel electrophoresis experiments (data not shown). It is possible that the conditions used to assay the interaction of NifB-co and NafY by fluorescence are milder to the complex than those of native gel electrophoresis. It is noteworthy that no additional proteins are needed for the interaction between NafY and NifB-co. If the binding of NafY to NifB-co is relevant under physiological conditions, it may have some implications in our understanding of the biosynthesis of FeMo-co. Siemann et al. (35) describe a residual FeMo-co biosynthetic activity in a nifE mutant strain of Rhodobacter capsulatus. The authors suggest that, in the absence of NifNE, NifB-co could be further transformed into FeMo-co while bound to a NafY-like protein. However, there is currently no evidence supporting the involvement of NafY in the biosynthesis of FeMo-co in A. vinelandii.
Conclusions
The properties of NafY (γ) in extracts of A. vinelandii have been well documented (13). The association of NafY with FeMo-co has been used to follow the in vitro biosynthesis of FeMo-co (36, 37) and the interaction of NafY with the FeMo-co-deficient apodinitrogenase used to follow the maturation process of apodinitrogenase (11). However, little was known about the biochemical properties of NafY or the NafY-FeMo-co complex.
This study shows that, as purified, NafY is a 26-kDa monomeric protein that retains the capability of binding FeMo-co and apodinitrogenase. NafY has high affinity for FeMo-co (Kd = 62 nm) and does not require any additional factor(s) to bind either to FeMo-co or to apodinitrogenase. The EPR spectrum of the NafY-bound FeMo-co retains the characteristic resting state S = 3/2 signal of the cofactor, but its broadness resembles that of free FeMo-co. Site-directed mutagenesis experiments suggest that of all conserved His or Cys residues in NafY, only His121 is directly involved in cofactor binding. Finally, we have obtained preliminary data showing that NafY also possess the ability to interact with NifB-co.
Acknowledgments
We thank Dr. Carmen Rüttimann-Johnson and Dr. Gary Roberts for helpful discussions. Thanks to Montserrat Gálvez and Carolyn Brown for growing bacterial cultures. Thanks to Dr. Simon George for help with the EPR instrument.
Footnotes
This work was supported by NIGMS, National Institutes of Health Grant 35332 (to P. W. L.). The costs of publication of this article were defrayed in part by the payment of page charges. This article must therefore be hereby marked “advertisement” in accordance with 18 U.S.C. Section 1734 solely to indicate this fact.
This paper is dedicated to the memory of Luisa Alvarez.
The abbreviations used are: FeMo-co, iron-molybdenum cofactor; NifB-co, NifB cofactor; GST, glutathione S-transferase; PBS, phosphate-buffered saline; FPLC, fast protein liquid chromatography.
References
- 1.Bulen WA, LeComte JR. Proc Natl Acad Sci U S A. 1966;56:979 –986. doi: 10.1073/pnas.56.3.979. [DOI] [PMC free article] [PubMed] [Google Scholar]
- 2.Hageman RV, Burris RH. Proc Natl Acad Sci U S A. 1978;75:2699 –2702. doi: 10.1073/pnas.75.6.2699. [DOI] [PMC free article] [PubMed] [Google Scholar]
- 3.Shah VK, Brill WJ. Biochim Biophys Acta. 1973;305:445–454. doi: 10.1016/0005-2728(73)90190-4. [DOI] [PubMed] [Google Scholar]
- 4.Kim J, Rees DC. Nature. 1992;360:553–560. doi: 10.1038/360553a0. [DOI] [PubMed] [Google Scholar]
- 5.Chan MK, Kim J, Rees DC. Science. 1993;260:792–794. doi: 10.1126/science.8484118. [DOI] [PubMed] [Google Scholar]
- 6.Georgiadis MM, Komiya H, Chakrabarti P, Woo D, Kornuc JJ, Rees DC. Science. 1992;257:1653–1659. doi: 10.1126/science.1529353. [DOI] [PubMed] [Google Scholar]
- 7.Homer MJ, Paustian TD, Shah VK, Roberts GP. J Bacteriol. 1993;175:4907–4910. doi: 10.1128/jb.175.15.4907-4910.1993. [DOI] [PMC free article] [PubMed] [Google Scholar]
- 8.Paustian TD, Shah VK, Roberts GP. Biochemistry. 1990;29:3515–3522. doi: 10.1021/bi00466a014. [DOI] [PubMed] [Google Scholar]
- 9.White TC, Harris GS, Orme-Johnson WH. J Biol Chem. 1992;267:24007–24016. [PubMed] [Google Scholar]
- 10.Rubio LM, Rangaraj P, Homer MJ, Roberts GP, Ludden PW. J Biol Chem. 2002;277:14299 –14305. doi: 10.1074/jbc.M107289200. [DOI] [PubMed] [Google Scholar]
- 11.Allen RM, Homer MJ, Chatterjee R, Ludden PW, Roberts GP, Shah VK. J Biol Chem. 1993;268:23670 –23674. [PubMed] [Google Scholar]
- 12.Robinson AC, Chun TW, Li J-G, Burgess BK. J Biol Chem. 1989;264:10088 –10095. [PubMed] [Google Scholar]
- 13.Homer MJ, Dean DR, Roberts GP. J Biol Chem. 1995;270:24745–24752. doi: 10.1074/jbc.270.42.24745. [DOI] [PubMed] [Google Scholar]
- 14.Magnuson JK, Paustian TD, Shah VK, Dean DR, Roberts GP, Rees DC, Howard JB. Tetrahedron. 1997;53:11971–11984. [Google Scholar]
- 15.Christiansen J, Goodwin PJ, Lanzilotta WN, Seefeldt LC, Dean DR. Biochemistry. 1998;37:12611–12623. doi: 10.1021/bi981165b. [DOI] [PubMed] [Google Scholar]
- 16.Dyer DH, Rubio LM, Thoden JB, Holden HM, Ludden PW, Rayment I. J Biol Chem. 2003;278:32150 –32156. doi: 10.1074/jbc.M304264200. [DOI] [PubMed] [Google Scholar]
- 17.Shah VK, Davis LC, Brill WJ. Biochim Biophys Acta. 1972;256:498 –511. doi: 10.1016/0005-2728(72)90078-3. [DOI] [PubMed] [Google Scholar]
- 18.Ausubel, F. N., Brent, R., Kingston, R. E., Moore, D. D., Seidman, J. G., Smith, J. A., and Struhl, K. (eds) (2000) Current Protocols in Molecular Biology, Greene Publishing and Wiley Interscience, New York
- 19.Shah VK, Brill WJ. Proc Natl Acad Sci U S A. 1977;74:3249 –3253. doi: 10.1073/pnas.74.8.3249. [DOI] [PMC free article] [PubMed] [Google Scholar]
- 20.Shah VK, Allen JR, Spangler NJ, Ludden PW. J Biol Chem. 1994;269:1154 –1158. [PubMed] [Google Scholar]
- 21.Lundblad JR, Laurance M, Goodman RH. Mol Endocrinol. 1996;10:607–612. doi: 10.1210/mend.10.6.8776720. [DOI] [PubMed] [Google Scholar]
- 22.Laemmli UK. Nature. 1970;227:680 –685. doi: 10.1038/227680a0. [DOI] [PubMed] [Google Scholar]
- 23.Brandner JP, McEwan AG, Kaplan S, Donohue TJ. J Bacteriol. 1989;171:360 –368. doi: 10.1128/jb.171.1.360-368.1989. [DOI] [PMC free article] [PubMed] [Google Scholar]
- 24.Kuo CF, Fridovich I. Anal Biochem. 1988;170:183–185. doi: 10.1016/0003-2697(88)90106-6. [DOI] [PubMed] [Google Scholar]
- 25.Smith PK, Krohn RI, Hermanson GT, Mallia AK, Gartner FH, Provenzano MD, Fujimoto EK, Goeke NM, Olson BJ, Klenk DC. Anal Biochem. 1985;150:76 –85. doi: 10.1016/0003-2697(85)90442-7. [DOI] [PubMed] [Google Scholar]
- 26.Rawlings J, Shah VK, Chisnell JR, Brill WJ, Zimmermann R, Munck E, Orme-Johnson WH. J Biol Chem. 1978;253:1001–1004. [PubMed] [Google Scholar]
- 27.George GN, Prince RC, Bare RE. Inorg Chem. 1996;35:434 –438. doi: 10.1021/ic950740m. [DOI] [PubMed] [Google Scholar]
- 28.Allen RM, Chatterjee R, Ludden PW, Shah VK. J Biol Chem. 1995;270:26890 –26896. doi: 10.1074/jbc.270.45.26890. [DOI] [PubMed] [Google Scholar]
- 29.Joerger RD, Bishop PE. J Bacteriol. 1988;170:1475–1487. doi: 10.1128/jb.170.4.1475-1487.1988. [DOI] [PMC free article] [PubMed] [Google Scholar]
- 30.Rangaraj P, Rüttimann-Johnson C, Shah VK, Ludden PW. J Biol Chem. 2001;276:15968 –15974. doi: 10.1074/jbc.M100907200. [DOI] [PubMed] [Google Scholar]
- 31.Roll JT, Shah VK, Dean DR, Roberts GP. J Biol Chem. 1995;270:4432–4437. doi: 10.1074/jbc.270.9.4432. [DOI] [PubMed] [Google Scholar]
- 32.Rüttimann-Johnson C, Staples CR, Rangaraj P, Shah VK, Ludden PW. J Biol Chem. 1999;274:18087–18092. doi: 10.1074/jbc.274.25.18087. [DOI] [PubMed] [Google Scholar]
- 33.Allen RM, Chatterjee R, Madden M, Ludden PW, Shah VK. Crit Rev Biotech. 1994;14:225–249. doi: 10.3109/07388554409079834. [DOI] [PubMed] [Google Scholar]
- 34.Allen RM, Roll JT, Rangaraj P, Shah VK, Roberts GP, Ludden PW. J Biol Chem. 1999;274:15869 –15874. doi: 10.1074/jbc.274.22.15869. [DOI] [PubMed] [Google Scholar]
- 35.Siemann S, Schneider K, Behrens K, Knochel A, Klipp W, Muller A. Eur J Biochem. 2001;268:1940 –1952. doi: 10.1046/j.1432-1327.2001.02063.x. [DOI] [PubMed] [Google Scholar]
- 36.Allen RM, Chatterjee R, Ludden PW, Shah VK. J Biol Chem. 1996;271:4256 –4260. doi: 10.1074/jbc.271.8.4256. [DOI] [PubMed] [Google Scholar]
- 37.Rangaraj P, Shah VK, Ludden PW. Proc Natl Acad Sci U S A. 1997;94:11250 –11255. doi: 10.1073/pnas.94.21.11250. [DOI] [PMC free article] [PubMed] [Google Scholar]