

Abstract
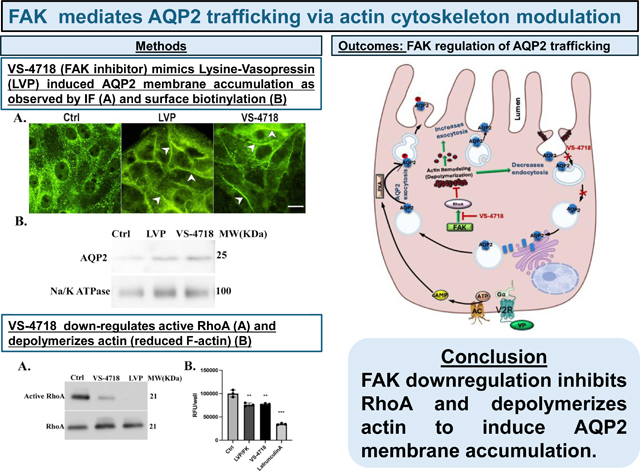
Vasopressin (VP)-induced cellular trafficking of the water channel aquaporin-2 (AQP2) to maintain systemic water balance is regulated in large part by the actin cytoskeleton in collecting duct principal cells (PC). Actin depolymerization/polymerization is involved in both constitutive AQP2 recycling, and the VP stimulated pathway; in many cells, focal adhesion kinase (FAK) modulates the actin cytoskeleton by inhibiting small GTPases. To understand the contribution of FAK to this process, we examined its involvement in AQP2 trafficking. We first showed that FAK inhibition using the drug VS- 4718 caused membrane accumulation of AQP2 in LLC-AQP2 epithelial cells in culture and PC in situ (kidney slices), by immunofluorescence staining and biotinylation. This was associated with significantly reduced endocytosis of AQP2 via the clathrin-mediated pathway, along with a reduction in RhoA activation and F-actin depolymerization. Importantly, AQP2 membrane accumulation induced by VS-4718 also occurred in cells expressing the dephosphorylation mutant of AQP2, S256A. Unlike VP, FAK inhibition did not increase cellular cAMP, nor AQP2 S256 phosphorylation. As expected, treatment with the FAK inhibitor VS-4718 suppressed FAK phosphorylation at Tyr397 in both cultured cells and kidney tissue. However, VP stimulation induced a redistribution of phospho-FAK (Tyr397) from basolateral toward the apical region of collecting duct principal cells in tissue slices, concomitant with AQP2 accumulation, but no overall change in the level of FAK phosphorylation was detectable after VP treatment. These data, therefore, identify FAK signaling as a distinct pathway that could provide a novel therapeutic avenue for regulating AQP2 trafficking in water balance disorders.
Keywords: kidney, water reabsorption, vasopressin, small GTPase
New and Noteworthy
FAK signaling plays a previously unrecognized role in regulating AQP2 trafficking by modulating the actin cytoskeleton and inhibiting the small GTPase RhoA in renal epithelial cells. Our findings demonstrate that FAK inhibition reduces AQP2 endocytosis via a cAMP- and serine 256 phosphorylation-independent mechanism, leading to its membrane accumulation. This study identifies FAK as a potential therapeutic target for water balance disorders by revealing its role in actin-mediated AQP2 regulation through RhoA inhibition.
Graphical Abstract
INTRODUCTION
The water channel aquaporin-2 (AQP2) is expressed in principal cells (PC) of the collecting duct (CD) and plays a crucial role in reabsorbing water along the CDs to produce concentrated urine (1–8). Important advances have been made in understanding how AQP2 is regulated and the mechanisms governing its function in response to the antidiuretic hormone, vasopressin (VP). VP binds to its receptor, the vasopressin type 2 receptor (V2R), located on the basolateral membrane of PCs in CDs, initiating a signaling cascade involving elevation of cyclic adenosine monophosphate (cAMP) and activation of protein kinase A (PKA). This series of events leads to the phosphorylation of AQP2 at serine(S)-256, as well as S264, and S269, and the dephosphorylation of serine-261, ultimately resulting in increased AQP2 accumulation on the apical membrane where it enables water reabsorption to occur. Phosphorylation of the AQP2 COOH-terminal S256 residue plays a dominant role in membrane accumulation of AQP2 compared to the other phosphorylated residues in the AQP2 c-terminus (9–13).
Under non-stimulated conditions, AQP2 undergoes constitutive recycling between the plasma membrane and intracellular vesicles, independent of elevated intracellular cAMP levels. This cycling process occurs even in the absence of VP, and also when the S256 of AQP2 is substituted with alanine, an amino acid that cannot undergo phosphorylation (14, 15). The importance of endocytosis in regulating this constitutive recycling pathway was first revealed experimentally by either depleting membrane cholesterol with methyl-β-cyclodextrin (mβCD) (15, 16) or by expressing a dominant- negative dynamin mutant that inhibits clathrin-mediated endocytosis (17). Both manipulations inhibit endocytosis without affecting exocytosis, and result in a rapid and substantial accumulation of AQP2 on the plasma membrane (15). Furthermore, we and others have shown that statins also cause AQP2 membrane accumulation by reducing its endocytosis via RhoA downregulation and subsequent actin depolymerization(18, 19). However, this continuous, baseline recycling equilibrium is disrupted by VP, resulting in the accumulation of AQP2 on the membrane via increased exocytosis rates, inhibition of endocytosis, or a process involving both endocytosis and exocytosis. While all three mechanisms could theoretically result in AQP2 accumulation at the cell surface, the latter possibility was favored based on kinetic studies and mathematical modeling of VP- induced water permeability changes in isolated perfused kidney CDs (20).
It is now understood that VP modulates the levels of AQP2 present in the apical plasma membrane of kidney collecting duct cells by controlling the rates at which AQP2 undergoes endocytosis (internalization from the membrane) and exocytosis (insertion into the membrane). Regulation of endocytosis occurs by phosphorylating carboxyterminal phosphorylation sites, primarily the serine residue at position 256, which reduces the rate of endocytosis (8, 17, 21, 22). In addition, however, both the microtubule and actin cytoskeletons play crucial roles in AQP2 trafficking, and disruption of actin filaments alone results in AQP2 membrane accumulation (23, 24). This requires organized changes in cytoskeletal dynamics as well as the involvement of several associated proteins. Indeed, proteomic analyses have identified many cytoskeletal proteins and their regulatory interactors in both AQP2-bearing vesicles from inner medullary collecting duct (IMCD) and AQP2-containing exosomes isolated from urine (25, 26).
Earlier studies have shown that RhoA inhibition is associated with the membrane translocation of AQP2 mediated by VP and cAMP. Moreover, AQP2 membrane accumulation can be induced simply by RhoA inactivation and actin depolymerization even in the absence of VP stimulation (27, 28). Intriguingly, more recent studies have shown that integrins can signal from endocytic compartments and that focal adhesion proteins that bind integrins co-localize with endocytic proteins (29–31). The main function of the non-receptor protein tyrosine kinase, FAK, is to regulate vital cellular functions including proliferation, migration, differentiation, and apoptosis. In addition, it is known for its role in cellular processes related to cell adhesion, movement, or cell shape through regulating focal adhesion dynamics (32, 33). FAK is a convergent point in tyrosine phosphorylation pathways stimulated through the receptors for a variety of extracellular factors, including the regulatory peptides bombesin, vasopressin, endothelin, and angiotensin II, which act through G-protein-coupled seven transmembrane spanning domain receptors, and the regulatory lipids lysophosphatidic acid and sphingosine. Several of these factors also induce a rapid and striking reorganization of the actin filament network causing increased assembly of focal contacts and actin stress fiber formation (32).
Signaling through FAK mediates several aspects of cellular function, including the stabilization of microtubule interaction with the membrane, endocytosis, vesicle trafficking including endocytosis of integrin complexes (34–36) as well as exocytosis of vesicles (29, 37, 38). FAK can stimulate endocytosis through its interaction with c-Src, which phosphorylates critical components of the endocytotic machinery including clathrin, dynamin and cortactin (39–41). Related to this effect, we previously showed that Src inhibition decreases clathrin-mediated endocytosis in renal epithelial cells and results in increased plasma membrane accumulation of AQP2 (42). FAK is associated with other protein trafficking events such as during insulin secretion, where FAK deletion led to reduced insulin exocytosis likely by a defect in actin dynamics (38). A recent study demonstrated an unsuspected role for FAK in controlling LDL-cholesterol delivery, specifically its late endosome trafficking and regulating the dynamics of the organelles containing Niemann–Pick C1 protein (NPC1) through its coupling to the cholesterol transporter ORP2 (43). Furthermore, Zeigerer et al. (44) have shown that FAK-driven activation of Rab5 was associated with peripheral and enlarged early endosomes. Importantly, it was previously reported that FAK activation and tyrosine phosphorylation are associated with RhoA activation and the formation of stress fibers (45). In addition to affecting the activity of Ras, Rac, and Rho, FAK can influence the function of Cdc42 through binding and phosphorylation of the Cdc42 effector Wiskott–Aldrich syndrome protein N-WASP (neuronal WASP), which leads to actin cytoskeleton regulation through activation of the ARP2/3 complex (46, 47). Consistent with these results, our laboratory recently revealed a crucial role of the Arp2/3 complex in AQP2 exocytosis (48). Finally, FAK along with paxillin and talin, regulate intracellular cytoskeleton dynamics (49). Building on these findings, we set out to elucidate a possible role of FAK in regulating AQP2 transport, and we report here that FAK indeed modifies AQP2 translocation through actin cytoskeleton regulation.
MATERIALS AND METHODS
Cell culture
LLC-PK1 cells stably expressing wild-type c-myc-tagged aquaporin-2 (LLC-AQP2 cells) (50), LLC-AQP2 cells stably expressing secreted soluble yellow fluorescent protein (LLC-AQP2-ssYFP cells) (14), LLC-AQP2 cells stably expressing a c-myc-tagged alanine 256 mutant c-myc-tagged aquaporin-2 (LLC-AQP2 S256A) (14, 51) were all cultured at 37°C with a 5% CO2 atmosphere in DMEM + 10% FBS. Cells were grown either on coverslips (Electron Microscopy Sciences, Hatfield, PA) or on standard P6 polystyrene Falcon culture dishes (Corning Live Science, Corning, NY) to 70 – 80% confluence prior to performing the experiments.
Immunofluorescence staining of cells
In initial experiments, cells grown as above were treated with lysine vasopressin (LVP) (10 nm, 15 min) or the FAK inhibitor VS-4718 (VS: 1 μM, 30 min) (PND-1186 – MedChemExpress, Monmouth Junction, NJ), then fixed in 4% PFA in PBS for 20 min. Fixed coverslips were permeabilized in 0.02% Triton X-100/PBS for 4 min, washed three times with PBS, and blocked in 1% BSA/PBS for 30 min. The coverslips were incubated with primary antibodies for 1 h at room temperature or overnight at 4°C. After washing with PBS three times, coverslips were incubated in secondary antibody for 45 min at room temperature, and after 3 more washes with PBS the coverslips were mounted with Vectashield mounting medium with DAPI. They were examined and imaged using a Nikon 80i microscope. Image J software was used for image analysis. Background corrections and contrast/brightness enhancement were performed identically for all images in the same experiment. AQP2 was detected in cells using undiluted culture medium containing mouse anti-c-myc IgG produced by the hybridoma cells (MYC 19E10.2 [9E10] ATCC® CRL1729TM) followed by a secondary anti–mouse IgG conjugated to Alexa-488 (10 μg/ml; Invitrogen, Waltham, MA). Rabbit monoclonal phospho-FAK (Y397) antibodies (1:100, Abcam, Waltham) and mouse polyclonal total FAK antibodies (1:200, Invitrogen, Waltham) (supplementary table) were applied in some experiments and detected using either donkey anti-rabbit IgG conjugated to cyanine dye 3 (cy3) or donkey anti-mouse IgG conjugated to cy3 diluted in PBS (7.5 μg/ml; Jackson ImmunoResearch, West Grove, PA), respectively.
Cell Surface biotinylation assay
LLC-AQP2 cells were cultured in standard P10 polystyrene Falcon culture dishes (Corning Live Science, Corning, NY) to 70–80% confluence, harvested with trypsin/EDTA, and washed three times with PBS. The cells were cultured in DMEM without FBS at 37°C for 1 h then treated with different drugs for 30 min. Cells were subsequently washed with ice cold PBS 3 times and incubated with 1 mg/ml biotin (NHS-LC-Biotin, Pierce Biotechnology, MA) in ice cold PBS at 4°C for 30 min. The reaction was stopped by adding Tris-HCl buffer (1M, pH 8.0, Boston BioProducts, Boston, MA). Cells were washed 3 times in PBS, lysed using a ball-bearing cell cracker (HGM Lab Equipment, Germany) and incubated with 50 μl streptavidin beads (Dynabeads M-280; Invitrogen) at 4°C overnight. Proteins that had associated with biotin in the previous incubation became attached to the beads, which were then resuspended in 50 μl sample buffer and prepared for 10% SDS-PAGE and western blotting. The cell surface biotinylation assay was performed as described previously (52). Anti-Na+/K+ ATPase antibody was used to detect a surface- labeled, resident membrane protein that is not expected to change under the conditions used, as an internal reference for membrane input levels into the assay.
Endocytosis and exocytosis assay
For the endocytosis assay, LLC-AQP2 cells were grown on coverslips placed in 12-well cell culture plates to 70–80% confluence (Corning Live Science, Corning, NY). After incubation in serum-free DMEM for 1 h, LVP, VS-4718 and DMSO (Sigma-Aldrich, St-Louis, MO), as a control were added and incubated with cells as above for 15–30 min (see figure legends). Cells were then washed twice in ice-cold PBS, and then incubated with tetramethylrhodamine transferrin (Life Technologies, Carlsbad, CA) at a final concentration of 25 μg/ml in 1% BSA / phenol red-free DMEM for 20 min at 37°C. As a positive control, we added the cholesterol-chelating drug methyl-β-cyclodextrin (MβCD, Sigma-Aldrich, St-Louis, MO), to the cells. At a concentration of 10 mM, MβCD rapidly inhibits most endocytotic events in cells (5–15 mins), as we have previously shown (15, 53). Cells were washed 3 times immediately with ice-cold PBS, fixed for 20 min with 4% paraformaldehyde (PFA, Electron Microscopy Sciences, Hatfield, PA) in PBS, washed again, and mounted with Vectashield mounting medium with the DNA stain DAPI (Vector Laboratories Inc., Burlingame, CA). The coverslips were examined by fluorescence microscopy (Nikon 80i microscope; Nikon Instruments, Melville, NY) and analyzed using ImageJ software (NIH, Bethesda, MD). The mean fluorescence intensity was measured for each outlined region of interest (ROI), normalized to background fluorescence (of the nucleus), and compared across conditions to assess differences in staining patterns. Background corrections and contrast/brightness enhancement were performed identically for all images in the same experiment (54).
For the exocytosis assay, LLC-AQP2-ssYFP cells were cultured as above, treated with LVP or VS-4718 as described above, and then exocytosis of ssYFP secreted into the culture medium was measured by quantifying the fluorescence in the culture medium. The specific protocol was previously described in detail (14) but briefly, the cells were starved by incubation in HBBS (Hank’s buffered saline solution; Invitrogen, Waltham, MA) containing 20 mM HEPES, 25 mM sodium bicarbonate and 11 mM glucose for 1 h, followed by addition of LVP (10 nM) or VS-4718 (1 μM) for 30 min. After each treatment, 150 μl of medium from each well was transferred to a black half-area 96-well plate and analyzed using a multimode plate reader (model DTX880, Beckman-Coulter, Fullerton, CA). Fluorescence values represent three independent experiments performed in triplicate. Each fluorescence value is reported as a ratio of each background- and zero- subtracted value.
Western blotting of cells
For cell lysate preparation, cells were grown on P6 plates and treated with different drugs as described above, then rinsed 3 times with ice-cold PBS and lysed with a cell scraper in 150 μl lysis buffer containing 8 mM NaF, 0.5% NP-40, 4 mM Na3V04, 0.1% Triton X-100, 0.03% NaN3 and 1% protease inhibitor cocktail from Biotool.com (Houston, TX). Samples were incubated on ice, passed more than 5 times through a 27G×1/2 syringe and then centrifuged at 17,000 g at 4°C for 10 min to remove cell debris. The protein concentration in the lysate was measured with the Pierce® BCA Protein Assay Kit from Pierce Biotechnology (Rockford, IL). After adding 3x lithium dodecyl sulfate (LDS) sample buffer (Life Technologies, Carlsbad, CA) the samples were used for western blot as described previously (51). AQP2 was detected using a goat polyclonal antibody, sc-9882 (1:500 dilution) from Santa Cruz Biotechnology (Dallas, TX), and mouse anti- GAPDH monoclonal antibody AM4300 (at 1:10000) was from Ambion/Thermo Fisher Scientific, Waltham, MA). Phospho-FAK (Y397) antibodies (1:1000; Abcam, Waltham), and phospho-Src (Tyr 416) antibodies (1:1000; Cell Signaling, Danvers) were also used for western blotting as indicated below and detected with the appropriate HRP-conjugated secondary reagents (as listed in the supplementary table).
Cold block assay
LLC-AQP2 cells were grown on 12×12mm glass coverslips, placed in 12 well cell culture plates, to 70–80% confluence. In this cold block assay, the 12 well plates were floated on the surface of the water in a 20°C water bath and the VS-4718 (1 μM) was added at this time. By cooling the cells, this procedure blocks the exit of recycling as well as vesicles containing newly synthesized AQP2 from the Golgi region of the cell, which results in the appearance of distinct perinuclear patches that can be seen upon immunostaining the cells for AQP2 (15). Cycloheximide (10 μg/ml, Sigma-Aldrich) was added to the culture medium 60 min before further treatment to inhibit newly synthesized AQP2, as previously described, (55) in order to focus on recycling AQP2. Coverslips were taken out of each well at different time points, fixed with 4% PFA and immunofluorescence staining to detect AQP2 was performed as described above.
RhoA activity Assay
LLC-AQP2 cells were cultured in standard P10 polystyrene Falcon culture dishes to 70–80% confluence, washed with ice-cold PBS, and harvested in lysis buffer with a cell scraper. Equivalent protein amounts of lysates (300–800 μg) were then incubated with 50 μg Rhotekin-RBD beads (Cytoskeleton Inc., Denver, CO) at 4°C on a rotator for 1 hour. The beads were pelleted by centrifugation at 5,000g then washed by removing the supernatant. Then, beads were suspended in 1x lithium dodecyl sulfate (LDS) sample buffer and boiled for 2 min before being analyzed with SDS-PAGE and western blot using anti-RhoA antibodies. Quantification was performed using ImageJ software (NIH, Bethesda, MD) reflecting the relative amounts as a ratio of each protein band relative to the lane’s loading control. Ratio values represent three independent experiments.
Intracellular cAMP measurement
Cells plated on 96 well plates were treated with LVP and VS-4718 (VS) as above, then analyzed using an ELISA based cAMP DetectX Direct Cyclic AMP ELISA Kit (Arbor Assays, Ann Arbor, MI) according to the manufacturer’s protocol as described previously (56). Absorbance values at 450 nm were measured using the DTX880 plate reader. The results were adjusted by cell number and analyzed by a two-tailed Student’s t-test.
F-actin depolymerization assay
LLC-AQP2 cells were plated on 24 well plates and incubated in normal DMEM for 2 days. DMEM was replaced with HBSS and cells were incubated for 2 hours. After treatment with LVP/FK (Sigma, St. Louis, MO) (10 nM/1 μM) or the actin-depolymerizing drug latrunculin A (CalBiochem, San Diego, CA) (0.1 μM) for various times (15 min and 30 min respectively), HBSS buffer was removed and cells were incubated in binding buffer containing phalloidin (20 mM KH2PO4, 10 mM PIPES, 5 mM EGTA, 2 mM MgCl2, 4% PFA, 0.1% TritonX-100 and 250 nM rhodamine phalloidin; Sigma, St. Louis, MO) for 15 min at room temperature as previously described (24). Negative controls to estimate background autofluorescence were prepared using binding buffer lacking rhodamine-phalloidin. Cells treated with binding buffer were washed 4 times in PBS, incubated in 300 μl (in each well) methanol overnight at −20°C to extract bound rhodamine-phalloidin. The extracted rhodamine-phalloidin fluorescence was read using a Beckman DTX-880 multi-plate reader (excitation 535 nm, emission 595 nm). F-actin content values were expressed as relative fluorescence after subtraction of the negative-control values. Each fluorescence value was expressed as relative fluorescence unit (RFU)/well and data were analyzed using a two-tailed Student’s t-test (24).
Kidney tissue slice preparation: immunostaining and western blotting
To determine whether the effect of VS-4718 occurs in collecting duct PC in situ, AQP2 localization was studied in rat kidney tissue slices incubated in vitro as reported in our previous studies (42, 48, 57, 58). All procedures described were reviewed and approved by the Massachusetts General Hospital (MGH) Subcommittee on Research Animal Care and were performed in accordance with the National Institutes of Health Guide for the Care and Use of Laboratory Animals. Briefly, Sprague-Dawley rats (250 – 300 g) were anesthetized using isoflurane inhalation. Kidneys were perfused with HBSS (110 mM NaCl, 5 mM KCl, 1.2 mM MgSO4, 1.8 mM CaCl2, 4 mM sodium acetate, 1 mM Na3 citrate, 6 mM D-glucose, 6 mM L-alanine, 1 mM NaH2PO4, 3 mM Na2HPO4, 25 mM NaHCO3, pH 7.4) equilibrated with 5%CO2, 95%O2 at 37 °C. A razor blade was used to cut the kidneys into approximately 2–3 mm-thick slices, which were further cut into 0.5 mm slices with a Stadie-Riggs microtome (Thomas Scientific, Swedesboro, NJ). Slices were incubated at 37°C for 30 min in HBSS before treatment, followed by 15 min with Arginine-Vasopressin (AVP: 20 nM) as a positive control, for 30 min with VS-4718 (1 μM) or DMSO (a negative control). Slices were then fixed by immersion in 4% paraformaldehyde fixative at room temperature for 30 min and vials were stored in fixative overnight at 4°C. After rinsing 3 x10 min in 10 mM sodium phosphate buffer containing 0.9% NaCl, pH 7.4 (PBS), slices were stored in the same buffer plus 0.02% NaN3 at 4°C until sectioning. For immunostaining, the kidney slices were processed following our well- established procedures (59). Tissues were incubated in PBS containing 30% sucrose overnight and these cryoprotected slices were mounted on a cutting block in OCT compound 4583 (Tissue-Tek; Miles Inc., Elkhart, IN). Tissues were cut into 5 μm sections using a Leica CM3050S cryostat (Leica, Buffalo Grove, IL), and attached to Superfrost- plus glass slides (Fisher Scientific, Pittsburgh, PA), rehydrated in PBS for 20 min, treated with 1% SDS in PBS for 5 min as an antigen retrieval step (60), and washed three times with PBS. Sections were then incubated 10 min in PBS containing 1% bovine serum albumin as a blocking step and incubated overnight at 4°C with a goat anti-AQP2 antibody (Santa Cruz) diluted in PBS (0.4 μg/ml). In some experiments, a second incubation was performed using either a phospho-FAK (Y397) rabbit monoclonal antibody (1:100, Abcam, Waltham) or a total FAK mouse monoclonal antibody (1:200, Invitrogen, Waltham) (see supplementary table for details). After incubation, sections were washed 3 x 5 min in PBS and secondary antibodies were applied: donkey anti-goat IgG conjugated to Alexa 488, and for double incubations, donkey anti-rabbit IgG conjugated to Cy3 or donkey anti-mouse IgG conjugated to Cy3 (all secondary antibodies were used at 7.5 μg/ml; Jackson ImmunoResearch, West Grove, PA) respectively for 1 h at room temperature. After 3 washes with PBS, nuclear DNA was visualized by staining with DAPI (4′,6-diamidino-2-phenylindole; Sigma-Aldrich), 20 μg/ml for 10min. The stained sections were washed 3 times with PBS then mounted on glass slides with Vectashield mounting medium. The mounted slides were examined using a Nikon 80i widefield microscope and a 40x plan-apochromatic lens. Images were captured using Nikon Elements software. The experiment was repeated 4 times using different animals each time.
Kidney protein lysates were probed, using the western blotting protocols detailed above, for phospho-FAK (Tyr397), phospho-Src (Tyr416), total FAK, and total Src (see supplementary table of antibodies for details). Signal intensities for phospho-FAK and phospho-Src were normalized to their respective total protein levels to account for variation in protein loading. Quantification of western blot signals was performed using ImageJ, as described in the Quantification section below. Each condition was repeated using tissue from at least three independent animals.
Quantification and analysis procedures
Western blot quantification was performed using ImageJ software (NIH, Bethesda, MD) reflecting the relative amounts as a ratio of each protein band relative to the lane’s loading control. For each protein (row), the same-sized frame was superimposed as a region of interest (ROI) on all bands across the lanes, analyzing one sample at a time. Each band was quantified, and a value was recorded. Using the same frame size, a background measurement was taken on a non-stained region either above or below each band within the same row. The ROIs for other protein rows, including loading controls, were measured in the same way. After all data for the bands and their corresponding backgrounds, along with those for the loading controls, were exported to a spreadsheet, calculations were performed. The inverted pixel density for each band and background was calculated using the formula 255 – X, where X is the value recorded by ImageJ. For each protein band and loading control, the net intensity was obtained by subtracting the inverted background value from the inverted band value. The final relative quantification was expressed as the ratio of the net intensity of the protein band to the net intensity of the corresponding loading control.
Immunofluorescence intensity was quantified using ImageJ by selecting ROIs that delineated the perinuclear patch, as well as separate ROIs for background subtraction and for defining the cytoplasm and membrane in each analyzed cell. For each ROI, the mean fluorescence intensity was measured, along with the intensity of an adjacent unstained background area. Corrected fluorescence intensity was then calculated using the formula: integrated density minus (ROI area × mean background intensity).
Statistics
Statistics were performed with Prism software (GraphPad, La Jolla CA). Differences in means were then compared between control and treatment at each time point using the Student t-test (two tailed). Each experiment was repeated at least three times. Statistical significance was determined at a p value <0.05, but the actual p values are provided in the figures for each experimental condition.
RESULTS
Inhibiting FAK signaling increases membrane accumulation of AQP2 in cultured cells
We first examined the effect of the FAK inhibitor, VS-4718, on AQP2 trafficking in cultured LLC-PK1 cells stably expressing AQP2 (LLC-AQP2). Treatment with VS-4718 led to a significant accumulation of AQP2 in the plasma membrane while AQP2 was distributed in a relatively diffuse vesicular pattern in control cells (Fig. 1A). In cells treated with LVP, increased membrane accumulation of AQP2 was clearly detected, as expected. VS-4718-induced membrane accumulation of AQP2 with 1μM VS-4718 occurred after 30 min of treatment (Fig. 1A). Treatment with the FAK inhibitor resulted in a dose-dependent increase in AQP2 membrane accumulation. Among the concentrations tested, 1 μM was selected for subsequent experiments, as it elicited the most robust membrane accumulation without signs of cytotoxicity (Supplementary Fig. 1) which is consistent with other reports (61–63).
Fig.1. FAK inhibition induces membrane accumulation of AQP2 in LLCPK1- AQP2 cells.

A. Immunofluorescence staining of AQP2 with anti-c-myc antibody in LLC-AQP2 cells treated with 1 μM VS-4718 for 30 min indicates a strong membrane accumulation of AQP2 (arrowheads, right panel) as also induced by LVP treatment (10 nM, 15 min; arrowheads, middle panel). B. Surface biotinylation of LLC-AQP2 cells after treatment with 1μM VS- 4718 (30 min) shows an increase of biotinylated AQP2 similar to that seen after LVP treatment. C. Bar graph quantification represents ratio of biotinylated AQP2 and loading control Na+/K+ ATPase from 4 independent experiments showing increased cell surface AQP2 after both LVP and VS-4718 respectively (mean ± SE, n=4, p<0.01, and p<0.0001).
We next performed cell-surface biotinylation of LLC-AQP2 cells to detect the membrane density of total AQP2 using a different method. The biotin/protein band density of total AQP2 was significantly increased (two-fold) in VS-4718-treated cells compared with the control group (P< 0.0001), and similar to the increase induced by LVP, confirming that VS-4718 promoted the membrane accumulation of AQP2 in these cells (Fig. 1B and 1C).
FAK inhibition reduces AQP2 endocytosis
We then examined whether the increased membrane accumulation of AQP2 induced by VS-4718 was due to decreased endocytosis. AQP2 is endocytosed via the clathrin-mediated pathway (16, 17, 21) and we used a rhodamine-conjugated transferrin assay to quantify the effect of FAK inhibition on this process. VS-4718 treatment significantly reduced the endocytosis of rhodamine-transferrin, which is also internalized by a clathrin-dependent pathway, leading to increased cell surface/membrane accumulation of the rhodamine-transferrin signal compared to control cells (Fig. 2A). As a positive control, we used methyl-β-cyclodextrin (MβCD) to block endocytosis and showed that it also blocked endocytosis significantly, as expected (Fig. 2A and 2B).
Fig.2. VS-4718 reduces endocytosis.

A. Clathrin-mediated endocytosis was followed using rhodamine-conjugated transferrin uptake into LLC-AQP2 cells. Compared to vigorous uptake in untreated cells (left panel), VS-4718 blocked rhodamine-transferrin endocytosis and led to increased membrane accumulation (right panel). Methyl-β-cyclodextrin (MβCD) is a positive control that blocks endocytosis and also leads to increased membrane accumulation (middle panel). B. Relative internalized transferrin quantification by measuring mean pixel intensity of internalized perinuclear signal using ImageJ software. The graph shows 4 independent experiments where at least 30 cells were analyzed for each experiment. The Student t- test was performed to examine significance of treated groups vs. control (Ctrl) (p< 0.01; and p< 0.001). C. Dynamic intracellular accumulation of AQP2 in a “cold block” experiment. VS-4718 treatment inhibited the usual perinuclear accumulation (arrows in Ctrl) of AQP2 after cold block at 20°C that is apparent after about 30 mins under control conditions. After 2h, the perinuclear patches remained large and bright in control cells, but in the VS-4718-treated cells, while perinuclear patches remained detectable, there was more diffuse intracellular AQP2 fluorescence that possibly reflects alterations in the actin cytoskeleton as shown in later figures. Scale bar = 10 μm. D. Fluorescence signal intensity of intracellularly accumulated AQP2 after cold block experiment in LLC-AQP2 cells shows a significant delay in patch accumulation after 30 min of treatment with VS- 4718. The graph is average of 3 independent experiments where at least 30 cells were analyzed. Student’s t-test was performed to examine significance of treated groups vs. control (p < 0.05).
We then examined the endocytosis of AQP2 in LLC-AQP2 cells using a cold block assay that is routinely used to measure the rate of AQP2 internalization (11, 51). Incubating cells at 20°C inhibits the exit of proteins from the trans-Golgi network and their subsequent transport to the plasma membrane (64). The internalized proteins accumulate in the perinuclear region, forming a so-called “perinuclear patch” (11). In the absence of protein synthesis, the size and density of the perinuclear patch reveals the rate of internalization of the membrane protein – in this case AQP2. In control cells, an AQP2 perinuclear patch was clearly observed ~30 min after cold block, and the patch signal plateaued at around 120 min. VS-4718 treatment led to delayed endocytosis of AQP2; therefore, the formation of an AQP2 perinuclear patch was significantly delayed compared with the control, indicating slower endocytosis and subsequently reduced recycling of AQP2 (Fig. 2C). The fluorescence intensity of AQP2 perinuclear patches over time was quantified and analyzed (Fig. 2D). It showed that the development of the AQP2 perinuclear patch in VS-4718-treated cells was significantly delayed, supporting the conclusion that VS-4718 impedes AQP2 endocytosis/internalization in cells. We also noted that after treatment with VS-4718 for 2h, there was an increased amount of diffuse, intracellular vesicle staining for AQP2, possibly reflecting disruption of the actin cytoskeleton caused by the drug (see below).
FAK inhibition increases exocytosis
To explain further the AQP2 accumulation on the membrane when FAK is inhibited, we performed an exocytosis assay using a soluble secreted yellow fluorescent protein (ssYFP) as a surrogate marker of AQP2 exocytosis in LLC-AQP2 cells as previously described (14). We found that both LVP and VS-4718 significantly increased exocytosis of ssYFP by 20% compared to untreated cells (Ctrl) (Fig. 3).
Fig.3. VS-4718 increases AQP2 exocytosis.
Relative fluorescence of ssYFP secreted from LLC-AQP2-ssYFP cells into the culture medium was quantified under different conditions as a surrogate for AQP2 vesicle exocytosis. All experiments were repeated at least three times. Ctrl, control. Both LVP and forskolin (FK) induce a significant increase in exocytosis as previously reported (14), and VS-4718 treatment also induced a significant increase in ssYFP intensity indicating an equivalent if not slightly greater increase in AQP2 exocytosis rate. Bar values represent means + SE. Student’s t-test was performed to examine significance of treated groups vs. control (p < 0.05, n = 3).
Membrane accumulation of AQP2 induced by FAK inhibition occurs independently of S256 AQP2 phosphorylation and cAMP signaling
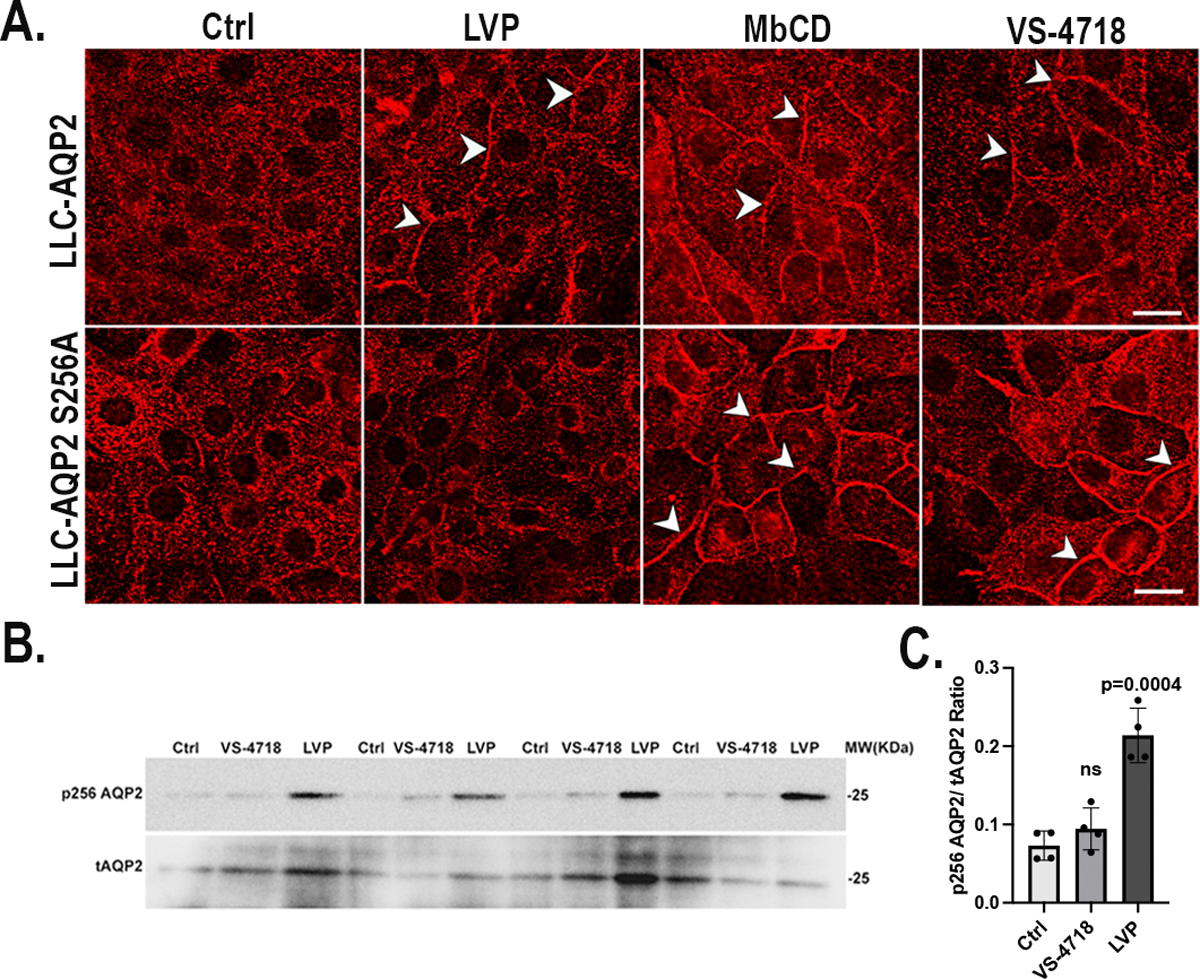
It is well known that AQP2 membrane accumulation in response to VP requires its phosphorylation at its COOH-terminal residues, particularly at serine-256 (1, 4, 9, 10, 13, 65, 66). To determine whether AQP2 accumulation at the membrane resulting from FAK inhibition requires S256 phosphorylation, we examined AQP2 trafficking in LLC-AQP2 S256A cells, a cell line expressing a mutation of AQP2 at its S256 phosphorylation site by the substitution of the amino-acid serine to alanine. As we showed previously, methyl- β-cyclodextrin (MβCD) treatment blocked the endocytosis of S256A-AQP2 and led to its membrane accumulation compared with untreated controls (15). Similarly, VS-4718 also caused significant membrane accumulation of AQP2 in LLC-AQP2 S256A cells after 30 min of treatment, showing that the membrane accumulation of AQP2 induced by FAK inhibition does not require S256 phosphorylation (Fig. 4A). Further investigation using a specific antibody against phospho-serine 256 AQP2 in western blots clearly shows that in contrast to LVP, which induces S256 phosphorylation, VS-4718 treatment of LLC-AQP2 cells did not increase S256 phosphorylation (Fig. 4B and 4C).
Fig.4. VS-4718 induces AQP2 membrane accumulation without phosphorylation at serine 256.

A. Membrane accumulation of AQP2 is induced by VS-4718 in cells expressing either WT-AQP2 or the S256A phosphorylation mutant. In contrast, LVP induces membrane accumulation only in cells expressing WT-AQP2, as expected. Methyl-β-cyclodextrin (MβCD) is a positive control to block endocytosis, resulting in AQP2 membrane accumulation in both WT and S256A-expressing cells; scale bar=10 μm. B. Western Blot of total (t)AQP2 and pS256 indicates that VS-4718 does not induce AQP2 trafficking through the canonical, VP-dependent pathway because no significant increase in the phospho-S256 signal was detectable, in contrast to LVP treatment in 4 independent experiments run in parallel on the same gel. After detecting p256AQP2 with specific anti p256AQP2 antibody, membranes were stripped and reblotted with tAQP2 antibody C. Bar graph represents ratio of p256 AQP2 and tAQP2 band intensities of 4 independent experiments (mean ± SE, n=4, p<0.001). The tAQP2 levels were variable among different experiments but results using the ratio method of analysis showed a consistent effect of LVP and no effect of VS-4718 on AQP2 phosphorylation.
FAK inhibition induces changes in phosphorylation states of AQP2 at S269 and S261
We examined further the phosphorylation state of two other AQP2 COOH-terminal serine residues, S261 and S269, by western blotting, using AQP2 phospho-specific antibodies. We found that in contrast to S256, VS-4718 treatment caused a significant increase in phosphorylation at AQP2 serine-269 (Fig. 5A and 5B) and a significant reduction in AQP2 phosphorylation at serine-261, which is similar to the effect of VP on these two residues (Fig. 5C and 5D) (12, 13, 51, 67).
Fig.5. FAK inhibition results in phosphorylation of AQP2 at S269 and dephosphorylation at S261.

A. Western Blot of tAQP2 and p269 indicates that VS-4718 does induce AQP2 phosphorylation at this residue. After detecting p269AQP2 with specific anti-p269 AQP2 antibody, membranes were stripped and reblotted with tAQP2 antibody. B. Bar graph represents ratio of p269 AQP2 and total AQP2 band intensities of 3 independent experiments (mean ± SE, n=3, p<0.001). C. Western Blot of tAQP2 and p261 indicates that VS-4718 does induce AQP2 dephosphorylation at S261. After detecting p261AQP2 with specific anti-p261 AQP2 antibody, membranes were stripped and reblotted with tAQP2 antibody. D. Bar graph represents ratio of p261 AQP2 and total AQP2 band intensities of 4 independent experiments (mean ± SE, n=4, p<0.001 and p<0.0001).
FAK inhibition does not increase intracellular cAMP in LLC-AQP2 cells
To determine whether VS-4718 stimulates the cAMP/PKA pathway to cause AQP2 membrane accumulation in LLC-PK1 cells, we tested whether FAK inhibition resulted in an increase in intracellular cAMP concentration in LLC-PK1 cell lines. In LLC-AQP2 cells. VS-4718 did not induce an increase in intracellular cAMP whereas LVP increased cAMP as expected (Fig. 6A). In addition, western blotting showed no increase of cAMP- response element binding protein (CREB) phosphorylation after FAK inhibition in LLC- AQP2 cells, unlike LVP which produced a strong increase in the p-CREB signal compared to non-treated cells (Fig. 6B).
Fig.6. VS-4718 induces AQP2 membrane accumulation without increasing cAMP and CREB phosphorylation in LLCPK1 cells.

A. Intracellular cAMP concentrations in LLC-AQP2 cells after treatment with LVP and VS- 4718, with ELISA (mean ± SE, n=3, p<0.01), showing increased cAMP after LVP but no change after VS-4718 treatment. B. Western blot analysis of phosphorylated CREB indicates that FAK inhibition does not induce an increase of phosphorylated CREB signal compared to LVP treatment in LLC-AQP2 cells.
FAK inhibition induces AQP2 membrane accumulation and decreases cellular F- actin content
Actin polymerization and depolymerization are recognized as crucial factors in regulating the dynamic trafficking of AQP2. We performed F-actin quantification assays using LLC-AQP2 cells. Cells were treated with LVP/FK (LVP 20 nM, FK 10 mM) and 1 μM VS-4718 for the indicated times, then subjected to F-actin quantification. In LLC-AQP2 cells, the F-actin content was significantly decreased by about 10–15% after LVP/FK treatment compared to untreated cells. In a similar way, VS-4718 induced an F-actin depolymerization of the same magnitude in LLC-AQP2 cells compared to controls. The actin depolymerizing drug latrunculin A was used as a positive control and caused a 50% decrease in F-actin content (Fig. 7A). These data are similar to the effect of VP on F-actin depolymerization that we previously reported in LLC-PK1 cells expressing AQP2 (24).
Fig.7. VS-4718 induces AQP2 membrane accumulation by inhibiting RhoA and depolymerizing F-actin.
A. F-actin quantification assay using rhodamine-phalloidin binding shows that VS-4718 and LVP cause a significant 20% decrease in F-actin compared to controls. Latrunculin A, an established actin depolymerizing agent was used as a positive control and it induced a 50% decrease of cellular F-actin (mean ± SE, n=3, p<0.01 and p<0.001). B. Immunofluorescence using phalloidin to detect F-actin and c-myc to detect tagged AQP2, after treatment with vasopressin and VS-4718. VS-4718 and LVP caused AQP2 membrane accumulation, as expected. Any significant redistribution of actin was unclear, with perhaps a tendency for a sharper staining at the cell periphery with fewer obvious filaments in the cytoplasm. Further analysis of these potential changes is rendered difficult by cell shape variations that occur after VP treatment; scale bar=10 μm. This result is representative of 3 independent experiments. C. RhoA pulldown assay using GSTRBD beads that bind to active RhoA in LLC-AQP2 cells shows that VS-4718 reduces active RhoA in a similar way to vasopressin. D. Bar graph represents ratio of active RhoA and total RhoA band intensities of 3 independent experiments (mean ± SE, n=3, p<0.01, and p<0.0001).
We then performed immunofluorescence staining of F-actin in cells exposed to LVP or the FAK inhibitor, VS-4718, utilizing rhodamine-conjugated phalloidin to determine whether we could visualize any clear changes in actin organization. While the administration of LVP or VS-4718 both led to the accumulation of AQP2 in the cell membrane, major changes in the F-actin distribution were not readily detectable at this level of resolution (Fig. 7B). Only about 10–15% depolymerization occurs in LLC-AQP2 cells upon LVP administration, and it was reported in early electron microscopy studies by Hays and colleagues that the pool of cortical actin just beneath the plasma membrane seems to be specifically affected by VP treatment in toad bladder and collecting duct PC (68). Therefore, a more detailed study will be required using higher resolution imaging to examine this in the future (Fig. 7B), using super-resolution methodology similar to that was reported by Holst et al (69). However, compared to untreated cells, the amount of GTP-RhoA was strongly reduced after FAK inhibition, consistent with an attenuation of Rho activity (Fig. 7C and 7D). As expected, a large reduction in GTP-bound cellular RhoA was also observed in LLC-AQP2 cells treated with VP, which is known to inactivate RhoA activity.
VS-4718 induces AQP2 membrane accumulation in kidney principal cells in situ
When applied to rat kidney tissue slices, the localization of AQP2 detected by immunocytochemistry was markedly altered by VS-4718 and by AVP. PC in control tissues showed a largely intracellular pattern of AQP2 staining, whereas those treated with VS- 4718 for 30 min had a bright membrane staining that ranged from uniquely apical in some parts of the kidney, to mostly basolateral in inner medullary collecting ducts (Fig. 8). This pattern of staining was indistinguishable from that produced by 15 min of AVP treatment. The variability in the polarity of AQP2 staining pattern in rat kidney PC in different parts of the collecting duct system has been described in previous reports (70–75). These results show that the effect of the FAK inhibitor, VS-4718, on AQP2 distribution is not restricted to our cell culture model but also occurs in collecting duct PC in situ. We then went on to examine the effect of VP and VS-4718 on FAK phosphorylation and localization of p-FAK in LLC-AQP2 cells and principal cells in our kidney slice model.
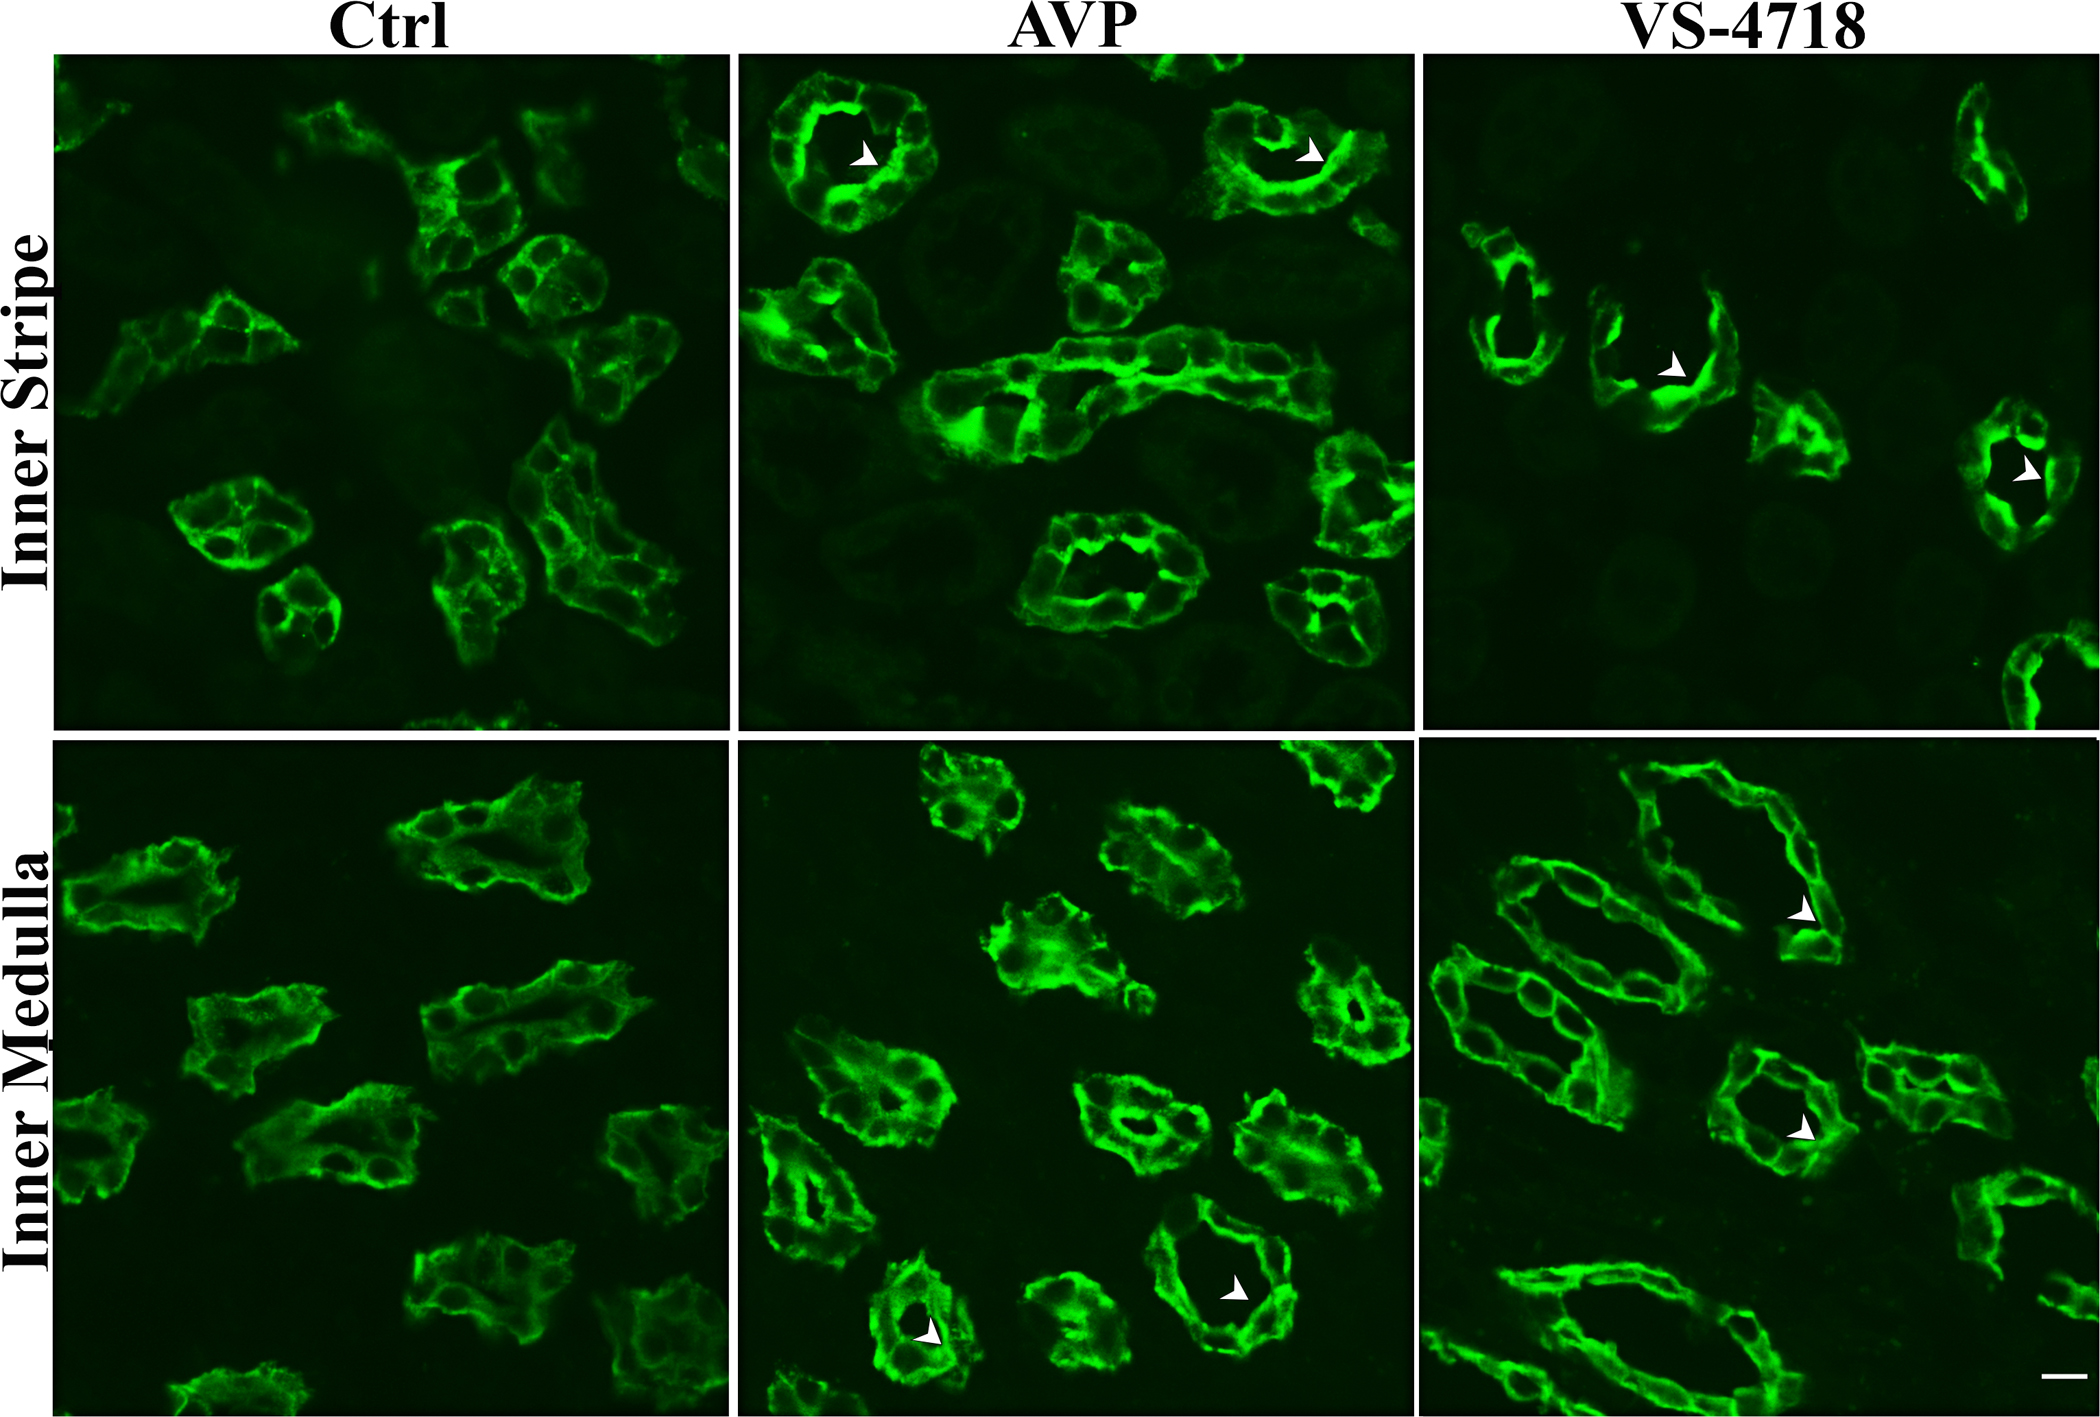
Fig.8. VS-4718 induces AQP2 membrane accumulation in kidney collecting duct principal cells.
Using rat kidney slices in vitro as an experimental model, both AVP (20nM; 15 min) and VS-4718 treatment (1μM; 30 min) resulted in markedly increased apical and basolateral membrane staining in collecting duct PC. In the inner stripe of the outer medulla (upper panels), both treatments resulted in increased apical AQP2 accumulation compared to untreated controls, but some basolateral staining was also apparent even in the control tissues in which diffuse cytoplasmic staining was predominant. In contrast, AVP stimulated both apical and basolateral AQP2 accumulation in the inner medulla, an effect that was reproduced by the FAK inhibitor VS-4718 (lower panels). This effect of AVP to induce basolateral AQP2 accumulation in PC of the rat kidney inner medulla has been reported previously (70–75). These images are representative of 3 independent experiments (n=3).
VS-4718 (but not VP) reduces FAK phosphorylation in LLC-AQP2 cells
In LLC-PK1 cells stably expressing AQP2 (LLC-AQP2), treatment with the FAK inhibitor VS-4718 led to a marked decrease in phosphorylated FAK (p-FAK) levels, as shown by greatly reduced levels of immunofluorescence staining (Fig. 9A, lower panels) and confirmed by western blotting (Fig. 9B, C). In contrast, no significant change in the phosphorylation state of FAK was detectable after LVP treatment. No apparent change in the distribution of p-FAK was seen after VP treatment, despite a clear membrane accumulation of AQP2 after incubation of cells with both VP and VS-4718.
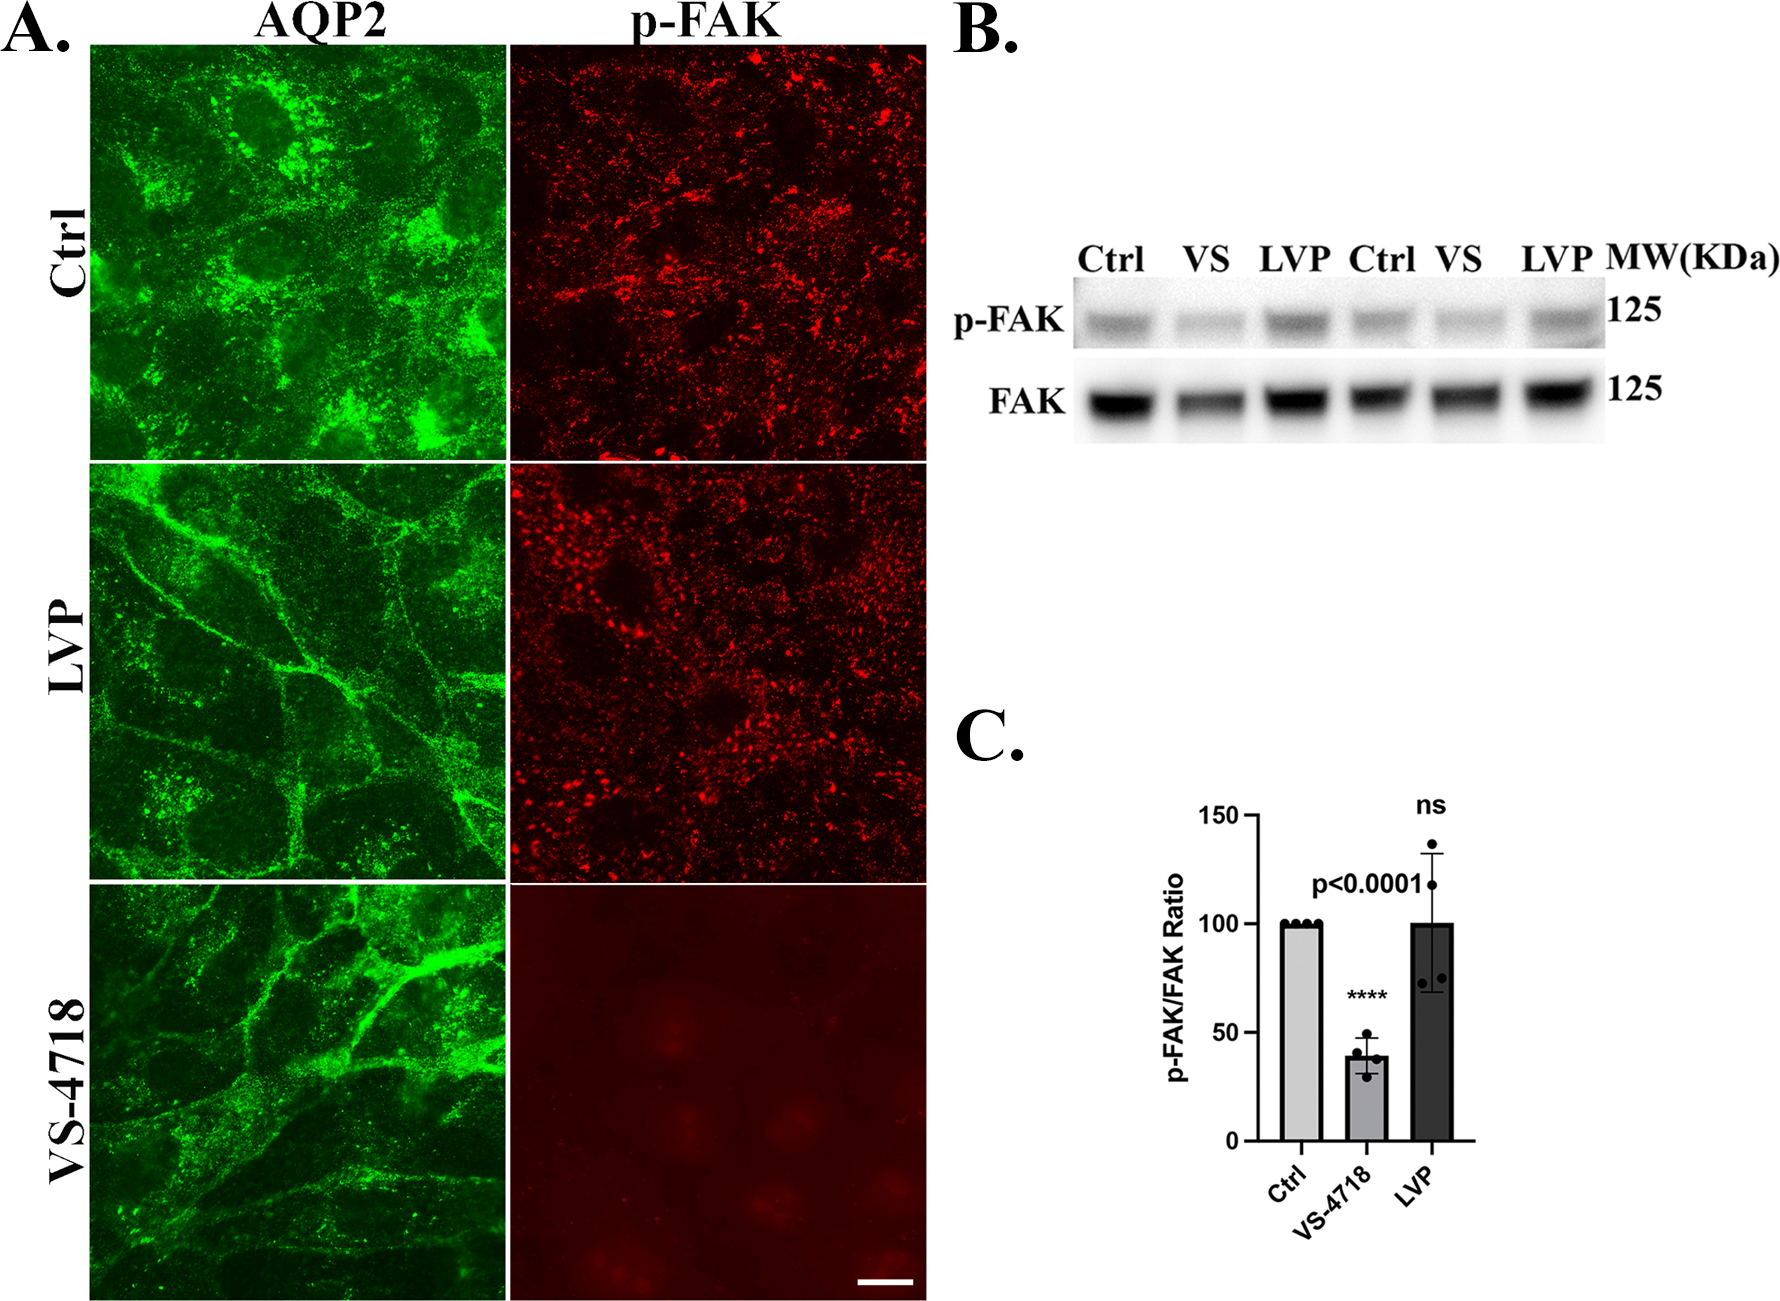
Fig. 9. VS-4718 inhibits FAK phosphorylation in LLC-AQP2 cells.

A. Immunofluorescence images of LLC-AQP2 cells treated with vehicle control (DMSO, Ctrl), lysine-vasopressin (LVP), or FAK inhibitor VS-4718 (VS). Cells were stained for AQP2 (green) and phosphorylated FAK at Tyr397 (p-FAK, red). LVP treatment (10 nM; 15 min) induced membrane accumulation of AQP2 but little or no change in p-FAK distribution was obvious. In contrast VS-4718 (1 μM; 30 min) markedly reduced p-FAK signal despite promoting AQP2 membrane localization. B. Western blot analysis of p-FAK (Y397) and total FAK confirms a reduction in FAK phosphorylation upon VS-4718 treatment with no significant changes after LVP stimulation. C. Quantification of p- FAK/FAK ratio shows a significant decrease in p-FAK signal in VS-4718–treated cells (mean ± SE, n = 4, p < 0.0001).
VP causes basolateral to apical relocation of phosphorylated FAK in kidney principal cells in situ without changing total p-FAK levels in the tissue
Under baseline conditions, both AQP2 and p-FAK showed a predominantly basolateral location in principal cells from the inner medulla (Fig. 10A, upper row). Both AQP2 and p-FAK staining intensity in the apical region of these cells was increased upon VP treatment (Fig. 10A, middle row). In parallel, the basolateral staining for p-FAK seen in control tissues showed a marked reduction in intensity upon VP treatment. Similar changes in p-FAK localization were also seen in principal cells from collecting ducts in the outer medulla, inner stripe of the kidney (Supplementary Fig. 2). Despite this obvious change in cellular localization, western blotting of tissues using anti-p-FAK antibodies showed no significant change in cellular p-FAK levels compared to untreated control kidney slices (Fig. 10B, C). Furthermore, using a different antibody (not phospho-FAK specific), total FAK was distributed throughout the cell under control conditions (Supplementary Fig. 3) and no change in distribution was detectable upon VP treatment (not shown). These data indicate that VP induces apical AQP2 accumulation via a mechanism that is associated with a marked change in p-FAK localization within the cell, but without a significant change in total cellular p-FAK levels. While VS-4718 treatment resulted in accumulation of AQP2 in the apical region of principal cells, it also significantly reduced the level of p-FAK phosphorylation by western blotting (Fig. 10D, E), such that is was barely detectable by immunofluorescence (Fig. 10A, lower right panel). Note that tubule segments other than collecting ducts in the inner medulla showed some p-FAK staining. While we did not perform a detailed analysis, their morphology and tissue distribution suggests that they are thin ascending limbs of Henle.
Fig. 10. Effect of AVP and VS-4718 on FAK phosphorylation and distribution in kidney collecting duct principal cells.

A. Immunofluorescence images of kidney tissue sections stained for AQP2 (green) and phosphorylated FAK (p-FAK, red) under control (Ctrl), AVP, and VS-4718 (VS) treatment conditions. In controls, AQP2 and p-FAK are located mainly at the basolateral membrane of CD PC whereas in AVP-treated kidneys, AQP2 and p-FAK are localized to the apical membrane of collecting duct principal cells. VS-4718 treatment markedly reduced p-FAK signal intensity while still inducing AQP2 localization at the apical plasma membrane. B. Western blot analysis of p-FAK (Y397) and total FAK in kidney tissue lysates from control and AVP-4718-treated animals. C. Quantification of p-FAK/FAK ratio shows no significant decrease in FAK phosphorylation with AVP treatment (mean ± SE, n = 3, p> 0.05). D. Western blot analysis of p-FAK (Y397) and total FAK in kidney tissue lysates from control and VS-4718-treated animals. E. Quantification of p-FAK/FAK ratio shows a significant decrease in FAK phosphorylation with VS-4718 treatment (mean ± SE, n = 3, p<0.01).
VS-4718 reduces Src phosphorylation in kidney tissue slices
Because Src kinase is considered to be a downstream component of the FAK signaling cascade in various pathways, Src phosphorylation (p-Src) was quantified by western blotting and was indeed significantly decreased following VS-4718 treatment in kidney tissue (Fig. 11A, B). These findings suggest that membrane accumulation of AQP2 in response to VS-4718 in principal cells may occur through inhibition of both FAK and Src activity, implicating a coordinated role for these kinases in restricting AQP2 membrane localization under basal conditions. However, because the kidney tissue slices we examined contain various cell types, this effect cannot be attributed uniquely to principal cells.
Fig.11. Inhibition of Src phosphorylation by VS-4718 in kidney tissue slices.

A. Representative Western blot analysis of phospho-Src (Tyr416) and total Src in kidney tissue slices treated ex vivo with DMSO (Ctrl) or the FAK inhibitor VS-4718 (1 μM, 30 min).
B. Quantification of phospho-Src levels normalized to total Src shows a significant reduction in Src phosphorylation following VS-4718 treatment (mean ± SE, n = 3, p<0.01).
Discussion
The major new finding reported here is that FAK inhibition causes membrane accumulation of AQP2 in renal epithelial cells, both in a cell culture model (LLC-AQP2 cells) and collecting duct PC in situ. Membrane accumulation of AQP2 by FAK inhibition is independent of AQP2 phosphorylation at serine 256 and does not require the elevation of intracellular cAMP. However, two of the other C-terminal phosphorylation sites on AQP2 – S261 and S269 – were modified by VS-4718 treatment in a similar manner to that seen with VP; phospho-S261 was reduced and phospho-S269 was increased. The membrane accumulation of AQP2 induced by FAK inhibition involves inactivation of the small GTPase RhoA and subsequent actin depolymerization, which increases exocytosis, decreases endocytosis, and leads to AQP2 membrane accumulation. Using a rhodamine- transferrin endocytosis assay (15), we found that the rate of endocytosis was decreased in these cells by VS-4718, indicating that reduced AQP2 internalization is involved in its membrane accumulation. There was, however, an apparent visual difference in the transferrin staining pattern on the plasma membrane between MβCD and VS-4718 treatments, possibly reflecting different mechanisms of action of the two drugs.
The cold block assay also showed that FAK inhibition induces a significant delay in perinuclear accumulation after AQP2 internalization, which is also consistent with reduced endocytosis. However, an increased rate of exocytosis was also apparent after FAK inhibition with VS-4718, as monitored using our secreted yellow fluorescent protein (ssYFP) assay. Thus both endocytosis and exocytosis are modified by VS-4718 in a similar way to that seen in the VP response (14, 21, 66), and the combination of these effects can explain AQP2 membrane accumulation under these conditions.
Although AQP2 S256 phosphorylation through the cAMP/PKA pathway is required to cause apical plasma membrane accumulation of AQP2 in kidney PC in response to VP, it has long been known that this accumulation can also be induced by other maneuvers that appear to be independent of PKA (15, 16, 18, 56, 76, 77).
Our results now indicate that AQP2 membrane accumulation induced by VS-4718 also does not require the VP/cAMP pathway. FAK inhibition does not trigger the phosphorylation of AQP2 at S256, a crucial site for AQP2 trafficking and regulation and, consistent with this observation, VS-4718 induced membrane accumulation of AQP2 in the mutant cell line LLCPK1–256A, in which the S256 site cannot be phosphorylated.
Interestingly, while S256 remains unaffected, FAK inhibition does lead to S269 phosphorylation as well as S261 dephosphorylation, both of which are seen upon VP stimulation of target cells. This finding challenges the traditional view of sequential phosphorylation, demonstrating that AQP2 residues can alter their phosphorylation state independently, rather than requiring an initial increase in S256 phosphorylation before S269 modification. The increased S269 phosphorylation may itself explain the enhanced membrane retention of AQP2, because this modification is known to stabilize AQP2 at the plasma membrane (12, 67). While the kinase responsible for S269 phosphorylation in PC remains unclear, previous research has excluded PKA as a candidate (67, 78). Additionally, VS-4718 treatment resulted in S261 dephosphorylation, also occurring independently of S256 phosphorylation, again similar to the VP effect (11, 13). We have previously reported that S269 can be phosphorylated independently of S256 upon Src inhibition by dasatinib, which also causes AQP2 membrane accumulation in a VP- independent manner (42). It is pertinent that Src is a downstream kinase that is regulated by FAK and that regulates endocytosis when activated (39–41). Indeed, we report here that Src phosphorylation is also inhibited by VS-4718. However, the phosphorylation state of S261 was not decreased by dasatinib which suggests a more complex, non-sequential model of AQP2 phosphorylation regulation under these different conditions.
Regarding the mechanism by which FAK inhibition affects AQP2 trafficking, we show that FAK inhibition regulates actin dynamics by reducing the activity of the small GTPase RhoA. The actin cytoskeleton plays an important role in regulating AQP2 trafficking through exocytosis and endocytosis (27) and actin depolymerization alone can lead to the cell-surface accumulation of AQP2 in the absence of any hormonal stimulus (27, 28, 54, 79). RhoA is widely involved in vesicle and protein trafficking by reorganizing the actin cytoskeleton (80–82), and the transition between actin polymerization and depolymerization is a key regulator of AQP2 trafficking. In addition, AQP2 membrane accumulation can also be induced by RhoA inactivation using other drugs (and subsequent actin depolymerization as mentioned above), for example by the application of statins to AQP2-expressing cells (18, 19). Our current data support these earlier observations and now implicate FAK in this process.
An interesting aspect of the effect of FAK inhibition on AQP2 in collecting duct PC is that it mimics the effect of VP on both apical and basolateral plasma membrane accumulation in cells from different segments of the rat kidney collecting duct. From the very initial studies on VP-induced AQP2 membrane accumulation in the kidney, it has been apparent that PC in the inner medulla accumulate AQP2 on their basolateral plasma membrane in addition to their apical membrane in response to VP (70–75). The factors that govern the polarity of accumulation in different PC populations remains unknown, but studies on MDCK cells in vitro indicate that AQP2 might first be inserted into the basolateral membrane of polarized epithelia cells prior to retrieval by endocytosis and subsequent transcytosis to the apical recycling pathway (83). While other data have implicated AQP2 in collecting duct epithelial cell development and maintenance via interaction with integrins (52), the reason that the degree of basolateral immunostaining is greater in the inner medulla compared to other kidney regions in response to VP, and now to VS-4718, is unclear, particularly since other aquaporins – AQP3 and AQP4 – are expressed on the basolateral plasma membranes of principal cells (84–86). AQP4 in particular is a highly permeable, selective water channel (87), and so the physiological benefit of having both AQP2 and AQP4 on PC basolateral membranes in inner medullary principal cells is also unclear.
Intriguingly, our results show that vasopressin modulates phosphorylated FAK (p- FAK) through changes in its subcellular distribution in PCs. Upon AVP stimulation, p-FAK was redistributed to regions of the cell that closely resembled the localization pattern of AQP2 at the plasma membrane. A previous study showed that phospho-FAK (Tyr397) could be localized to the apical membrane of epithelial cells in kidney cysts, although it did not clearly demonstrate the distribution of p-FAK (Tyr397) at the basolateral membrane under healthy conditions (88). Because there was no detectable change in total p-FAK in kidney slices upon AVP treatment, it remains unclear whether the apparent “redistribution” of p-FAK in these cells reflects dynamic intracellular transport of existing P-FAK protein, or parallel phosphorylation and dephosphorylation events in the apical and basolateral region of the cell that combine to produce the observed change in the polarized distribution of p-FAK in response to VP. Dissecting this process will be the subject of future work.
While both LLC-AQP2 cells and kidney collecting duct principal cells exhibited reduced FAK phosphorylation and enhanced AQP2 membrane accumulation following VS-4718 treatment, a key difference emerged in the regulation of Src phosphorylation. In kidney principal cells in situ, VS-4718 treatment significantly reduced both p-FAK and p-Src levels. This suggests a more physiologically integrated response in native tissue, where FAK and Src operate in a more tightly coupled signaling axis. This implies that both Src and FAK function in a dependent way to assure the proper signaling towards protein trafficking and cell motility (89), and FAK might be required to maintain Src activity in kidney epithelial cells by playing a scaffolding role (90). Nonetheless, these findings support the idea that both FAK and Src regulate AQP2 trafficking via dependent or independent interactions based on the cellular context.
In contrast, in LLC-AQP2 cells, FAK inhibition by VS-4718 led to a clear reduction in p-FAK levels without any significant change in Src phosphorylation (data not shown), This suggests that, in this simplified in vitro model, Src activity does not rely on FAK and may be maintained by specific compensatory signaling mechanisms (89, 91) that are active under culture conditions and understanding their precise interplay under these conditions will, therefore, require further studies.
In summary, VS-4718-mediated membrane accumulation of AQP2 appears to involve a mechanism that is independent of AQP2 phosphorylation at residue S256, and we demonstrated that RhoA is an important player in AQP2 membrane accumulation upon FAK inhibition. FAK-induced AQP2 membrane accumulation through RhoA inhibition occurs via a process that bypasses the canonical vasopressin-induced cAMP/PKA pathway. The potent effect of FAK on regulating AQP2 membrane accumulation in cells by orchestrating changes in dynamic cytoskeletal architecture, contributes to the body of knowledge that might inform novel therapeutic avenues for regulating AQP2 trafficking in water balance disorders.
Supplementary Material
Supplementary Figure 1: https://doi.org/10.6084/m9.figshare.29434472
Supplementary Figure 2: https://doi.org/10.6084/m9.figshare.29434484
Supplementary Figure 3: https://doi.org/10.6084/m9.figshare.29434499
Supplementary Table: https://doi.org/10.6084/m9.figshare.29427620.v1
Acknowledgements
This work was supported by the National Institutes of Health (NIH) grants DK096915 (H. J.L.), DK096586-10A1 (D.B.), diversity supplement DK096586-10A1S1 (to D. B. and A.M.) and a U2C/TL1 Harvard Kidney, Urology and Hematology Training Institute (HKUHTI) Network Grant (1TL1DK143273-01) (to A. M.) Additional support for the Program in Membrane Biology Microscopy Core comes from the Boston Area Diabetes and Endocrinology Research Center (P30DK135043) and the Massachusetts General Hospital (MGH) Center for the Study of Inflammatory Bowel Disease (P30DK43351). The Nikon AXR confocal microscope was purchased using an NIH S10 shared instrumentation grant 1S10D032211-01.
References
- 1.Olesen ETB, and Fenton RA. Aquaporin 2 regulation: implications for water balance and polycystic kidney diseases. Nat Rev Nephrol 17: 765–781, 2021. [DOI] [PubMed] [Google Scholar]
- 2.Oksche A, Schulein R, Rutz C, Liebenhoff U, Dickson J, Muller H, Birnbaumer M, and Rosenthal W. Vasopressin V2 receptor mutants that cause X-linked nephrogenic diabetes insipidus: analysis of expression, processing, and function. Mol Pharmacol 50: 820–828, 1996. [PubMed] [Google Scholar]
- 3.Deen PM, Verdijk MA, Knoers NV, Wieringa B, Monnens LA, van Os CH, and van Oost BA. Requirement of human renal water channel aquaporin-2 for vasopressin- dependent concentration of urine. Science 264: 92–95, 1994. [DOI] [PubMed] [Google Scholar]
- 4.Ranieri M, Di Mise A, Tamma G, and Valenti G. Vasopressin-aquaporin-2 pathway: recent advances in understanding water balance disorders. F1000Res 8: 2019. [DOI] [PMC free article] [PubMed] [Google Scholar]
- 5.Sands JM, and Layton HE. The physiology of urinary concentration: an update. Semin Nephrol 29: 178–195, 2009. [DOI] [PMC free article] [PubMed] [Google Scholar]
- 6.Cheung PW, Bouley R, and Brown D. Targeting the Trafficking of Kidney Water Channels for Therapeutic Benefit. Annu Rev Pharmacol Toxicol 60: 175–194, 2020. [DOI] [PMC free article] [PubMed] [Google Scholar]
- 7.Fenton RA, and Knepper MA. Urea and renal function in the 21st century: insights from knockout mice. J Am Soc Nephrol 18: 679–688, 2007. [DOI] [PubMed] [Google Scholar]
- 8.Bouley R, Hawthorn G, Russo LM, Lin HY, Ausiello DA, and Brown D. Aquaporin 2 (AQP2) and vasopressin type 2 receptor (V2R) endocytosis in kidney epithelial cells: AQP2 is located in 'endocytosis-resistant’ membrane domains after vasopressin treatment. Biol Cell 98: 215–232, 2006. [DOI] [PubMed] [Google Scholar]
- 9.Katsura T, Gustafson CE, Ausiello DA, and Brown D. Protein kinase A phosphorylation is involved in regulated exocytosis of aquaporin-2 in transfected LLC- PK1 cells. Am J Physiol 272: F817–822, 1997. [PubMed] [Google Scholar]
- 10.Fushimi K, Sasaki S, and Marumo F. Phosphorylation of serine 256 is required for cAMP-dependent regulatory exocytosis of the aquaporin-2 water channel. J Biol Chem 272: 14800–14804, 1997. [DOI] [PubMed] [Google Scholar]
- 11.Arthur J, Huang J, Nomura N, Jin WW, Li W, Cheng X, Brown D, and Lu HJ. Characterization of the putative phosphorylation sites of the AQP2 C terminus and their role in AQP2 trafficking in LLC-PK1 cells. Am J Physiol Renal Physiol 309: F673–679, 2015. [DOI] [PMC free article] [PubMed] [Google Scholar]
- 12.Moeller HB, Knepper MA, and Fenton RA. Serine 269 phosphorylated aquaporin-2 is targeted to the apical membrane of collecting duct principal cells. Kidney Int 75: 295–303, 2009. [DOI] [PMC free article] [PubMed] [Google Scholar]
- 13.Hoffert JD, Pisitkun T, Wang G, Shen RF, and Knepper MA. Quantitative phosphoproteomics of vasopressin-sensitive renal cells: regulation of aquaporin-2 phosphorylation at two sites. Proc Natl Acad Sci U S A 103: 7159–7164, 2006. [DOI] [PMC free article] [PubMed] [Google Scholar]
- 14.Nunes P, Hasler U, McKee M, Lu HA, Bouley R, and Brown D. A fluorimetry-based ssYFP secretion assay to monitor vasopressin-induced exocytosis in LLC-PK1 cells expressing aquaporin-2. Am J Physiol Cell Physiol 295: C1476–1487, 2008. [DOI] [PMC free article] [PubMed] [Google Scholar]
- 15.Lu H, Sun TX, Bouley R, Blackburn K, McLaughlin M, and Brown D. Inhibition of endocytosis causes phosphorylation (S256)-independent plasma membrane accumulation of AQP2. Am J Physiol Renal Physiol 286: F233–243, 2004. [DOI] [PubMed] [Google Scholar]
- 16.Russo LM, McKee M, and Brown D. Methyl-beta-cyclodextrin induces vasopressin- independent apical accumulation of aquaporin-2 in the isolated, perfused rat kidney. Am J Physiol Renal Physiol 291: F246–253, 2006. [DOI] [PubMed] [Google Scholar]
- 17.Sun TX, Van Hoek A, Huang Y, Bouley R, McLaughlin M, and Brown D. Aquaporin- 2 localization in clathrin-coated pits: inhibition of endocytosis by dominant-negative dynamin. Am J Physiol Renal Physiol 282: F998–1011, 2002. [DOI] [PubMed] [Google Scholar]
- 18.Li W, Zhang Y, Bouley R, Chen Y, Matsuzaki T, Nunes P, Hasler U, Brown D, and Lu HA. Simvastatin enhances aquaporin-2 surface expression and urinary concentration in vasopressin-deficient Brattleboro rats through modulation of Rho GTPase. Am J Physiol Renal Physiol 301: F309–318, 2011. [DOI] [PMC free article] [PubMed] [Google Scholar]
- 19.Procino G, Barbieri C, Carmosino M, Tamma G, Milano S, De Benedictis L, Mola MG, Lazo-Fernandez Y, Valenti G, and Svelto M. Fluvastatin modulates renal water reabsorption in vivo through increased AQP2 availability at the apical plasma membrane of collecting duct cells. Pflugers Arch 462: 753–766, 2011. [DOI] [PubMed] [Google Scholar]
- 20.Knepper MA, and Nielsen S. Kinetic model of water and urea permeability regulation by vasopressin in collecting duct. Am J Physiol 265: F214–224, 1993. [DOI] [PubMed] [Google Scholar]
- 21.Brown D The ins and outs of aquaporin-2 trafficking. Am J Physiol Renal Physiol 284: F893–901, 2003. [DOI] [PubMed] [Google Scholar]
- 22.Lu HAJ, Sun TX, Matsuzaki T, Yi XH, Eswara J, Bouley R, McKee M, and Brown D. Heat shock protein 70 interacts with aquaporin-2 and regulates its trafficking. J Biol Chem 282: 28721–28732, 2007. [DOI] [PubMed] [Google Scholar]
- 23.Tamma G, Klussmann E, Maric K, Aktories K, Svelto M, Rosenthal W, and Valenti G. Rho inhibits cAMP-induced translocation of aquaporin-2 into the apical membrane of renal cells. Am J Physiol Renal Physiol 281: F1092–1101, 2001. [DOI] [PubMed] [Google Scholar]
- 24.Yui N, Lu HJ, Bouley R, and Brown D. AQP2 is necessary for vasopressin- and forskolin-mediated filamentous actin depolymerization in renal epithelial cells. Biol Open 1: 101–108, 2012. [DOI] [PMC free article] [PubMed] [Google Scholar]
- 25.Pisitkun T, Shen RF, and Knepper MA. Identification and proteomic profiling of exosomes in human urine. Proc Natl Acad Sci U S A 101: 13368–13373, 2004. [DOI] [PMC free article] [PubMed] [Google Scholar]
- 26.Barile M, Pisitkun T, Yu MJ, Chou CL, Verbalis MJ, Shen RF, and Knepper MA. Large scale protein identification in intracellular aquaporin-2 vesicles from renal inner medullary collecting duct. Mol Cell Proteomics 4: 1095–1106, 2005. [DOI] [PMC free article] [PubMed] [Google Scholar]
- 27.Klussmann E, Tamma G, Lorenz D, Wiesner B, Maric K, Hofmann F, Aktories K, Valenti G, and Rosenthal W. An inhibitory role of Rho in the vasopressin-mediated translocation of aquaporin-2 into cell membranes of renal principal cells. J Biol Chem 276: 20451–20457, 2001. [DOI] [PubMed] [Google Scholar]
- 28.Valenti G, Procino G, Tamma G, Carmosino M, and Svelto M. Minireview: aquaporin 2 trafficking. Endocrinology 146: 5063–5070, 2005. [DOI] [PubMed] [Google Scholar]
- 29.Alanko J, Mai A, Jacquemet G, Schauer K, Kaukonen R, Saari M, Goud B, and Ivaska J. Integrin endosomal signalling suppresses anoikis. Nat Cell Biol 17: 1412–1421, 2015. [DOI] [PMC free article] [PubMed] [Google Scholar]
- 30.Nader GP, Ezratty EJ, and Gundersen GG. FAK, talin and PIPKIgamma regulate endocytosed integrin activation to polarize focal adhesion assembly. Nat Cell Biol 18: 491–503, 2016. [DOI] [PubMed] [Google Scholar]
- 31.Arriagada C, Silva P, Millet M, Solano L, Moraga C, and Torres VA. Focal adhesion kinase-dependent activation of the early endocytic protein Rab5 is associated with cell migration. J Biol Chem 294: 12836–12845, 2019. [DOI] [PMC free article] [PubMed] [Google Scholar]
- 32.Abedi H, and Zachary I. Signalling mechanisms in the regulation of vascular cell migration. Cardiovasc Res 30: 544–556, 1995. [PubMed] [Google Scholar]
- 33.Schaller MD, and Parsons JT. Focal adhesion kinase and associated proteins. Curr Opin Cell Biol 6: 705–710, 1994. [DOI] [PubMed] [Google Scholar]
- 34.Ezratty EJ, Partridge MA, and Gundersen GG. Microtubule-induced focal adhesion disassembly is mediated by dynamin and focal adhesion kinase. Nat Cell Biol 7: 581–590, 2005. [DOI] [PubMed] [Google Scholar]
- 35.Chao WT, Ashcroft F, Daquinag AC, Vadakkan T, Wei Z, Zhang P, Dickinson ME, and Kunz J. Type I phosphatidylinositol phosphate kinase beta regulates focal adhesion disassembly by promoting beta1 integrin endocytosis. Mol Cell Biol 30: 4463–4479, 2010. [DOI] [PMC free article] [PubMed] [Google Scholar]
- 36.Wang Y, Cao H, Chen J, and McNiven MA. A direct interaction between the large GTPase dynamin-2 and FAK regulates focal adhesion dynamics in response to active Src. Mol Biol Cell 22: 1529–1538, 2011. [DOI] [PMC free article] [PubMed] [Google Scholar]
- 37.Lachuer H, Le L, Leveque-Fort S, Goud B, and Schauer K. Spatial organization of lysosomal exocytosis relies on membrane tension gradients. Proc Natl Acad Sci U S A 120: e2207425120, 2023. [DOI] [PMC free article] [PubMed] [Google Scholar]
- 38.Cai EP, Casimir M, Schroer SA, Luk CT, Shi SY, Choi D, Dai XQ, Hajmrle C, Spigelman AF, Zhu D, Gaisano HY, MacDonald PE, and Woo M. In vivo role of focal adhesion kinase in regulating pancreatic beta-cell mass and function through insulin signaling, actin dynamics, and granule trafficking. Diabetes 61: 1708–1718, 2012. [DOI] [PMC free article] [PubMed] [Google Scholar]
- 39.Ortiz MA, Mikhailova T, Li X, Porter BA, Bah A, and Kotula L. Src family kinases, adaptor proteins and the actin cytoskeleton in epithelial-to-mesenchymal transition. Cell Commun Signal 19: 67, 2021. [DOI] [PMC free article] [PubMed] [Google Scholar]
- 40.Cao H, Chen J, Krueger EW, and McNiven MA. SRC-mediated phosphorylation of dynamin and cortactin regulates the "constitutive" endocytosis of transferrin. Mol Cell Biol 30: 781–792, 2010. [DOI] [PMC free article] [PubMed] [Google Scholar]
- 41.Ahn S KJ, Lucaveche CL, Reedy MC, Luttrell LM, Lefkowitz RJ, Daaka Y.. Src- dependent tyrosine phosphorylation regulates dynamin self-assembly and ligand- induced endocytosis of the epidermal growth factor receptor. The Journal of Biological Chemistry 277: 26642–26651, 2002. [DOI] [PubMed] [Google Scholar]
- 42.Cheung PW, Terlouw A, Janssen SA, Brown D, and Bouley R. Inhibition of non- receptor tyrosine kinase Src induces phosphoserine 256-independent aquaporin-2 membrane accumulation. J Physiol 597: 1627–1642, 2019. [DOI] [PMC free article] [PubMed] [Google Scholar]
- 43.Takahashi K, Kanerva K, Vanharanta L, Almeida-Souza L, Lietha D, Olkkonen VM, and Ikonen E. ORP2 couples LDL-cholesterol transport to FAK activation by endosomal cholesterol/PI(4,5)P(2) exchange. EMBO J 40: e106871, 2021. [DOI] [PMC free article] [PubMed] [Google Scholar]
- 44.Zeigerer A, Gilleron J, Bogorad RL, Marsico G, Nonaka H, Seifert S, Epstein- Barash H, Kuchimanchi S, Peng CG, Ruda VM, Del Conte-Zerial P, Hengstler JG, Kalaidzidis Y, Koteliansky V, and Zerial M. Rab5 is necessary for the biogenesis of the endolysosomal system in vivo. Nature 485: 465–470, 2012. [DOI] [PubMed] [Google Scholar]
- 45.Schlaepfer DD, and Mitra SK. Multiple connections link FAK to cell motility and invasion. Curr Opin Genet Dev 14: 92–101, 2004. [DOI] [PubMed] [Google Scholar]
- 46.Wu X, Suetsugu S, Cooper LA, Takenawa T, and Guan JL. Focal adhesion kinase regulation of N-WASP subcellular localization and function. J Biol Chem 279: 9565–9576, 2004. [DOI] [PubMed] [Google Scholar]
- 47.Ridley AJ, Schwartz MA, Burridge K, Firtel RA, Ginsberg MH, Borisy G, Parsons JT, and Horwitz AR. Cell migration: integrating signals from front to back. Science 302: 1704–1709, 2003. [DOI] [PubMed] [Google Scholar]
- 48.Liu CS, Cheung PW, Dinesh A, Baylor N, Paunescu TC, Nair AV, Bouley R, and Brown D. Actin-related protein 2/3 complex plays a critical role in the aquaporin-2 exocytotic pathway. Am J Physiol Renal Physiol 321: F179–F194, 2021. [DOI] [PMC free article] [PubMed] [Google Scholar]
- 49.Mitra SK, Hanson DA, and Schlaepfer DD. Focal adhesion kinase: in command and control of cell motility. Nat Rev Mol Cell Biol 6: 56–68, 2005. [DOI] [PubMed] [Google Scholar]
- 50.Katsura T, Verbavatz JM, Farinas J, Ma T, Ausiello DA, Verkman AS, and Brown D. Constitutive and regulated membrane expression of aquaporin 1 and aquaporin 2 water channels in stably transfected LLC-PK1 epithelial cells. Proc Natl Acad Sci U S A 92: 7212–7216, 1995. [DOI] [PMC free article] [PubMed] [Google Scholar]
- 51.Rice WL, Zhang Y, Chen Y, Matsuzaki T, Brown D, and Lu HA. Differential, phosphorylation dependent trafficking of AQP2 in LLC-PK1 cells. PLoS One 7: e32843, 2012. [DOI] [PMC free article] [PubMed] [Google Scholar]
- 52.Chen Y, Rice W, Gu Z, Li J, Huang J, Brenner MB, Van Hoek A, Xiong J, Gundersen GG, Norman JC, Hsu VW, Fenton RA, Brown D, and Lu HA. Aquaporin 2 promotes cell migration and epithelial morphogenesis. J Am Soc Nephrol 23: 1506–1517, 2012. [DOI] [PMC free article] [PubMed] [Google Scholar]
- 53.Cheung PW, Boukenna M, Babicz RSE, Mitra S, Kay A, Paunescu TC, Baylor N, Liu CS, Nair AV, Bouley R, and Brown D. Intracellular sites of AQP2 S256 phosphorylation identified using inhibitors of the AQP2 recycling itinerary. Am J Physiol Renal Physiol 324: F152–F167, 2023. [DOI] [PMC free article] [PubMed] [Google Scholar]
- 54.Mamuya FA, Cano-Penalver JL, Li W, Rodriguez Puyol D, Rodriguez Puyol M, Brown D, de Frutos S, and Lu HA. ILK and cytoskeletal architecture: an important determinant of AQP2 recycling and subsequent entry into the exocytotic pathway. Am J Physiol Renal Physiol 311: F1346–F1357, 2016. [DOI] [PMC free article] [PubMed] [Google Scholar]
- 55.Katsura T, Ausiello DA and Brown D . Direct demonstration of aquaporin-2 water channel recycling in stably transfected LLC-PK1 epithelial cells. Am J Physiol F548- 553, 1996. [DOI] [PubMed] [Google Scholar]
- 56.Bouley R, Lu HA, Nunes P, Da Silva N, McLaughlin M, Chen Y, and Brown D. Calcitonin has a vasopressin-like effect on aquaporin-2 trafficking and urinary concentration. J Am Soc Nephrol 22: 59–72, 2011. [DOI] [PMC free article] [PubMed] [Google Scholar]
- 57.Babicz RSE, Baylor N, Terlouw A, Faber DA, Fukushima K, Biondi RM, Bouley R, and Brown D. Ribosomal s6 kinase (RSK) is a mediator of aquaporin-2 S256 phosphorylation and membrane accumulation after EGFR inhibition with erlotinib. Am J Physiol Renal Physiol 328: F344–F359, 2025. [DOI] [PMC free article] [PubMed] [Google Scholar]
- 58.Cheung PW, Ueberdiek L, Day J, Bouley R, and Brown D. Protein phosphatase 2C is responsible for VP-induced dephosphorylation of AQP2 serine 261. Am J Physiol Renal Physiol 313: F404–F413, 2017. [DOI] [PMC free article] [PubMed] [Google Scholar]
- 59.Eaton AF, Danielson EC, Capen D, Merkulova M, and Brown D. Dmxl1 Is an Essential Mammalian Gene that Is Required for V-ATPase Assembly and Function In Vivo. Function (Oxf) 5: 2024. [DOI] [PMC free article] [PubMed] [Google Scholar]
- 60.Brown D, Lydon J, McLaughlin M, Stuart-Tilley A, Tyszkowski R, and Alper S. Antigen retrieval in cryostat tissue sections and cultured cells by treatment with sodium dodecyl sulfate (SDS). Histochem Cell Biol 105: 261–267, 1996. [DOI] [PubMed] [Google Scholar]
- 61.Kurmasheva RT, Gorlick R, Kolb EA, Keir ST, Maris JM, Lock RB, Carol H, Kang M, Reynolds CP, Wu J, Houghton PJ, and Smith MA. Initial testing of VS-4718, a novel inhibitor of focal adhesion kinase (FAK), against pediatric tumor models by the Pediatric Preclinical Testing Program. Pediatr Blood Cancer 64: 2017. [DOI] [PMC free article] [PubMed] [Google Scholar]
- 62.Feng X, Arang N, Rigiracciolo DC, Lee JS, Yeerna H, Wang Z, Lubrano S, Kishore A, Pachter JA, Konig GM, Maggiolini M, Kostenis E, Schlaepfer DD, Tamayo P, Chen Q, Ruppin E, and Gutkind JS. A Platform of Synthetic Lethal Gene Interaction Networks Reveals that the GNAQ Uveal Melanoma Oncogene Controls the Hippo Pathway through FAK. Cancer Cell 35: 457–472 e455, 2019. [DOI] [PMC free article] [PubMed] [Google Scholar]
- 63.Ji N, Yang Y, Cai CY, Lei ZN, Wang JQ, Gupta P, Teng QX, Chen ZS, Kong D, and Yang DH. VS-4718 Antagonizes Multidrug Resistance in ABCB1- and ABCG2- Overexpressing Cancer Cells by Inhibiting the Efflux Function of ABC Transporters. Front Pharmacol 9: 1236, 2018. [DOI] [PMC free article] [PubMed] [Google Scholar]
- 64.Griffiths G, Pfeiffer S, Simons K, and Matlin K. Exit of newly synthesized membrane proteins from the trans cisterna of the Golgi complex to the plasma membrane. J Cell Biol 101: 949–964, 1985. [DOI] [PMC free article] [PubMed] [Google Scholar]
- 65.Lu HJ, Matsuzaki T, Bouley R, Hasler U, Qin QH, and Brown D. The phosphorylation state of serine 256 is dominant over that of serine 261 in the regulation of AQP2 trafficking in renal epithelial cells. Am J Physiol Renal Physiol 295: F290–294, 2008. [DOI] [PMC free article] [PubMed] [Google Scholar]
- 66.Brown D, Hasler U, Nunes P, Bouley R, and Lu HA. Phosphorylation events and the modulation of aquaporin 2 cell surface expression. Curr Opin Nephrol Hypertens 17: 491–498, 2008. [DOI] [PMC free article] [PubMed] [Google Scholar]
- 67.Hoffert JD, Fenton RA, Moeller HB, Simons B, Tchapyjnikov D, McDill BW, Yu MJ, Pisitkun T, Chen F, and Knepper MA. Vasopressin-stimulated increase in phosphorylation at Ser269 potentiates plasma membrane retention of aquaporin-2. J Biol Chem 283: 24617–24627, 2008. [DOI] [PMC free article] [PubMed] [Google Scholar]
- 68.Simon H, Gao Y, Franki N, and Hays RM. Vasopressin depolymerizes apical F-actin in rat inner medullary collecting duct. Am J Physiol 265: C757–762, 1993. [DOI] [PubMed] [Google Scholar]
- 69.Holst MR, Jensen LG, Aaron J, Login FH, Rajkumar S, Hahn U, and Nejsum LN. Regulated exocytosis: renal aquaporin-2 3D vesicular network organization and association with F-actin. Am J Physiol Cell Physiol 321: C1060–C1069, 2021. [DOI] [PubMed] [Google Scholar]
- 70.Nielsen S, DiGiovanni SR, Christensen EI, Knepper MA, and Harris HW. Cellular and subcellular immunolocalization of vasopressin-regulated water channel in rat kidney. Proc Natl Acad Sci U S A 90: 11663–11667, 1993. [DOI] [PMC free article] [PubMed] [Google Scholar]
- 71.Nielsen S, Chou CL, Marples D, Christensen EI, Kishore BK, and Knepper MA. Vasopressin increases water permeability of kidney collecting duct by inducing translocation of aquaporin-CD water channels to plasma membrane. Proc Natl Acad Sci U S A 92: 1013–1017, 1995. [DOI] [PMC free article] [PubMed] [Google Scholar]
- 72.Breton S, and Brown D. Cold-induced microtubule disruption and relocalization of membrane proteins in kidney epithelial cells. J Am Soc Nephrol 9: 155–166, 1998. [DOI] [PubMed] [Google Scholar]
- 73.Coleman RA, Wu DC, Liu J, and Wade JB. Expression of aquaporins in the renal connecting tubule. Am J Physiol Renal Physiol 279: F874–883, 2000. [DOI] [PubMed] [Google Scholar]
- 74.Jeon US, Joo KW, Na KY, Kim YS, Lee JS, Kim J, Kim GH, Nielsen S, Knepper MA, and Han JS. Oxytocin induces apical and basolateral redistribution of aquaporin- 2 in rat kidney. Nephron Exp Nephrol 93: e36–45, 2003. [DOI] [PubMed] [Google Scholar]
- 75.De Seigneux S, Nielsen J, Olesen ET, Dimke H, Kwon TH, Frokiaer J, and Nielsen S. Long-term aldosterone treatment induces decreased apical but increased basolateral expression of AQP2 in CCD of rat kidney. Am J Physiol Renal Physiol 293: F87–99, 2007. [DOI] [PubMed] [Google Scholar]
- 76.Olesen ET, Rutzler MR, Moeller HB, Praetorius HA, and Fenton RA. Vasopressin- independent targeting of aquaporin-2 by selective E-prostanoid receptor agonists alleviates nephrogenic diabetes insipidus. Proc Natl Acad Sci U S A 108: 12949–12954, 2011. [DOI] [PMC free article] [PubMed] [Google Scholar]
- 77.Efe O, Klein JD, LaRocque LM, Ren H, and Sands JM. Metformin improves urine concentration in rodents with nephrogenic diabetes insipidus. JCI Insight 1: 2016. [DOI] [PMC free article] [PubMed] [Google Scholar]
- 78.Ando F, Hara Y, and Uchida S. Identification of protein kinase A signalling molecules in renal collecting ducts. J Physiol 602: 3057–3067, 2024. [DOI] [PubMed] [Google Scholar]
- 79.Tamma G, Klussmann E, Procino G, Svelto M, Rosenthal W, and Valenti G. cAMP- induced AQP2 translocation is associated with RhoA inhibition through RhoA phosphorylation and interaction with RhoGDI. J Cell Sci 116: 1519–1525, 2003. [DOI] [PubMed] [Google Scholar]
- 80.Noda Y, Horikawa S, Katayama Y, and Sasaki S. Water channel aquaporin-2 directly binds to actin. Biochem Biophys Res Commun 322: 740–745, 2004. [DOI] [PubMed] [Google Scholar]
- 81.Pochynyuk O, Staruschenko A, Bugaj V, Lagrange L, and Stockand JD. Quantifying RhoA facilitated trafficking of the epithelial Na+ channel toward the plasma membrane with total internal reflection fluorescence-fluorescence recovery after photobleaching. J Biol Chem 282: 14576–14585, 2007. [DOI] [PubMed] [Google Scholar]
- 82.Stirling L, Williams MR, and Morielli AD. Dual roles for RHOA/RHO-kinase in the regulated trafficking of a voltage-sensitive potassium channel. Mol Biol Cell 20: 2991–3002, 2009. [DOI] [PMC free article] [PubMed] [Google Scholar]
- 83.Yui N, Lu HA, Chen Y, Nomura N, Bouley R, and Brown D. Basolateral targeting and microtubule-dependent transcytosis of the aquaporin-2 water channel. Am J Physiol Cell Physiol 304: C38–48, 2013. [DOI] [PMC free article] [PubMed] [Google Scholar]
- 84.Kim YH, Earm JH, Ma T, Verkman AS, Knepper MA, Madsen KM, and Kim J. Aquaporin-4 expression in adult and developing mouse and rat kidney. J Am Soc Nephrol 12: 1795–1804, 2001. [DOI] [PubMed] [Google Scholar]
- 85.Ecelbarger CA, Terris J, Frindt G, Echevarria M, Marples D, Nielsen S, and Knepper MA. Aquaporin-3 water channel localization and regulation in rat kidney. Am J Physiol 269: F663–672, 1995. [DOI] [PubMed] [Google Scholar]
- 86.Chen YC, Cadnapaphornchai MA, and Schrier RW. Clinical update on renal aquaporins. Biol Cell 97: 357–371, 2005. [DOI] [PubMed] [Google Scholar]
- 87.Yang B, van Hoek AN, and Verkman AS. Very high single channel water permeability of aquaporin-4 in baculovirus-infected insect cells and liposomes reconstituted with purified aquaporin-4. Biochemistry 36: 7625–7632, 1997. [DOI] [PubMed] [Google Scholar]
- 88.Israeli S, Amsler K, Zheleznova N, and Wilson PD. Abnormalities in focal adhesion complex formation, regulation, and function in human autosomal recessive polycystic kidney disease epithelial cells. Am J Physiol Cell Physiol 298: C831–846, 2010. [DOI] [PMC free article] [PubMed] [Google Scholar]
- 89.Mierke CT, Fischer T, Puder S, Kunschmann T, Soetje B, and Ziegler WH. Focal adhesion kinase activity is required for actomyosin contractility-based invasion of cells into dense 3D matrices. Sci Rep 7: 42780, 2017. [DOI] [PMC free article] [PubMed] [Google Scholar]
- 90.Tai G, Hohenstein P, and Davies JA. FAK-Src signalling is important to renal collecting duct morphogenesis: discovery using a hierarchical screening technique. Biol Open 2: 416–423, 2013. [DOI] [PMC free article] [PubMed] [Google Scholar]
- 91.Lim ST, Chen XL, Tomar A, Miller NL, Yoo J, and Schlaepfer DD. Knock-in mutation reveals an essential role for focal adhesion kinase activity in blood vessel morphogenesis and cell motility-polarity but not cell proliferation. J Biol Chem 285: 21526–21536, 2010. [DOI] [PMC free article] [PubMed] [Google Scholar]