

Abstract
Crop species experienced strong selective pressure directed at genes controlling traits of agronomic importance during their domestication and subsequent episodes of selective breeding. Consequently, these genes are expected to exhibit the signature of selection. We screened 501 maize genes for the signature of selection using microsatellites or simple sequence repeats (SSRs). We applied the Ewens–Watterson test, which can reveal deviations from a neutral-equilibrium model, as well as two nonequilibrium tests that incorporate the domestication bottleneck. We investigated two classes of SSRs: those known to be polymorphic in maize (Class I) and those previously classified as monomorphic in maize (Class II). Fifteen SSRs exhibited some evidence for selection in maize and 10 showed evidence under stringent criteria. The genes containing nonneutral SSRs are candidates for agronomically important genes. Because demographic factors can bias our tests, further independent tests of these candidates are necessary. We applied such an additional test to one candidate, which encodes a MADS box transcriptional regulator, and confirmed that this gene experienced a selective sweep during maize domestication. Genomic scans for the signature of selection offer a means of identifying new genes of agronomic importance even when gene function and the phenotype of interest are unknown.
Over the past decade, there has been a growing interest in using evolutionary analyses to identify genes that control phenotypes of biological, agronomic, or medical importance. Crop plants offer a special opportunity to identify such genes because they have been through recent and strong selective sweeps targeted at phenotypes that improve agronomic performance, palatability, or nutritional quality. These selective sweeps can dramatically reduce genetic diversity in the target genes or genomic regions, whereas unselected genes retain levels of diversity nearly comparable to those found in the progenitor species. Thus, by scanning crop genomes for genes or genomic regions that show the signature of selection, one can identify candidates for genes that control phenotypes of agronomic importance.
There are potential complications with this strategy. First, when a gene is under selection, there can be a significant loss of diversity not only in the target gene but also in linked genes because of the “hitchhiking” effect (1). The severity of this effect will depend on multiple factors including the strength of selection, recombination rates, breeding system, and population sizes. Ideal crops for this approach would be those with high recombination rates, a large population size, outcrossing breeding systems, and histories that involved a gradual rise in the frequencies of favorable alleles. Second, the population bottleneck associated with domestication will also cause a genome-wide loss of diversity that could be misidentified as the signature of selection. However, this effect can be compensated for by the use of models that incorporate the domestication bottleneck and enable one to define the threshold above which the loss of diversity is too great to be solely the effect of this demographic event.
Among crops, maize (Zea mays L. ssp. mays) seems a promising one for genomic scans for genes that exhibit the signature of past selection. Maize exhibits high levels of recombination (2) and correspondingly low levels of linkage disequilibria (3, 4). Maize is an outcrossing species, and historical population sizes for maize were large (5). Thus, even if relatively strong selection was placed upon a gene during maize domestication, there is a reasonable expectation that neighboring genes will have retained near normal levels of diversity (6). This circumstance reduces the possibility of observing false positives, i.e., unselected genes that have low diversity because of the hitchhiking effect. Also for maize, the domestication bottleneck had a relatively modest effect, so unselected genes retain high diversity and can be readily distinguished from those affected by selection (7, 8).
Here, we report the screening of 501 maize genes for the signature of selection or nonneutral evolution using microsatellites or simple sequence repeats (SSRs). We apply a test for deviation from neutral evolution under an equilibrium model as well as two nonequilibrium tests that compensate for diversity loss during the domestication bottleneck. We investigate two classes of SSRs: Class I are those known to be polymorphic among U.S. maize inbreds, and Class II are those for which previous analyses found no variation in U.S. inbreds. Among our sample of Class I SSRs, we found minimal evidence for past selection; however, 10 Class II SSRs exhibited evidence of past selection under stringent criteria. Our strategy could be extended to larger samples of SSRs, other genetic markers, and cases where crops were adapted to new environments after domestication.
Materials and Methods
Plant Materials.
Plants were chosen to represent the diversity in maize landraces and in two wild relatives of maize (teosintes), Z. mays ssp. parviglumis and ssp. mexicana. The maize landraces include 2 accessions from the U.S.-Canada, 16 from Mexico or Guatemala, 2 from the Caribbean, and 30 from South America. Z. mays ssp. parviglumis (27 accessions) is included because it has been identified as the progenitor of maize (9). Z. mays ssp. mexicana (23 accessions) is included because it is geographically wide-spread in Mexico and frequently hybridizes with maize. Thus, although it is not considered the progenitor of maize, it is a potential contributor to the maize gene pool via introgression. Passport data for the plant materials are detailed in Table 3, which is published as supporting information on the PNAS web site, www.pnas.org.
SSR Loci.
At the time we initiated this study, the Maize Mapping Project had developed 1,772 scorable SSRs from expressed sequence tags (ESTs), of which 1,053 were classified as polymorphic (our Class I) and 719 as monomorphic (our Class II) among 11 U.S. maize inbreds (10). To determine whether the Class II SSRs would be similarly monomorphic among a broader sample of maize and teosinte, we screened 470 Class II SSRs against six teosinte accessions and five maize landraces on agarose gels (a list of the SSRs can be found in Table 4, which is published as supporting information on the PNAS web site). This analysis identified 75 Class II SSRs that were polymorphic in teosinte, but monomorphic in our sample of 5 maize landraces plus the 11 U.S. inbreds. We will refer to this subset of Class II SSRs that was “enriched” for low diversity in maize relative to ssp. parviglumis as Class IIE. Of these 75, 44 were screened against a larger sample of 44 teosinte and 45 maize accessions (one plant each) to obtain precise estimates of genetic diversity. We also used 31 Class I SSRs for comparison, giving a total of 75 SSRs screened on the larger plant sample. A list of these 75 SSRs can be found in Table 5, which is published as supporting information on the PNAS web site.
SSR Genotyping.
SSRs were screened on either agarose gels or automated DNA sequencers following published procedures (10, 11) for DNA extractions, PCR, gel electrophoresis, and PCR product-length determinations, with two modifications. First, all SSRs were amplified without multiplexing. Second, some analyses were done on an ABI3100 rather than an ABI377.
Statistics.
Genetic diversity or heterozygosity (H), the number of alleles (N) and Fst were calculated by using the software program FSTAT (12). To measure the relative loss of genetic diversity in maize vs. teosinte, we have defined a parameter ΔGD = 1 − (Hm/Ht), where Hm and Ht are genetic diversity in maize and teosinte, respectively. The relative loss of the number of alleles is ΔAllele = 1 − (Nm/Nt), where Nm and Nt are the number of alleles in maize and teosinte respectively. The Ewens–Watterson test of neutrality was performed with the program ARLEQUIN (13). To obtain sufficient precision with this test, the probability was recorded as the mean of 20 independent repeats of 1,000 simulations. Mann–Whitney (MW) tests and Student's t test were performed by using SYSTAT (SPSS, Chicago).
Simulations.
We asked the question, “Is diversity at an SSR lower in maize than in teosinte as a result of human selection?” Addressing this question is complicated, because the domestication bottleneck has caused a general loss of diversity in maize. Thus, tests for selection need to compensate for the general bottleneck effect. To do this, we used coalescent simulations to compare the genetic diversity (or divergence) at a locus with what one would expect under a neutral model that incorporates the domestication bottleneck. The details of this approach are briefly summarized here.
Consider a model in which a crop and its progenitor have split at some time in the past and have remained isolated since that time (7). The wild progenitor population remains at equilibrium from the divergence time to the present. The crop population undergoes a bottleneck during the domestication period and then expands to a large size. We simulated this scenario by using a coalescent process (14). Sample sizes for maize and its progenitor in the simulations were equivalent to the actual sample sizes for our SSR data. The bottleneck was taken into account by rescaling the coalescent time by the ratio of the size of maize during the bottleneck divided by the size after expansion. Mutation events were superimposed on the simulated genealogies following either the infinite allele model (IAM; ref. 15) or stepwise model (SMM; ref. 16). These two models permit the investigation of the extremes of the mutational process expected for SSRs.
To implement the simulations, we must estimate the effective population size of the wild progenitor, the effective population size of maize during the bottleneck and after its expansion, the time of divergence of maize and teosinte, and the duration of the bottleneck. The time of divergence was set at 7,500 years (8). The effective size for ssp. parviglumis was set to 40,000 (5). The parameters—the duration of the bottleneck and the effective sizes of maize during and after the bottleneck—are uncertain, but these parameters are not independent of each other. Therefore, we developed a mathematical model for estimating these parameters by extending Slatkin's (17) model to the case of maize domestication. Under our model, different durations of the bottleneck—100, 200, 500, 1,000, and 2,500 years—yield expected values for the effective population size of maize during the bottleneck of 107, 220, 553, 1117, and 2875, respectively. These values agree well with independent results from simulations (18).
By using these different parameters, including the five sets of values for the size and duration of the bottleneck, we simulated the expected level of genetic diversity in maize and ssp. parviglumis. Because the mutation rate is highly variable among loci (5), each individual simulation was performed with a mutation rate that was randomly selected to give a uniform distribution for either heterozygosity or the number of alleles, depending on the test performed (see below). Values for Fst, HM, genetic diversity in ssp. parviglumis (HP), and the number of alleles were calculated from the results of 800,000 simulations.
Two different tests were used to identify SSRs that may have been under selection. First, we compared the observed value of Fst (a measure of genetic divergence) as a function of the total number of alleles for our data with the 95% confidence limits established by simulation. We will refer to this as the Fst test. Second, we compared genetic diversity in maize vs. ssp. parviglumis for our observed data with the 95% confidence limits for these parameters established by simulation. We will refer to this as the Genetic Diversity (GD) test. The GD test asks whether diversity in maize relative to teosinte is lower than expected given our model for maize's demographic history, and the Fst test asks whether divergence between maize and teosinte is greater than expected, given this model.
Sequence Analysis.
We measured nucleotide diversity in maize and teosinte for the EST AI737167 in which our SSR of the same name is located. Oligonucleotide primers (AGCAACGAAGATTTACGTGA and CGGAGCAGCTAGCTAATAGA) were designed to PCR amplify a 600-bp portion of the gene for 16 maize, 15 ssp. parviglumis, and one Zea diploperennis sample using High Fidelity PCR Supermix (Life Technologies, Grand Island, NY) (GenBank accession nos. AY089919-AY089950). The maize samples, which are all landraces, have been described (4). Sources of the teosinte samples are described in the GenBank records. For teosinte, the PCR products were cloned, and four to six clones were sequenced from each individual plant. Two clones from a single plant that were identical in sequence were considered to represent the sequence of one of the alleles from that plant. Where a single clone had unique polymorphism(s), these were considered possible Taq polymerase errors, and these sequences were excluded from the analysis. The software program DNASP (19) was used to calculate θ, a measure of nucleotide diversity and to perform Hudson–Kreitman–Aguadé (HKA) tests (20). For the HKA test, we used adh1, adh2, glb1, and te1 as neutral or control genes (7, 8, 18, 21).
Results
SSR Screening.
As shown below from our simulations, SSRs with values of H less than 0.40 in ssp. parviglumis can become monomorphic in maize from the bottleneck alone. This class of SSRs is not optimal for identifying nonneutral SSRs. To identify SSRs with low diversity in ssp. parviglumis rapidly and exclude these loci from the more exhaustive assays on automated DNA sequencers, we screened the 470 Class II SSRs on a sample of six ssp. parviglumis plants on agarose gels. With this small sample, there is a 95% chance of detecting some polymorphism (>1 allele) if H in ssp. parviglumis is ≥0.34, assuming Hardy–Weinberg conditions. Similarly, we can identify and exclude from the exhaustive assays Class II SSRs that have low diversity in U.S. inbreds but higher diversity in landraces by sampling five landrace plants. Only Class II SSRs that exhibited polymorphism in ssp. parviglumis but not in either U.S. inbreds or landrace plants in this initial screen were selected for intensive study.
In this initial screen, 321 of the 470 Class II SSRs (68%) were monomorphic among the six ssp. parviglumis and five maize landrace plant samples just as they were in the 11 U.S. inbreds. These SSRs are either monomorphic or have values of H < 0.4 in maize and ssp. parviglumis. Sixty of the 470 Class II SSRs (13%) were variable among both our six ssp. parviglumis plants and our five maize landrace plants. These SSRs are likely to have lower diversity in U.S. inbreds than maize overall, in which case, they are not good candidates for SSRs that were under selection during domestication. Fourteen of the 470 SSRs (3%) were variable in landrace maize but not in ssp. parviglumis and, again, are not good candidates for selected genes, because our small sample suggests maize is at least as diverse as ssp. parviglumis. The final group, 75 of the 470 SSRs (16%), were variable among our 6 ssp. parviglumis plants but monomorphic among the 5 landrace plants and 11 U.S. inbred lines. We term these Class IIE because they are “enriched” for low diversity in maize relative to ssp. parviglumis. Class IIE are the best candidates for SSRs that were under selection during maize domestication or early improvement. We chose 44 of them for further analysis.
Diversity.
Diversity statistics were determined for 44 Class IIE SSRs with samples of 44 teosinte and 45 maize plants (Table 1). We included 31 Class I SSRs, because a comparison of the classes provides a measure of the effectiveness of our criteria for identifying putatively selected SSRs. For our sample of 45 maize landrace plants, Class IIE SSRs have a lower number of alleles per locus than the Class I SSRs (MW test, P < 0.001) and a far lower genetic diversity (MW test, P < 0.001). For our sample of 44 teosinte plants, Class IIE SSRs have a lower number of alleles per locus than Class I SSRs (MW test, P < 0.02) and a lower but not significantly lower genetic diversity (MW test, P < 0.19). Both classes of SSRs show a loss of diversity in maize as compared with teosinte; however, this loss is significantly greater for Class IIE SSRs whether measured as ΔAllele (MW test, P < 0.01) or ΔGD (MW test, P < 0.001). The mean Fst value between maize and teosinte is 0.16 for Class IIE SSRs, as compared with 0.07 for Class I. The mean Fst value is significantly higher for Class IIE (MW test, P < 0.001). These statistics show that Class IIE SSRs are less diverse than Class I as expected, because we biased our sampling in favor of low diversity for Class IIE. But the statistics also show a greater relative loss of diversity for Class IIE than for Class I, as expected if, as a group, they have experienced selection. Also, consistent with a role for selection, Class I and IIE are less differentiated in teosinte than they are in maize. Overall, these statistics indicate that our screen effectively identified good candidates for targets of selection.
Table 1.
Diversity and relative diversity loss between teosinte and maize
| Teosinte | Maize landraces | Diversity loss | |
|---|---|---|---|
| Number of alleles | ΔAllele | ||
| Class I | 7.0 (±0.55) | 5.5 (±0.45) | 0.19 (±0.053) |
| Class IIE | 5.6 (±0.43) | 3.4 (±0.25) | 0.32 (±0.037) |
| Genetic diversity | ΔGD | ||
| Class I | 0.60 (±0.038) | 0.51 (±0.036) | 0.11 (±0.063) |
| Class IIE | 0.54 (±0.034) | 0.21 (±0.029) | 0.62 (±0.042) |
Average number of alleles and genetic diversity in teosinte and maize, and the relative loss of alleles (ΔAllele) and genetic diversity (ΔGD) are shown with the standard errors.
Selection.
The Ewens–Watterson test enables one to detect deviations from a neutral-equilibrium model as either a deficit of genetic diversity relative to the number of alleles at a locus (below the curve in Fig. 1) or an excess of genetic diversity (above the curve in Fig. 1; ref. 22). We applied this test to all of the Class I SSRs and 39 of the 44 Class IIE SSRs. (Five Class IIE SSRs could not be tested because they are invariant in maize.) None of the 31 Class I SSRs exhibits a significant Ewens–Watterson test in maize, and only one does so in teosinte (Table 2). Two of the 39 Class IIE SSRs exhibit an excess in genetic diversity relative to the number of alleles in teosinte, a result compatible with balancing or diversifying selection. Seven Class IIE loci exhibit a significant (P > 0.975) deficit of heterozygosity relative to the number of alleles in maize (Table 2), a pattern consistent with positive selection. It also could be the result of a neutral demographic scenario like a bottleneck followed by population growth; however, in that case, one would expect all SSRs to be affected equally, and none of the 31 Class I SSRs exhibit a significant test in maize.
Figure 1.

Graphical representation of the Ewens–Watterson test of neutrality for maize showing heterozygosity vs. the number of alleles. The median (gray line) and 2.5 to 97.5% confidence intervals (black lines) are shown.
Table 2.
Results of the tests of selection and EST homology
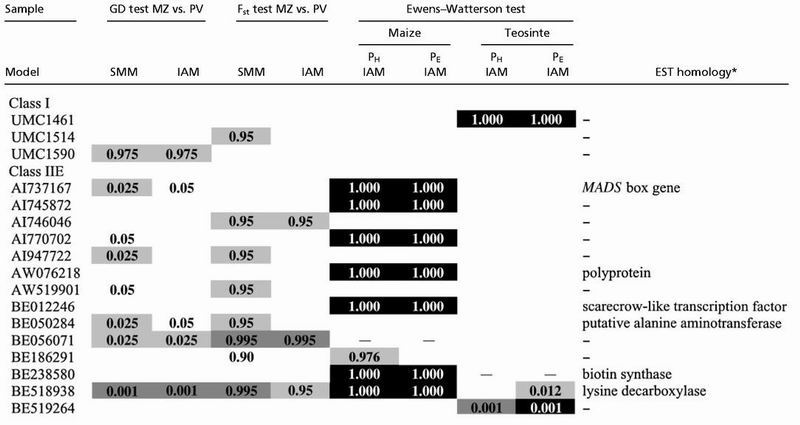 |
Probabilities for the genetic diversity test (two-tailed) or for the Fst test (one-tailed) are presented for the infinite allele (IAM) and stepwise mutation (SMM) models. The probabilities for the Ewens–Watterson test were calculated based on homozygosity (PH) or Fisher's exact test (PE). The Ewens–Watterson test can not be performed on loci that are invariant in a sample as indicated by a dash (–). P values are unshaded (nearly significant), light gray (significant), medium gray (highly significant) or black (Bonferroni corrected).
From www.zmdb.iastate.edu.
If an overall neutral pattern is observed for a set of loci, one expects the average of the P values from the Ewens–Watterson tests to be close to 0.5, with the values for the individual SSRs evenly distributed around the median. The 31 Class I SSRs show an average P value equivalent to 0.5 in maize and in teosinte (t = 0.69, P > 0.50 and t = −0.40, P > 0.69, respectively). The 44 Class IIE SSRs show an average P value equivalent to 0.5 in teosinte (t = −0.50, P > 0.62), but a value (0.76) that is significantly larger than 0.5 in maize (t = 7.4, P < 0.001). The observation that the 44 Class IIE SSRs have an average P value greater than 0.5, whereas the Class I SSRs do not, suggests that selection has affected genetic diversity at Class IIE SSRs. Despite this promising result, a more judicious test of selection would be one that incorporates the domestication bottleneck, such as our Fst and GD tests.
The Fst test asks if the degree of differentiation at an SSR conditioned on the number of alleles exceeds neutral expectations (23, 24) after compensating for the domestication bottleneck. In this test, the two mutation models (IAM and SMM) give similar results, except when the number of alleles is greater than four, in which case, the stepwise mutation model is characterized by a lower median value of Fst and a narrower confidence interval (Fig. 2). Results of the Fst test indicate that Class IIE SSRs show more frequent deviations from neutrality than do the Class I SSRs (Fig. 2; Table 2). Under the SMM, there are six significant tests for Class IIE SSRs but only one for Class I SSRs. Under the IAM, there are three significant tests for Class IIE SSRs but none for Class I SSRs. The GD test asks if the relative loss of genetic diversity is greater than expected after compensating for the domestication bottleneck. One important result of the simulations is that when H is low in ssp. parviglumis (<0.4), then the effects of the bottleneck alone can drive H in maize to 0.0 (Fig. 3). Results with the two models of mutation are roughly equivalent, except when H for ssp. parviglumis exceeds 0.70, in which case the SMM shows a narrower 95% confidence limit. Results of the GD tests indicate that Class IIE SSRs show more frequent deviations from neutrality than do the Class I SSRs with five significant tests for Class IIE SSRs but only one for Class I SSRs (Fig. 3; Table 2).
Figure 2.

Plot of Fst vs. the number of alleles. The 50 and 95% percentile curves of the expected Fst value from the coalescent simulations for both the SMM and IAM models are shown.
Figure 3.

Plot of the observed genetic diversity (H) in ssp. parviglumis and maize. The lines are the simulation-based 50% and 2.5 and 97.5% percentile curves of the expected genetic diversity in maize given the observed genetic diversity in ssp. parviglumis for the SMM and IAM models.
There are a total of 15 SSRs with some evidence for selection in maize, including 13 of the 44 Class IIE SSRs and 2 of the 31 Class I SSRs (Table 2). The degree of support for nonneutral evolution in maize is not equivalent among these 15 SSRs. Only 5 SSRs (all of which are Class IIE) are supported as nonneutral under two different types of tests. An additional 5 SSRs (all Class IIE) are supported as nonneutral for a single test after application of a Bonferroni correction (Table 2). Collectively, these 10 SSRs are the best candidates for loci under selection during maize domestication and improvement.
Candidates.
Because nearly all of the SSRs are from ESTs, these ESTs can be considered candidates for genes under selection during maize domestication and improvement when the SSR shows a deviation from neutrality. Knowing the functions and map locations of these genes will be useful for associating them with quantitative trait loci (QTL) for traits that were under selection during maize domestication and improvement. Among the 15 loci with some evidence for selection in maize, 6 show homology to known genes (Table 2). We also placed 26 of the 44 Class IIE SSRs on the maize genetic map by using maize × teosinte mapping populations (see Table 6, which is published as supporting information on the PNAS web site). Several interesting associations are apparent and worthy of further investigation. First, the MADS gene (AI737167) maps on the short arm of chromosome 1 near a QTL for differences in ear structure between maize and teosinte (25). Second, although of unknown function, AI746046 is expressed in endosperm and maps to chromosome 3 near the largest of the seed weight QTL that distinguish maize and teosinte (26). Third, five of the 13 putatively selected Class IIE SSRs map to chromosome 1, which also contains the largest number of QTL associated with maize domestication (25).
Candidate Testing.
Using SSRs in genomic scans for nonneutral evolution in maize provides a list of candidates for selected genes. We examined one of these candidates (MADS gene; AI737167) in greater detail by DNA sequence analysis, because it maps near a domestication QTL. AI737167 shows the strong signature of positive selection at the nucleotide level. First, the only sequence variation among the 16 maize landrace samples was a single deletion in one sample. For the 16 sequences, θ/bp = 0.0, whereas neutrally evolving maize genes typically have values of ≈0.012 for θ/bp (4, 8). Second, teosinte possesses normal levels of diversity for AI737167 (θ = 0.011), indicating that low diversity is not simply a feature of this gene. Third, HKA tests with each of four neutral genes (adh1, adh2, glb1, and te1) are all significant (P < 0.05), and the overall P value is highly significant (χ2 = 39.41; P = 4.1 × 10⁻⁶), indicating that the ratio of polymorphism within maize to divergence from an outgroup at AI737167 is lower than that ratio for a neutral gene as expected under a recent selective sweep.
Discussion
We have investigated diversity at maize SSRs with the intention of identifying SSRs that show evidence of selection during maize domestication or improvement. Because the SSRs we have examined come almost exclusively from ESTs, they serve as reporters for selection on the genes (ESTs) themselves. Genes that were selected by maize cultivators are those that would have improved the agronomic performance, palatability, or nutritional quality of maize. If these genes were important in the past improvement of maize, their continued manipulation might contribute to future gain. If, in the past, these selected genes suffered a loss of diversity because of selection, then they are prime candidates for introgressive breeding from wild relatives to increase the pool of diversity with which modern breeders can work (27).
We distinguished two classes of SSRs within ESTs: those known to be polymorphic among U.S. inbreds (Class I) and those defined as monomorphic among these lines (Class II). To enhance the likelihood of identifying the best candidates for selected SSRs, we identified a subgroup (E) of Class II SSRs that were enriched for low diversity in maize relative to ssp. parviglumis. In a sense, our strategy was to sift through the maize mappers “trash bin”; for, although monomorphic loci are the bane of the mapper, they are apt to be the nonneutral loci of most interest to evolutionary biologists. This strategy was successful in that Class IIE SSRs show a greater relative loss of diversity (ΔGD or ΔAllele) than do Class I SSRs and a greater average differentiation (Fst) between maize and teosinte. Thus, Class IIE SSRs come from the portion of the distribution where loci that exhibit the effect of selection are most likely to occur. This does not demonstrate that any individual Class IIE SSR has experienced selection, but it does indicate that nonneutral loci should be over-represented among Class IIE SSRs, as compared with the general population of SSRs.
Cautions.
Four issues deserve discussion so that our results are correctly interpreted. First, the hitchhiking effect must be considered. Are we identifying selected loci or neutral loci that are simply tightly linked to selected ones? Barring a focused investigation of each individual candidate, this question cannot be answered. However, the high recombination rates in maize genes (2) and correspondingly low levels of linkage disequilibrium (3, 4) suggest that selection need not be associated with a very powerful hitchhiking effect. Indeed, selection during maize domestication at the tb1 gene seems to have greatly reduced the levels of diversity in the promoter without a large reduction in the coding region (6). Second, the enrichment procedure used to identify the Class IIE subgroup of SSRs creates two biases. One is the intended bias to enrich the pool for nonneutral loci. The other bias is to enrich the pool for neutral loci that are on the tails of the distribution. This latter bias compromises the GD test because the criteria of the enrichment procedure are the same as those of the GD test. For this reason, the Fst and Ewens–Watterson tests provide more convincing evidence for selection, because the basis of these tests is independent of the enrichment strategy. Third, the significance levels for the GD and Fst tests are derived from the simulations, and, thus, they are sensitive to our estimates of parameters such as the size and duration of the bottleneck and the effective population size of the progenitor. Refined estimates for these parameters will improve the reliability of the tests. Fourth, we emphasize that positive test results only elevate a locus to candidate status and do not demonstrate selection in our view. Thus, the candidates need verification via additional tests such as the HKA. Because we view loci with significant test results only as candidates, we also argue that agricultural scientists should moderate the usual concern about false positives (type I statistical errors) and apply the P = 0.05 significance level somewhat loosely so that all reasonable, even if marginal, candidates are advanced to the next level of testing.
Tests of Selection.
The underlying premise of our tests is that human selection during maize domestication and improvement will have reduced variation in excess of the bottleneck effect in genes for which the progenitor species possessed allelic variation contributing to traits of human interest (“selected genes”), whereas other loci will experience a loss of diversity that is commensurate with the bottleneck effect alone. Successful application of this approach to crop species depends upon several conditions. First, the bottleneck effect must be relatively modest so that most neutral genes retain high levels of diversity through the bottleneck. For maize and many other crops, this condition is met (7, 9). Second, the progenitor species must have relatively high levels of variation so that most genes have variation to be retained through the bottleneck. Zea mays ssp. parviglumis is among the most variable species known (7, 8).
We have used three tests of selection that complement each other, because they assess deviations from neutrality on distinct criteria. Still, there is concern as to whether these tests are too liberal or too conservative. The Ewens–Watterson test is based upon the expected relationship between H and the number of alleles in a population at equilibrium (22). As a species that has been through a recent bottleneck, maize is unlikely to have reached equilibrium, and, thus, a significant test result might be caused by demographic history alone. A counter argument is that because our Class I SSRs exhibit no significant Ewens–Watterson tests, and they have the same demographic history as Class IIE SSRs, then demography cannot explain the significant results for the Class IIE SSRs.
The Fst and GD tests compensate for the domestication bottleneck by setting confidence limits based on coalescence simulations that incorporate the bottleneck. The simulations are based upon a broad set of conditions that cover two different mutation models and wide ranges of mutation rates and demographic factors. One cannot say where the balance among all these factors lies, or whether the tests are too conservative, too liberal, or just right. If they are too conservative, then we would be underestimating the numbers of SSRs with reduced variation as a result of selection. For this reason, it may be of interest to examine in more detail some of the Class IIE SSRs that approach but fall short of the threshold for statistical significance or Class I SSRs that show minimal evidence of selection.
Candidates.
Fifteen loci show evidence of selection in maize. Of these, only six have homology with genes of known function. It is interesting that two have homology to transcription regulators (AI737167 and BE012246), given the prediction that this class of genes plays a disproportionately large role in evolutionary change (28). BE518938, which shows the strongest evidence of selection (Table 2), has homology to lysine decarboxylase. This enzyme functions in alkaloid synthesis and is present in seeds and during germination in soybean (29). Humans may have applied selection for lower alkaloid content in kernels to improve palatability. AI737167 has homology to MADS genes, a class of transcription factors involved in many developmental processes in plants. Because AI737167 maps near known domestication QTL, we are investigating it in more detail. BE012246 has homology to scarecrow-like transcription factors, a class of genes previously associated with crop improvement (30).
Perspective.
Genomic scans for selected genes have advantages relative to other approaches for the identification of agronomically important loci. Reverse genetics and expression profiling can identify genes that function in a developmental or biochemical pathway, but they do not demonstrate whether a gene is positioned in the pathway at a point that would enable it to influence the end product of that pathway in an agronomically useful way. Association tests identify genes that control agronomic traits (30); however, these tests require that the gene contain functional variation in the focal species. Genes of agronomic importance that have been reduced to a single allelic class cannot be discovered by using association analyses. Finally, a genomic scan for selected genes requires no a priori knowledge of the affected trait nor of gene function, so in principle, one can discover genes for new traits previously unrecognized as agronomically important and genes of unknown function that would not be used in candidate gene-driven approaches. In this way, such genomic scans will help create a more complete picture of how domestication and breeding have sculpted crop genomes.
The approach we have taken in this paper can be easily extended to other cases and marker types. For example, maize has been adapted to grow in deserts, mountains above 3,500 m elevation, and both tropical and temperate climates. Each of these adaptive events has potentially left the signature of selection on the genes involved that could be detected by using tests such as we have applied. As a marker technology, single nucleotide polymorphism (SNP) would offer the advantage of higher throughput when scanning the genome for evidence of selection. One could do SNP discovery in teosinte and then assay diverse maize lines, or again, sift through the SNP mapper's trash bin of monomorphic loci.
Supplementary Material
Acknowledgments
We thank Major Goodman and Jesus Sanchez for help in obtaining seeds, and Chip Aquadro, Ed Buckler, and Brandon Gaut for comments on the manuscript. We acknowledge grant support from National Science Foundation awards DBI0096033 and DBI9872655, National Institutes of Health award GM-58816, the United States Department of Agriculture-Agricultural Research Service, and a Howard Hughes Medical Institute fellowship to C.T.H.
Abbreviations
- SSR
simple sequence repeat
- H
heterozygosity
- MW
Mann–Whitney U test
- IAM
infinite allele model
- SMM
stepwise mutation model
- EST
expressed sequence tag
- QTL
quantitative trait locus
- N
number of alleles
- ΔGD
relative loss in genetic diversity
- Δ Allele
relative loss in the number of alleles
Footnotes
References
- 1.Maynard Smith J, Haigh J. Genet Res. 1974;23:23–35. [PubMed] [Google Scholar]
- 2.Fu H, Zheng Z, Dooner H K. Proc Natl Acad Sci USA. 2002;99:1082–1087. doi: 10.1073/pnas.022635499. [DOI] [PMC free article] [PubMed] [Google Scholar]
- 3.Remington D L, Thornsberry J M, Matsuoka Y, Wilson L M, Whitt S R, Doebley J, Kresovich S, Goodman M M, Buckler E S. Proc Natl Acad Sci USA. 2001;98:11479–11484. doi: 10.1073/pnas.201394398. [DOI] [PMC free article] [PubMed] [Google Scholar]
- 4.Tenaillon M I, Sawkins M C, Long A D, Gaut R L, Doebley J F, Gaut B S. Proc Natl Acad Sci USA. 2001;98:9161–9166. doi: 10.1073/pnas.151244298. [DOI] [PMC free article] [PubMed] [Google Scholar]
- 5. Vigouroux, Y., Jaqueth, J. S., Matsuoka, Y., Smith, O. S., Beavis, W. D., Smith, J. S. C. & Doebley, J. (2002) Mol. Biol. Evol., in press. [DOI] [PubMed]
- 6.Wang R L, Stec A, Hey J, Lukens L, Doebley J. Nature (London) 1999;398:236–239. doi: 10.1038/18435. [DOI] [PubMed] [Google Scholar]
- 7.Eyre-Walker A, Gaut R L, Hilton H, Feldman D L, Gaut B S. Proc Natl Acad Sci USA. 1998;95:4441–4446. doi: 10.1073/pnas.95.8.4441. [DOI] [PMC free article] [PubMed] [Google Scholar]
- 8.White S E, Doebley J F. Genetics. 1999;153:1455–1462. doi: 10.1093/genetics/153.3.1455. [DOI] [PMC free article] [PubMed] [Google Scholar]
- 9.Doebley J. In: Isozymes in Plant Biology. Soltis D, Soltis P, editors. Portland, OR: Dioscorides; 1989. pp. 165–191. [Google Scholar]
- 10.Sharopova N, McMullen M, Shultz L, Schroeder S, Sanchez-Villeda H, Gardiner J, Bergstrom D, Houchins K, Melia-Hancock S, Musket T, et al. Plant Mol Biol. 2002;48:463–481. doi: 10.1023/a:1014868625533. [DOI] [PubMed] [Google Scholar]
- 11.Matsuoka Y, Mitchell S E, Kresovich S, Goodman M M, Doebley J. Theor Appl Genet. 2002;104:436–450. doi: 10.1007/s001220100694. [DOI] [PubMed] [Google Scholar]
- 12.Goudet J. J Heredity. 1995;86:485–486. [Google Scholar]
- 13.Schneider S, Roessli D, Excoffier L. ARLEQUIN V.2000. University of Geneva, Switzerland: Genetics and Biometry Laboratory; 2000. [Google Scholar]
- 14.Hudson R R. Oxford Surv Evol Biol. 1990;7:1–44. [Google Scholar]
- 15.Ohta T, Kimura M. Genet Res. 1973;22:201–204. doi: 10.1017/s0016672300012994. [DOI] [PubMed] [Google Scholar]
- 16.Kimura M, Crow J. Genetics. 1964;49:725–738. doi: 10.1093/genetics/49.4.725. [DOI] [PMC free article] [PubMed] [Google Scholar]
- 17.Slatkin M. Mol Biol Evol. 1995;12:473–480. doi: 10.1093/oxfordjournals.molbev.a040222. [DOI] [PubMed] [Google Scholar]
- 18.Hilton H, Gaut B S. Genetics. 1998;150:863–872. doi: 10.1093/genetics/150.2.863. [DOI] [PMC free article] [PubMed] [Google Scholar]
- 19.Rozas J, Rozas R. Bioinformatics. 1999;15:174–175. doi: 10.1093/bioinformatics/15.2.174. [DOI] [PubMed] [Google Scholar]
- 20.Hudson R R, Kreitman M, Aguadé M. Genetics. 1987;116:153–159. doi: 10.1093/genetics/116.1.153. [DOI] [PMC free article] [PubMed] [Google Scholar]
- 21.Goloubinoff P, Paabo S, Wilson A C. Proc Natl Acad Sci USA. 1993;90:1997–2001. doi: 10.1073/pnas.90.5.1997. [DOI] [PMC free article] [PubMed] [Google Scholar]
- 22.Watterson G A. Genetics. 1978;88:405–417. doi: 10.1093/genetics/88.2.405. [DOI] [PMC free article] [PubMed] [Google Scholar]
- 23.Bowcock A M, Kidd J R, Mountain J L, Hebert J M, Carotenuto L, Kidd K K, Cavalli-Sforza L L. Proc Natl Acad Sci USA. 1991;88:839–843. doi: 10.1073/pnas.88.3.839. [DOI] [PMC free article] [PubMed] [Google Scholar]
- 24.Beaumont M A, Nichols R A. Proc R Soc London Ser B. 1996;263:1619–1629. [Google Scholar]
- 25.Doebley J, Stec A. Genetics. 1993;134:559–570. doi: 10.1093/genetics/134.2.559. [DOI] [PMC free article] [PubMed] [Google Scholar]
- 26.Doebley J, Bacigalupo A, Stec A. J Heredity. 1994;85:191–195. [Google Scholar]
- 27.Tanksley S D, McCouch S R. Science. 1997;277:1063–1066. doi: 10.1126/science.277.5329.1063. [DOI] [PubMed] [Google Scholar]
- 28.Doebley J, Lukens L. Plant Cell. 1998;10:1075–1082. doi: 10.1105/tpc.10.7.1075. [DOI] [PMC free article] [PubMed] [Google Scholar]
- 29.Lin P P. Plant Phys. 1984;76:372–380. doi: 10.1104/pp.76.2.372. [DOI] [PMC free article] [PubMed] [Google Scholar]
- 30.Thornsberry J M, Goodman M M, Doebley J, Kresovich S, Nielsen D, Buckler E S. Nat Genet. 2001;28:286–289. doi: 10.1038/90135. [DOI] [PubMed] [Google Scholar]
Associated Data
This section collects any data citations, data availability statements, or supplementary materials included in this article.