Abstract
A basic challenge in systems biology is to understand the dynamical behavior of gene regulation networks. Current approaches aim at determining the network structure based on genomic-scale data. However, the network connectivity alone is not sufficient to define its dynamics; one needs to also specify the kinetic parameters for the regulation reactions. Here, we ask whether effective kinetic parameters can be assigned to a transcriptional network based on expression data. We present a combined experimental and theoretical approach based on accurate high temporal-resolution measurement of promoter activities from living cells by using green fluorescent protein (GFP) reporter plasmids. We present algorithms that use these data to assign effective kinetic parameters within a mathematical model of the network. To demonstrate this, we employ a well defined network, the SOS DNA repair system of Escherichia coli. We find a strikingly detailed temporal program of expression that correlates with the functional role of the SOS genes and is driven by a hierarchy of effective kinetic parameter strengths for the various promoters. The calculated parameters can be used to determine the kinetics of all SOS genes given the expression profile of just one representative, allowing a significant reduction in complexity. The concentration profile of the master SOS transcriptional repressor can be calculated, demonstrating that relative protein levels may be determined from purely transcriptional data. This finding opens the possibility of assigning kinetic parameters to transcriptional networks on a genomic scale.
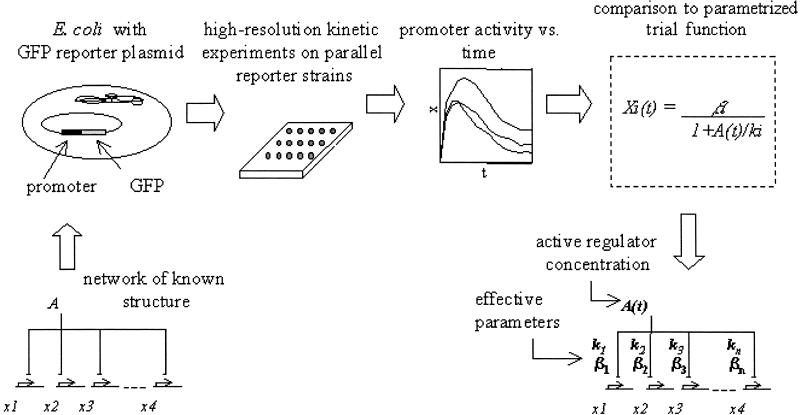
There is much interest in understanding the design principles underlying the structure and dynamics of gene regulation networks (1–10, 36). Determining the dynamic behavior of these systems requires specifying not only the network connectivity, but also the kinetic parameters for the various regulation reactions. Standard biochemical methods of measuring these kinetic parameters are usually done outside of the cellular context and cannot be easily scaled up to a genomic level. It would therefore be valuable to develop methods to assign effective kinetic parameters to transcriptional networks based on in vivo measurements. Here we present an approach for determining the effective kinetic parameters of a transcriptional network based on accurate promoter activity measurements and analysis algorithms (Fig. 1).
Fig 1.
Present approach for assigning effective kinetic parameters to E. coli transcription regulation networks. Transcriptional regulation networks are usually represented by arrow diagrams, where the arrows represent interactions between transcription factors and DNA regulatory sites. The present approach aims to assign kinetic parameters (numbers on the arrows) that capture the dynamics of the network within a quantitative mathematical model, as well as the transcription factor activity profile A(t).
We developed a system for real-time monitoring of the transcriptional activity of operons by means of low-copy reporter plasmids (10) in which a promoter controls green fluorescent protein (GFP) (11). In each plasmid a different promoter controls the transcription rate of the same reporter gene, gfp, and thus rate of transcript production from the promoter is proportional to the rate of GFP accumulation. By continuous measurements from living cells grown in a multiwell plate fluorimeter, high-resolution time courses of the promoter strength and cell density are obtained. With this method, temporal resolution of minutes can be achieved. This process complements, at higher accuracy, the genomic-scale perspective given by DNA microarrays (12). In a previous study, we demonstrated that this approach can be used to determine the order of genes in an assembly pathway (10). Here, we extend it by presenting analysis algorithms that use accurate expression data to assign kinetic parameters that can be incorporated into a mathematical model of the dynamics.
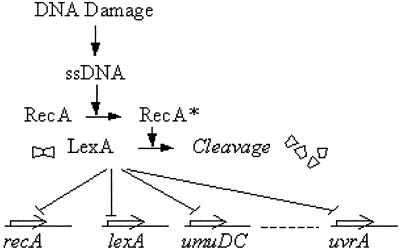
We apply this method to a well characterized transcriptional network, the SOS DNA repair system in Escherichia coli. The SOS system includes about 30 operons regulated at the transcriptional level (12–16). A master repressor (LexA) binds sites in the promoter regions of these operons (16, 17). One of the SOS proteins, RecA, acts as a sensor of DNA damage: by binding to single-stranded DNA it becomes activated and mediates LexA autocleavage. The drop in LexA levels causes the de-repression of the SOS genes (Fig. 2). Once damage has been repaired or bypassed, the level of activated RecA drops, LexA accumulates and represses the SOS operons, and the cells return to their original state.
Fig 2.
The bacterial SOS DNA repair system (35). DNA damage is sensed by RecA, which induces autocleavage of the repressor LexA. LexA binds to the promoters of the SOS operons, including its own promoter and that of RecA. This study attempts to assign effective parameters (βi and ki) to the arrows representing transcriptional regulation of the various operons. ssDNA, single-stranded DNA.
We demonstrate that effective kinetic parameters can be used to detect SOS genes with additional regulation, capture the temporal transcriptional program, and calculate the concentration profile of the regulatory protein.
Methods
Plasmids and Strains.
Promoter regions were amplified from MG1655 genomic DNA by using PCR and the following start and end coordinates for the primers taken from the sequenced E. coli genome (18): uvrA (4271368–4271753), uvrD (3995429–3995664), lexA (4254491–4254751), recA (2821707–2821893), ruvA (1943919–1944201), polB (65704–65932), umuD (1229552–1230069), uvrY (1993282–1993900), and lacZ (365438–365669). Each amplified region includes the entire region between ORFs with an additional 50–150 bp into each of the flanking ORFs. The promoter regions were cloned by using XhoI and BamHI sites upstream of a promoterless GFPmut3 gene in a low copy pSC101 origin plasmid as described (10). The plasmids were transformed into E. coli strain AB1157 [argE3, his4, leuB6, proA2, thr1, ara14, galK2, lacY1, mtl1, xyl5, thi1, tsx33, rpsL31, and supE44] (24).
Culture and Measurements.
Cultures of strain AB1157 (1 ml) inoculated from glycerol frozen stocks were grown for 16 h in LB medium with kanamycin (25 μg/ml) at 37°C with shaking at 250 rpm. The cultures were diluted 1:100 into defined medium (24) [M9 supplemented with thiamine (10 μg/ml), glucose (2 mg/ml), MgSO4 (1 mM), MgCl2 (0.1 mM), thymine (20 μg/ml), each of the 20 aa except tryptophan (50 μg/ml) + 25 μg/ml kanamycin], at a final volume of 100 μl per well in a flat-bottom 96-well plate (Sarstedt). The cultures were covered with an adhesive pad to prevent evaporation and grown in a Wallac Victor2 multiwell fluorimeter at 37°C, set with an automatically repeating protocol of shaking (2 mm orbital, normal speed, 30 sec, 3 min delay). When the cultures reached midexponential growth (OD600 = 0.03) they were irradiated with UV light at 254 nm with a low-pressure mercury germicidal lamp at levels of 5 or 20 Jm−2. After addition of 150 μl mineral oil (Sigma M-3516) per well (to prevent evaporation) the plate was returned to the fluorimeter with a second repeated protocol that included shaking (2 mm orbital, normal speed, 30 sec), absorbance (OD) measurements (600-nm filter, 1 sec), and fluorescence readings (filters 485 nm, 535 nm, 0.5 sec, CW lamp energy setting 10,000). Time between repeated measurements was 3 min. Background fluorescence of cells bearing a promoterless GFP vector was subtracted. Growth rate was similar to the promoterless GFP reporter strain.
The present results were obtained with kinetics measurements for two cell cycles after DNA irradiation. In experiments that tracked the promoter activity for longer times, we found an unexpected second peak of promoter activity (not shown), which occurs after about 2½ cell cycles. This peak includes only a subset of the SOS promoters and thus is probably not explained only by a second minimum in LexA levels. It does not appear in operons unrelated to the SOS system and is thus unlikely to result from global changes in transcription. The second peak may represent the influence of an additional, uncharacterized transcription factor.
The Influence of the UV Irradiation on Plasmid Copy Number.
Plasmids were extracted by using a miniprep kit (Qiagen, Chatsworth, CA) from an irradiated culture (2 h after a dose of UV = 50 Jm−2) and an unirradiated control culture. The plasmids were transformed into RP437 CaCl2 heat-shock competent bacteria. One hundred microliters from the transformation reaction was plated on LB + 25 μg/ml kanamycin. Both irradiated and control cultures produced the same number of colonies (within 5% error), suggesting that the plasmid copy number is not influenced by UV irradiation.
Parametrization Algorithm I: Trial Function.
The present study deals with a simple network architecture, where all operons are under negative control by a single repressor. This process is modeled by using a simple binding of the repressor to a regulatory DNA site in each operon, resulting in a Michaelis–Menten form (Eq. 2). In the case where the regulator is an activator, and not a repressor, the appropriate trial function would be:
 |
This case could be described by the present use of Eq. 2 by using the transformations:
 |
Parameterization Algorithm II: Data Preprocessing.
The raw GFP and OD signals were smoothed by using a hybrid Gaussian-median filter with a window size of five measurements (19). Promoter activity is given by Eq. 1, Xi(t) = [dGi(t)/dt]/ODi(t). The activity signal was then smoothed by a polynomial fit (sixth order) to log[Xi(t)]. This smoothing procedure captures the dynamics well, while removing the noise inherent in the differentiation of noisy signals. Finally, the data for all experiments were concatenated and normalized by the maximal activity for each operon.
Parametrization Algorithm III: Parameter Determination.
To determine the parameters in Eq. 2 based on experimental data, we first transformed it to a bilinear form by using 1/Xi(t) = ui(t) = ai ⋅ A(t) + bi, where ai = 1/βiki, bi = 1/βi. In this bilinear form, the matrix Xi(t), which has N × M elements, for N genes and M time points, was modeled by two vectors ai and bi of size N, and one vector A(t) of size M, for a total of 2*N + M variables. The standard method of least mean squares solution for such bilinear problems uses singular value decomposition (SVD) (20, 21). First the mean over i of ui(t) was removed ui(t) = ui(t) − <ui(t)>. A(t) is the SVD eigenvector with the largest eigenvalue of the matrix
 |
The results for A(t) were normalized to fit the constraints A(t = 0) = 1 and min A(t) = 0. Data where A(t) reaches 0 are obtained at high UV doses (>50 Jm−2). Alternatively for the purpose of normalizing A(t), points with A = 0 and Xi = β can be added to the data during analysis. A second round of optimization was then performed for βi and ki by using a nonlinear least mean squares solver (lsqnonlin, MATLAB 5.3, Mathworks, Natick, MA) to minimize (Xmeasured − Xpredicted)2.
Parametrization Algorithm IV: Error Evaluation.
The quality of the model in describing the data is given by the mean error for each promoter
 |
The error in the estimate for the parameters βi and ki was determined by using a standard graphic method (22). Briefly, the form 1/Xi(t) = 1/βi + A(t)/(βi ki) was plotted vs. A(t). From the maximal and minimal slopes of the resulting graphs, the error for 1/(βi ki) were determined. From the maximal and minimal intersections of the graph with the y axis, the errors in 1/βi were determined.
Parametrization Algorithm V: Additional Trial Function.
An extension of the model to the case of cooperative binding would be
 |
This function can capture different effective Hill coefficient Hi for each operon. This form also captures the possibility that a regulator is a repressor for some genes and an activator for others, where Hi > 0 corresponds to repression and Hi < 0 to activation. In principle, it should be evident from the data whether different operons are regulated with different signs by the same regulator, because they will tend to have anticorrelated profiles. The present good comparison between measured LexA levels and those calculated from an Hi = 1 trial function suggest that there may be no significant cooperativity in the repressor action (23).
Results
Promoter Activity Profiles for the SOS System.
We constructed GFP reporter strains for eight of the SOS operons. The GFP used in this study becomes fluorescent within minutes after transcription (10) and its degradation rate is negligible. The time-dependent experimental signal is smooth enough to be differentiated, yielding a direct measure of the promoter activity (rate of mRNA synthesis). The activity of promoter i, Xi, is proportional to the number of GFP molecules produced per unit time per cell,
 |
where Gi(t) is GFP fluorescence from the corresponding reporter strain culture and ODi(t) is the optical density.
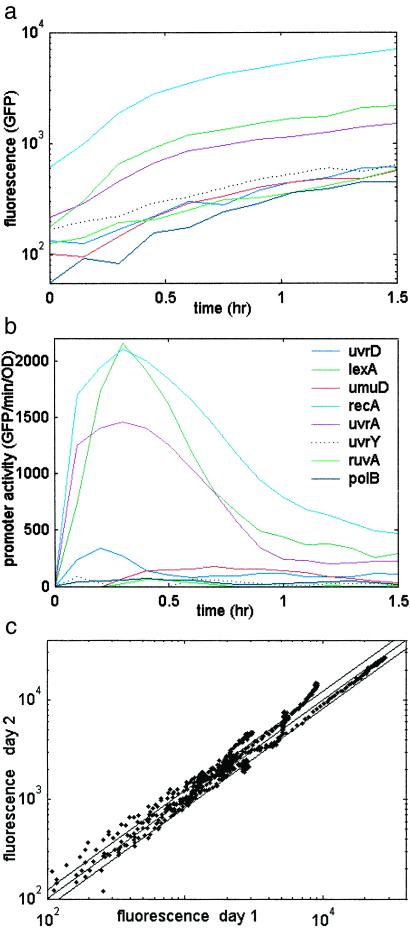
All of the SOS operons were activated by UV irradiation (Fig. 3 a and b). The time scale for UV induction of the promoters (rise time of ≈7 min) is in agreement with a six time-point DNA microarray experiment (12). After about half a cell cycle (≈20 min) the promoter activities begin to decrease. This decrease corresponds to the repair of damaged DNA and other adaptation mechanisms (24). The mean reproducibility error between repeat experiments performed on different days is about 10% (Fig. 3c).
Fig 3.
(a) Fluorescence of SOS reporter strains as a function of time after UV irradiation. (b) SOS Promoter activity, rate of GFP production per OD unit. E. coli strain AB1157 with SOS reporter plasmids was grown in 96-well plates at 37°C in a multiwell fluorimeter; a UV dose of 5 Jm−2 was given at midexponential growth (t = 0). (c) Unsmoothed GFP fluorescence (background subtracted) for repeat experiments performed on different days. Each point represents one time point, for a total of 99 time points per operon for eight operons. A perfect repeat would be on the x = y diagonal; also shown are parallel diagonal lines representing 10% errors. The mean error is 10.4%. UV = 5 Jm−2.
Assigning Effective Kinetic Parameters.
The SOS system has a “single input module” architecture (25) where a single transcription factor controls multiple output operons, all with the same regulation sign (repression or activation), and with no additional inputs from other transcription factors (Fig. 2). This is a basic recurring architecture in transcriptional networks (26) and characterizes more than 20 different gene systems in E. coli (25). We use an optimization algorithm to parameterize such gene systems, by assigning effective kinetic parameters based on time-course data. We use a simple Michaelis–Menten model for the kinetics:
 |
where Xij(t) is the activity of promoter i in experiment j, Aj(t) is the effective repressor concentration in experiment j, βi is the production rate of the unrepressed promoter, and ki is the effective affinity of the repressor (concentration at half maximal repression). Each ki parameter represents a combination of the binding affinities of the repressor to its operator site, and RNA polymerase to the promoter, the binding site positions, and possibly other factors. An algorithm described in Methods determines the values of βi, ki, and A(t) from the data at two UV doses. The error is under 25% for most promoters (Table 1). We note that other trial functions could be used in place of Eq. 2 (see Methods), and that the results are expected to be insensitive to the mathematical representation used.
Table 1.
The effective kinetic parameters for the SOS system (±SD)
| Gene | k | β | E | Function |
|---|---|---|---|---|
| uvrA | 0.09 ± 0.04 | 2,800 ± 300 | 0.14 | Nucleotide excision repair |
| lexA | 0.15 ± 0.08 | 2,200 ± 100 | 0.10 | Transcriptional repressor |
| recA | 0.16 ± 0.07 | 3,300 ± 200 | 0.12 | Mediates LexA autocleavage, blocks replication forks |
| umuD | 0.19 ± 0.1 | 330 ± 30 | 0.21 | Mutagenesis repair |
| polB | 0.35 ± 0.15 | 70 ± 10 | 0.31 | Trans-lesion DNA synthesis, replication fork recovery |
| ruvA | 0.37 ± 0.1 | 30 ± 2 | 0.22 | Double-strand break repair |
| uvrD | 0.65 ± 0.3 | 170 ± 20 | 0.20 | Nucleotide excision repair, recombinational repair |
| uvrY | 0.51 ± 0.25 | 300 ± 200 | 0.45 | SOS operon of unknown function, additional roles in two-component signaling |
| lacZ | — | — | 1.53 | Unrelated to SOS system |
E is the mean error for the promoter activity prediction (see Methods).
Detection of Promoters with Additional Regulation.
Promoters that do not belong to the system can be easily detected by using this approach because they are assigned a much larger error (e.g., 150% error for the lacZ promoter, Table 1). Interestingly, one of the SOS promoters, uvrY, is found to have a large error (≈45%). This operon has been recently found to participate in a two-component signaling system related to stationary-phase response (27, 28), and there is evidence that it is regulated by transcription factors other than LexA (29). The relatively large 30% error of polB may hint that it also has slight, as of yet uncharacterized, additional regulation. In summary, large errors in the present approach may help to detect genes that have additional regulation.
Determining Dynamics of an Entire System Based on a Single Representative.
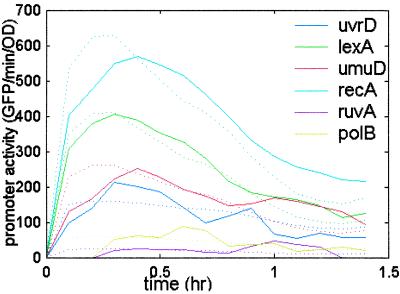
The parameterization procedure produces a quantitative kinetic model of the system dynamical behavior. Once β and k are determined for each operon, one need only measure the kinetics of a single promoter in a new experiment to estimate all other SOS promoter kinetics. The equation for transforming the kinetics of promoter n, Xn to that of promoter m, Xm is
 |
The estimated kinetics using data from only one of the operons (uvrA) agree quite well with the measured kinetics for all operons (Fig. 4). The same level of agreement is found by using any of the other operons as the representative. Eq. 3 depends on the ratios of the kinetic constants. We find that the ratios km/kn and βm/βn are the same in growth in rich (LB) and minimal (M9) media, at 30°C and 37°C, and in two different E. coli strains, MG1655 and AB1157 (not shown).
Fig 4.
Promoter activity (solid line) and promoter activity predicted from the kinetics of a single promoter (uvrA) by using the βi and ki values and Eq. 3 (dashed line) at UV = 5 Jm−2. The promoter activity of recA and lexA is multiplied by 0.25.
Repressor Protein Concentration Profile.
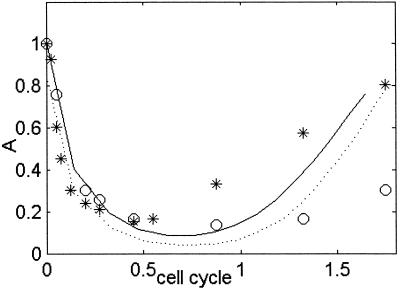
The present measurements are at the transcription level, where GFP is produced under the control of different promoters. We do not directly measure the concentrations of the proteins produced by these operons, only the rate at which the corresponding mRNAs are produced. However, the parameterization algorithm allows calculation of the relative concentration of the master transcriptional repressor (LexA) in its active form by using the transcription kinetics (Fig. 5). The calculated concentration, A(t), decreases after UV irradiation, reaches a minimum at about half a cell cycle, and then recovers. The predicted relative protein levels are reasonably similar to immunoblot measurements of LexA protein level in the same strain and conditions reported by Sassanfar and Roberts (24), in particular at early times.
Fig 5.
The effective relative repressor concentration A(t) at UV = 5 Jm−2 (solid line) and UV = 20 Jm−2 (dotted line). The cell cycle time is 45 min. Relative uncleaved LexA protein levels measured by using immunoblots by Sassanfar and Roberts (24), at UV = 5 Jm−2 (*) and UV = 20 Jm−2 (○) in the same strain and conditions.
Discussion
The present study demonstrated that effective kinetic parameters could be determined for a transcriptional regulation system of known structure. Furthermore, the active transcription factor protein level could be calculated. This approach is based on algorithms that determine the kinetic parameters within a mathematical model of the regulatory network by using accurate promoter-activity measurements.
Detailed Temporal Program of Expression in the SOS DNA Repair System.
The parameters ki, which qualitatively correspond to the threshold of activation of each operon, are the main parameters that control the kinetics of a single-input module system (25). In the case of a repressor whose concentration varies with time, the larger the ki value, the earlier the gene is turned on and the later it is turned off (25). In the SOS system, the initial decrease in LexA levels is very rapid, and thus the operons turn on at about the same time. We find that they turn off, however, at different times, with timing differences on the order of 10 min between operons. The first operons to turn off (smallest k values) are uvrA, part of the earliest repair process, nucleotide excision repair, and lexA and recA, the SOS regulatory genes. Next is umuDC, which encodes for mutagenesis repair enzymes that allows the replication forks to bypass the lesions and resume DNA replication (30, 31). The last genes to turn off are polB, which is involved in replication fork recovery after DNA damage (31), and ruvA and uvrD, which are involved in late-stage repair processes (uvrD also participates in early repair) (14). The order of inactivation thus correlates with the function of the gene products, with genes responsible for early repair processes turned off first, and those related to recovery and adaptation turned off last. Similar mechanisms may be at play in determining the detailed temporal order in flagella biosynthesis (10) and other systems (6, 32) and may be a recurring motif in transcriptional network dynamics.
Mechanism of SOS System Induction.
It is generally difficult to measure protein activity profiles in vivo. The present approach addresses this problem by enabling calculation of the active repressor profile from its transcriptional effects on downstream operons, which compares well with direct immunoblot measurements (Fig. 5). Both the calculated and measured profiles of LexA protein concentration have similar qualitative features. The initial rate of decrease is independent of UV dose (under the present conditions, the cleavage rate is dA/dt ≈3 cell cycle−1), suggesting that the initial cleavage rate of LexA is independent of UV damage. This finding is consistent with activation of RecA primarily at stalled replication forks (14). At the UV damage levels used in the present study, there are thousands of lesions in each chromosome, and the replication forks are stalled within seconds after UV irradiation (14). Because the number of replication forks and the number of RecA monomers activated at each fork are presumably independent of damage level, one expects that the initial rate of LexA cleavage will be UV damage independent.
The present parameterization algorithm could in principle apply to any gene system controlled by a single transcription factor or gene systems controlled by multiple transcription factors provided that the activities of all but one are held constant during the experiment. One limitation of the present algorithm is that it cannot capture systems with multiple varying transcriptional inputs. This approach needs to be generalized to include such cases, which requires a quantitative understanding of the cis-regulatory logic that combines multiple inputs at each operon (33). The present accurate kinetic measurements could be performed in principle at a genomic scale with arrays of reporter strains (34), which raises the possibility of producing kinetic models of cellwide regulatory networks.
Acknowledgments
We thank Z. Livneh for his insights and kind assistance. We thank T. Paz-Elizur, S. Covo, M. Elowitz, M. Surette, S. Leibler, E. Siggia, J. Stavans, and all of our lab members for discussions. This work was supported by the Israel Science Foundation, the Human Frontiers Science Project, and the Minerva Foundation.
Abbreviations
GFP, green fluorescent protein
This paper was submitted directly (Track II) to the PNAS office.
References
- 1.Hartwell L., Hopfield, J., Leibler, S. & Murray, A. (1999) Nature (London) 402,Suppl., C47-C52. [DOI] [PubMed] [Google Scholar]
- 2.Ideker T., Thorsson, V., Ranish, J., Christmas, R., Buhler, J., Eng, J., Bumgarner, R., Goodlett, D., Aebersold, R. & Hood, L. (2001) Science 292, 929-934. [DOI] [PubMed] [Google Scholar]
- 3.Tavazoie S., Hughes, J., Campbell, M., Cho, R. & Church, G. (1999) Nat. Genet. 22, 281-285. [DOI] [PubMed] [Google Scholar]
- 4.Lockhart D. & Winzeler, E. (2000) Nature (London) 405, 827-836. [DOI] [PubMed] [Google Scholar]
- 5.Simon I., Barnett, J., Hannett, N., Harbison, C., Rinaldi, N., Volkert, T., Wyrick, J., Zeitlinger, J., Gifford, D., Jaakkola, T. & Young, R. (2001) Cell 106, 697-708. [DOI] [PubMed] [Google Scholar]
- 6.Laub M. T., McAdams, H. H., Feldblyum, T., Fraser, C. M. & Shapiro, L. (2000) Science 290, 2144-2148. [DOI] [PubMed] [Google Scholar]
- 7.Arkin A., Shen, P. & Ross, J. (1997) Science 277, 1275-1279. [Google Scholar]
- 8.D'haeseleer P., Liang, S. & Somogyi, R. (2000) Bioinformatics 16, 707-726. [DOI] [PubMed] [Google Scholar]
- 9.Brown P. & Botstein, D. (1999) Nat. Genet. 21, 33-37. [DOI] [PubMed] [Google Scholar]
- 10.Kalir S., McClure, J., Pabbaraju, K., Southward, C., Ronen, M., Leibler, S., Surette, M. G. & Alon, U. (2001) Science 292, 2080-2083. [DOI] [PubMed] [Google Scholar]
- 11.Cormack B., Valdivia, R. & Falkow, S. (1996) Gene 173, 33-38. [DOI] [PubMed] [Google Scholar]
- 12.Courcelle J., Khodursky, A., Peter, B., Brown, P. O. & Hanawalt, P. (2001) Genetics 158, 41-64. [DOI] [PMC free article] [PubMed] [Google Scholar]
- 13.Radman M. (1975) Basic Life Sci. 5A, 355-367. [DOI] [PubMed] [Google Scholar]
- 14.Walker G. C. (1996) in Escherichia coli and Salmonella thyphimurium, ed. Neidhardt, F. C. (Am. Soc. Microbiol., Washington, DC), Vol. 1, pp. 1400–1416. [Google Scholar]
- 15.Fernandez de Henestrosa A. R., Ogi, T., Aoyagi, S., Chafin, D., Hayes, J. J., Ohmori, H. & Woodgate, R. (2000) Mol. Microbiol. 35, 1560-1572. [DOI] [PubMed] [Google Scholar]
- 16.Kenyon C. & Walker, G. (1980) Proc. Natl. Acad. Sci. USA 77, 2819-2823. [DOI] [PMC free article] [PubMed] [Google Scholar]
- 17.Little J. & Mount, D. (1982) Cell 29, 11-22. [DOI] [PubMed] [Google Scholar]
- 18.Blattner F. R., Plunkett, G., III, Bloch, C. A., Perna, N. T., Burland, V., Riley, M., Collado-Vides, J., Glasner, J. D., Rode, C. K., Mayhew, G. F., et al. (1997) Science 277, 1453-1474. [DOI] [PubMed] [Google Scholar]
- 19.Alon U., Camarena, L., Surette, M. G., Aguera y Arcas, B., Liu, Y., Leibler, S. & Stock, J. B. (1998) EMBO J. 17, 4238-4248. [DOI] [PMC free article] [PubMed] [Google Scholar]
- 20.Press W. H., Teukolsky, S. A., Vetterling, W. T. & Flannery, B. P., (1992) Numerical Recipes in C: The Art of Scientific Computing (Cambridge Univ. Press, Cambridge, U.K.).
- 21.Alter O., Brown, P. O. & Botstein, D. (2000) Proc. Natl. Acad. Sci. USA 97, 10101-10106. [DOI] [PMC free article] [PubMed] [Google Scholar]
- 22.Lichten W. (1989) Am. J. Phys. 57, 1112-1115. [Google Scholar]
- 23.Mohana-Borges R., Pacheco, A. B. F., Sousa, F. J. R., Foguel, D., Almeida, D. F. & Silva, J. L. (2000) J. Biol. Chem. 275, 4708-4712. [DOI] [PubMed] [Google Scholar]
- 24.Sassanfar M. & Roberts, J. W. (1990) J. Mol. Biol. 212, 79-96. [DOI] [PubMed] [Google Scholar]
- 25.Shen-Orr S. S., Milo, R., Mangan, S. & Alon, U. (2002) Nat. Genet. 31, 64-68. [DOI] [PubMed] [Google Scholar]
- 26.Neidhardt F. C. & Savageau, M. A. (1996) in Escherichia coli and Salmonella thyphimurium, ed. Neidhardt, F. C. (Am. Soc. Microbiol., Washington, DC), Vol. 1, pp. 1246–1262. [Google Scholar]
- 27.Pernestig A. K., Melefors, O. & Georgellis, D. (2001) J. Biol. Chem. 276, 225-231. [DOI] [PubMed] [Google Scholar]
- 28.Mukhopadhyay S., Audia, J. P., Roy, R. N. & Schellhorn, H. E. (2000) Mol. Microbiol. 37, 371-381. [DOI] [PubMed] [Google Scholar]
- 29.Wei Y., Lee, J., Smulski, D. & LaRossa, R. (2001) J. Bacteriol. 183, 2265-2272. [DOI] [PMC free article] [PubMed] [Google Scholar]
- 30.Livneh Z. (2001) J. Biol. Chem. 276, 25639-25642. [DOI] [PubMed] [Google Scholar]
- 31.Goodman M. (2000) Trends Biochem. Sci. 25, 189-195. [DOI] [PubMed] [Google Scholar]
- 32.Spellman P., Sherlock, G., Zhang, M., Iyer, V., Anders, K., Eisen, M., Brown, P., Botstein, D. & Futcher, B. (1998) Mol. Biol. Cell 9, 3273-3297. [DOI] [PMC free article] [PubMed] [Google Scholar]
- 33.Yuh C., Bolouri, H. & Davidson, E. (1998) Science 279, 1896-1902. [DOI] [PubMed] [Google Scholar]
- 34.Van Dyk T., DeRose, E. & Gonye, G. (2001) J. Bacteriol. 183, 5496-5505. [DOI] [PMC free article] [PubMed] [Google Scholar]
- 35.Sutton M. D., Smith, B. T., Godoy, V. G. & Walker, G. C. (2000) Annu. Rev. Genet. 34, 479-497. [DOI] [PubMed] [Google Scholar]
- 36.Savageau M. A. (2001) Chaos 11, 142-159. [DOI] [PubMed] [Google Scholar]


