Abstract
To compare variation in regulatory and coding DNA, promoter sequences have been obtained from wild-derived mice and laboratory rats. The sequences are from the proximal promoter of the H2Aa, H2Ab, H2Eb, and H2K genes of 24 wild-derived inbred strains and a sample of the corresponding exon 2 sequences and of the RT1.Ba gene of six strains of laboratory rat. They reveal a high level of variation in the mouse MHC class II promoters (H2A and H2E), a low level in MHC class I (H2K), and none in the rat. The variation is pronounced in and around the cAMP response element, a major binding site for modulating promoter activity in response to external stimulation. This finding, together with the different levels of variation in MHC classes I and II, is suggestive of natural selection. However, selection operating via the MHC coding sequences must also contribute, as indicated by the minimal variation in both the MHC class II promoter and coding sequences of the rat. Furthermore CIITA (trans-activator of class II) of the mouse has been reported to have minimal variation in its promoter and none in its coding sequence. Taken together these data suggest that the regulatory and coding sequences undergo coselection. Each of the mouse class II promoters has a pattern of variation that appears to be basically dimorphic, with further variation added by recombination/mutation. The dimorphic allelic lineages are in marginally detectable linkage disequilibrium with the exon 2 sequences, particularly in H2Aa, thus lending further support to the coevolution hypothesis.
Variation in regulatory DNA sequences is of central importance in understanding evolution (1), disease susceptibility (2, 3), and possibly also cancer progression (4, 5). Genes of MHC class II are of particular value for these purposes because (i) promoter variation is high, reflecting presumably the balancing selection that acts on the linked coding sequences (6–9), (ii) well-understood cis and trans regulation can usefully be compared (10), and (iii) MHC I and II regulatory sequences are subject to different selective pressures, making comparison between them informative. Furthermore the arrangement of the MHC II proximal promoter is well understood (11, 12). The S, X1(RFX binding site), and rCAAT (reversed CAAT site, previously Y) boxes are not highly sensitive to cell-external signals (13, 14). An important facet of the present study is that the X2 box, now securely identified as the cAMP response element (CRE) octamer (15), receives signals from G protein-coupled seven-pass receptors (16) that bind modulators of MHC II expression. Well-characterized examples of such modulators include thyroid-stimulating hormone (17) and prostaglandin E2 (18), although in the latter case signaling via CIITA is also involved. The octamer varies, particularly in its 3′ tetramer (19), and a major human disease-associated polymorphism occurs 10 bp upstream of CRE in the IL-6 promoter (20). Several cytokine receptors modulate MHC II expression via CIITA (11, 21). The CIITA promoter shows minimal variation (22) in marked contrast to the MHC II promoter, thus supporting the key role in promoter polymorphism played by diversity in the linked coding sequences.
To further explore MHC II promoter variation, sequences have been obtained from wild-derived mice and laboratory rats. It was expected in this way to maximize the chances of detecting variation. The Jackson Laboratory panel of inbred wild-derived mice was chosen for this purpose, as heterozygosity is minimal. The origin of the strains is documented on the Jackson web site, other genetic information is accumulating, and their DNA is readily available (www.jax.org/resources/documents/dnares/index.html).
Materials and Methods
DNA from 24 wild-derived inbred strains was obtained from The Jackson Laboratory, comprising 13 Mus musculus/domesticus, five Mus musculus molossinus, two Mus musculus castaneus, one Mus spretus, one Mus caroli, one Mus hortulanus, and one Mus pahari strains. Sequences were obtained directly from purified PCR products, using primers designed from GenBank accession no. AF050157. Mouse MHC class I sequences were obtained likewise, using primers designed from GenBank accession no. X54858. Rat MHC class II sequences were also obtained likewise, using primers designed from GenBank accession no. M31014. The primer sequences are deposited at Mouse Genome Informatics, The Jackson Laboratory (www.informatics.jax.org/). The products were sequenced from both ends on an ABI373 sequencer (Applied Biosystems) and checked for agreement, and their profiles were verified by visual inspection. The lack of variation found in the rat sequences and the low level found in MHC class I testify to the accuracy of this procedure. The sequences, too bulky to be given here in full, are also deposited at Mouse Genome Informatics. Sequences from eight other strains, published (23) and unpublished from the same group (GenBank accession nos. Y13072–Y13083) are also included in the analysis.
Results
Sequences of the proximal promoter of the H2Aa, H2Ab, and H2Eb genes were analyzed for variation, with the results shown in Fig. 1. H2Ea was not examined, because the laboratory strains previously analyzed showed variation only at a transcriptional enhancer located upstream of the promoter (24). As expected for this larger series, the frequency of variable sites (10%, 56/574) is higher than that previously observed (7). Fig. 1 also shows the location of the S, X1(RFX binding site), CRE (previously X2 box), and rCAAT (reversed CAAT site, previously Y box) transcription factor binding sites. It shows also what is termed here the “CRE zone,” the CRE octamer plus a length of 10 bp on either side, defined in relation to the IL-6 polymorphism mentioned above (20). As so defined, the CRE zone contains half (7/14) of the more polymorphic sites (marked with an asterisk or circle in Fig. 1) in the three promoters. All of these are located outside of the CRE octamer itself, except for one at −148 in the 3′ half of the H2Ab promoter, which is known to be functionally active, as discussed below.
Fig 1.
Variation in MHC class II promoters of inbred wild-derived mice, n = 23–24. Nucleotide position is counted backward from the start of transcription (A in ATG = 0). Polymorphisms are labeled thus: * denotes those found to be in linkage disequilibrium (see Fig. 2); ○ denotes one not in linkage disequilibrium with the others marked. The transcription factor binding sites S, X1, CRE, and rCAAT as labeled (Middle) and have similar locations in Top and Bottom. The CRE zone extends through 10 bases flanking CRE on either side, as explained in the text. The axis label % frequency of rare allele(s) indicates the total frequency of all bases other than that of the most common allele at the position shown. The axes are scaled similarly.
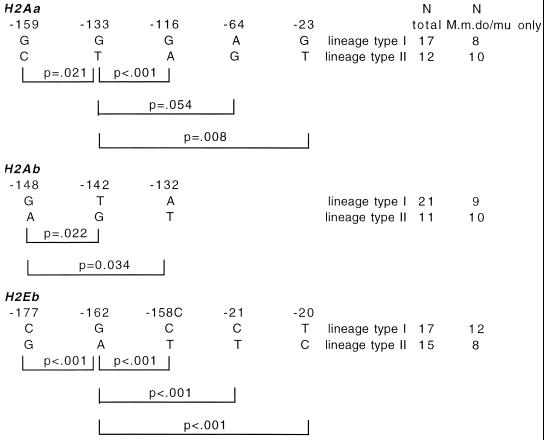
The pattern of this variation is further analyzed in Fig. 2, where the high-frequency polymorphisms are examined for linkage disequilibrium. Each locus has a run of linked polymorphisms that are labeled in Fig. 1 in accordance with the disequlibria identified in Fig. 2. On this basis each of the three loci has a pattern of variation that resolves into a dimorphism, i.e., two allelic lineages, differing at several variable sites. A set of linked substitutions like this that distinguish one allele from another are sometimes referred to as a haplotype, although the term is perhaps better reserved for a set of linked loci. As is evident in Fig. 1, the rare allele(s) frequency differs appreciably from one variable site to another, indicating that recombination has occurred between them. Fig. 2 gives two values for N, one for the entire series, and the other for just the M. m. musculus and M. m. domesticus sequences with the M. m. molossinus and other subspecis and species sequences excluded. The additional data in the GenBank accession nos. Y13072–Y13083 mentioned above fit into the same pattern of paired alleles. The non-M. m. musculus/domesticus sequences also fit, although the numbers are too small to reveal whether the two lineages are both represented in the related subspecies and species. No association was found between the distribution between strains of the two lineages at any one locus and at either of the two others, arguing against recent mixing of two populations as an explanation of the lineage pairs (Fig. 3). Diversity is generated by a broadly similar process in murine MHC II coding sequences, where mutational diversification has been followed by intra-exonic recombination (25).
Fig 2.
Dimorphic promoter lineages. Linkage disequilibria are shown between the various major polymorphic positions labeled in Fig. 1, with probabilities calculated by Fisher's exact test. The bases are arranged as in the two basic lineages (types I and II).
Fig 3.
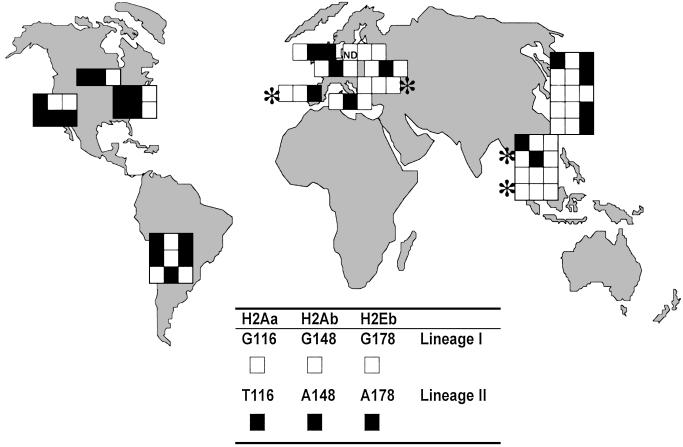
Geographical distribution of the sources of the wild-derived strains, showing their MHC class II promoter lineages. Each wild-derived strain has a line of three boxes corresponding to the three loci analyzed, with each boxes colored black or white to denote the lineage allele as shown. One box not done, marked ND. Four non-M. musculus strains are marked by *.
The Jackson Laboratory's documentation of the origin of the wild mouse strains enables the distribution of the lineage pairs to be examined in detail (Fig. 3). The placing shows that the dimorphism occurs worldwide in the ubiquitous domesticus/musculus group, and also in the molossinus and castaneus subspecies predominant among the oriental members of this collection. A bias is evident between the old and new world strains, with the minority lineages (type II) relatively over-represented in the new world. By the normal standards of population genetics the sample size is tiny, so that this bias (statistically significant as it is) cannot at present be taken as more than a hint that migration may have played a part in establishing the dimorphism.
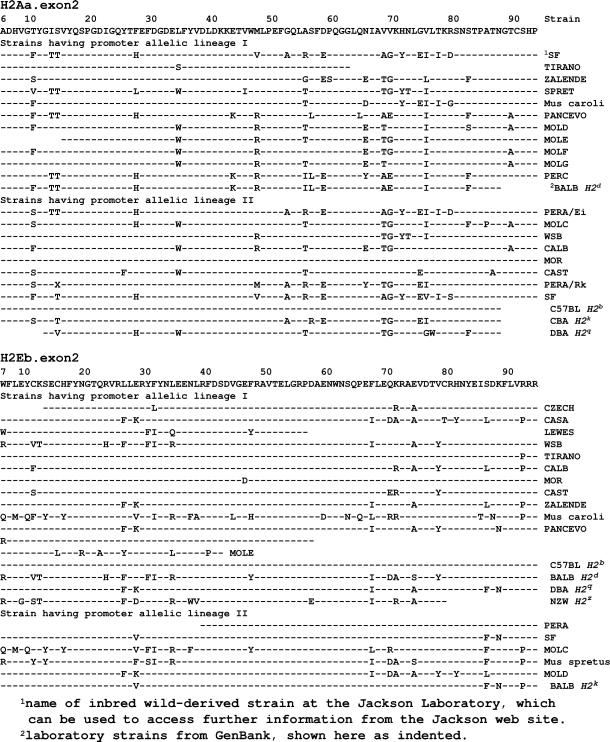
Association with particular coding sequences might maintain these promoter dimorphisms. Conceivably, an MHC molecule able to present parasitic worm epitopes might favor a promoter able to activate Th2 lymphocytes preferentially. To test this kind of possibility, samples of H2Aa and H2Eb genes were sequenced at exon 2, their most variable part that encodes the first or peptide-binding domain. The sequences were then grouped for each locus according to their promoter lineage, as shown in Fig. 4. At neither locus was any dramatic difference found between the coding sequences grouped in this way, although limited disequilibrium at individual amino acids was detected. At H2Aa, T14 (i.e., threonine at position 14 in the amino acid sequence shown in Fig. 4), R48, T66, and I76 occurred more often in association with the type I promoter (P values of 0.05–0.07, Fisher's exact test); whereas the R48 I76 combination seldom had this type of promoter (P = 0.018). At H2Eb the data are even weaker, in part because only six type II promoter sequences were present. The strongest association is between alanine75 and the type I promoter (9/15 A75, compared with 1/6 with the type II promoter, P = 0.08). Reassuringly, the data for the H2b, Hkb, H2d, H2q and H2z haplotypes were entered from the literature after these trends had become evident and proved confirmatory. Nevertheless the evidence of linkage disequilibrium should be regarded as provisional, as making testable predictions.
Fig 4.
Variation in exon 2 of MHC class II. Most of the data are for the wild-derived inbred mice, but additional data from GenBank are included (shown indented in the list of strain names).
However, collecting further data may not be easy, as the remaining laboratory strains with known H2Eb coding sequences (alleles f and u) are both A75+. Most wild mice are also A75+, although 4/9 M. musculus domesticus alleles are A75− in a large GenBank collection (26), as well as 1/3 in M. m. musculus and 1/3 in M. spretus alleles. No A75− alleles were found among the small numbers of M. m. molossinus, M. castaneus, Mus spicilegus, and Mus cervicolor alleles in the same collection.
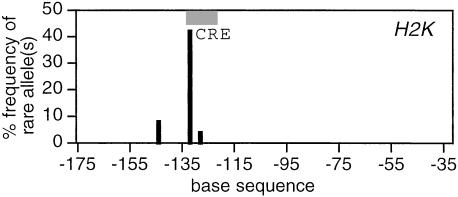
To compare these data with variation in MHC I, the H2K promoter of the wild-derived strains was also sequenced, with the results shown in Fig. 5. The CRE octamer is placed in accordance with the literature (15, 27, 28). Immediately 5′ to it there is striking polymorphism, although the overall level of polymorphism is much lower than for MHC II.
Fig 5.
Variation in an MHC class I promoter of inbred wild-derived mice (n = 24). Axes are scaled as in Fig. 1. The CRE octamer runs from −131 to −124, and the most frequent polymorphism is at −132.
Finally, the RT1-Ba promoter was sequenced from six inbred strains of laboratory rat (haplotypes a, c, k, l, n, and u), and no variation was found. The sequences differed at 16 substitutions from the sole previous sequence, of the Sprague–Dawley outbred rat strain dating from 1987 (GenBank accession no. M31014), even though the primers designed from that sequence worked well here. The coding sequences at exon 2 are less variable in laboratory rats (29) than in the present wild mice (Fig. 4), which may go some way to explaining the lack of variation.
Discussion
Because of the part played by MHC II genes in immunoregulation, their level of expression is likely to have a greater impact on the working of the immune system than is the case for MHC I. For instance, the strength of signal transmitted at the immunological synapse made between antigen-presenting cells and regulatory (CD4) T cells depends on the level of class II expression, which in turn can influence Th1/Th2 cell differentiation (30, 31). Thus the higher level of variation found in class II than class I promoters was as expected and lends support to the hypothesis of natural selection for expression level. So also does the preferential location of variation around CRE in the class II promoters. The location so near CRE of the minimal variation found in the class I promoter could be regarded as coincidental, although it supports the hypothesis and is certainly striking.
The evidence from the rat MHC class II promoters is less clear cut. Like the mouse class I promoters, their lack of diversity argues against the possibility that upstream noncoding sequences simply hitch hike on the diversity of coding sequences (8, 9). Yet it seems most unlikely that the mouse MHC II promoters could have attained their extraordinary level of diversity without the coding sequences playing a part. The status of the CIITA supports this view, because presumably its promoter could also vary and so regulate MHC II expression, but not being hooked up to variable coding sequences it cannot do so. Thus it seems likely that linkage disequilibrium with polymorphic coding sequences is necessary but not sufficient for high-level promoter diversification. Disequilibrium of this sort is not entirely hypothetical, for as shown here, mouse MHC II shows weak association between promoter variants and particular amino acid variants in exon 2, most clearly in the case of H2Ab. Mention has been made above of the kind of coselection that might operate, conceivably for particular types of parasite. Thus the present evidence argues for joint evolution of the regulatory and coding sequences, in which neither one can be regarded as the primary target of selection.
The MHC II family is second only to the olfactory receptors (32) in its display of gene birth (by duplication), diversification, and death (by loss of function, conversion to pseudogene) of genes (9, 33). Thus in humans duplicated HLA DR genes have acquired different expression levels, which are associated with disease progression (34, 35). How might gene dimorphism interact with this process? One possibility is that it could facilitate gene birth, by allowing diverification before duplication, although we know of no evidence that this can occur. Another is that it could facilitate gene death, by allowing a dimorphic variant to substitute for a neighboring gene that is loosing its function. This hypothesis predicts that new pseudogenes would be found linked to their substitutes on the same haplotype. The H2b haplotype may be a case in point. Its H2E molecule is no longer expressed, as commonly occurs in mice (36, 37). The promoter at its H2Ab locus gives its H2A molecule some of functions of the missing H2E, namely high expression (23, 38), and a consequent effect on Th1/Th2 balance that affects disease susceptibility (39, 40). The wild-derived inbred strains that have this type of promoter at H2Ab are CZECH, LEWES, MOR, PERC, SK, SF, TIRANO, WSB, ZALENDE, and M. caroli. These mice could be tested serologically for the predicted loss of H2E expression.
How are these dimorphisms maintained? Their ubiquitous distribution and their random assortment at the three MHC class II loci argue for long-term maintenance, presumably by balancing selection. At the same time the somewhat different distribution of the dimorphisms between the old and new world samples argues for an effect of migration. The fact is that the number of samples so far analyzed is too small to allow a firm conclusion and calls for extension to further wild-derived inbred strains (which are indeed available elsewhere).
The acid test of this functional view of promoter polymorphism would be based on reverse genetics, by gene knock-in. In the meanwhile, thyroid-stimulating hormone is known to regulate transcription of mouse MHC class II reporter constructs via the cAMP/CRE pathway in a rat thyroid cell line (17). This notion should provide an opportunity to test the consequences of polymorphism around CRE at the reporter level.
Acknowledgments
We thank the Department of Pediatrics in our medical school for access to their sequencing facility and Dr. David Curtis (Royal London Hospital) for statistical advice. This work was supported by the Leverhulme Trust. J.R. is a Wellcome Senior Research Fellow.
Abbreviations
CRE, cAMP response element
Data deposition: The primer sequences used in this paper have been deposited in the Mouse Genome Informatics database, www.informatics.jax.org (accession no. MGI: 2177765), and the GenBank database (accession nos. AJ492937–AJ493035).
References
- 1.Carroll S. B. (2000) Cell 101, 577-580. [DOI] [PubMed] [Google Scholar]
- 2.Staessen J. A., Ginocchio, G., Wang, J. G., Saavedra, A. P., Soubrier, F., Vlietinck, R. & Fagard, R. (1997) J. Cardiovasc. Risk 4, 401-422. [PubMed] [Google Scholar]
- 3.Mitchison N. A. (2001) Genome Biol. 2, 1-6. [DOI] [PMC free article] [PubMed] [Google Scholar]
- 4.Muschen M., Re, D., Brauninger, A., Wolf, J., Hansmann, M. L., Diehl, V., Kuppers, R. & Rajewsky, K. (2000) Cancer Res. 60, 5640-5643. [PubMed] [Google Scholar]
- 5.Lee T. J., Kim, S. J. & Park, J. H. (2000) Yonsei Med. J. 41, 593-599. [DOI] [PubMed] [Google Scholar]
- 6.Vincent R., Louis-Plence, P., Gaillard, F., Clot, J. & Eliaou, J. F. (1997) J. Rheumatol. 24, 225-226. [PubMed] [Google Scholar]
- 7.Cowell L. G., Kepler, T. B., Janitz, M., Lauster, R. & Mitchison, N. A. (1998) Genome Res. 8, 124-134. [DOI] [PubMed] [Google Scholar]
- 8.Beck S. & Trowsdale, J. (2000) Annu. Rev. Genomics Hum. Genet. 1, 117-137. [DOI] [PubMed] [Google Scholar]
- 9.O'HUigin C., Satta, Y., Hausmann, A., Dawkins, R. L. & Klein, J. (2000) Genetics 156, 867-877. [DOI] [PMC free article] [PubMed] [Google Scholar]
- 10.Mach B. (1999) Science 285, 1367. [DOI] [PubMed] [Google Scholar]
- 11.Mach B., Steimle, V., Martinez-Soria, E. & Reith, W. (1996) Annu. Rev. Immunol. 14, 301-331. [DOI] [PubMed] [Google Scholar]
- 12.Glimcher L. H. & Kara, C. J. (1992) Annu. Rev. Immunol. 10, 13-49. [DOI] [PubMed] [Google Scholar]
- 13.Williams G. S., Malin, M., Vremec, D., Chang, C. H., Boyd, R., Benoist, C. & Mathis, D. (1998) Int. Immunol. 10, 1957-1967. [DOI] [PubMed] [Google Scholar]
- 14.Mantovani R. (1999) Gene 239, 15-27. [DOI] [PubMed] [Google Scholar]
- 15.Moreno C. S., Beresford, G. W., Louis-Plence, P., Morris, A. C. & Boss, J. M. (1999) Immunity 10, 143-151. [DOI] [PubMed] [Google Scholar]
- 16.Mayr B. & Montminy, M. (2001) Nat. Rev. Mol. Cell. Biol. 2, 599-609. [DOI] [PubMed] [Google Scholar]
- 17.Montani V., Shong, M., Taniguchi, S. I., Suzuki, K., Giuliani, C., Napolitano, G., Saito, J., Saji, M., Fiorentino, B., Reimold, A. M., et al. (1998) Endocrinology 139, 290-302. [DOI] [PubMed] [Google Scholar]
- 18.Li G., Harton, J. A., Zhu, X. & Ting, J. P. (2001) Mol. Cell. Biol. 21, 4626-4635. [DOI] [PMC free article] [PubMed] [Google Scholar]
- 19.Nichols M., Weih, F., Schmid, W., DeVack, C., Kowenz-Leutz, E., Luckow, B., Boshart, M. & Schutz, G. (1992) EMBO J. 11, 3337-3346. [DOI] [PMC free article] [PubMed] [Google Scholar]
- 20.Humphries S. E., Luong, L. A., Ogg, M. S., Hawe, E. & Miller, G. J. (2001) Eur. Heart J. 22, 2243-2252. [DOI] [PubMed] [Google Scholar]
- 21.Suter T., Malipiero, U., Otten, L., Ludewig, B., Muelethaler-Mottet, A., Mach, B., Reith, W. & Fontana, A. (2000) Eur. J. Immunol. 30, 794-802. [DOI] [PubMed] [Google Scholar]
- 22.Janitz M., Reiners-Schramm, L., Lauster, R., Muhlethaler-Motter, A. & Rosowski, M. (2001) Exp. Clin. Immunogenet. 18, 199-205. [DOI] [PubMed] [Google Scholar]
- 23.Janitz M., Mitchison, A., Reiners-Schramm, L. & Lauster, R. (1997) Tissue Antigens 49, 99-106. [DOI] [PubMed] [Google Scholar]
- 24.Janitz M., Reiners-Schramm, L. & Lauster, R. (1998) Immunogenetics 48, 266-272. [DOI] [PubMed] [Google Scholar]
- 25.She J. X., Boehme, S. A., Wang, T. W., Bonhomme, F. & Wakeland, E. K. (1991) Proc. Natl. Acad. Sci. USA 88, 453-457. [DOI] [PMC free article] [PubMed] [Google Scholar]
- 26.Edwards S. V., Chesnut, K., Satta, Y. & Wakeland, E. K. (1997) Genetics 146, 655-668. [DOI] [PMC free article] [PubMed] [Google Scholar]
- 27.Dey A., Thornton, A. M., Lonergan, M., Weissman, S. M., Chamberlain, J. W. & Ozato, K. (1992) Mol. Cell. Biol. 12, 3590-3599. [DOI] [PMC free article] [PubMed] [Google Scholar]
- 28.Saji M., Shong, M., Napolitano, G., Palmer, L. A., Taniguchi, S. I., Ohmori, M., Ohta, M., Suzuki, K., Kirshner, S. L., Giuliani, C., et al. (1997) J. Biol. Chem. 272, 20096-20107. [DOI] [PubMed] [Google Scholar]
- 29.Holmdahl R., Karlsson, M., Gustafsson, K. & Hedrich, H. (1993) Immunogenetics 38, 381. [DOI] [PubMed] [Google Scholar]
- 30.Constant S. L., Dong, C., Yang, D. D., Wysk, M., Davis, R. J. & Flavell, R. A. (2000) J. Immunol. 165, 2671-2676. [DOI] [PubMed] [Google Scholar]
- 31.Mitchison N. A., Schuhbauer, D. & Muller, B. (1999) Springer Semin. Immunopathol. 21, 199-210. [DOI] [PubMed] [Google Scholar]
- 32.Crasto C., Singer, M. S. & Shepherd, G. M. (2001) Genome Biol. 2, 1027-1031. [DOI] [PMC free article] [PubMed] [Google Scholar]
- 33.Rhodes D. A. & Trowsdale, J. (1999) Rev. Immunogenet. 1, 21-31. [PubMed] [Google Scholar]
- 34.Vincent R., Louis, P., Gongora, C., Papa, I., Clot, J. & Eliaou, J. F. (1996) J. Immunol. 156, 603-610. [PubMed] [Google Scholar]
- 35.Czerwony G., Alten, R., Gromnica-Ihle, E., Hagemann, D., Reuter, U., Sorensen, H. & Muller, B. (1999) Hum. Immunol. 60, 1-9. [DOI] [PubMed] [Google Scholar]
- 36.Figueroa F., Gutknecht, J., Tichy, H. & Klein, J. (1990) Immunol. Rev. 113, 27-46. [DOI] [PubMed] [Google Scholar]
- 37.Tacchini-Cottier F., Mayer, W. E., Begovich, A. B. & Jones, P. P. (1995) Int. Immunol. 7, 1459-1471. [DOI] [PubMed] [Google Scholar]
- 38.Baumgart M., Moos, V., Schuhbauer, D. & Muller, B. (1998) Proc. Natl. Acad. Sci. USA 95, 6936-6940. [DOI] [PMC free article] [PubMed] [Google Scholar]
- 39.Oliveira D. B. & Mitchison, N. A. (1989) Clin. Exp. Immunol. 75, 167-177. [PMC free article] [PubMed] [Google Scholar]
- 40.Hesse M., Bayrak, S. & Mitchison, A. (1996) Eur. J. Immunol. 26, 3234-3237. [DOI] [PubMed] [Google Scholar]


