Abstract
Hereditary hemochromatosis (HH) is a common genetic disorder characterized by excess absorption of dietary iron and progressive iron deposition in several tissues, particularly liver. The vast majority of individuals with HH are homozygous for mutations in the HFE gene. Recently a second transferrin receptor (TFR2) was discovered, and a previously uncharacterized type of hemochromatosis (HH type 3) was identified in humans carrying mutations in the TFR2 gene. To characterize the role for TFR2 in iron homeostasis, we generated mice in which a premature stop codon (Y245X) was introduced by targeted mutagenesis in the murine Tfr2 coding sequence. This mutation is orthologous to the Y250X mutation identified in some patients with HH type 3. The homozygous Tfr2Y245Xmutant mice showed profound abnormalities in parameters of iron homeostasis. Even on a standard diet, hepatic iron concentration was several-fold higher in the homozygous Tfr2Y245Xmutant mice than in wild-type littermates by 4 weeks of age. The iron deposition in the mutant mice was predominantly hepatocellular and periportal. The mean splenic iron concentration in the homozygous Tfr2Y245Xmutant mice was significantly less than that observed in the wild-type mice. The homozygous Tfr2Y245Xmutant mice also demonstrated elevated transferrin saturations. There were no significant differences in parameters of erythrocyte production including hemoglobin levels, hematocrits, erythrocyte indices, and reticulocyte counts. Heterozygous Tfr2Y245Xmice did not differ in any measured parameter from wild-type mice. This study confirms the important role for TFR2 in iron homeostasis and provides a tool for investigating the excess iron absorption and abnormal iron distribution in iron-overload disorders.
Keywords: iron, liver, gene targeting
Transferrin receptor (TFR)2 is a recently identified type II membrane protein with significant homology to the classical transferrin receptor (TFR1). Both TFR1 and TFR2 are capable of transporting transferrin-bound iron into the cell (1) and supporting cell growth (2). However, their properties differ in several critical ways. TFR2 has a lower affinity for holotransferrin than does TFR1 (1, 3). The expression pattern of TFR2 mRNA is quite distinct from TFR1 as well (4, 5). In particular, the TFR2 gene is expressed at much higher levels in liver compared with other tissues, whereas the TFR1 gene demonstrates little hepatic expression. TFR1 and TFR2 differ also in their response to changes in cellular iron status. The TFR1 transcript contains multiple iron-responsive elements in the 3′-untranslated region. These elements stabilize the TFR1 transcript under conditions of low cellular iron. The TFR2 transcript does not contain these elements, and TFR2 message and TFR2 protein levels vary little with changes in iron status (4, 5). The observation that hepatic expression of Tfr2 persists despite iron overload in a murine Hfe gene knockout model of hereditary hemochromatosis (HH) led us to suggest that Tfr2-mediated iron uptake contributes to the hepatocellular iron loading observed in HH (4). Surprisingly, however, it was discovered that individuals homozygous for a truncation mutation in TFR2 (Y250X) had a clinical picture similar to HFE-associated HH, including hepatic iron loading (6). This form of iron overload was designated HH type 3 (Online Mendelian Inheritance in Man 604250) to distinguish it from HFE-associated HH (HH type 1) and juvenile-onset HH (HH type 2). Several additional TFR2 gene mutations have been described since in patients with iron overload, suggesting that the iron homeostasis abnormalities are caused by functional loss of TFR2 (7, 8). By contrast, functional loss of Tfr1 (in knockout mice) produces an embryonic lethal phenotype (9). These observations indicate that the roles for TFR1 and TFR2 in iron homeostasis are not redundant. Because TFR1 forms a complex with HFE, it seemed plausible that TFR2 may associate also with HFE. However, in vitro experiments using expressed soluble TFR2 and HFE failed to demonstrate significant interaction (3). The mechanism by which TFR2 participates in iron homeostasis thus remains unknown. To study the role of TFR2 in iron homeostasis, we generated a murine model for the human C250Y TFR2 mutation. Codon 245 is the murine orthologue to codon 250 in human TFR2 and is located in a region that is conserved between mouse and human genomes. We observed that by 4 weeks of age, mice homozygous for the Y245X mutation developed periportal hepatic iron loading, splenic iron sparing, and elevated serum transferrin saturations. Thus the Tfr2Y245X mutant mouse seems to provide a faithful model for the abnormalities in iron homeostasis observed in patients with loss of TFR2.
Materials and Methods
Gene Targeting in Embryonic Stem (ES) Cells and Generation of Mutant Mice.
We used a mouse cDNA probe to isolate clones from a 129/SvJ mouse Lambda Fix II genomic library (Stratagene). Restriction mapping and nucleotide sequencing were performed on selected clones. Site-directed mutagenesis (QuikChange, Stratagene) was performed on an ≈2.9-kb SalI-to-XbaI murine Tfr2 genomic fragment extending from intron 3 to intron 6 to substitute G for C at the third position of codon 245. The mutation changes the tyrosine codon to a stop codon (Y245X). The mutated genomic DNA fragment was inserted into the targeting vector pPNT-Cass lox A. This vector is a modification of the vector pCass lox A, provided by M. Capecchi (University of Utah, Salt Lake City) by the addition of sequences expressing thymidine kinase. The vector contains a cassette flanked by loxP elements including sequences conferring neomycin resistance and expressing cre recombinase under direction of a testes-specific angiotensin-converting enzyme promoter (10). After expression of cre recombinase in the germ line of the male chimeric transgenic mice, the cassette is excised from the genome. The mutated ≈2.9-kb SalI-to-XbaI genomic fragment was ligated at one end of the cassette, and an ≈3.6-kb XbaI genomic fragment extending from intron 6 to intron 8 of the mouse Tfr2 gene was ligated at the opposite end. The targeting vector (25 μg) was linearized and introduced into the 129/Sv-derived ES cell line RW4 (Genome Systems, St. Louis; 1 × 10⁷ cells) by electroporation (230 V and 500 μF) in a Bio-Rad gene pulser. After 24 hr, the cells were placed under selection with 400 μg/ml G418 (GIBCO/BRL) and 2 μM ganciclovir (Syntex, Palo Alto, CA) for 6 days. Southern blot analysis was performed on genomic DNA from resistant clones. The DNA was digested with BglII and hybridized with an external probe (an ≈1.2-kb XbaI-to-EcoRI genomic fragment extending from intron 1a to intron 3). Two clones demonstrating homologous recombination with the targeting vector were identified. One of these clones was used for injection into the blastocysts of C57BL/6J mice and transferred into pseudopregnant female mice as described (11). Chimeric male offspring were bred to C57BL/6J females. The agouti F1 offspring were tested for transmission of the disrupted allele (as well as removal of the selection cassette), by Southern blot analysis of HindIII-digested genomic DNA, and an external probe (an ≈2.3-kb HindIII-to-XbaI genomic fragment extending from intron 3 to intron 6). In accordance with Mouse Nomenclature Rules and Guidelines from The Jackson Laboratories (www.informatics.jax.org/mgihome/nomen/table.shtml), the mouse line housing the Tfr2Y245X mutation was designated Tfr2tm1Slu. Heterozygous matings of the F1 mice were carried out to produce homozygous F2 mutant mice. The F2 litters were weaned at 3 weeks and fed a standard diet (LM-485 Teklad sterilized mouse diet 7012, Harlan Teklad, Madison, WI), which contains 0.02% (wt/wt) iron. Food was removed 14 hr before blood collections and isolation of tissues for measurement of iron content and histological examination.
Genotyping for Y250X Mutation.
Offspring were genotyped by PCR analysis of genomic tail DNA. The PCR consisted of 35 cycles of 95°C for 1 min, 65°C for 1 min, and 72°C for 90 sec, using as a forward primer 5′-GTGACAAGGGGGCATATTATGCATGGGATT-3′ and as a reverse primer 3′-TGTTGTGTAGCCCAAGCAGGTCCTGTACAA-5′. A 922-bp product is obtained from the mutant Tfr2 allele and an 814-bp product from the wild-type allele. Validity of the PCR analysis was confirmed by Southern blot analysis of genomic tail DNA as described above.
Northern Blot Analysis.
Total cellular RNA was isolated from tissues of wild-type and Tfr2Y245X heterozygous and homozygous mice by using a guanidinium/phenol solution (RNA-Stat60, Tel-Test, Friendswood, TX). Twenty micrograms of RNA from each source were denatured in formaldehyde-containing buffer and electrophoresed in 1% agarose/2.2 M formaldehyde gels. Transcript sizes were estimated by using RNA standards (Promega). The RNA was transferred to Nytran membranes (Schleicher & Schuell), immobilized by UV crosslinking, and prehybridized at 65°C in 50% formamide/5× SSPE (standard saline phosphate/EDTA)/5× Denhardt's solution/50 mM sodium phosphate (pH 6.5)/200 μg/ml salmon sperm DNA/1 mM EDTA/0.1% SDS. Blots were hybridized overnight at 65°C with 32P-labeled riboprobe for Tfr2 (4), washed in 2× SSPE at room temperature for 20 min, 0.2× SSPE at room temperature for 20 min, twice in 0.2× SSPE/0.1% SDS at 65°C for 20 min, and autoradiographed. Blots were rehybridized with a probe for β-actin as described (4).
Western Blot Analysis.
Rabbit antisera were generated (Research Genetics, Huntsville, AL) against the keyhole limpet hemocyanin-conjugated peptide FCPMELKGPEHLGSCP representing amino acids 49–64 of the deduced murine Tfr2 protein sequence. TRVb cells were stably transfected with a full-length mouse Tfr2 cDNA in the vector pCXN2 under direction of the β-actin promoter and cytomegalovirus enhancer and selected by using G418. Liver-tissue membrane preparations were performed by homogenization of the tissue in PBS with protease inhibitors (156 μg/ml benzamidine, 1 μg/ml aprotinin, and 50 μg/ml PMSF) followed by centrifugation at 100,000 × g for 30 min. The pellets were sonicated in PBS with protease inhibitors, and protein concentrations were determined by using a modified Bradford reagent (Bio-Rad). SDS/PAGE was performed under reducing conditions on whole-cell homogenates (20 μg) or liver-membrane preparations (50 μg), and the proteins were transferred onto poly(vinylidene difluoride) by using an electroblotting apparatus. The poly(vinylidene difluoride) membranes then were reacted with a 1:2,000 dilution of rabbit anti-mouse Tfr2 antiserum followed by a 1:5,000 dilution of peroxidase-conjugated anti-rabbit IgG (Sigma). Immunoreactive proteins were detected by using luminol followed by autoradiography.
Transferrin Saturations.
Mice were bled by cardiac puncture. Serum iron and total iron-binding capacity were measured by using the protocol of Fielding (12). Transferrin saturation was calculated as (serum iron/total iron-binding capacity) × 100%. Values from wild-type (n = 10), homozygous mutant (n = 9), and heterozygous (n = 5) mice were compared by using the Kruskal–Wallis test followed by Dunn's multiple-comparison tests.
Tissue Iron Concentrations.
Tissues were analyzed for nonheme iron as described by Torrance and Bothwell (13). Tissue samples were weighed dry and digested in acid-digestion mixture (3 M hydrochloric acid/10% trichloroacetic acid) at 65°C for 20 hr, and 400 μl of each acid extract were mixed with 1.6 ml of bathophenanthroline chromogen reagent. The absorbance at 535 nm was measured in a DU-65 spectrophotometer (Beckman Coulter). Liver and spleen iron concentrations were compared across wild-type (n = 17), heterozygous (n = 14), and homozygous (n = 20) mutant mice by using the Kruskal–Wallis test followed by Dunn's multiple-comparison tests.
Histology.
Tissues fixed in 10% neutral buffered formalin for 18 hr were subjected to routine histologic processing, and the sections were stained by the Perls' Prussian blue method for the detection of iron storage. Bone marrow was aspirated from femurs of four wild-type and four homozygous Tfr2Y245X mutant mice, applied to glass slides by cytocentrifugation, fixed, and stained with either Wright Giesma or Perls' Prussian blue.
Hematological Measurements.
Blood was obtained by cardiac puncture, and hemoglobin, hematocrit, and mean corpuscular volume were determined by using a System 9110 plus hematology analyzer. Values were compared across wild-type, heterozygous, and homozygous mutant mice by using the Kruskal–Wallis test followed by Dunn's multiple-comparison tests.
Results
Generation of Tfr2Y245X Mutant Mice.
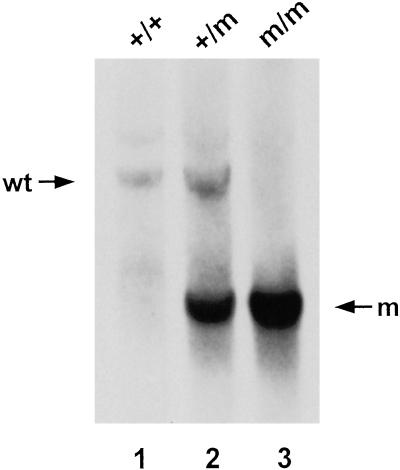
To generate the Y245X mutation in mouse ES cells, we designed a replacement-type targeting vector containing a cassette flanked by loxP elements. The cassette includes sequences expressing neomycin resistance as well as sequences that direct expression of cre in the male germ line only. The construct was linearized and introduced into RW4 ES cells by electroporation. After selection with G418 and ganciclovir, doubly resistant clones were screened for homologous recombination by Southern blotting and hybridization with an external probe (not shown). Targeted ES cells containing a mutated Tfr2 allele were injected into C57BL/6 blastocysts, and chimeric males were derived, all of which showed germ-line transmission of the mutated allele. After passing through the male germ line, the mutated allele differed from the wild-type allele by the single C-to-G nucleotide substitution in exon 6 and a single loxP element along with 110 bp of vector polylinker sequence in intron 6 (see Fig. 1). Removal of the neor and cre cassette was demonstrated by Southern blot analysis (Fig. 2) and confirmed by direct sequencing of PCR-amplified DNA. Heterozygous F1 offspring were intercrossed to generate F2 homozygous mice of 129/Sv × C57BL/6 hybrid strain background. All mice heterozygous or homozygous for the Tfr2Y245X allele appeared healthy, grew, and were fertile. Combined data from crosses between F1 heterozygous progeny (n = 205) demonstrated that 22% were homozygous for the mutant allele.
Fig 1.
Tfr2Y245X allele. The genomic region surrounding exon 6 of the Tfr2Y245X allele is represented. The position of the single C-to-G nucleotide substitution is demonstrated. The hatched region of intron 6 downstream of the XbaI site represents the retained polylinker sequence and loxP element from the transgene construct. The retained sequence includes two HindIII sites that allow distinguishing the wild-type and mutant alleles by Southern blot using the designated HindIII-to-XbaI genomic fragment as a probe. The mutant allele can be identified also by PCR using oligos at the designated positions, which gives a longer product from the mutant than from the wild-type allele.
Fig 2.
Southern blot analysis of genomic DNA from wild-type (wt) and Tfr2Y245X mutant mice. A representative Southern blot of HindIII-digested genomic DNA isolated from tail samples from a wild-type (+/+), a Tfr2Y245X heterozygous (+/m), and a homozygous (m/m) mouse and probed with the 32P-labeled HindIII-to-XbaI genomic DNA fragment designated in Fig. 1. A 4.3-kb restriction fragment is evident from the wild-type allele and a 2.3-kb fragment from the mutant allele.
The Tfr2Y245X Allele Produces a Normal-Sized mRNA Transcript.
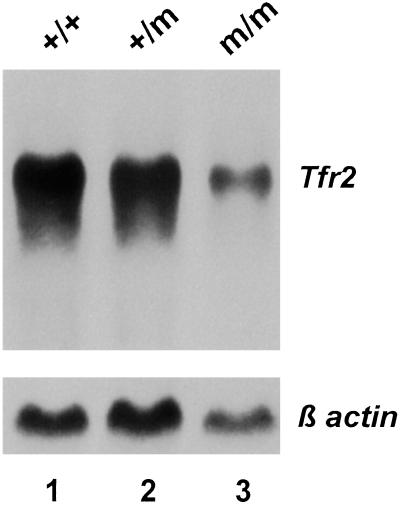
To determine whether the mutant mice express a stable Tfr2Y245X transcript, we performed Northern blot analyses on total RNA isolated from liver of Tfr2Y245X wild-type, heterozygous, and homozygous mutant mice (Fig. 3). A Tfr2 transcript of ≈2.9 kb was present in mice with all three genotypes; however, the transcript abundance was decreased in the homozygous mutant mice, presumably because of nonsense-mediated decay. Direct sequencing of cDNA amplified from liver tissue of a Tfr2Y245X homozygous mutant mouse confirmed the presence of the introduced C-to-G nucleotide substitution.
Fig 3.
Northern blot analysis of Tfr2 mRNA expression in liver of wild-type and Tfr2Y245X mutant mice. Fifteen micrograms of total cellular RNA from liver tissue of a wild-type (+/+), a heterozygous Tfr2Y245X mutant (+/m), and a homozygous mutant (m/m) mouse were hybridized with a probe for mouse Tfr2. The blot was rehybridized with a probe for β-actin (Lower).
Wild-Type but Not Tfr2Y245X Is Expressed on Hepatic Membranes.
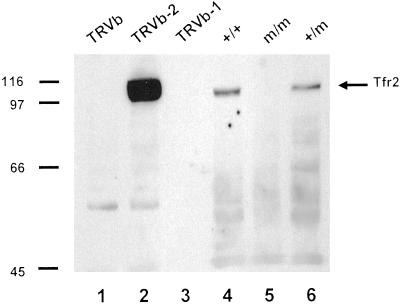
The Tfr2Y245X allele is predicted to express a truncated protein containing the putative transmembrane domain but missing most amino acids of the extracellular domain of Tfr2. To determine whether Tfr2Y245X is expressed at the cell membrane, we performed Western blot analyses by using hepatic membrane preparations from wild-type, Tfr2Y245X heterozygous, and Tfr2Y245X homozygous mice (Fig. 4, lanes 4–6). As controls for antibody specificity, we used homogenates from Chinese hamster ovary cells expressing no Tfr (TRVb), TFR1 only (TRVb-1), or Tfr2 only (TRVb-2) (Fig. 4, lanes 1–3). The membrane preparation from the wild-type and heterozygous but not the homozygous Tfr2Y245X mice demonstrated an ≈110-kDa protein comigrating with Tfr2 expressed in cultured cells. No evidence of a truncated Tfr2 protein was seen in hepatic membrane preparations or hepatic whole-cell homogenates (not shown) from the Tfr2Y245X mutant mice.
Fig 4.
Western blot analysis of Tfr2 protein in hepatic membranes of wild-type and Tfr2Y245X mutant mice. Whole-cell homogenates from the designated cell lines (lanes 1–3) or hepatic membrane preparations from the designated mice (lanes 4–6) were subjected to SDS/PAGE under reducing conditions, blotted, and reacted with an antibody to the intracellular domain of Tfr2.
Homozygosity for the Tfr2Y245X Mutation Produces Elevated Transferrin Saturations and Hepatic Iron Storage.
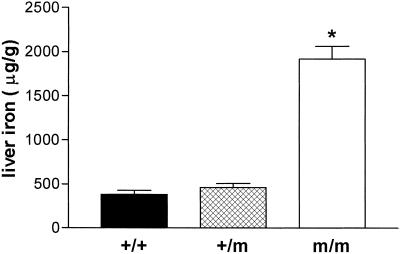
To determine the effect of the Tfr2Y245X allele on iron homeostasis, we analyzed F2 generation wild-type, heterozygous mutant, and homozygous Tfr2Y245X mice at 4 weeks of age. The mice were all products of heterozygous dams and were maintained on a standard diet [0.02% (wt/wt) iron] from weaning at 2–3 weeks of age. Transferrin saturations were increased markedly in the homozygous Tfr2Y245X mice (mean ± SEM, 88.9 ± 5.3 μg/g) compared with wild-type mice (56.2 ± 5.3 μg/g, P < 0.001) and heterozygotes (57 ± 7.8 μg/g, P < 0.001). Liver iron concentrations also were increased markedly in these mice, as demonstrated in Fig. 5 (mean ± SEM: wild-type, 382 ± 43 μg/g; heterozygous, 460 ± 46 μg/g; homozygous, 1916 ± 145 μg/g; P ≤ 0.001 homozygous vs. each other group). No differences were seen in kidney iron concentrations across the three groups (mean ± SEM: wild-type, 185 ± 13 μg/g; heterozygous, 224 ± 12 μg/g; homozygous, 190 ± 8 μg/g).
Fig 5.
Hepatic iron concentrations in wild-type and Tfr2Y245X mutant mice. Nonheme iron concentrations (μg/gram, dry weight) from 4-week-old wild-type (+/+), heterozygous Tfr2Y245X (+/m), and homozygous Tfr2Y245X (m/m) littermates are presented as mean ± SEM. *, P < 0.001 vs. each other group.
Histopathology of Tfr2Y245X Mice Resembles That of HH.
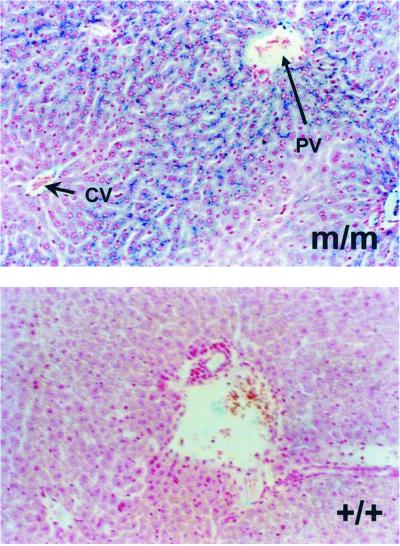
To determine the cellular sites of iron deposition in the Tfr2Y245X mice, tissue sections were stained with Perls' Prussian blue. Sections of liver, spleen, lung, heart, kidney, and small intestine were examined. Increased iron deposition was seen only in liver of the homozygous Tfr2Y245X mice. The iron deposition in liver tissue from these mice was hepatocellular and showed a marked gradient from periportal to pericentral hepatocytes (Fig. 6).
Fig 6.
Perls' staining of liver sections. Representative sections from a homozygous Tfr2Y245X (m/m) and wild-type (+/+) mouse stained for iron with the Perls' Prussian blue technique are shown. Staining is hepatocellular and predominantly periportal in the homozygous Tfr2Y245X mouse. CV, central vein (short arrow); PV, portal vein (long arrow).
Homozygosity for the Tfr2Y245X Mutation Produces Splenic Iron Sparing.
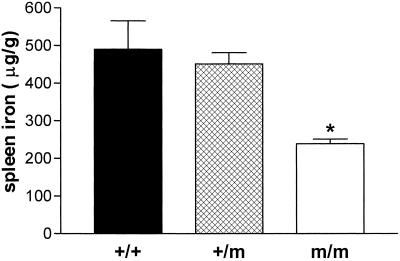
Perls' staining of splenic tissues demonstrated little iron in splenic reticuloendothelial macrophages from homozygous Tfr2Y245X mice (not shown). For this reason and because Hfe knockout mice demonstrate splenic iron sparing (14, 15), we compared splenic iron concentrations in the wild-type and Tfr2Y245X mutant mice. Fig. 7 demonstrates that homozygous Tfr2Y245X mice have decreased splenic iron concentrations compared with wild-type and heterozygous mice (mean ± SEM: wild-type, 490 ± 75 μg/g; heterozygous, 451 ± 30 μg/g; homozygous, 239 ± 13 μg/g; P ≤ 0.001 homozygous vs. each other group).
Fig 7.
Splenic iron concentrations in wild-type and Tfr2Y245X mutant mice. Nonheme iron concentrations (μg/gram, dry weight) from 4-week-old wild-type (+/+), heterozygous Tfr2Y245X (+/m), and homozygous Tfr2Y245X (m/m) littermates are presented as mean ± SEM. *, P < 0.001 vs. each other group.
Homozygosity for the Tfr2Y245X Mutation Does Not Alter Erythroid Parameters.
To determine whether the increased hepatic iron storage in the Tfr2Y245X mice resulted from hemolytic anemia or from ineffective erythropoiesis, we measured erythroid parameters on the 4-week-old wild-type, heterozygous, and homozygous Tfr2Y245X mice. Data from hemoglobin concentrations, hematocrits, mean corpuscular volumes, and reticulocyte counts are summarized in Table 1. No differences were observed in any of these parameters. Examination of marrow cells for iron by using Perls' Prussian blue showed similar staining in homozygous Tfr2Y245X and wild-type mice (not shown). Furthermore, no appreciable differences were observed in the morphology or differential cell counts of marrow cells from the homozygous mutant vs. wild-type mice.
Table 1.
Hematologic parameters in mutant, heterozygous, and control mice
| Mice | Hemoglobin, g/dl | Hematocrit, % | MCV, fl | Retic. count, % |
|---|---|---|---|---|
| +/+ | 14.83 ± 0.15 | 54.01 ± 0.98 | 56.22 ± 0.44 | 3.8 ± 0.26 |
| +/m | 14.92 ± 0.30 | 53.75 ± 0.94 | 56.10 ± 0.88 | 5.1 ± 0.60 |
| m/m | 14.45 ± 0.29 | 50.91 ± 1.03 | 55.62 ± 0.99 | 4.2 ± 0.32 |
Mean values ± SEM. For hemoglobins, hematocrits, and mean corpuscular volumes (MCV), n = 10 (+/+), 4 (+/m), and 13 (m/m). For reticulocyte counts, n = 6 (+/+), 4 (+/m), and 4 (m/m).
Discussion
The periportal distribution of the hepatic iron loading strongly suggests that intestinal absorption of dietary iron is excessive in the homozygous Tfr2Y245X mice. The iron homeostasis abnormalities observed in the homozygous Tfr2Y245X mice, i.e., increased transferrin saturations, periportal hepatocellular iron loading, and reticuloendothelial iron sparing, are observed also in mice with targeted mutations that abrogate expression of three other genes: Hfe (14–16), β2-microglobulin (β2m; refs. 17 and 18), and hepcidin (19). By contrast, ferroportin-associated HH (11, 20) and aceruloplasminemia (12, 21) are characterized by early accumulation of iron storage in reticuloendothelial macrophages as well as hepatocytes. These observations suggest that TFR2, HFE, β2m, and hepcidin share a pathway that regulates intestinal iron uptake and tissue iron distribution. Two major functionally defined “regulators” of these processes have been described. One is the erythropoietic regulator, which matches iron absorption to the demands of hemoglobin production, independent of body iron stores (22). The other is the stores regulator, which decreases dietary iron absorption in response to increased iron stores (23). The normal erythroid parameters observed in mice lacking HFE, β2m, hepcidin, or TfR2 implicates their participation in the stores rather than erythropoietic regulatory pathway.
One of the means by which body iron stores seem to influence dietary iron absorption involves the sensing of plasma iron by the duodenal crypt cells. Studies suggest that the level of plasma iron sensed by the crypt cells influences the relative expression of proteins involved in absorption of dietary iron by daughter enterocytes. The observation that TFR1 is highly expressed in duodenal crypt cells in association with HFE/β2m might suggest that TFR1 serves as the plasma iron sensor. However, the much higher affinity of TFR1 for holotransferrin and its sensitivity to down-regulation by cellular iron may make it less suitable than TFR2 for this role. Because TFR2 has a lower affinity for holotransferrin and is not down-regulated by cellular iron, TFR2 might be capable of mediating cellular iron uptake in direct proportion to saturation of plasma transferrin. Given the significant homology between TFR1 and TFR2, one might expect that TFR2 would be capable also of forming a complex with HFE/β2m. However, in vitro experiments have failed to demonstrate significant interaction between soluble forms of TFR2 and HFE (3). It remains to be determined whether interaction between TFR2 and HFE/β2m can be identified in vivo.
The proposed role for TFR2 as a sensor of plasma iron may be important in hepatocytes in addition to (or instead of) duodenal crypt cells. Recent evidence suggests that the liver may act to influence iron homeostasis by the regulated expression of the circulating peptide hepcidin (24). Liver hepcidin expression is increased in response to dietary iron loading or endotoxin-induced inflammation (24), processes that suppress dietary iron absorption. As mentioned above, mice lacking expression of hepcidin develop a phenotype similar to the homozygous Tfr2Y245X mutant mice. Perhaps TFR2 is responsible for conveying changes in plasma iron to the hepatocyte to influence hepcidin expression. In this model, increased saturation of plasma transferrin leads to increased TFR2-mediated hepatocellular iron uptake, increasing hepcidin production, which in turn down-regulates intestinal iron absorption. Functional loss of either TFR2 or hepcidin thus would lead to excessive intestinal iron absorption. It will be informative to determine whether hepcidin expression is decreased in association with functional loss of Tfr2 in the homozygous Tfr2Y245X mutant mice and in patients with HH type 3.
Patients with TFR2 mutations manifest the periportal hepatic iron loading, increased transferrin saturations, and increased serum ferritin levels observed in the mutant mice. Some have evidence of the end organ injury seen with prolonged iron overload including liver cirrhosis, arthritis, diabetes, and hypogonadism. It remains to be determined whether the Tfr2 mutant mice will demonstrate continued iron loading over time and develop the secondary end organ injury observed in individuals with HH type 3. Patients with HH type 3 typically have normal hematocrit levels and tolerate repeated therapeutic phlebotomy. These observations suggest that hematopoiesis is not affected in humans with TFR2 mutations and are consistent with the normal erythroid parameters measured in the homozygous Tfr2Y245X mice.
The phenotypic features of the Tfr2 mutant mice and patients with HH type 3 would be difficult to predict based on the current knowledge of the expression pattern and properties of TFR2. TFR2 is highly expressed in erythroid precursors and erythroleukemia cell lines (25) and, when expressed in cell culture, mediates cellular iron uptake (1), yet loss of TFR2 has no obvious consequences on hematopoiesis. The normal erythroid parameters in the Tfr2 mutant mice might be explained by the activity of TFR1, which also is highly expressed in erythroid precursors. More surprising is the observation that although TFR2 is highly expressed in the liver (1, 4, 5), functional loss of TFR2 leads to hepatocellular iron loading. Little expression of TFR1 occurs in the liver (4, 5), and its expression is down-regulated by increased cellular iron. Perhaps the hepatocellular iron loading observed in the homozygous Tfr2Y245X mutant mice is caused by uptake of nontransferrin-bound iron (NTBI). NTBI is detectable in the plasma when transferrin saturations become very high and is taken up readily by hepatocytes (26). Although NTBI has not been measured yet in the Tfr2 mutant mice, the transferrin saturations of most homozygous Tfr2 mutant mice were greater than 85%.
The vast majority of patients with HH are homozygous for mutations in the HFE gene. However, a significant percentage of individuals are not. The proportion of such cases is highly dependent on the patient population studied and has been reported to be as high as 36% in one study from Italy (27). This variability likely reflects the Northern European founder effect for the C282Y HFE mutation (28). In a study of Italian patients with non-HFE-associated HH, Camaschella et al. made the first association between TFR2 mutations and iron overload (6). Since the initial report of the Y250X mutation, four additional TFR2-coding sequence mutations have been identified in patients with non-HFE-associated HH. These mutations are: E60X, M172K, AVAQ 594–597del, and Q690P (7, 8). With the exception of Q690P, all of the identified TFR2 mutations have been in pedigrees from Italy. Surveys of patients with non-HFE-associated HH from the United States have failed to identify patients with mutations in TFR2-coding sequences (29–31), suggesting that the overall contribution of TFR2 mutations to the total number of cases of HH is low. Nonetheless, characterizing the role of TFR2 in iron metabolism will offer important insights into the mechanisms by which iron homeostasis is regulated.
In conclusion, observations from the Tfr2Y245X mutant mice support evidence from human studies for a central role for TFR2 in iron homeostasis. The mice provide a useful model for future studies aimed at defining the function of TFR2. The phenotypic similarities between TFR2-associated HH and HFE-associated HH suggest that TFR2 and HFE share a common pathway regulating intestinal iron absorption. Characterizing the role for TFR2 is an important challenge to those interested in understanding the pathogenesis of these enigmatic iron-overload disorders.
Acknowledgments
We acknowledge Elizabeth Snella, Tammi Holmes, and Chris Holden (Transgenic Mouse Facility of the Saint Louis University/Cardinal Glennon Children's Hospital Pediatric Research Institute). This work was supported by National Institutes of Health Grants RO1HL66225 (to R.E.F.) and RO1DK53405, RO1GM34182, and RO1DK40163 (to W.S.S.).
Abbreviations
TFR, transferrin receptor
HH, hereditary hemochromatosis
ES, embryonic stem
β2m, β2-microglobulin
References
- 1.Kawabata H., Yang, R., Hirama, T., Vuong, P. T., Kawano, S., Gombart, A. F. & Koeffler, H. P. (1999) J. Biol. Chem. 274, 20826-20832. [DOI] [PubMed] [Google Scholar]
- 2.Kawabata H., Germain, R. S., Vuong, P. T., Nakamaki, T., Said, J. W. & Koeffler, H. P. (2000) J. Biol. Chem. 275, 16618-16625. [DOI] [PubMed] [Google Scholar]
- 3.West A. P., Bennett, M. J., Sellers, V. M., Andrews, N. C., Enns, C. A. & Bjorkman, P. J. (2000) J. Biol. Chem. 275, 38135-38138. [DOI] [PubMed] [Google Scholar]
- 4.Fleming R. E., Migas, M. C., Holden, C. C., Waheed, A., Britton, R. S., Tomatsu, S., Bacon, B. R. & Sly, W. S. (2000) Proc. Natl. Acad. Sci. USA 97, 2214-2219. [DOI] [PMC free article] [PubMed] [Google Scholar]
- 5.Kawabata H., Germain, R. S., Ikezoe, T., Tong, X., Green, E. M., Gombart, A. F. & Koeffler, H. P. (2001) Blood 98, 1949-1954. [DOI] [PubMed] [Google Scholar]
- 6.Camaschella C., Roetto, A., Cali, A., De Gobbi, M., Garozzo, G., Carella, M., Majorano, N., Totaro, A. & Gasparini, P. (2000) Nat. Genet. 25, 14-15. [DOI] [PubMed] [Google Scholar]
- 7.Roetto A., Totaro, A., Piperno, A., Piga, A., Longo, F., Garozzo, G., Cali, A., De Gobbi, M., Gasparini, P. & Camaschella, C. (2001) Blood 97, 2555-2560. [DOI] [PubMed] [Google Scholar]
- 8.Girelli D., Bozzini, C., Roetto, A., Alberti, F., Daraio, F., Colombari, R., Olivieri, O., Corrocher, R. & Camaschella, C. (2002) Gastroenterology 122, 1295-1302. [DOI] [PubMed] [Google Scholar]
- 9.Levy J. E., Jin, O., Fujiwara, Y., Kuo, F. & Andrews, N. C. (1999) Nat. Genet. 21, 396-399. [DOI] [PubMed] [Google Scholar]
- 10.Bunting M., Bernstein, K. E., Greer, J. M., Capecchi, M. R. & Thomas, K. R. (1999) Genes Dev. 13, 1524-1528. [DOI] [PMC free article] [PubMed] [Google Scholar]
- 11.Press R. D. (2001) Mol. Diagn. 6, 347. [PubMed] [Google Scholar]
- 12.Fielding J. (1980) in Iron, ed. Cook, J. D. (Churchill Livingstone, New York), pp. 90–115.
- 13.Torrance J. D. & Bothwell, T. H. (1980) in Iron, ed. Cook, J. D. (Churchill Livingstone, New York), pp. 90–115.
- 14.Zhou X. Y., Tomatsu, S., Fleming, R. E., Parkkila, S., Waheed, A., Jiang, J., Fei, Y., Brunt, E. M., Ruddy, D. A., Prass, C. E., et al. (1998) Proc. Natl. Acad. Sci. USA 95, 2492-2497. [DOI] [PMC free article] [PubMed] [Google Scholar]
- 15.Levy J. E., Montross, L. K., Cohen, D. E., Fleming, M. D. & Andrews, N. C. (1999) Blood 94, 9-11. [PubMed] [Google Scholar]
- 16.Bahram S., Gilfillan, S., Kuhn, L. C., Moret, R., Schulze, J. B., Lebeau, A. & Schumann, K. (1999) Proc. Natl. Acad. Sci. USA 96, 13312-13317. [DOI] [PMC free article] [PubMed] [Google Scholar]
- 17.Santos M., Schilham, M. W., Rademakers, L. H., Marx, J. J., de Sousa, M. & Clevers, H. (1996) J. Exp. Med. 184, 1975-1985. [DOI] [PMC free article] [PubMed] [Google Scholar]
- 18.de Sousa M., Reimao, R., Lacerda, R., Hugo, P., Kaufmann, S. H. & Porto, G. (1994) Immunol. Lett. 39, 105-111. [DOI] [PubMed] [Google Scholar]
- 19.Nicolas G., Bennoun, M., Devaux, I., Beaumont, C., Grandchamp, B., Kahn, A. & Vaulont, S. (2001) Proc. Natl. Acad. Sci. USA 98, 8780-8785. [DOI] [PMC free article] [PubMed] [Google Scholar]
- 20.Montosi G., Donovan, A., Totaro, A., Garuti, C., Pignatti, E., Cassanelli, S., Trenor, C. C., Gasparini, P., Andrews, N. C. & Pietrangelo, A. (2001) J. Clin. Invest. 108, 619-623. [DOI] [PMC free article] [PubMed] [Google Scholar]
- 21.Harris Z. L., Klomp, L. W. & Gitlin, J. D. (1998) Am. J. Clin. Nutr. 67, 972S-977S. [DOI] [PubMed] [Google Scholar]
- 22.Finch C. (1994) Blood 84, 1697-1702. [PubMed] [Google Scholar]
- 23.Gavin M. W., McCarthy, D. M. & Garry, P. J. (1994) Am. J. Clin. Nutr. 59, 1376-1380. [DOI] [PubMed] [Google Scholar]
- 24.Pigeon C., Ilyin, G., Courselaud, B., Leroyer, P., Turlin, B., Brissot, P. & Loreal, O. (2001) J. Biol. Chem. 276, 7811-7819. [DOI] [PubMed] [Google Scholar]
- 25.Kawabata H., Nakamaki, T., Ikonomi, P., Smith, R. D., Germain, R. S. & Koeffler, H. P. (2001) Blood 98, 2714-2719. [DOI] [PubMed] [Google Scholar]
- 26.Brissot P., Wright, T. L., Ma, W. L. & Weisiger, R. A. (1985) J. Clin. Invest. 76, 1463-1470. [DOI] [PMC free article] [PubMed] [Google Scholar]
- 27.Carella M., D'Ambrosio, L., Totaro, A., Grifa, A., Valentino, M. A., Piperno, A., Girelli, D., Roetto, A., Franco, B., Gasparini, P., et al. (1997) Am. J. Hum. Genet. 60, 828-832. [PMC free article] [PubMed] [Google Scholar]
- 28.Jazwinska E. C., Pyper, W. R., Burt, M. J., Francis, J. L., Goldwurm, S., Webb, S. I., Lee, S. C., Halliday, J. W. & Powell, L. W. (1995) Am. J. Hum. Genet. 56, 428-433. [PMC free article] [PubMed] [Google Scholar]
- 29.Barton E. H., West, P. A., Rivers, C. A., Barton, J. C. & Acton, R. T. (2001) Blood Cells Mol. Dis. 27, 279-284. [DOI] [PubMed] [Google Scholar]
- 30.Lee P. L., Gelbart, T., West, C., Halloran, C., Felitti, V. & Beutler, E. (2001) Blood Cells Mol. Dis. 27, 783-802. [DOI] [PubMed] [Google Scholar]
- 31.Aguilar-Martinez P., Esculie-Coste, C., Bismuth, M., Giansily-Blaizot, M., Larrey, D. & Schved, J. F. (2001) Blood Cells Mol. Dis. 27, 290-293. [DOI] [PubMed] [Google Scholar]


