Abstract
The deleted in liver cancer 2 (DLC2) gene, located at chromosome 13q12.3, is a recently identified tumor suppressor gene. The gene is frequently underexpressed in human hepatocellular carcinoma, and its chromosomal region shows frequent deletion. DLC2 encodes a unique RhoGTPase-activating protein (RhoGAP) specific for small RhoGTPases, RhoA, and Cdc42. With bioinformatic analysis, we have identified four different isoforms of DLC2, which we named DLC2α, DLC2β, DLC2γ, and DLC2δ. Three of the isoforms contain the RhoGAP domain, namely, DLC2α, DLC2β, and DLC2γ. Ectopic expression of these three isoforms in mouse fibroblasts showed cytoplasmic localization. Of interest, overexpression of these isoforms suppressed the lysophosphatidic acid-induced stress fiber formation in mouse fibroblasts and changed the morphology of the transfected cells from angular and spindle to round. Furthermore, the RhoA pull-down assay demonstrated a remarkable reduction in RhoA activity in the DLC2 transiently transfected cells. In contrast, cells transfected with inactive DLC2 GAP-mutant remained unchanged in cell morphology, actin stress fiber formation, and RhoA activity. HepG2 hepatoma cells stably transfected with the DLC2γ isoform also changed to a round morphology, as in mouse fibroblasts. Of significance, these DLC2γ stable transfectants showed marked suppression in cell proliferation, motility, and transformation, and there was a remarkable reduction in in vivo RhoA activity in these cells. These results suggest that DLC2 exhibits its tumor suppressor functions in vivo as a GAP specific for RhoA, exerting its effects in suppression of cytoskeleton reorganization, cell growth, cell migration, and transformation.
Hepatocellular carcinoma (HCC) is one of the most common cancers worldwide, especially in Southeast Asia and Hong Kong. The risk factors contributing to HCC include chronic hepatitis B and C virus infection, cirrhosis, and prolonged exposure to aflatoxin B1. Although the risk factors are well defined, the molecular mechanisms of hepatocarcinogenesis are unclear.
The small RhoGTPases are members of the Ras superfamily of small GTP-binding proteins and are key regulators of cytoskeleton dynamics in eukaryotic cells. RhoGTPases act as molecular switches, cycling between the active GTP-bound state and the inactive GDP-bound state, and regulate a number of cellular processes such as cytoskeleton reorganization, gene transcription, and cell cycle progression (1). The best characterized Rho family members in mammalian cells are RhoA, Cdc42, and Rac1. RhoA is involved in the formation of stress fibers and focal adhesions, whereas Cdc42 and Rac1 work together at the leading edges of cells to direct the formation of lamellipodia and filopodia, respectively (2–4).
In addition to the regulation of the cytoskeleton reorganization, RhoGTPases are involved in cell proliferation and cell motility (5). Active RhoGTPases promote cells to progress from G1 to S phase, whereas inhibition of RhoGTPases blocks serum-induced G1 progression (6).
In human cancers, alteration of RhoA expression is involved in tumorigenesis (7). Indeed, overexpression of RhoA was found in several types of cancer including bladder, testicular, ovarian, colon, breast, and lung (5, 8–10). These lines of evidence suggest that elevated level of RhoA expression is closely related to tumor development. Therefore, down-regulation of RhoA expression or activity may be useful in reversing tumor cell behavior.
The activity of RhoGTPases is negatively regulated by GTPase-activating proteins (GAPs) (11–14). As activation of RhoGTPases can stimulate cell proliferation and cell motility, inhibition of the RhoGTPase activity may suppress the oncogenic and metastatic potential of tumor cells. We have previously identified a unique RhoGAP, which we named DLC2 (deleted in liver cancer 2) (15), because of its high homology to the tumor suppressor gene DLC1 (16, 17). Both DLC1 and DLC2 contain a RhoGAP domain, and we have demonstrated that they exhibit GAP activity on RhoA and Cdc42 in vitro (15, 18). We also found that DLC2 was significantly underexpressed in HCC and was also able to suppress Ras-mediated cellular transformation in NIH 3T3 cells (15). However, the functional role of DLC2 in liver carcinogenesis remains unclear. Using bioinformatic search of DLC2 gene in human genome, we have been able to identify four isoforms of DLC2, namely DLC2α, DLC2β, DLC2γ, and DLC2δ. In this study, we further characterized the in vivo function and tumor suppressor activity of DLC2 and its RhoGAP domain-containing isoforms in HCC.
Materials and Methods
Cell Culture, Transfection, and Stable Cell Lines. Swiss 3T3 fibroblasts were maintained in low glucose DMEM (Invitrogen) supplemented with 10% bovine serum (JRH Biosciences, Lenexa, KS) and 100 units of penicillin/streptomycin. HepG2 and HEK293 cells were maintained in high glucose DMEM supplemented with 10% FBS and 100 units of penicillin/streptomycin. Cells were transfected with FuGene6 transfection reagent (Roche Molecular Biochemicals) and 3 μg of DNA construct according to the protocol recommended by the manufacturer. For HepG2, the transfected cells were selected and maintained in full medium containing G418 at 1 mg/ml (Calbiochem). Cells stably expressing DLC2 were then isolated and the expression of DLC2 was confirmed by Western blotting by using anti-GFP Ab (Santa Cruz Biotechnology).
Cloning of DLC2 Expression Vectors. To study the function of the DLC2 isoforms in cell lines, eukaryotic expression vectors pEGFP DLC2α, pEGFP DLC2β, and pEGFP DLC2γ encoding DLC2α, DLC2β, and DLC2γ, respectively, were constructed.
In addition, two point mutations were introduced to DLC2γ. Nucleotide changes in DLC2γ cDNA were engineered by using primer pairs 5′-tatggtggaacagttcttccg-3′ and 5′-cggaagaactgttccaccata-3′; and 5′-agttcttcgaggacctccctg-3′ and 5′-cagggaggtcctcgaagaact-3′ to generate DLC2γ K618E and DLC2γ R622E, respectively. All mutant cDNA sequences were confirmed by sequencing.
Lysophosphatidic Acid (LPA)-Induced Stress Fiber Formation. Swiss 3T3 fibroblasts were transfected with FuGene6 transfection reagent and 3 μg of DNA construct according to the manufacturers's protocol. After transfection, cells were starved in DMEM for 24 h and then stimulated with LPA (Sigma) for 15 min.
Confocal Microscopy. For immunofluorescence, cells were fixed with 4% paraformaldehyde in PBS for 15 min at room temperature, and permeabilized with 0.5% Triton X-100 in PBS for 5 min. F-actins were stained with tetramethylrhodamine B isothiocyanate-labeled phalloidin (Sigma) for 20 min at room temperature, and the nuclei were stained by DAPI.
RhoA Pull-Down Assay. Cells were lysed in 500 μl of lysis buffer containing 50 mM Tris (pH 7.4), 10 mM MgCl2, 500 mM NaCl, 1% Triton X-100, 0.1% SDS, 0.5% sodium deoxycholate, 10 μg/ml each of aprotinin and leupeptin, and 1 mM PMSF. The lysates were cleared with centrifugation at 12,000 × g for 10 min at 4°C. The lysate (500 μg) was incubated with 45 μg of GST-RBD (GST fusion protein containing RhoA-binding domain of Rhotekin) bound to glutathione-Sepharose beads (Amersham Pharmacia) for 1 h. After binding, the samples were washed with lysis buffer three times. Bound proteins were fractionated on 12% SDS/PAGE and immunoblotted with polyclonal Ab for RhoA (Santa Cruz Biotechnology). The total cell lysates was also blotted with RhoA Ab as a loading control. The level of active RhoA was determined after normalization with the total RhoA present in the cell lysates.
Proliferation Assay. To determine cell proliferation, 3 × 10⁴ cells were seeded in each well of a six-well plate on day 0 in 2 ml of full medium in triplicate. Cells were counted on consecutive days for 1 wk by using a hematocytometer.
Wound Healing Assay. Cells (5 × 10⁵ per well) were seeded in six-well plates and allowed to adhere for 24 h. The cells were treated with 10 μg/ml Mitomycin C (Sigma) for 3 h, washed with PBS, and then simply wounded with a pipette tip. Fresh, full medium was added, and the cells were allowed to close the wound for 48 h. Photographs were taken every 24 h at the same position of the wound.
Small Interfering RNA (siRNA). Sets of four siGENOME duplexes for DLC2 and siControl nontargeting siRNA pool for control were purchased from Dharmacon (Lafayette, CO). Transfection of siRNA pool and control pool (200 pmol in 2 ml medium) in six-well plates was done by using Lipofectamine 2000 (Invitrogen) according to the manufacturer's instructions.
Quantitative PCR. Total RNA of HepG2 cells after transfection with siRNA in a six-well plate was isolated by TRIzol reagent according to the manufacturer's instruction (Invitrogen). cDNA was synthesized from 1 μg of total RNA by GeneAmp RNA PCR kit (Applied Biosystems). Quantitative PCR was then performed by using Applied Biosystems TaqMan system (DLC2 probe: CCTCGATCAGGTGGGTCTTTTTCGC). Expression of 18S mRNA was used as an internal control. The mRNA expression of DLC2 in DLC2 siRNA-transfected cells was compared with the respective DLC2 mRNA expression in control siRNA-transfected cell.
Cell Migration Assay. Cells (1 × 10⁵) were resuspended in 100 μl of serum-free medium and seeded on the top chamber of the 8-μmpore, 6.5-mm polycarbonate transwell filters (Corning). The full medium (600 μl) was added to the bottom chamber. The cells were allowed to migrate for 8–16 h. The cells were fixed and stained, and the number of cells on the lower surface of the filters was counted under the microscope. A total of 10 fields was counted for each transwell filter.
Soft Agar Assay. Cells (2 × 10⁴) were suspended in 2 ml of medium (DMEM supplemented with 10% FBS) containing 0.4% agar. The cell mixture was then seeded on a layer of 1% bottom agar in 60-mm plate and allowed to grow for 4 wk. The assay was performed in triplicate for each cell line. After 4 wk of incubation, colonies with more than one cell were counted. A total of five fields was counted for each plate.
Results
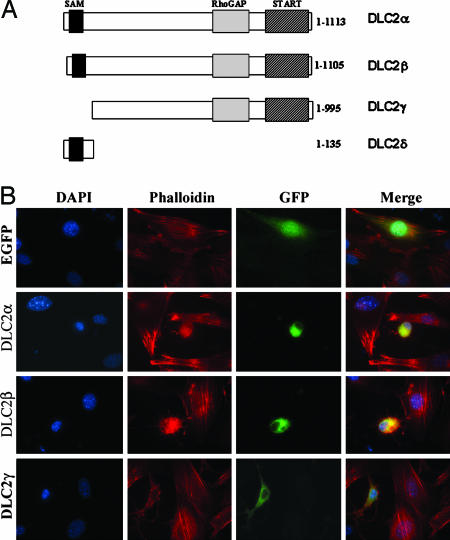
DLC2 Changed Cell Morphology and Suppressed Actin Stress Fiber Formation. During the bioinformatic search on DLC2, we identified four isoforms of DLC2, which we named DLC2α, DLC2β, DLC2γ, and DLC2δ. The domain structure of DLC2 is shown in Fig. 1A. DLC2α represents the full-length form of DLC2 and contains a SAM (sterile alpha motif), a RhoGAP, and a START (steroidogenic acute regulatory-related lipid transfer) domain. The α and β isoforms of DLC2 differ by only a few amino acids at the N-terminal. DLC2γ contains a RhoGAP and a START domain, whereas DLC2δ contains only a SAM domain. In this study, we aimed to study the functions of the RhoGAP domain and thus focused on the isoforms containing the RhoGAP domain, namely DLC2α, DLC2β, and DLC2γ. We investigated the subcellular localization of these three isoforms by transiently transfecting them into mouse fibroblasts Swiss 3T3 cells. They all localized predominantly in the cytoplasm of the transfected cells. The DLC2α-, DLC2β-, and DLC2γ-transfected cells changed their morphology from angular and spindle to round in shape (Fig. 1B). In addition, they showed dendritic cellular protrusions. By confocal microscopy, immunofluorescence staining for F-actin with tetramethylrhodamine B isothiocyanate-labeled phalloidin revealed marked inhibition of LPA-induced stress fiber formation in DLC2-transfected cells, suggesting that these morphological changes were closely and perhaps causally related to alteration in actin cytoskeleton structure.
Fig. 1.
DLC2 isoforms. (A) Functional domains of the DLC2 isoforms. DLC2α and DLC2β each contains a SAM, a RhoGAP, and a START domain, but they differ in their N-terminal sequence. The difference in the amino acid sequence was located at the first 60 aa in DLC2α and the first 52 aa in DLC2β. DLC2γ contains a RhoGAP and a START domain. DLC2δ only contains a SAM domain. (B) Effects on actin cytoskeleton in Swiss 3T3 transfected with DLC2α, DLC2β, DLC2γ, and EGFP vector. After transfection, the cells were starved in DMEM for 24 h and then stimulated with LPA for 15 min. Stress fibers were visualized with tetramethylrhodamine B isothiocyanate-labeled phalloidin, and the nuclei were stained by DAPI.
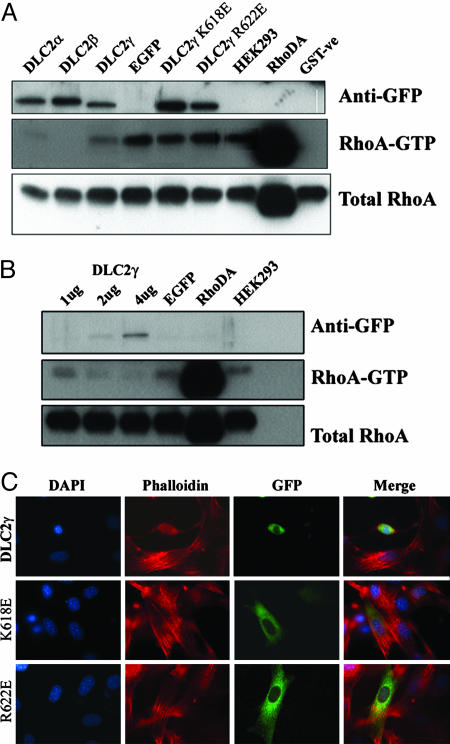
Down-Regulation of RhoA Activity. It is well established that formation of actin stress fibers is regulated by one of the small GTPases, RhoA (1). To test whether the observed alterations in cell morphology and inhibition of actin stress fiber formation in DLC2-transfected cell was related to its in vivo RhoA activity, RhoA activity pull-down assay was performed. In DLC2α- and DLC2β-transfected HEK293 cells, the active form of in vivo RhoA was barely detected in the pull-down assay. The RhoA activity was significantly reduced in DLC2γ-transfected cells, as compared with the mock-transfected and parental HEK293 cells (Fig. 2A). Also, inhibition of RhoA activity by DLC2γ was demonstrated in a dose-dependent manner (Fig. 2B). The RhoA activity decreased with increased amounts of DLC2γ transfected.
Fig. 2.
In vivo RhoA activity in transiently transfected HEK293. (A) RhoA pull-down assay. No detectable RhoA activity was observed in DLC2α- and DLC2β-transfected cells. Significant reduction in RhoA activity was observed in DLC2γ-transfected cells as compared with the mock-transfected and parental HEK293 cells. In the DLC2γ GAP mutant-transfected cells DLC2γ K618E and DLC2γ R622E, the RhoA activity was similar to that of the mock-transfected and parental cells. The RhoA activity of a RhoDA (dominant active)-transfected cell was taken as a positive control of the RhoA activity assay. The protein expression of DLC2 was confirmed by anti-GFP Ab, and the RhoA expression in the total cell lysate was probed as a loading control. GST protein was used as a negative control. (B) The in vivo RhoA activity decreased with increased amounts of DLC2γ. (C) Effects of actin cytoskeleton in Swiss 3T3 transfected with DLC2γ, DLC2γ K618E, and DLC2γ R622E. There was rounding off of the DLC2γ-transfected cells with reduced stress fiber formation. In contrast, no change in cell morphology or actin stress formation was seen in cells transfected with the DLC2 GAP-mutants.
DLC2 RhoGAP Mutants Abolished RhoGAP Activity of DLC2. To confirm that the reduced RhoA activity in DLC2-transfected cells was related to the function of the RhoGAP domain, two inactive DLC2 GAP mutants were constructed and overexpressed. Two conserved amino acid residues, corresponding to K618 and R622 at the RhoGAP domain of the DLC2γ primary sequence and important for the RhoGAP activity, were mutated to glutamate (K618E and R622E, respectively) (19). In the HEK293 cells transfected with the two DLC2γ-RhoGAP mutants (DLC2γ K618E and DLC2γ R622E), the in vivo RhoA activity was unchanged, in contrast to the significant reduction of RhoA activity as seen in DLC2γ-transfected cells (Fig. 2A). The results indicate that DLC2 functions as a RhoGAP in the regulation of in vivo RhoA activity. In addition, to examine whether the alteration of the actin cytoskeleton was caused by the DLC2 RhoGAP activity, DLC2γ K618E and R622E were transiently transfected into Swiss 3T3 cells. The cells expressing these inactive DLC2γ RhoGAP mutants, which had no RhoGAP activity, did not show any morphological change (Fig. 2C). Actin stress fiber formation was also unaffected in K618E or K622E DLC2γ-mutant-transfected cells, as compared with DLC2γ-WT-transfected cells (Fig. 2C). The findings indicate that the DLC2 RhoGAP mutants abolished the RhoGAP function of DLC2 and that alteration in cell morphology and actin stress fiber formation depended on the RhoGAP activity of DLC2.
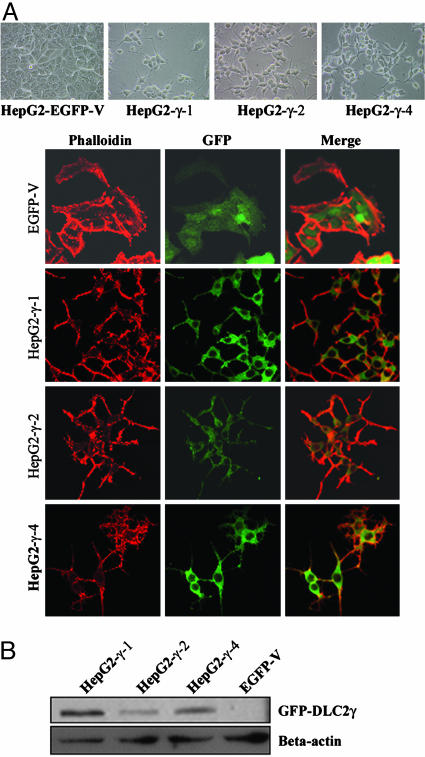
DLC2γ Suppressed Cell Proliferation and Cell Motility. To study the in vivo tumor suppressor function of DLC2 in HCC, we attempted to establish HepG2 hepatoma cells overexpressing pEGFP-DLC2α, pEGFP-DLC2β, pEGFP-DLC2γ, and pEGFP vector control. However, only HepG2 cells stably expressing the DLC2γ and pEGFP vector were successfully established. Three pEGFP-DLC2γ clones (HepG2-γ-1, HepG2-γ-2, and HepG2-γ-4) and one pEGFP vector clone (HepG2-EGFP-V) were then selected for further investigation. The expression of DLC2γ in HepG2-γ-1, HepG2-γ-2, and HepG2-γ-4 was confirmed by Western blotting by using anti-GFP Ab (Fig. 3B). The reason for the failure in obtaining DLC2α- and DLC2β-stably expressing clones was not clear, but there was a possibility that the full-length form of DLC2 might exert a huge suppressive effect on the cells so that they failed to attach to the substrate, which we observed in this study. Similar observation was also made in a previous report with regard to the establishment of stable clones of another RhoGAP-containing protein, p122 (19). Similar to the transiently transfected mouse fibroblasts, the HepG2 cells stably transfected with DLC2γ also showed round morphology with dendritic cellular projections (Fig. 3A).
Fig. 3.
Morphology of DLC2γ stable clones. (A) The morphology of DLC2γ stably transfected cells, HepG2-γ-1, HepG2-γ-2, and HepG2-γ-4 showed round morphology with dendritic projections, as compared with the pEGFP-vector-transfected cells, HepG2-EGFP-V. (B) Expression of DLC2 in stable cell lines. The expression of DLC2γ in HepG2-γ-1, HepG2-γ-2, HepG2-γ-4, and HepG2-EGFP-V was confirmed by Western blotting by using anti-GFP Ab.
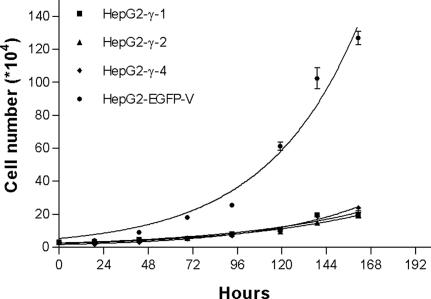
Apart from the regulation of actin cytoskeleton reorganization, RhoA is also involved in controlling cell proliferation. To study the effects of DLC2γ in cell growth, cell proliferation assay was performed to examine the cell proliferation rates of HepG2-γ-1, HepG2-γ-2, HepG2-γ-4, and HepG2-EGFP-V cells. As shown in Fig. 4, markedly retarded cell proliferation rates were observed in all three DLC2γ-stable transfectants.
Fig. 4.
Proliferation rates of DLC2γ stably transfected cells. HepG2-γ-1, HepG2-γ-2, HepG2-γ-4, and HepG2-EGFP-V were plated onto six-well plates, and the cell growth was analyzed by counting the cell numbers consecutively for 7 d. Remarkably low proliferation rates were observed in HepG2-γ-1, HepG2-γ-2, and HepG2-γ-4 when compared with HepG2-EGFP-V.
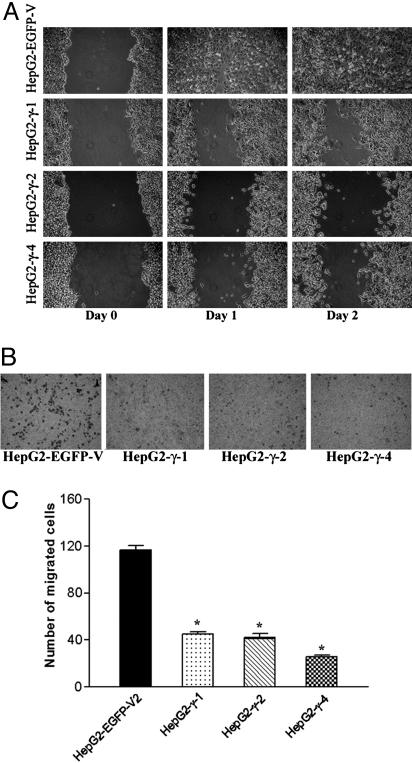
To explore the roles of DLC2 in the regulation of cell motility, we examined the cell migration ability of HepG2-γ-1, HepG2-γ-2, HepG2-γ-4, and HepG2-EGFP-V cells by wound healing assay. The cells were pretreated with Mitomycin C, which inhibits cell division, so that the difference in motility was not affected by differences in cell proliferation rates. The HepG2-EGFP-V closed the wound 2 d after incubation, whereas HepG2-γ-1, HepG2-γ-2, and HepG2-γ-4 were unable to close the wound at the same time point (Fig. 5A). Thus, the HepG2-γ-1, HepG2-γ-2, and HepG2-γ-4 cells exhibited an obvious reduction in migration rate as compared with the HepG2-EGFP-V vector control. In addition to wound healing assay, transwell migration assay was performed to confirm the reduction in motility of the stable clones (Fig. 5B). Consistent with the results in wound healing, cell migration was significantly inhibited in all three DLC2γ-overexpressing stable clones. The number of migrated cells of the DLC2γ stable cells was reduced by nearly 3-fold as compared with the control (Fig. 5C).
Fig. 5.
DLC2 reduced the migration rates of HepG2 cells. (A) Cell migration of DLC2γ stable cell lines in in vitro scratch wound healing assay. HepG2-γ-1, HepG2-γ-2, HepG2-γ-4, and HepG2-EGFP-V were treated with Mitomycin C before wounding on day 0. Photographs were taken at day 1 and 2, respectively, after the wound was made. (B) Transwell migration assay of DLC2γ stable cell lines. Transwell filter was used to measure the migration ability of HepG2-γ-1, HepG2-γ-2, HepG2-γ-4, and HepG2-EGFP-V. Migrated cells at the lower surface of the transwell filter were stained and counted. (C) The numbers of the migrated cells in HepG2-γ-1 (*, P < 0.0001, t test), HepG2-γ-2 (*, P = 0.0001, t test), and HepG2-γ-4 (*, P < 0.0001, t test) were significantly lower than that of the mock-transfected HepG2-EGFP-V cells.
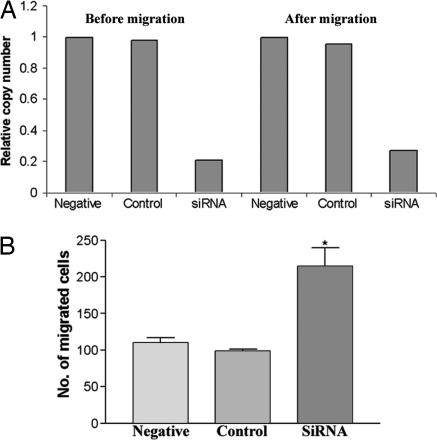
Silencing of DLC2-Enhanced Cell Motility. To study the importance of DLC2 in regulating cell motility, we used siRNA to knock down DLC2 expression in HepG2 cells. Transfection of the siRNA for DLC2 profoundly reduced the DLC2 expression by >70% in HepG2 cells relative to the control siRNA and nontransfected cell control (Fig. 6A). A reduction of DLC2 mRNA level was persistently observed up to at least for 2 d (Fig. 6A). After siRNA transfection, transwell migration assay was performed for 8 h to study the motility of DLC2-silenced cell. The DLC2 siRNA significantly increased the number of migrated cells, whereas the control siRNA had no effect (Fig. 6B) (P = 0.009). Therefore, down-regulation of DLC2 expression was able to promote the migration rate of HepG2 cells.
Fig. 6.
Down-regulation of DLC2-enhanced cell motility. (A) RNA of DLC2 siRNA and control siRNA-transfected and -nontransfected HepG2 cells were extracted before and after migration. Real-time PCR was performed to measure the expression level of DLC2. Expression of DLC2 was largely reduced in DLC2 siRNA-transfected cell relative to the nontransfected cell. (B) The number of migrated cell of DLC2 siRNA-transfected cell was significantly higher than control siRNA-transfected and -nontransfected cell (*, P = 0.009, t test).
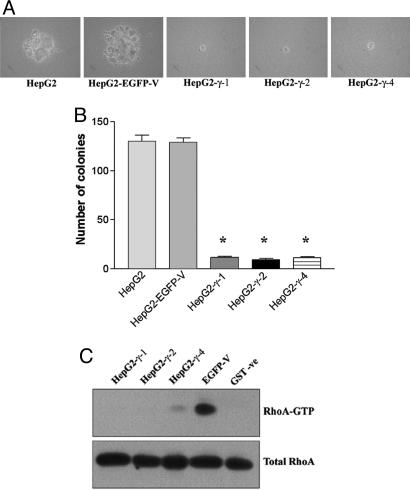
DLC2γ Remarkably Reduced the Ability of Anchorage-Independent Growth. To study whether the transforming ability on HepG2 hepatoma cells could be reversed by DLC2, anchorage-independent soft agar assay was performed with the HepG2-γ-1, HepG2-γ-2, HepG2-γ-4, HepG2-EGFP-V, and parental HepG2 cells. The mock-transfected and parental HepG2 cells grew and formed large colonies within 4 wk. In contrast, all of the DLC2γ-stably transfected HepG2 cells (HepG2-γ-1, HepG2-γ-2, and HepG2-γ-4) failed to grow in soft agar plate and most of them remained as single cells (Fig. 7A). The numbers of colonies in HepG2-γ-1 (P < 0.0001, t test), HepG2-γ-2 (P < 0.0001, t test), and HepG2-γ-4 (P < 0.0001, t test) were significantly lower than those of parental and mock-transfected HepG2 cells (Fig. 7B).
Fig. 7.
Anchorage-independent soft agar assay. (A) Large colonies were observed in HepG2 and mock-transfected HepG2 cells. HepG2-γ-1, HepG2-γ-2, and HepG2-γ-4 cells failed to grow in soft agar and remained as single cells. (B) The number of colonies formed was counted in each cell line. The numbers of colonies in HepG2-γ-1, HepG2-γ-2, and HepG2-γ-4 were significantly lower than those of parental and mock-transfected HepG2 cells (*, P < 0.0001, t test). (C) In vivo RhoA activity in DLC2γ stable cell lines. No detectable RhoA activity was observed in HepG2-γ-1 and HepG2-γ-2, and a marked reduction in RhoA activity was observed in HepG2-γ-4 as compared with that in HepG2-EGFP-V. GST protein was used as a negative control.
Down-Regulation of RhoA in HepG2 Cells Stably Transfected with DLC2γ. To address the possible molecular basis contributing to the effects on the cell morphology, proliferation, and migration in DLC2γ stably transfected cell, RhoA pull-down assay was performed to measure the in vivo RhoA activity in HepG2-γ-1, HepG2-γ-2, HepG2-γ-4, and HepG2-EGFP-V cells. No detectable activity of RhoA was found in HepG2-γ-1 and HepG2-γ-2 cells, and a remarkable reduction of RhoA activity was detected in HepG2-γ-4 cells (Fig. 7C). The results suggest that DLC2γ down-regulates RhoA activity in the stably transfected HepG2 cells, similar to that observed in the transient-transfected cells. Overall, the data suggest that DLC2 negatively modulates RhoA activity, which in turn contributes to the alteration in the cell properties.
Discussion
We have previously reported that DLC2 is a unique tumor suppressor located on chromosome 13q12.3 (1). Its functions and corresponding mechanistic basis are, however, not yet defined. In this study, we have reported that DLC2 consists of four isoforms, DLC2α, DLC2β, DLC2γ, and DLC2δ. As we aimed to study the functions of the RhoGAP domain, we focused on the isoforms containing the RhoGAP domain, namely DLC2α, DLC2β, and DLC2γ. Transfection of DLC2α, DLC2β, and DLC2γ into mouse fibroblasts revealed predominantly cytoplasmic localization. Moreover, we observed that DLC2α, DLC2β, and DLC2γ could inhibit LPA-induced stress fiber formation and resulted in round morphology with dendritic projections in mouse fibroblasts as well as in hepatoma cells. The alteration of cell morphology was likely a result of change in actin organization and down-regulation of the RhoA activity. Similar observation was also reported in cell systems transfected with other RhoGAP domain-containing proteins (19–21). In addition, in our study, we have identified and characterized two amino acid residues that are critical for the RhoGAP activity of DLC2. Mutations of amino acids K618E and R622E at the RhoGAP domain of DLC2γ were able to specifically abolish the RhoGAP function of DLC2. In mouse fibroblasts transfected with DLC2γ-RhoGAP mutant, there was no apparent change in cell morphology, suggesting that the alteration in cell morphology was caused by the GAP activity of DLC2. These findings indicate that DLC2 acts as a RhoGAP in the regulation of cytoskeleton reorganization.
Several studies in human cancers have demonstrated that overexpression of RhoA is involved in tumorigenesis (22). Inhibition of RhoA activity may be able to reverse the transformation phenotype in cancers. In our previous study on DLC2, we had documented that the RhoGAP domain of DLC2 exerted its GAP activity specific for RhoA and Cdc42 in vitro. In the present study, we have demonstrated that DLC2 also had RhoGAP activity specific for RhoA in vivo. With transient transfection of DLC2 into HEK293 cells, we have also demonstrated that the in vivo RhoA activity was remarkably reduced by DLC2α, DLC2β, and DLC2γ, but not by the vector control. In contrast, no inhibition of RhoA activity was found with the DLC2γ-RhoGAP mutants, confirming that the RhoGAP activity of DLC2 was related to its RhoGAP domain. Furthermore, all DLC2γ stable clones of HepG2 also displayed a dramatic reduction of RhoA activity. These results suggest that the functions of DLC2γ are likely related to its RhoGAP activity in down-regulating RhoA. In addition, the DLC2γ stably transfected cells showed a round morphology, which was similar to cells treated with C3 exoenyzme, a RhoA inhibitor (6, 23).
It has been shown that RhoGTPases are involved in controlling signal transduction pathways essential for cell growth. Microinjection of RhoA is sufficient to promote the quiescent fibroblasts to enter G1 and progress to S phase (6). Dominant negative of RhoA or treatment with C3 exoenzyme is able to block the progression of cell cycle from G1 phase to S phase (6, 23). Also, RhoA was shown to be required for G1–S progression and DNA synthesis through degradation of cyclin-dependent kinase inhibitor p21Waf/Cip1 (24). Therefore, RhoA is able to promote cell cycle progression and results in increased cell proliferation. Inhibition of the RhoA activity by RhoGAP-containing proteins has been shown to slow down cell cycle progression (25). Our data also provide evidence that overexpression of DLC2γ could effectively inhibit the proliferation rates of HCC cells. We have also investigated the expression of p21Waf/Cip1 in our DLC2 overexpressing cell, but no significant difference was found (data not shown), suggesting that DLC2 may inhibit cell growth via a different molecular pathway. It will be interesting to know how the DLC2 inhibits cell proliferation, but our data are consistent with the view that DLC2 functions as a tumor suppressor by inhibiting tumor cell growth.
In the present study, we have shown that the DLC2γ stably transfected cells displayed a round morphology similar to cells treated with a RhoA inhibitor (C3 exo-enyzme) or a Rho-associated kinase (ROCK) inhibitor. Such phenomenon was consistent with the observation that DLC2γ suppressed the RhoA activity (Fig. 7C) and inhibited the motility of cells. Indeed, we have demonstrated that DLC2γ reduced the migration ability of HCC cells by using the transwell assay and this was mainly attributed to the down-regulation of RhoA activity. On the other hand, we also shown that down-regulation of DLC2 by siRNA enhanced the migration ability in HCC cells. Both overexpression and underexpression approaches were used to confirm the role of DLC2 in cell motility, and consistent results were obtained. Another study has shown that a high activity of RhoA increases the migration ability of certain cancer cells including HCC cells (26). It has been reported that inhibition of Rho/p160ROCK, which is an immediate downstream effector of RhoA, could suppress the motility of HCC cells (14). Importantly, inhibition of ROCK reduces the metastatic potential of tumor cells. Administration of a pharmacological ROCK inhibitor prevented i.p. dissemination of HCC cells in mice and also resulted in reversing the aggressive phenotype of the HCC cells in the liver (27, 28). Hence, further study on the role of DLC2 in HCC metastasis and its interaction with RhoA/ROCK-signaling pathway is of particular interest.
Anchorage-independent growth of cancer cells is a hallmark of cell transformation. In this study, we used HepG2 hepatoma cells stably expressing DLC2γ to show that DLC2 can effectively diminish the anchorage-independent growth ability of the cells. This result provides evidence that overexpression of DLC2, a RhoGAP protein, is capable of reducing the transforming phenotype of hepatoma cells, supporting the view that DLC2 is a functional tumor suppressor. Interestingly, it has been shown that overexpression of a constitutively activated mutant of RhoA led to the transformation of NIH 3T3 in soft agar assay. Also, coexpression of that mutant with oncogenic Ras further enhanced the oncogenic properties of NIH 3T3, suggesting the synergistic effect of RhoA and Ras in cell transformation (29). In contrast, expression of the dominant-negative N19-RhoA is able to inhibit the transforming phenotype of Ras-transformed NIH 3T3 and Rat1 cells (30). Of interest, our previous report has shown that the RhoGAP domain of DLC2 can suppress the Ras-induced cell transformation (15). Here, we provide the evidence that DLC2 acts as a RhoA negative regulator resulted in inhibiting the oncogenic phenotype of transformed cells, similar to the dominant-negative form of RhoA. Further investigation on the roles of DLC2 in suppressing cancer cell growth and cell transformation is crucial for better understanding of the molecular mechanism in the development of HCC.
In summary, our findings suggest that DLC2, with its RhoGAP domain, is able to inhibit the activity of RhoA, which is believed to play a significant role in cell transformation in many cancer types. This result leads to a change in cell morphology and alteration of stress fiber formation. Down-regulation of the RhoA activity by DLC2γ is sufficient to inhibit cell proliferation and cell migration and remarkably reduces the transforming phenotype of hepatoma cells.
Acknowledgments
This work was funded in part by the Hong Kong Research Grants Council (Project HKU 7281/01M) and Association for International Cancer Research Grant 03-216.
Author contributions: T.H.-Y.L., Y.-P.C., J.W.P.Y., C.-M.W., T.-O.Y., D.-Y.J. and I.O.-L.N. designed research; T.H.-Y.L. performed research; T.H.-Y.L. and I.O.-L.N. analyzed data; and T.H.-Y.L. wrote the paper.
This paper was submitted directly (Track II) to the PNAS office.
Abbreviations: HCC, hepatocellular carcinoma; RhoGAP, RhoGTPase-activating protein; LPA, lysophosphatidic acid; siRNA, small-interfering RNA; ROCK, Rho-associated kinase; SAM, sterile alpha motif; START, steroidogenic acute regulatory-related lipid transfer.
Data deposition: The sequences reported in this paper have been deposited in the GenBank database [accession nos. AY082589 (DLC2α), AY082590 (DLC2β), AY082591 (DLC2γ), and AY082592 (DLC2δ)].
References
- 1.Hall, A. (1998) Science 279, 509-514. [DOI] [PubMed] [Google Scholar]
- 2.Nobes, C. D. & Hall, A. (1995) Biochem. Soc. Trans. 23, 456-459. [DOI] [PubMed] [Google Scholar]
- 3.Ridley, A. J. & Hall, A. (1992) Cell 70, 389-399. [DOI] [PubMed] [Google Scholar]
- 4.Ridley, A. J., Paterson, H. F., Johnston, C. L., Diekmann, D. & Hall, A. (1992) Cell 70, 401-410. [DOI] [PubMed] [Google Scholar]
- 5.Jaffe, A. B. & Hall, A. (2002) Adv. Cancer Res. 84, 57-80. [DOI] [PubMed] [Google Scholar]
- 6.Olson, M. F., Ashworth, A. & Hall, A. (1995) Science 269, 1270-1272. [DOI] [PubMed] [Google Scholar]
- 7.Sahai, E. & Marshall, C. J. (2002) Nat. Rev. Cancer 2, 133-142. [DOI] [PubMed] [Google Scholar]
- 8.Kamai, T., Arai, K., Tsujii, T., Honda, M. & Yoshida, K. (2001) BJU Int. 87, 227-231. [DOI] [PubMed] [Google Scholar]
- 9.Fritz, G., Just, I. & Kaina, B. (1999) Int. J. Cancer 81, 682-687. [DOI] [PubMed] [Google Scholar]
- 10.Kamai, T., Tsujii, T., Arai, K., Takagi, K., Asami, H., Ito, Y. & Oshima, H. (2003) Clin Cancer Res. 9, 2632-2641. [PubMed] [Google Scholar]
- 11.Hall, A. (1992) Cell 69, 389-391. [DOI] [PubMed] [Google Scholar]
- 12.Hall, A., Paterson, H. F., Adamson, P. & Ridley, A. J. (1993) Philos. Trans. R. Soc. London B. 340, 267-271. [DOI] [PubMed] [Google Scholar]
- 13.Hall, A. (1994) Annu. Rev. Cell Biol. 10, 31-54. [DOI] [PubMed] [Google Scholar]
- 14.Machesky, L. M. & Hall, A. (1996) Trends Cell Biol. 6, 304-310. [DOI] [PubMed] [Google Scholar]
- 15.Ching, Y. P., Wong, C. M., Chan, S. F., Leung, T. H., Ng, D. C., Jin, D. Y. & Ng, I. O. (2003) J. Biol. Chem. 278, 10824-10830. [DOI] [PubMed] [Google Scholar]
- 16.Ng, I. O., Liang, Z. D., Cao, L. & Lee, T. K. (2000) Cancer Res. 60, 6581-6584. [PubMed] [Google Scholar]
- 17.Yuan, B. Z., Miller, M. J., Keck, C. L., Zimonjic, D. B., Thorgeirsson, S. S. & Popescu, N. C. (1998) Cancer Res. 58, 2196-2199. [PubMed] [Google Scholar]
- 18.Wong, C. M., Lee, J. M., Ching, Y. P., Jin, D. Y. & Ng, I. O. (2003) Cancer Res. 63, 7646-7651. [PubMed] [Google Scholar]
- 19.Sekimata, M., Kabuyama, Y., Emori, Y. & Homma, Y. (1999) J. Biol. Chem. 274, 17757-17762. [DOI] [PubMed] [Google Scholar]
- 20.Lavelin, I. & Geiger, B. (2005) J. Biol. Chem. 280, 7178-7185. [DOI] [PubMed] [Google Scholar]
- 21.Muller, R. T., Honnert, U., Reinhard, J. & Bahler, M. (1997) Mol. Biol. Cell 8, 2039-2053. [DOI] [PMC free article] [PubMed] [Google Scholar]
- 22.Pille, J. Y., Denoyelle, C., Varet, J., Bertrand, J. R., Soria, J., Opolon, P., Lu, H., Pritchard, L. L., Vannier, J. P., Malvy, C., Soria, C. & Li, H. (2005) Mol. Ther. 11, 267-274. [DOI] [PubMed] [Google Scholar]
- 23.Yamamoto, M., Marui, N., Sakai, T., Morii, N., Kozaki, S., Ikai, K., Imamura, S. & Narumiya, S. (1993) Oncogene 8, 1449-1455. [PubMed] [Google Scholar]
- 24.Olson, M. F., Paterson, H. F. & Marshall, C. J. (1998) Nature 394, 295-299. [DOI] [PubMed] [Google Scholar]
- 25.Modarressi, M. H., Cheng, M., Tarnasky, H. A., Lamarche-Vane, N., de Rooij, D. G., Ruan, Y. & van der Hoorn, F. A. (2004) Biol. Reprod. 71, 1980-1990. [DOI] [PMC free article] [PubMed] [Google Scholar]
- 26.Genda, T., Sakamoto, M., Ichida, T., Asakura, H., Kojiro, M., Narumiya, S. & Hirohashi, S. (1999) Hepatology 30, 1027-1036. [DOI] [PubMed] [Google Scholar]
- 27.Itoh, K., Yoshioka, K., Akedo, H., Uehata, M., Ishizaki, T. & Narumiya, S. (1999) Nat. Med. 5, 221-225. [DOI] [PubMed] [Google Scholar]
- 28.Murata, T., Arii, S., Nakamura, T., Mori, A., Kaido, T., Furuyama, H., Furumoto, K., Nakao, T., Isobe, N. & Imamura, M. (2001) J. Hepatol. 35, 474-481. [DOI] [PubMed] [Google Scholar]
- 29.Khosravi-Far, R., Solski, P. A., Clark, G. J., Kinch, M. S. & Der, C. J. (1995) Mol. Cell. Biol. 15, 6443-6453. [DOI] [PMC free article] [PubMed] [Google Scholar]
- 30.Qiu, R. G., Chen, J., McCormick, F. & Symons, M. (1995) Proc. Natl. Acad. Sci. USA 92, 11781-11785. [DOI] [PMC free article] [PubMed] [Google Scholar]


