Abstract
Elucidation of the mechanisms involved in long-distance water transport in trees requires knowledge of the water distribution within the sapwood and heartwood of the stem as well as of the earlywood and latewood of an annual ring. X-ray computed tomography is a powerful tool for measuring density distributions and water contents in the xylem with high spatial resolution. Ten- to 20-year-old spruce (Picea abies L. KARST.) and oak (Quercus robur) trees grown in the field were used throughout the experiments. Stem and branch discs were collected from different tree heights, immediately deep frozen, and used for the tomographic determinations of spatial water distributions. Results are presented for single-tree individuals, demonstrating heartwood and sapwood distribution throughout their entire length as well as the water relations in single annual rings of both types of wood. Tree rings of the sapwood show steep water gradients from latewood to earlywood, whereas those of the heartwood reflect water deficiency in both species. Although only the latest two annual rings of the ringporous species are generally assumed to transport water, we found similar amounts of water and no tyloses in all rings of the oak sapwood, which indicates that at least water storage is important in the whole sapwood.
The aim of this study was to test high-resolution computed tomography (CT) for water relations in spruce (Picea abies L. KARST.) and oak (Quercus robur) stems rather then to analyze the general features of tree conductive systems that are already well documented (Hartig, 1855; Mac Dougal, 1925; C̆ermak et al., 1992).
The CT method was developed by Cormack and Hounsfield and today has become a standard examination method in the medical field and material sciences (Hounsfield, 1980). In plants, CT has been shown to be capable of measuring the inner properties of wood. For instance, studies of CT scanning of wood were described by Taylor et al. (1984), Funt and Bryan (1987), and Lindgren (1991), showing that the method can be used for accurate and nondestructive measurements of wood density. In addition, the use of a mobile CT apparatus made it possible to detect the water distribution in stems of living trees (Habermehl et al., 1986, 1990). The main advantage of this mobile method is that changes in the water distribution within a single tree may be monitored over periods of days, months, or years. However, the spatial resolution is low and does not effectively allow measurements of the water relations in individual annual rings.
In this study, a new technique is presented that permits the mapping of water concentrations in a whole stem as well as in individual annual rings with a spatial resolution of 0.1225 mm3. This has become possible because the same disc is scanned under field-fresh and dry conditions, respectively, so that the density differences can be calculated from image subtraction with data values reflecting the absorption coefficients of water without any cell material. Thus, our method leads to the direct determination of the water concentrations in stems up to a maximum diameter of 48 cm (according to the 50-cm diameter of the measuring field). The technique was used to investigate water relations within whole spruce and oak trees from bottom to top as well as the horizontal change in water concentration from the pith to the youngest tree ring and the differences between earlywood and latewood within single annual rings.
RESULTS AND DISCUSSION
Xylem Water Content of Whole Spruce and Oak Trees
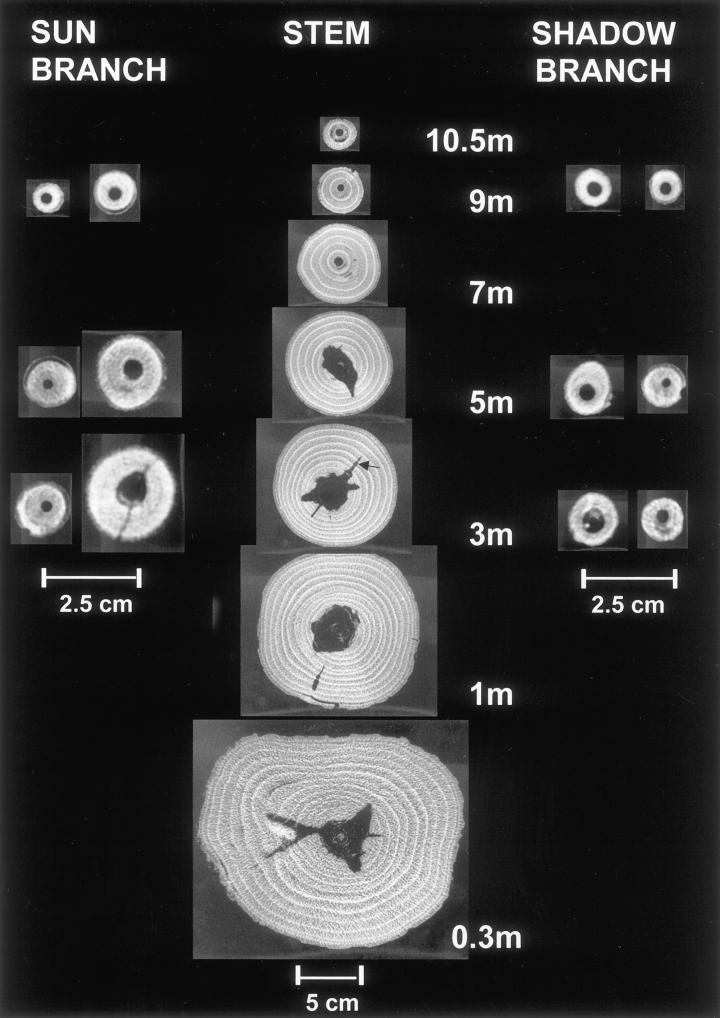
Figure 1 shows a typical example of cross-sectional CT images in the fresh state that reflect the distribution of heartwood and sapwood within the stem as well as within the sun and shadow branches of a 14-year-old spruce tree. The sun branches were generally thicker than the shadow branches due to better photosynthetic and wood growth conditions. From each twig, one disc was taken from the base and a second from the tip. All images, even those of the branch tip, show low-density regions in the center, indicating heartwood formation. In spruce, Pinus sylvestris, Pseudotsuga menziesii, and Quercus spp., the heartwood percentage often increased in direct proportion to the age of the tree (Dadswell and Hillis, 1962). However, in single spruce trees, we were not able to find a correlation between the age of the disc and the amount of heartwood, expressed as a percentage of disc diameter.
Figure 1.
CT images of the stem as well as sun and shadow branches of a 14-year-old spruce tree. Dark areas represent low Hounsfield Units (HU), whereas bright ones represent high HU values (width 938, center −79). All images show heartwood formation in the center, which has an irregular shape in the stem (arrow). The latewood of the annual rings appears bright, indicating a higher density.
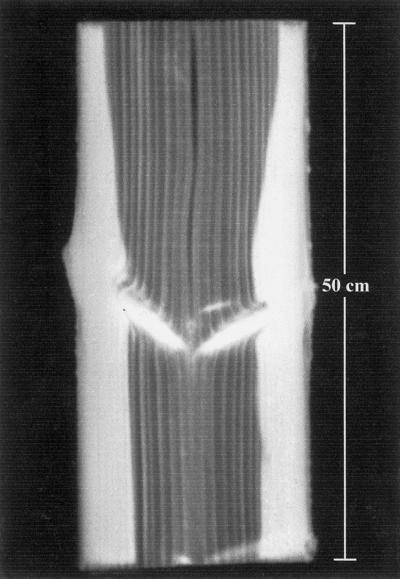
With regard to the shape of the heartwood, Figure 1 shows relatively notched forms in the first 5 m of the stem, which change to more or less perfect concentric form toward the top. In this study, heartwood is defined on the basis of xylem function and water content but not of conductivity. We were able to distinguish between broad heartwood notches and slender, tapered ones that penetrate into the sapwood (Fig. 1, arrow). To check whether the latter are caused by branch whorls, we took a 50-cm-long segment from the stem with a whorl in the middle and scanned it longitudinally through the plane of two branches, one on the left-hand side and the other on the right-hand side. Figure 2 clearly indicates the scanned branches that appear bright, according to higher HU values, as compared with the dark-colored heartwood. It is notable that the heartwood is enlarged above both branches, indicating that water transfer takes place from the sapwood of the stem into branches. This assumption is supported by the observation that the spreading of heartwood occurs only transiently above branches.
Figure 2.
Radial, longitudinal CT image of a 50-cm-long stem segment with branches in the middle, which appear bright in contrast to the dark heartwood. The latter is enlarged above both branches, indicating a water transfer into the branches.
On the other hand, we studied the formation of the broad heartwood notches that are not correlated to the occurrence of branches. When a completely circular heartwood core is assigned a value of 1, shapes with increasing irregularity may be characterized by values of >1. Using such a classification system, we investigated the heartwood forms of various stem heights from 20 trees (mean height 22 m and mean diameter 23 cm at a height of 1.3 m) of the same area and found that the most notched cores of almost all trees were positioned at the bottom of the stem as well as at a height of 13 and 17 m. This correlation indicates that some external effect could have caused the notched heartwood at a height of 13 and 17 m. It remains to be checked whether these irregular shapes were caused by climatic changes that may have caused water stress or forest operations, like thinning.
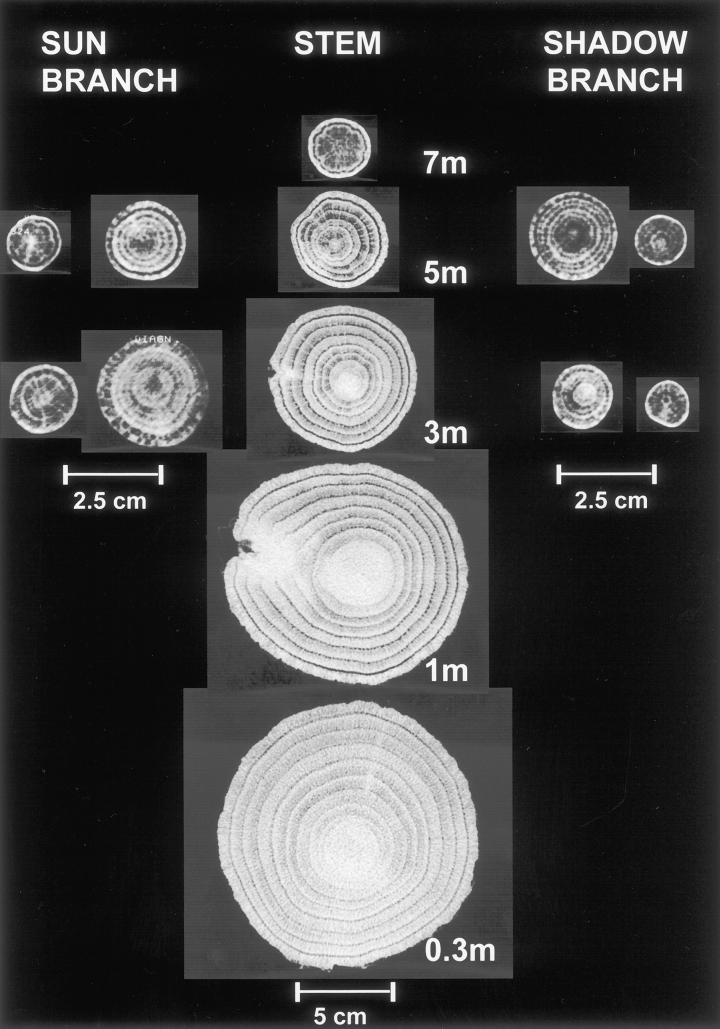
In contrast to spruce, tomographs from oak tree sections show a completely different density pattern. CT images from the stem of a 12-year-old oak tree have bright heartwood, indicating a higher density (Fig. 3). Furthermore, the annual rings of the sapwood reflect significant differences between earlywood and latewood, with the lower density of the earlywood showing as dark rings. In contrast to spruce, the branches have not developed heartwood so far, neither at the base nor at the top.
Figure 3.
CT images of the stem as well as sun and shadow branches of a 12-year-old oak tree. Bright heartwood of the 0.3-, 1-, and 3-m level indicates the formation of heartwood substances, whereas the sapwood rings show significant density differences between earlywood (dark) and latewood (bright). Width 2,024, center 11.
Xylem Water Content and Wood Density of Cross- Sections at the 1.3-m Level
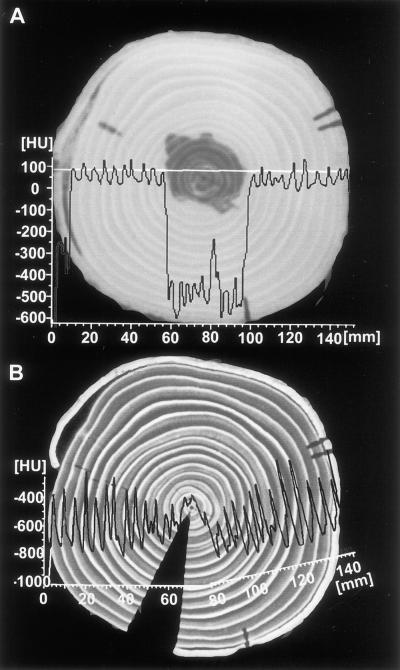
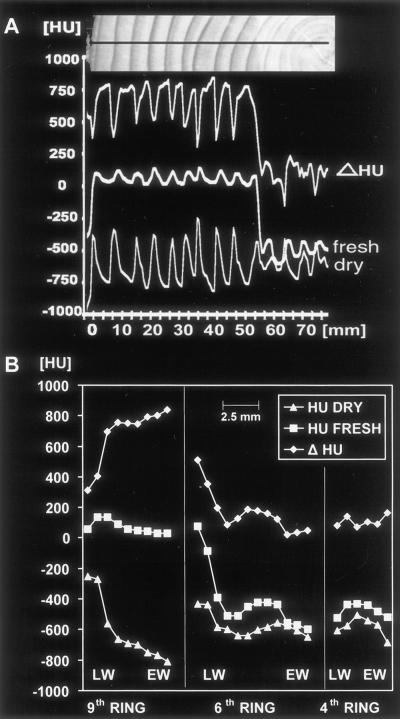
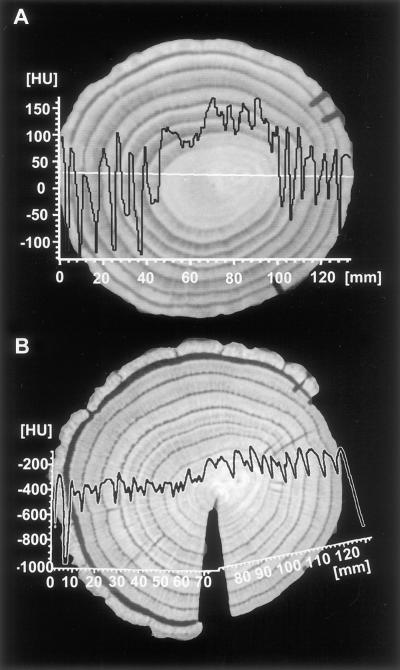
Figure 4A shows the image of a fresh spruce disc as well as a density profile with HU values between 0 and 150 (high density) in the sapwood and HU values between −250 and −600 (low density) in the heartwood. After drying, a second image was taken at the same location together with a density profile (Fig. 4B). The disc shrank and split, causing the profile to fold upward slightly at the pith. The high density of the bright latewood (−400) provides a contrast to the dark earlywood (−800) in each annual ring. To calculate the content of water to bulkwood density, the difference was established between the profiles taken from the fresh and dried disc. This curve (HU difference [Δ HU], Fig. 5A) shows maxima in the earlywood (wet) and minima in the latewood (dry) of the sapwood rings, which correspond with wet and dry portions of the wood. As already shown by the curve from the fresh disc (fresh, Fig. 5A), the water content (Δ HU) decreases strongly in the heartwood, showing an irregular distribution not correlated to earlywood. A more detailed description of the density and water distribution within single annual rings is given in Figure 5B. The curves on the left (ninth ring) show a typical example of the water and density relation in the coniferous sapwood ring. Although the water content decreases strongly from earlywood to latewood (Δ HU), the density increases from earlywood to latewood (HU dry). These results confirm early data documented by Knigge and Schulz (1966). In the intermediary zone, the sixth ring shows the change from sapwood to heartwood, expressed by a dramatic decrease in water (Δ HU), remaining relatively stable in the center (fourth ring). In comparison, the density curves (HU dry) of the inner rings (sixth and fourth) also do not vary considerably between earlywood and latewood. This might be due to juvenile wood with a lower density than adult wood.
Figure 4.
Transverse sections of spruce taken at the 1.3-m level. A, Fresh state (width 2,636, center −293); B, after oven drying (width 1,190, center −581) to achieve an image without water of the same disc. Density profiles were measured across the discs showing reduced densities in the heartwood of the fresh state (A) and earlywood-latewood differences within each growing ring (B).
Figure 5.
Density and water profiles from growth rings of spruce. A, From the cambium to the second ring of the spruce images shown in Figure 4. To calculate the pure water content of the xylem, the Δ HU was established between the profiles taken from the fresh and the dried disc. All three profiles correspond to the black line of the optical image (photograph above) taken from the surface of the disc. Water content (Δ HU) shows maxima in the earlywood and minima in the latewood of the sapwood rings and thus corresponds inversely to the profile of the dried state (dry). B, Density (HU DRY) and water (Δ HU) profiles of three different growth rings. The curves on the left (ninth ring) show a strong reduction of water content (Δ HU) from earlywood (EW) to latewood (LW) but an increase in density (HU DRY). The sixth ring shows the change from sapwood to heartwood at the intermediary zone with a strong decrease in water content, whereas the fourth ring in the heartwood shows relatively low water and density values.
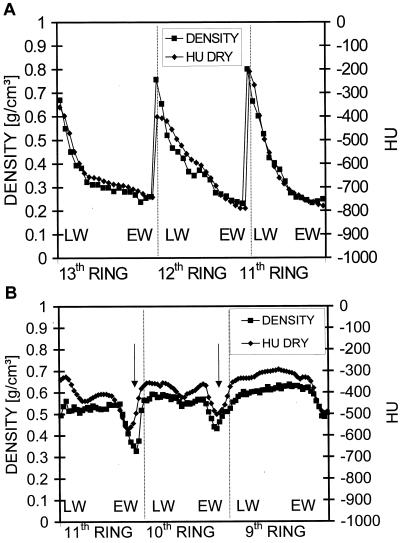
The data obtained by tomography were compared with those from the traditional gravitometric-volumetric method. Therefore, a 5-mm-thick part of the dried disc taken from the identical CT scan position was cut into slices of approximately 100 μm thickness using a microtome. The density of these slices was then determined by measuring their volume (each spatial dimension is determined with an accuracy of 3 μm) and weight (with an accuracy of 10 μg). Figure 6A shows the correlation between the HU profile and the density profile obtained by the gravitometric-volumetric method (R2 = 0.89, n = 50). The close correlation between both profiles confirms that CT imaging provides a useful technique to map density profiles of wood with subannual ring resolution. The profiles represent three outer annual rings with peaks corresponding to regions of latewood (vertical lines mirror ring boundaries). Furthermore, another disc was cut directly beneath the scanned disc and the moisture content was determined gravimetrically by cutting 500-μm-thick slices from the cambium to the pith. The spruce heartwood and sapwood contained 50% and 180% moisture (u), respectively (data not shown). u is defined as: u[%] = [(fresh weight probe − dry weight probe)/dry weight probe] × 100.
Figure 6.
Correlation between density profiles obtained with the traditional gravitometric-volumetric method and density profiles (HU DRY) extracted from the CT images. A, The curves represent the three outer rings of spruce with peaks corresponding to regions of latewood (LW). B, Density profiles of oak. Arrows indicate density mimima caused by wide luminous vessels. Vertical lines indicate ring boundaries. EW, Earlywood.
When the CT image of an oak sample from 1.3-m height is compared with one of spruce, significant differences in water and density distribution appear. Figure 7A shows the HU profile of the fresh disc taken at the white line across the stem. The HU values of the sapwood vary in between +100 (latewood) and −100 (earlywood), a value which is lower than that of the spruce earlywood (0 HU). This difference is caused by the wide luminous vessels in oak sapwood. However, in the oak heartwood region, we measured HU values of up to +150, whereas spruce heartwood revealed −200 to −600 HU (Fig. 4A).
Figure 7.
Transverse CT images of oak taken at the 1.3-m level. A, Fresh state (width 1,458, center −271) and B, after oven drying at 103°C (width 1,216, center −544). Density profiles taken at the white line show an increase in the heartwood region as well as strong variations within each growth ring of the sapwood.
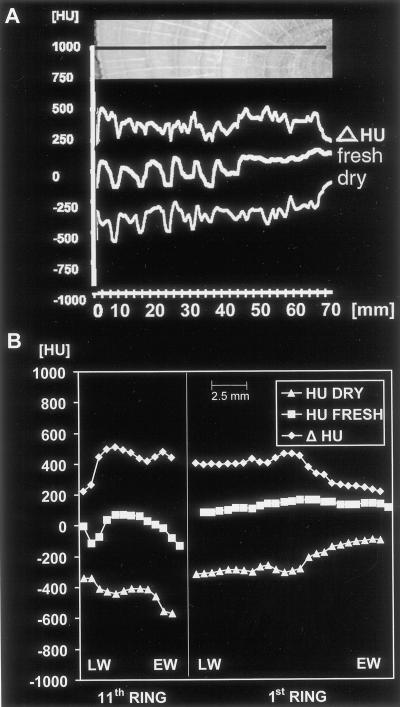
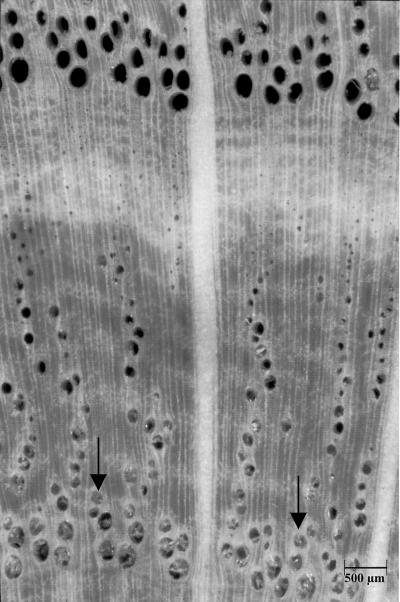
After drying the oak sample, the HU values along the identical profile dropped down to almost −200 (bright latewood) and −600 (dark earlywood Fig. 7B), respectively. These data are still higher than those for dry spruce (−400 to −800; Fig. 4B), indicating the higher density of the oak wood. Figure 8A shows that the dry HU values increase toward heartwood according to a higher concentration of organic substances in oak heartwood. Furthermore, the pure water content (Δ HU) remains relatively constant across all annual sapwood rings. This result is contradictory to statements from the literature that assume that only the outer rings transport water in ringporous species (C̆ermak et al., 1992; Ziegler, 1998). However, water content is a very poor correlate of conductivity because the vast majority of water is flowing in the large vessels, which have extremely high conductivity values while occupying a very small volume of wood tissue. C̆ermak et al. (1992), using a dye-injecting technique, found peak velocities of about 40 m h−1 in the latest growth ring of oak, decreasing to 0 at about 2 cm beneath the cambium. In the past, Huber and Schmid (1936) also measured very high water flow rates in the latest growth ring of oak. Velocity profile variability occurs because almost all large vessels gradually fail as conductive units either as a result of the development of tyloses as observed in earlywood vessels in the 1-year-old growth rings of oaks, or as a result of cavitation events and embolism during the melting of frozen water and desiccation in winter (Ikeda and Suzuki, 1987; Sperry and Tyree, 1988). We checked the occurrence of tyloses in the fresh scanned disc of oak and found all vessels of the seven outer rings open. Tyloses only appear in the water-reduced heartwood (Fig. 9, arrows). In the absence of functioning large vessels, water can only flow through auxiliary water conducting units, such as small latewood vessels (Zimmermann, 1964). Because we found similar high water contents and no tyloses in the outer seven rings of oak, future studies combining conventional tomography and imaging tracer experiments will show if some of the large earlywood vessels in oak remain conductive for several years or if they function as water storage in contrast to the transporting vessels of the latest growth ring. A typical example of the water and density pattern of an oak sapwood and heartwood ring is given in Figure 8B. The 11th ring, which was the second from the cambium, shows a density increase from early- to latewood (HU dry) and, in contrast, a corresponding decrease in water content (Δ HU). The earlywood vessels have high Δ HU values, indicating that they were not emptied by the collection procedure. The first ring of oak shows a significant density increase (HU dry) according to accumulated extractions and a decrease in water content (Δ HU, upper right curve). Thus, the density curve of oak heartwood is totally different from that of spruce, showing the bright heartwood in the CT image to be caused by the formation of organic matter rather than by water, which decreases in the first ring although being present in the other heartwood rings.
Figure 8.
Density and water profiles from growth rings of oak. A, From the cambium to the first ring of the images shown in Figure 7. All profiles correspond to the black line shown in the photograph above. Although water content (Δ HU) remains relatively stable throughout the whole profile, the density curve increases in the heartwood region (dry, right). Small deviations between the ring pattern of the photograph and the curves are caused by 2-cm height difference between the detected profiles (in the middle of the disc) and the optical image (at the surface). B, Density (HU DRY) and water profiles of a sapwood (11th) and heartwood (first) ring. In the sapwood, water content (Δ HU) decreases in the latewood (LW), whereas wood density (HU DRY) increases. In contrast, in the earlywood (EW) of the first ring density increases and water content decreases (right).
Figure 9.
Micrograph of a cross section from the fresh scanned disc of oak (Fig. 7A) which shows tyloses only in the heartwood (arrows). The sapwood is localized above.
CT and gravitometric-volumetric data of oak are significantly correlated (Fig. 6B, R2 = 0.71, n = 99). Minimum density and HU values occur in the earlywood (arrows). The systematic difference between the HU and gravitometric data is caused by the sampling procedure for the gravitometric measurement. Because totally dry wood cannot be cut into slices the wood had to be remoistured, i.e. we did not take the oven-dry but room density, defined as oven-dry weight per wet volume. Therefore, it is lower than the oven-dry density (oven-dry weight per oven-dry volume, Knigge and Schulz, 1966) and HU dry. When the moisture was measured gravimetrically in a second oak disc cut behind the measured one, a mean content of 75% was found in the heartwood and the sapwood.
To summarize, density images of tree trunks from x-ray CT are a sensitive indicator of both wood density and water state of conductive xylem. Radial water and density profiles in oak differ substantially from those in spruce, which clearly show density and water peaks in each annual ring and a strong reduction of water content in the heartwood. In contrast, the decrease of water in the heartwood of oak is three orders lower than in spruce. However, the density increases by 100% according to the formation of heartwood substances. With regard to the water content of the oak sapwood, we could not measure significant differences between the various sapwood rings of oak.
MATERIALS AND METHODS
Plant Material
Twenty spruce (Picea abies L. KARST.) and oak (Quercus robur) trees growing at the research plot close to Munich were studied. The typical examples presented here were 12 (oak) and 14 (spruce) years old with diameters at breast height of 14 and 13 cm. The site in Munich is a fresh, sandy loam, and the climate is characterized by a high total annual precipitation (1,009 mm) and a mean annual temperature of about 9.2°C. All branch and stem discs were 5 cm thick and cut on a warm afternoon on June 1, 1999. They were taken from various tree heights, deep frozen immediately in dry ice, and transported to the laboratory in a frozen state. Cross sections taken at the 1.3-m level were first scanned in the fresh state and subsequently after oven drying at 103°C to achieve images without water. CT images were made of the same disc in fresh and dried condition and, moreover, a density profile was measured across the disc.
X-Ray CT
To achieve high resolution density images from tree sections, x-ray CT was used. Its physical principle relies on the absorption of high energetic photons while passing an absorbing material, like wood in our case. Because the typical photon energy applied in medical scanners is within the range of 25 to 150 keV, the main process is photoelectric absorption (Knoll 1989). The degree of ab-sorption being described by the attenuation law gives the number of transmitted photons I in terms of initial ones (I0) depending from the mass attenuation coefficient (μ/ρ), the thickness of the material (t), and its density (ρ):
 |
1 |
Because the attenuation coefficient μ strongly depends on the emitted x-ray energy spectra (the latter being controlled by the voltage, current, and charge of the x-ray tubes), absolute coefficients obtained by different scanners or even the same scanner with different x-ray tubes cannot be compared. Thus, they are normalized against distilled water as an internal standard according to:
 |
2 |
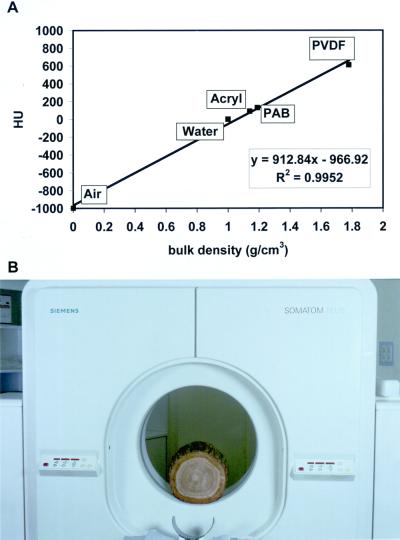
This relative attenuation coefficient is called Hounsfield Unit (HU) and correlates strictly with bulk density as shown in Figure 10A. HU = 0 stands for the density of water (1.0 g/cm3) and HU = −1,000 for air, whereas HU values in the positive range represent materials with a bulk density above 1.0 g/cm3. For demonstrating this linear correlation, three plastic bodies used as standard materials were scanned (PAB, density 1.14 g/cm3; acryl, density 1.19 g/cm3; and polyvinylidene difluoride, density 1.78 g/cm3). According to Siemens, the manufactor of the clinical SOMATOM PLUS x-ray computer tomograph we used in our study (Fig. 10B), the sd for a homogeneous material like a waterfilled phantom is ±3 HU.
Figure 10.
X-ray CT. A, Linear correlation between the mass attenuation coefficient and bulk density. B, Measuring arrangement of the Siemens (Munich) SOMATOM PLUS x-ray computer tomograph used in this study.
The highest physical resolution in the CT images under the scanning parameters chosen (Table I) is 0.1225 mm2 (pixel size: 0.35 × 0.35 mm). The HU value for such a pixel represents a voxel volume of 0.1225 mm3 (1-mm scan thickness). Thus, the corresponding HU values represent a mean density for each voxel. In addition to the high spatial resolution of the CT scanner, its measurement is also very sensitive to density changes. If the whole range of HU values (n = 4096, density range: 0–3.1 g/cm3) is used for image processing, the HU values are transferred into 256 gray values, i.e. a density resolution of 16 HU for each gray value. This is equal to 0.016-g/cm3 density intervals. Although this sensitivity is high, it can be increased to 0.001 g/cm3 if the density range of interest is restricted to 0.256 g/cm3 or 256 HU. This is a considerable improvement compared with conventional methods. Another outstanding advantage of CT is its extremely short measuring time of 2 s for a whole timber section and that no sample preparation is required. In addition, it is nondestructive and leaves the sample intact for further investigations as carried out in this study.
Table I.
Scanning parameters for the SOMATOM PLUS scanner
| Units | Scanning Parameter |
|---|---|
| Mode | “Mode Tomo” |
| Program | “Child head” |
| Voltage | 120 kV |
| Current | 210 mA |
| Scanning line | 2 s |
| Scan thickness | 1 mm |
| Pixel size | 0.1225 mm2 |
| Voxel size | 0.1225 mm3 |
As mentioned above, the density information of the HU values is transferred into 256 gray values for the CT images, which leads to dark colors for areas of low density and brighter colors with increasing density. To pronounce a certain density range of interest in the images, it is possible to adjust the gray scale by width and center for the HU values. For example, if HU values between −500 and +500 are of interest, a width of 1,000 HU and a center of 0 HU is chosen that leads to black color for all HU values <−500 and white color for all HU values > +500. Within the range, the 1,000 HU values are transferred into the remaining 254 gray values. This enables the operator to achieve an optimum of structural information in the image according to the density distribution of the object. Therefore, a direct visual comparison of CT images is only possible if the width and the center values of the images are the same. For data processing purposes, e.g. the calculation of the water content and distribution in the wood, the HU data matrices of a fresh and successively dried wood scan are subtracted from each other.
Our scanner was equipped with a SOMARIS software, which offers several software features to optimize the scanning parameters with respect to material, resolution, speed, and scan thickness (for detailed information, refer to Alexander et al., 1985; Krestel, 1988; Knoll, 1989; Matthies, 1996). The software also includes an automatic correction for beam-hardening effects in a certain density range around 1.0 g/cm3. Table I gives the parameters selected for the scans.
ACKNOWLEDGMENTS
The technical work of Mrs. Monika Rinas, Mr. Olaf Strehl, and Mr. Ralf Rosin is greatly appreciated.
Footnotes
This work was supported by the Deutsche Forschungsgemeinschaft.
Article, publication date, and citation information can be found at www.plantphysiol.org/cgi/doi/10.1104/pp.010194.
LITERATURE CITED
- Alexander J, Kalender W, Linke G. Computertomographie: Bewertungsmerkmale, Geraetetechnik, Anwendungen. Berlin: Siemens AG; 1985. pp. 1–179. [Google Scholar]
- C̆ermak J, Cienciala E, Kučera J, Hällgren JE. Radial velocity profiles of water flow in trunks of Norway spruce and oak and the response of spruce to severing. Tree Physiol. 1992;10:367–380. doi: 10.1093/treephys/10.4.367. [DOI] [PubMed] [Google Scholar]
- Dadswell HE, Hillis WE. Wood. In: Hillis WE, editor. Wood Extractives. London: Academic Press; 1962. pp. 3–55. [Google Scholar]
- Funt BV, Bryan EC. Detection of internal log defects by automatic interpretation of computer tomography images. Forest Products J. 1987;37:56–62. [Google Scholar]
- Habermehl A, Hüttermann A, Lovas G, Ridder HW. Computer-Tomographie von Bäumen: biologie in unserer Zeit, 20 Jahrg. 1990. 4: 193–200. [Google Scholar]
- Habermehl A, Pramann FW, Ridder HW. Untersuchung von Alleebäumen mit einem neuen Computer-Tomograghie-Gerät. Neue Landschaft. 1986;31:806–812. [Google Scholar]
- Hartig T. Über Aufsaugung gefärbter Flüssigkeiten durch Steckreiser und belaubte Triebe. Bot Z. 1855;11:617–620. [Google Scholar]
- Hounsfield G. Computed medical imaging. Science. 1980;210:22–28. doi: 10.1126/science.6997993. [DOI] [PubMed] [Google Scholar]
- Huber B, Schmid E. Weitere thermoelektrische Untersuchungen über den Transpirationsstrom der Bäume. Tharandt Forstliche Jahrbücher. 1936;87:369–412. [Google Scholar]
- Ikeda T, Suzuki T. Radial variation in the RS-1 in the SPAC of several tree species. J Fac Agric Kyushu Univ. 1987;32:1–7. [Google Scholar]
- Knigge W, Schulz H. Physikalische Eigenschaften des Holzes. In: Knigge W, Schulz H, editors. Grundriss der Forstbenutzung. Hamburg, Germany: Paul Parey; 1966. pp. 130–137. [Google Scholar]
- Knoll GF. Radiation interactions: counting statistics and error prediction. In: Knoll GF, editor. Radiation Detection and Measurement. J. New York: Wiley and Sons; 1989. pp. 30–102. [Google Scholar]
- Krestel E. Bildgebende Systeme fuer die Medizinische Diagnostik. Berlin: Siemens AG; 1988. [Google Scholar]
- Lindgren LO. Medical CAT-scanning: x-ray absorption coefficients, CT-numbers and their relation to wood density. Wood Sci Technol. 1991;25:341–349. [Google Scholar]
- Mac Dougal DT. Reversible variation in volume, pressure and movements of sap in trees. Carnegie Institution of Washington, 365. 1925. p. 90. [Google Scholar]
- Matthies D. Neuartige Verfahren zur Bestimmung der Gasleitfaehigkeit von porösen Materialien, insbesondere von Boeden. Forstliche Forschungberichte Muenchen. 1996;157:1–231. [Google Scholar]
- Sperry JS, Tyree MT. Mechanism of water stress-induced xylem embolism. Plant Physiol. 1988;88:581–587. doi: 10.1104/pp.88.3.581. [DOI] [PMC free article] [PubMed] [Google Scholar]
- Taylor FW, Wagner FG, McMillin CW, Morgan IL, Hopkins FF. Locating knots by industrial tomography-A feasibility study. Forest Products J. 1984;34:42–46. [Google Scholar]
- Ziegler H. Die Leitung des Wassers. In: Sitte P, Ziegler H, Ehrendorfer F, Bresinsky A, editors. Strasburger, Lehrbuch der Botanik. Stuttgart, Germany: Gustav Fischer; 1998. pp. 311–316. [Google Scholar]
- Zimmermann MH. Effect of low temperature on ascent of sap in trees. Plant Physiol. 1964;39:568–578. doi: 10.1104/pp.39.4.568. [DOI] [PMC free article] [PubMed] [Google Scholar]


