Abstract
fw2.2 is a quantitative trait locus responsible for approximately 30% of the difference in fruit size between large, domesticated tomatoes (Lycopersicon esculentum Mill.) and their small-fruited wild relatives. The gene underlying this quantitative trait locus was cloned recently and shown to be associated with altered cell division in ovaries (Frary et al., 2000). However, it was not known whether the change in fruit size is associated with other changes in plant morphology or overall fruit yield—changes that could potentially cause the fruit weight phenotype. To shed light on this issue, a detailed comparison was made between nearly isogenic lines differing for alleles at this locus to search for pleiotropic effects associated with fw2.2. Field observations show that although the small-fruited nearly isogenic line produced smaller ovaries and fruit as expected, this was compensated by a larger number of fruit—due mainly to a significantly greater number of inflorescences—but with no net change in total fruit mass yield. This strongly suggests that fw2.2 may have a pleiotropic effect on how the plant distributes photosynthate among fruit. In a flower removal experiment to control for differences in inflorescence size and number, fruit size remained significantly different between the nearly isogenic lines. These observations indicate that the primary effect of fw2.2 is in controlling ovary and fruit size, and that other associated phenotypic effects are secondary.
Fruit size in the domesticated tomato (Lycopersicon esculentum Mill.), measured as either weight or diameter, is conditioned both by fruit size-determining genes as well as environmental factors. Many of the environmental effects relate to competition for photosynthate within a plant. For example, an increase in the total number of flowers has been shown to increase competition for photosynthate and thus decrease fruit size (van Ravestijn and Molhoek, 1978). This size reduction effect can be the result of both competition between inflorescences (Fisher, 1977) or among fruit on a single inflorescence (Veliath and Ferguson, 1972). Further, the latter study demonstrated that premature fruit drop can result in an increase in the size of neighboring fruits. Because the number of developing fruit on a plant changes over the course of a season, even timing of floral development can alter ultimate fruit size (Slack and Calvert, 1977). Thus genes that change plant morphology, inducing changes in infloresence number or distribution, could alter the local competition for photosynthate among fruit, and hence have a significant impact on the size of fruit at maturity.
Little is known about the molecular or physiological properties controlled by fruit size-determining genes. This is due largely to the fact that fruit size is a complex trait, controlled by a number of genes, or quantitative trait loci (QTLs). A recent report has demonstrated the cloning of fw2.2, a QTL gene accounting for a major difference in fruit weight and diameter between the domesticated tomato and its wild relatives in the genus (Frary et al., 2000). Allelic differences at fw2.2 increase fruit weight by approximately 30%, and the small fruit alleles are semidominant to the large fruit allele. fw2.2 is associated with a modulation of the size of pre-anthesis ovaries. However, the actual mechanism by which fw2.2 controls ultimate fruit weight and diameter is not clearly understood. In particular, it is not known whether the observed fruit size phenotypes are the direct effect of fw2.2 on ovaries and developing fruit, or whether the change in fruit size is a pleiotropic effect of some other as yet unobserved effect of fw2.2 elsewhere in the plant.
The current research addresses two questions: (a) are allelic differences at the fw2.2 QTL associated with any other phenotypic changes which could affect fruit size indirectly, and if so, (b) what inferences can be made about the direction of causality—that is, which comes first, the change in fruit size or the change in other parts of the plant leading to changes in fruit size? To address these questions, we have conducted two sets of experiments. First, two nearly isogenic lines (NILs) differing for small and large alleles at fw2.2 were compared for variety of phenotypic and developmental traits. The plants were grown in replicate in the field in 1998 and 1999, and fruit weight, plant weight, total fruit yield, and a variety of other morphological characters such as inflorescence size, number, and distribution were quantified. In addition, a fruit developmental plot was generated, quantifying both the rate and magnitude of fruit size increase in the NILs. Second, to test whether fruit weight effects might be due to changes in other parts of the plant via photosynthate partitioning, a flower removal experiment was conducted to control for differences in inflorescence size and number observed in the first set of experiments. The results from these experiments, together with previously published results, are used to develop a model of the mechanism by which fw2.2 exercises control over fruit size.
RESULTS
Field Trials
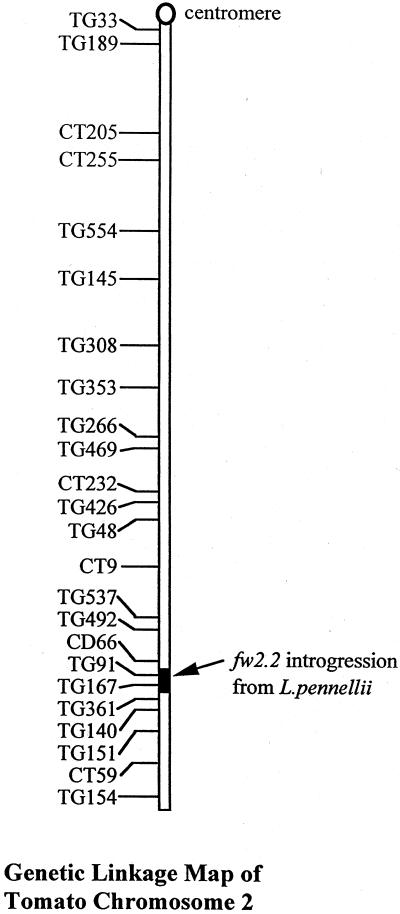
A pair of NILs differing for small and large fruit alleles at the fw2.2 locus were used for all of the experiments in this study. The former line contains an introgression at the fw2.2 locus from Lycopersicon pennellii, a small-fruited wild relative of the domesticated tomato. The location of this introgressed region on chromosome 2 is shown in Figure 1. For clarity in later discussions, the following nomenclature will be adopted: “fw2.2” refers to the segment of tomato chromosome 2 differing between the two isolines, and is used in the sense of a “locus” name. “fw2.2Lp” and “fw2.2Le” refer to the introgressed region from L. pennellii and its “wild-type” counterpart from the domesticated tomato parent, respectively, to connote “alleles” of the QTL. In addition, it should be noted that the phenotype descriptors “large” and “small” are applied to both fruit weight and fruit length and diameter measurements, depending on the context.
Figure 1.
Tomato chromosome 2, showing the fw2.2 introgression from L. pennellii (shaded black) carried by the small-fruited line, TA1144. TA1143, the large-fruited parent of TA1144, is identical to TA1144 except at this introgression.
Table I summarizes the harvest data for both 1998 and 1999 field trials, including individual fruit weight, total red and green fruit yield (weight and no.), and plant weight. The most striking difference between years was in the overall vigor of the plants: 1998 plants were smaller and lower yielding, and the variation among plants was much greater. Nonetheless, several key differences between the NILs were consistent between years. As observed in previous studies (Frary et al., 2000), individual fruit from fw2.2Le plants were significantly heavier than fw2.2Lp fruit: 15% greater in 1998, and 39% greater in 1999. The NILs also differed significantly in the total number of fruit (red, green, and total) at harvest (Table I). fw2.2Le plants yielded fewer fruit per plant than did fw2.2Lp. Despite the differences in fruit weight and number, the NILs did not differ significantly in plant weight (fresh weight of the above-ground plant at harvest), total fruit yield, or harvest index (fruit yield divided by plant weight). Thus, although plants with the domesticated tomato allele set larger fruit, they set a proportionately smaller number of fruit, resulting in indistinguishable fruit yield and harvest index.
Table I.
Summary of harvest data from 1998 and 1999 field trials
| Mean | 1998a
|
1999b
|
||||
|---|---|---|---|---|---|---|
| fw2.2Le | fw2.2Lp | Pc | fw2.2Le | fw2.2Lp | Pc | |
| Fruit wt, gd | 64 | 56 | 0.007 | 67 | 48 | 0.0001 |
| Total fruit no. per plant | 87 | 108 | 0.03 | 222 | 285 | <0.0001 |
| Red | 62 | 78 | 0.05 | 159 | 207 | <0.0001 |
| Green | 25 | 30 | 0.14 | 63 | 79 | <0.0001 |
| Total fruit yield per plant, kg | 4.13 | 5.03 | 0.39 | 10.35 | 10.51 | 0.87 |
| Red | 3.76 | 4.49 | 0.32 | 9.21 | 8.93 | 0.57 |
| Green | 0.38 | 0.55 | 0.23 | 1.14 | 1.57 | 0.50 |
| Plant wt, kge | 0.67 | 0.72 | 0.34 | 1.54 | 1.71 | 0.26 |
| Harvest indexf | 6.21 | 6.90 | 0.21 | 6.71 | 6.16 | 0.60 |
The NIL carrying the small-fruit allele at fw2.2, fw2.2Lp, produces significantly smaller individual fruits and a significantly greater no. of fruits (both red and green) at harvest. The total mass of fruit yield at harvest is not different between the NILs.
Combines data from the 1998 field trial (10 pairs of plants) with negative controls from the flower removal experiment (five pairs of plants).
Data from the 1999 field trial (10 pairs of plants).
P values from paired Student's t tests for the difference of means between the two lines.
Mean wt of individual fruit in a 15-red-fruit sample.
Mean wt of above-ground vegetative biomass.
Total fruit yield divided by plant wt.
Inflorescence number and fruit set data measured in the 1999 season are summarized in Table II. The single most significant difference between the two NILs was the number of inflorescences per plant: fw2.2Lp produced 34% more inflorescences per plant than did fw2.2Le plants. In fact, there were no cases in which an fw2.2Lp plant had fewer inflorescences than an fw2.2Le plant. In addition, fw2.2Le inflorescences had a significantly larger number of “missing flowers,” a harvest time count of fruitless flower pedicels. However, the increase in missing flowers in fw2.2Le plants did not result in reduced fruit set per inflorescence. Red and green fruit set per inflorescence were not significantly different between the NILs (Table II). This seeming paradox could be explained if fw2.2Le plants produced a greater total number of flowers per inflorescence (FPI) on average (red and green fruit plus missing flowers) than fw2.2Lp plants. The data in Table II suggest this may be the case, but this difference is only marginally significant (P = 0.09).
Table II.
Summary of inflorescence and flower no. dataa
| Mean | fw2.2Le | fw2.2Lp | Pb |
|---|---|---|---|
| No. of inflorescences per plant | 51.63 | 69.25 | <0.0001 |
| No. of FPIc | 5.51 | 5.00 | 0.09 |
| Fruit set per inflorescenced | 3.71 | 3.87 | 0.32 |
| Red fruit per inflorescence | 2.45 | 2.59 | 0.34 |
| Green fruit per inflorescence | 1.27 | 1.27 | 0.95 |
| Missing flowers per inflorescencee | 1.80 | 1.13 | 0.002 |
The NIL carrying the small-fruit allele at fw2.2, fw2.2Lp, produced significantly more inflorescences per plant, fewer flowers per inflorescence, and fewer missing flowers per inflorescence.
Data from 10 pairs of plants in the 1999 field trial.
P value from paired Student's t test for the difference of means between the two lines.
The sum of nos. of red fruit, green fruit, and missing flowers.
The sum of the nos. of red and green fruit.
Pedicel visible on inflorescence, but having no attached flower or fruit.
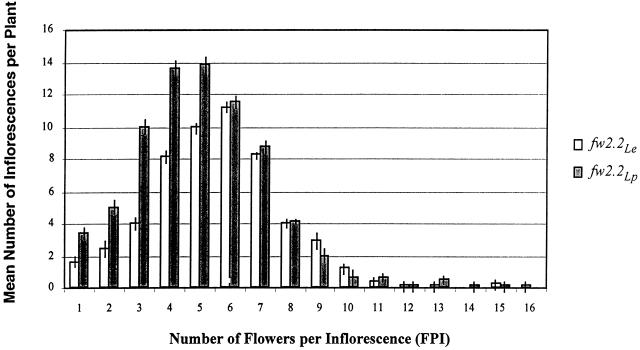
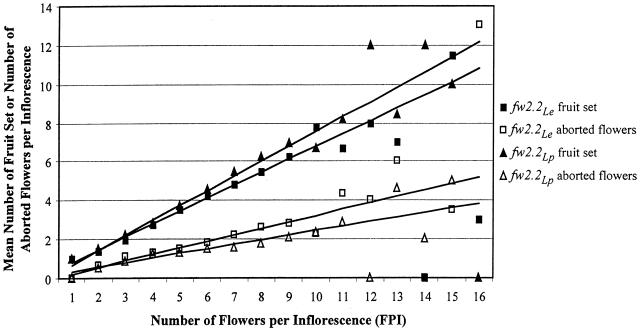
Figures 2 and 3 are used to further elucidate the relationship between the number of FPI and fruit set. Figure 2 depicts the relationship between FPI and mean number of inflorescences per plant. Although fw2.2Lp plants produced more total inflorescences than did fw2.2Le plants, they also produced a larger proportion of inflorescences with a small number of FPI. Thus, the greater total number of inflorescences on fw2.2Lp plants can be largely accounted for by the addition of inflorescences with a small number of flowers. Figure 3 plots the relationship between FPI and the number of fruit set (total red + green fruit) and number of aborted flowers for both genotypes. The regression line demonstrates that as FPI increases so does the average number of fruit set per inflorescence. However, the slopes of the regression lines suggest that fw2.2Le plants set fewer fruit per inflorescence than do fw2.2Lp plants. The difference between the genotypes with respect to fruit set per inflorescence is most pronounced for those inflorescences with more than six flowers—when grouped together in a Student's t test, inflorescences having seven or more flowers produced significantly fewer (P < 0.001) fruit on fw2.2Le plants than on fw2.2Lp plants. Thus, in most instances, fw2.2Le inflorescences set a lower proportion of fruit, with the effect being most pronounced on inflorescences with higher number of flowers (Fig. 3).
Figure 2.
Histogram of mean number of inflorescences per plant grouped by number of FPI. Columns represent a 10-plant mean with se bars. The distribution in FPI on fw2.2Lp plants is skewed to inflorescences with fewer flowers—fw2.2Lp plants have significantly more inflorescences with five or fewer flowers than fw2.2Le plants.
Figure 3.
Fruit set versus FPI. Points on the graph represent mean number of fruit set (squares) or missing flowers (triangles) from all inflorescences of a given size on 10 plants. “Fruit set” is the number of red and green fruit on an inflorescence at harvest time, and “missing flowers” is the number of pedicels on an inflorescence with the flower or fruit absent (fruit set + missing flowers = FPI). The lines on the graph are the regression lines of fruit set or missing flowers versus FPI. The regression lines suggest that for any given number of FPI, fw2.2Le plants set fewer fruit (and have more missing flowers) than fw2.2Lp plants.
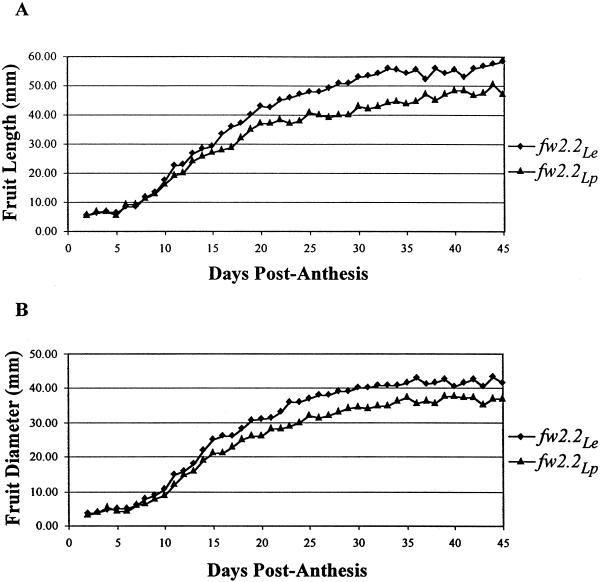
Plots depicting the rate of fruit weight change for the NILs during fruit development are presented in Figure 4. Both NILs yielded a sigmoidal curve typical of fruit development (Monselise et al., 1978). However, the fw2.2Le fruit were significantly larger than those of fw2.2Lp in both length (Fig. 4A) and diameter (Fig. 4B) beginning 10 and 8 d after anthesis, respectively. The fruit length/diameter ratio (overall mean = 1.30) was not significantly different between the NILs at any stage and stayed relatively constant throughout the season, indicating that fw2.2 has its primary effect on fruit size (data not shown). Despite the significant differences in fruit size, there was no observed difference in mean time from anthesis to breaker stage (fw2.2Le = 38 d, fw2.2Lp = 36 d, P = 0.60), suggesting that fw2.2Le plants have a greater volume-per-day filling rate than fw2.2Lp plants.
Figure 4.
Change in fruit size during fruit development. A, Fruit length. B, Fruit diameter. Data points are means of fruit developing on each of five inflorescences on 10 plants of each line. Student's t tests at each time point show that the means of fw2.2Le and fw2.2Lp fruit are first significantly different (P ≤ 0.01) in fruit length and diameter at 10 and 8 DPA, respectively.
Flower Removal Experiment
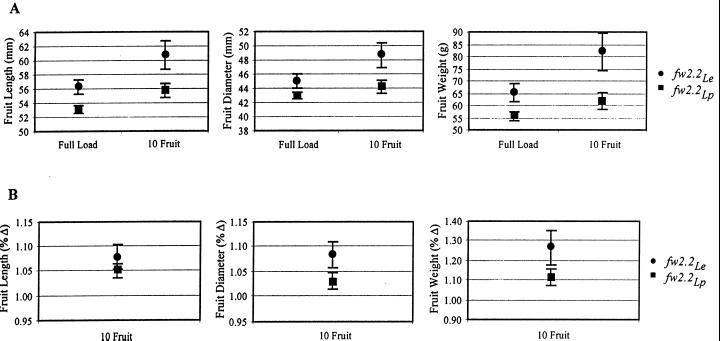
The flower removal experiment was conducted to compensate for potential effects of differences in fruit load between the NILs—the replicated pairs of plants were pruned to allow only 10 fruit to set on each plant. The three graphs of Figure 5A summarize fruit weight and size data. In each graph, the pair of points on the left represents means of fruit from unpruned control plants (10-fruit sample), and the pair of points on the right are means of fruit from the plants having all but 10 flowers removed. For each set of four measurements, Student's t tests for the difference of means were performed both between plant lines (fw2.2Le versus fw2.2Lp) and between treatments (untouched controls versus flower pruned). The results show that fw2.2Lp plants produce smaller fruit in size and weight than do the fw2.2Le plants, both under full fruit load (controls) and on plants that were allowed to set only 10 fruit (Fig. 5A). Because pruned plants are less source limited, we conclude that fw2.2 modulates fruit size, not through a sink-source mechanism, but by directly controlling the size of developing fruit. This conclusion is strengthened by the observation that the increase in fruit size as a result of pruning was proportionately larger on fw2.2Le plants than on fw2.2Lp plants (Fig. 5B). If fw2.2 controlled fruit size indirectly by affecting source activities, then increasing the source to sink ratio (and hence the source supply per fruit) would have benefited fw2.2Lp plants more, allowing fw2.2Lp to approach fw2.2Le in fruit size.
Figure 5.
Differences in fruit size as a result of flower removal. A, Fruit length, diameter, and weight, as an average of 10 fruit from each of five plants. Points on the left of each graph are means of fruit from unpruned negative controls (“Full Load”), and points on the right are means of fruit from the plants allowed to set only 10 fruit per plant (“10 Fruit”). fw2.2Le and fw2.2Lp fruit are significantly different in all three measures and in both treatments. Further, fruit of both lines are larger on pruned plants than on unpruned plants for all measures (with the exception of the diameter of fw2.2Lp fruit). B, Data from Figure 5A, expressed as percent difference from the “Full Load” means. This measure is used to represent the magnitude of the increase in fruit size/weight as a result of the flower-removal treatment. This percent increase is statistically greater in both length and weight among fw2.2Le fruit than those of fw2.2Lp.
DISCUSSION
fw2.2 Controls Fruit Size Directly and Not Through a Sink-Source-Dependent Mechanism
The flower removal experiment provided a test of the hypothesis that differences between the NILs with respect to inflorescence number, FPI, or fruit set are the cause of the observed difference in fruit size. Previous experiments have demonstrated that pruning inflorescences from a tomato plant (Fisher, 1977) and/or reducing the fruit load on an inflorescence (Veliath and Ferguson, 1972) will lead to an increase in individual fruit size, presumably by increasing the source to sink ratio. If source-related mechanisms were responsible for the fw2.2 allelic difference, then the number of fruit to a common value should reduce (or remove entirely) the differences in fruit size between the two NILs because both would be much less source limited. However, equalizing the number of flowers and inflorescences on all plants did not reduce the difference in fruit size between the NILs. Further, although the fruit of both lines increased in size when the source to sink ratio was increased, the change in size of fw2.2Le fruit was proportionately larger than the increase in fw2.2Lp fruit (Fig. 5B). This observation strongly suggests that the critical determinate causing the difference in fruit size between fw2.2Le and fw2.2Lp is not a difference in the number of inflorescences per plant, nor is it an effect of fruit number per inflorescence. Rather, the fw2.2 fruit size phenotype appears to be caused by a property of the individual developing fruit, and other changes in the plants are likely to be secondary, sink-source-driven phenomenon.
fw2.2 Affects Intra-Inflorescence Competition
Data presented in Table II suggest that, although there is a slight difference between the NILs in average FPI, the increase in average FPI of fw2.2Le plants appears to be balanced by a smaller proportion of those fruit reaching maturity, so that there is no significant difference in mean fruit set per inflorescence. When fruit set per inflorescence is plotted against FPI (Fig. 3), the slope of regression line for fw2.2Lp plants is steeper than for fw2.2Lp plants: As the number of flowers on an inflorescence increases, a smaller percentage of those flowers will develop into mature fruit on fw2.2Le plants than on fw2.2Lp. This phenomenon is most likely the result of greater competition on fw2.2Le plants for photosynthate among fruits on the same inflorescence—competition that has been observed in tomato previously (Veliath and Ferguson, 1972). Because fw2.2Le fruit are significantly larger, it is not surprising that there is more competition for photosynthate on any given inflorescence than among fw2.2Lp fruit. Perhaps tomato plants are able to respond to a local photosynthate limitation by dropping a few developing fruits and allowing the remaining ones to fill fully, rather than partially filling a large number of fruit (and potentially decreasing seed dispersal and viability).
Increased intra-inflorescence competition is further supported by the observation that both large and small fruit take the same amount of time to develop (Fig. 4). In the current study, the first detectable difference in fruit size occurs 8 to 10 d after anthesis, corresponding roughly to the beginning of the cell expansion phase of fruit development (Monselise et al., 1978), but the fruit of both NILs reach breaker stage (when most cell expansion has stopped) after the same number of days. Because fw2.2Le fruit develop larger fruit in the same amount of time, this suggests that the rate of filling—the increase in the volume of photosynthate added to the fruit per day—is much higher in fw2.2Le, and therefore likely to intensify competition between fruit on an inflorescence. Most significantly, the striking observation that fw2.2Le fruit increase by a greater proportion than fw2.2Lp fruit when nearby flowers are removed (Fig. 5B) suggests the large fruit of fw2.2Le plants are more source limited by competition among fruit than the smaller fruit of fw2.2Lp plants.
fw2.2 Sink-Source Feedback Modulates Photosynthate Distribution via Inflorescence Number
The harvest time data from the two NILs strongly suggest that, as a result of changing fruit size, the fw2.2 QTL causes a change in photosynthate distribution, but that the total photosynthate allocated to fruit mass remains constant (Table I). In other words, the smaller size of individual fruits on fw2.2Lp is counterbalanced by the production of a proportionately larger number of total fruit, so that total fruit mass yield (and total plant weight) are identical between the NILs. Using surgical manipulations, Heuvelink and Buiskool (1995) noted a similar fruit size/fruit number compensation. The near-perfect balance between fruit weight (39% higher in fw2.2Le) and inflorescence number (34% higher in fw2.2Lp) demonstrates that this photosynthate redistribution effect of fw2.2 manifests itself mainly as a change in inflorescence number. Because fw2.2 appears to affect sink strength of individual fruits, other sink-source feedback mechanisms allow the plant to respond by redistributing the finite quantity of photosynthate.
A similar photosynthate redistribution effect has also been observed in potato (Solanum tuberosum) tubers. Using antisense suppression of a major tuber starch biosynthesis gene, Mueller et al. (1992) developed transgenic potatoes with abolition of starch production (and increased sugar content) in their tubers. As a result of the alteration in tuber carbohydrate composition, the dry weight of individual tubers was reduced, and the transgenic plants produced a vastly increased number of tubers both per plant and per stolon—an effect similar to the feedback effects observed our study. Unlike the present study, however, Mueller et al. observed a net increase in total tuber fresh weight, but this may be due merely to increased water content in tubers with higher concentrations of soluble sugars. D'Aoust et al. (1999) similarly noted that antisense suppression of a fruit-specific Suc synthase in tomato—mimicking a limitation in source strength—dramatically reduced fruit set.
fw2.2Lp plants have an increased number of inflorescences with a small number of flowers (Fig. 2). Previous studies in tomato (Murneek, 1926) have suggested that inflorescences produced earlier on the plant and closer to the primary stem generally have more flowers than later and more distal inflorescences. This is particularly true in plants carrying the self-pruning (sp) gene (Silvy, 1974), and both of the NILs used in this study carry this trait. The temporal spread of inflorescence may allow the fw2.2 effects on fruit growth to impact the growth of inflorescences that develop later. fw2.2Lp plants may initiate more inflorescences later in the season due to an increased source-to-sink ratio, resulting in the observed increase in inflorescences with fewer flowers.
CONCLUSIONS
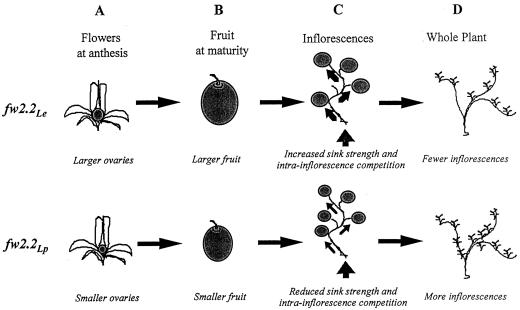
Based on the results of this study, as well as previous studies, we present a diagrammatic model for the role of fw2.2 in both fruit and whole plant anatomy/physiology (Fig. 6). Taken as a whole, the results from the current study indicate that fw2.2 acts directly on processes within developing fruit to control size and that the modulations in size associated with the fw2.2 locus are not the results of alterations in other organs or aspect(s) of the plant's anatomy/physiology. These results are thus consistent with the hypothesis that fw2.2 is a regulator of cell division in developing carpels/fruit (Frary et al., 2000). The research of Frary et al. (2000) suggests that the large allele of fw2.2 is associated with an increase in the number of cells in those tissues, but with no significant difference in cell size. It is not yet known if fw2.2 has any association with the supply of photosynthate to carpel cells, but presumably a larger number of cells would lead to a greater photosynthate demand in those tissues. On the other hand, direct causal links between sugar supply and induction of cell division have been observed in yeast (Saccharomyces cerevisiae; Gross et al., 1992) and Arabidopsis (DeVeylder et al., 1999). Given that the fw2.2 gene may encode a Ras-like G-protein (Frary et al., 2000), additional research may demonstrate a direct connection between sugar supply and ovary cell proliferation in tomatoes.
Figure 6.
Model of fw2.2 effects on fruit size and photosynthate redistribution. Plants carrying the large-fruit allele (fw2.2Le) are depicted on the top row of the illustration, and plants of the small-fruit allele (fw2.2Lp) are on the bottom. fw2.2 first affects ovary size in pre-anthesis flowers (A), determining mature fruit size (B). The larger fruit size on fw2.2Le plants increases intra-inflorescence competition, likelihood of flower abortion, and inflorescence sink size (C), which in turn may decrease the number of inflorescences produced on the plant (D).
The current study also shows that, as a consequence of controlling fruit size, fw2.2 modifies sink-source relationships at the whole plant level resulting in changes in inflorescence number, fruit number, and flower/fruit abortion rates. Fruit size has often been considered a major component of yield in tomatoes and other fruit-bearing plants; however, results from the current study demonstrate that this is not necessarily the case because fw2.2 does not affect total yield. While the small-fruited allele for fw2.2 produces smaller fruit, this is compensated by the production of more fruit. As a consequence, total fruit mass yield and harvest index are not altered as compared with the large-fruited NIL. Finally, this study suggests that fruit size does not serve as a developmental clock with respect to fruit development and ripening. While the small-fruited NILs produce fruit that are 30% smaller than large-fruited NILs, the length of time from anthesis to ripening is indistinguishable.
MATERIALS AND METHODS
Plant Materials
The two NILs used in this study were: (a) TA1144, a domesticated tomato (Lycopersicon esculentum [Mill.] cv M82 line) having a 0.8-cM Lycopersicon pennellii introgression containing the small-fruit allele at fw2.2 (generated as a subNIL of an L. pennellii IL population [Eshed and Zamir, 1995]), and (b) TA1143, the domesticated tomato cv M82 parent of TA1144, containing the large-fruited domesticated tomato allele at fw2.2.
1998 Field Trial
Twenty pairs of TA1143 and TA1144 plants were grown in a field in Ithaca, NY, during the summer season of 1998. Seedlings were transplanted to the field in a single row (3 feet between plants, 6 feet between adjacent rows), alternating TA1143 and TA1144 to facilitate paired Student's t test analysis. Plants were widely spaced to reduce competition between plants, allowing plant yield to be more dependent on the ability of an individual plant to produce a large number of fruit per plant. Ten pairs of these were chosen at random to be included in the 1998 flower removal experiment (see below). On each of the remaining 10 pairs of plants, the first five inflorescences were tagged, and every flower was hand-selfed at anthesis to ensure good fruit set. To quantify the rate of fruit development, the length and width of the ovaries/developing fruit from these flowers were measured with calipers every 2 to 3 d from anthesis until approximately 7 d after breaker stage. Tagged fruit were weighed individually at harvest. In addition, total red and green fruit yield (number of fruit and total fruit weight per plant), vegetative biomass, and weight of a 15-red-fruit sample were measured at harvest.
1998 Flower Removal Experiment
Of the 10 pairs of plants randomly selected from the 1998 observational trial for this experiment, five pairs, chosen at random, were designated as negative controls and left untouched, and the remaining five pairs were treated as follows. On the first 10 inflorescences of each plant, all flowers distal to the first flower on the inflorescence were removed, so that only one hand-selfed FPI was allowed to develop. All other inflorescences were removed shortly after appearance. The length, width, and weight of these fruit were measured at harvest for all fruit for both treated and untreated controls. Additional harvest measurements were also taken for all plants as described for the 1998 observational trial.
1999 Field Trial
The field trial was repeated with 10 pairs of TA1143 and TA1144 plants in the summer of 1999. Plants were transplanted to the field in a block design of five rows (6 feet apart) with two pairs of plants in each row (spaced 3 feet apart) alternating between the two NILs. Unlike the 1998 trial, these plants were allowed to set fruit without hand pollination in order to minimize human-induced alterations in fruit set and distribution. In addition to repeating the harvest time measurements listed above (1998 trial), these plants were measured at harvest for plant architecture traits to quantify inflorescence number and flower distribution, including total number of inflorescences per plant, number of red and green fruit set on each inflorescence, and number of missing fruit per inflorescence/FPI (pedicels visible but without an attached fruit or flower). The sum of the number of red and green fruit plus the number of missing flowers on each inflorescence was used as a measure of the total number of FPI. Note that these measurements were taken on all inflorescences having at least one green fruit at harvest, and not a random subsample.
ACKNOWLEDGMENTS
The authors wish to thank Tim Setter for his critical review of this manuscript, and gratefully acknowledge the contributions of Yuval Eshed, Dani Zamir, and Kevin Alpert in generating the NILs used in this manuscript.
Footnotes
This work was supported by the U.S. Department of Agriculture National Research Initiative Cooperative Grants Program (grant no. 97–35300–4384), by the National Science Foundation Plant Genome Program (grant no. DBI–9872617), and by the Binational Agricultural Research and Development Fund (grant no. US 2427–94).
Article, publication date, and citation information can be found at www.plantphysiol.org/cgi/doi/10.1104/pp.010087.
LITERATURE CITED
- D'Aoust M, Yelle S, Nguyen-Quoc B. Antisense inhibition of tomato fruit sucrose synthase decreases fruit setting and the sucrose unloading capacity of young fruit. Plant Cell. 1999;11:2407–2418. doi: 10.1105/tpc.11.12.2407. [DOI] [PMC free article] [PubMed] [Google Scholar]
- DeVeylder L, Engler J, Burssens S, Manevski A, Lescure B, VanMontagu M, Engler G, Inze D. A new D-type cyclin of Arabidopsis thaliana expressed during lateral root primordia formation. Planta. 1999;208:453–462. doi: 10.1007/s004250050582. [DOI] [PubMed] [Google Scholar]
- Eshed Y, Zamir D. An introgression line population of Lycopersicon pennellii in the cultivated tomato enables the identification and fine mapping of yield-associated QTL. Genetics. 1995;141:1147–1162. doi: 10.1093/genetics/141.3.1147. [DOI] [PMC free article] [PubMed] [Google Scholar]
- Fisher KJ. Competition effects between fruit trusses of the tomato plants. Sci Hortic. 1977;8:37–42. [Google Scholar]
- Frary A, Nesbitt TC, Frary A, Grandillo S, van der Knaap E, Cong B, Liu J, Meller J, Elber R, Alpert KA. fw2.2: a quantitative trait locus key to the evolution of tomato fruit size. Science. 2000;289:85–88. doi: 10.1126/science.289.5476.85. [DOI] [PubMed] [Google Scholar]
- Gross E, Goldberg D, Levitzki A. Phosphorylation of the S. cerevisiae Cdc25 in response to glucose results in dissociation from Ras. Nature. 1992;360:762–765. doi: 10.1038/360762a0. [DOI] [PubMed] [Google Scholar]
- Heuvelink E, Buiskool RPM. Influence of sink-source interaction of dry matter production in tomato. Ann Bot. 1995;75:381–389. [Google Scholar]
- Monselise SP, Varga A, Bruinsma J. Growth analysis of the tomato fruit, Lycopersicon esculentum Mill. Ann Bot. 1978;42:1245–1247. [Google Scholar]
- Mueller RB, Sonnewald U, Wilmitzer L. Inhibition of ADP-glucose pyrophosphorylase in transgenic potatoes leads to sugar-storing tubers and influences tuber formation and expression of tuber storage protein genes. EMBO J. 1992;11:1229–1238. doi: 10.1002/j.1460-2075.1992.tb05167.x. [DOI] [PMC free article] [PubMed] [Google Scholar]
- Murneek AE. Effects of correlation between vegetative and reproductive functions in the tomato (Lycopersicon esculentum Mill.) Plant Physiol. 1926;1:3–55. doi: 10.1104/pp.1.1.3. [DOI] [PMC free article] [PubMed] [Google Scholar]
- Silvy A. A study of modes of sympodal ramification in Lycopersicon esculentum and Lycopersicon pimpenellifolium. Can J Bot. 1974;52:2207–2218. [Google Scholar]
- Slack G, Calvert A. The effect of truss removal on the yield of early sown tomatoes. J Hortic Sci. 1977;52:309–315. [Google Scholar]
- van Ravestijn W, Molhoek WML. Annual Report, 1977. Naaldwijk, The Netherlands: Glasshouse Crops Research and Experiment Station; 1978. p. 41. [Google Scholar]
- Veliath JA, Ferguson AC. The effect of deblossoming on fruit size, yield, and earliness in tomato. J Hortic Sci. 1972;7:278–279. [Google Scholar]


