

Abstract
Background
Patients suffering coronary artery disease (CAD) with calcific aortic valve disease (CAVD) are facing worse prognosis with more complex operation strategies. As the primary stage of CAVD, it is helpful to confirm the risk factors of aortic valve calcification (AVC) in advance for exploring the secondary prevention as well as early intervention strategies of CAVD for CAD patients. Lipoprotein(a) [Lp(a)] has been confirmed as the risk factor of both CAD and CAVD. But whether Lp(a) level still affects the occurrence and development of CAVD in CAD patients has not been demonstrated yet.
Objective
We firstly investigate the predictive value of Lp(a) for new-onset AVC in patients with CAD.
Methods
Patients who were admitted to the Department of Cardiology, Zhujiang Hospital, Southern Medical University from March 2021 to December 2022 and diagnosed with CAD by elective coronary angiography(CAG)were included when met the criteria. Baseline data were collected through the electronic medical record system. Patients were followed up to repeat echocardiography with an interval at least 6 months, which was up to September 2023. The primary endpoint was new-onset AVC, according to which patients were divided into new-onset AVC group (n = 43) and the opposite(n = 165). Analyses were conducted using SPSS 26.0 and GraphPad Prism 10.1.2.
Results
A total of 208 patients with CAD were included, with a median follow-up time of 16 (12, 20) months. Compared with AVC-free group, patients with new-onset AVC had higher body mass index (BMI) (p = 0.003), higher proportion of tree-vessel disease(p < 0.001), higher rates of diabetes (p = 0.001) and atrial fibrillation (p = 0.017), higher Lp(a) levels(p < 0.001), lower left ventricular systolic function (LVEF) (p < 0.001) and thicker left ventricular posterior wall (LVPW) (p < 0.001). Increased BMI, three-vessel disease, Lp(a) > 26.65 nmol/L, increased LVPW were found independent risk factors for new-onset AVC. Using a cutoff level of 26.65 nmol/L, Lp(a) predicted new-onset AVC with a sensitivity of 79.1% and a specificity of 59.4% (AUC: 0.740, 95% CI: 0.657–0.823, p < 0.001). When combined with BMI, there present a higher AUC value of 0.752(95%CI: 0.668–0.836, p < 0.001); however, the statistical significance remains limited (p = 0.732).
Conclusion
High-level serum Lp(a) was independently associated with new-onset AVC in patients with CAD. Lp(a) demonstrates a significant predictive value for the onset of new AVC in CAD patients, with an established cut-off threshold of 26.65 nmol/L.
Keywords: Aortic valve calcification (AVC), [lp(a)]ipoprotein(a) [Lp(a)], Coronary artery disease (CAD), Calcific aortic valve disease (CAVD)
Introduction
As the population ages, the prevalence of non-rheumatic calcific aortic valve disease (CAVD) continues to rise, making it kind of urgent to figure out its pathogenesis as well as therapies. Data from a global multi-center study shows that the number has already reached 1,841 per 100,000 people over 70-year-old in 2017 [1]. However, valve replacement, including surgical aortic valve replacement(SAVR)and transcatheter aortic valve replacement (TAVR), is currently considered the only effective treatment, which conducted only for significant valve stenosis or impaired cardiac function. Despite the higher risk and longer recovery period for most elders, the approach does not reverse the disease progression additionally. Limited research suggests that there may be some similar risk factors of CAVD to coronary artery disease ༈ (CAD), and an increasing tendency of complex coronary lesions complicated with CAVD is found due to the growing medical awareness and improving detection methods [2–4]. Obviously, such patients are facing worse prognosis with more complex operation strategies. Identifying those patients with CAD combined with CAVD earlier is of great significance for risk stratification of cardiovascular events and systematic management of chronic diseases.
Aortic valve calcification (AVC) is the primary stage of CAVD, when the patient may have no obvious symptoms, but calcium deposition appears on the aortic valve, leading to valve thickening and hardening [5]. Calcific aortic valve stenosis (CAVS) then develops, causing chest pain, syncope, heart failure, and even sudden cardiac death. For CAD patients, it is helpful to confirm the risk factors of AVC in advance for exploring the secondary prevention as well as early intervention strategies of CAVD.
Lipoprotein(a) [Lp(a)] is known an independent cardiovascular risk factor which is largely determined by genetics and remains relatively stable between individuals [6, 7]. Studies have shown the significant association between Lp(a) and CAD. And Lp(a) seems to be the only causal factor that has been all confirmed by genome-wide association study, Mendelian randomization as well as epidemiologic and other related clinical studies among the limited researches on CAVD [7–9]. However, whether Lp(a) level still affects the occurrence and development of CAVD in CAD patients has not been demonstrated yet.
We firstly investigate the predictive value of Lp(a) for new-onset AVC in patients with CAD in order to provide insights for early identification, secondary prevention and risk stratification of patients suffered CAD combined with CAVD.
Methods
Study population and data collection
Patients who were admitted to the Department of Cardiology, Zhujiang Hospital, Southern Medical University from March 2021 to December 2022 and diagnosed with CAD by elective coronary angiography(CAG)were included when met the following criteria: 1) There shows no AVC in baseline echocardiography; 2) Over 18 years old, and voluntarily sign the informed consent. All patients were accepted dual antiplatelet and statins therapy before CAG. CAD was diagnosed according to the results of CAG, which defined as at least one of the three major coronary arteries has a stenosis ≥ 50%. Degree of lumen stenosis = [(diameter of reference lumen - diameter of stenosis lumen)/diameter of reference lumen] × 100% [10]. AVC was diagnosed through echocardiography performed by two trained echocardiologists, characterized by localized or diffuse thickening of the aortic valve with a thickness of ≥ 3 mm, exhibiting enhanced echogenicity, with or without reduced leaflet motion. It is noted that all echocardiographic assessments included in this study were conducted by the same two echocardiologists. We excluded conditions that may affect valve function or cause calcium deposition or confuse major laboratory results, including rheumatic cardiopathy, infective endocarditis, thyroid and parathyroid dysfunction, severe hepatic and renal insufficiency, malignancies, autoimmune disease, acute infectious diseases, etc. Patients who were lost during follow-up or lacked related data were also excluded from the analysis. The study protocol was reviewed and approved by the local ethics committee of Zhujiang Hospital of Southern Medical University and was conducted in accordance with the Declaration of Helsinki.
A total of 208 patients were included according to the criteria. Baseline data were collected through the electronic medical record system. Venous blood samples were obtained after fasting for more than 12 h. Echocardiography was performed by the same certified cardiac echocardiologist. CAG was performed by experienced interventional cardiologists. Each coronary artery was displayed in at least 2 different planes. The number of stenosis vessels was recorded.
Patients were followed up to repeat echocardiography with an interval at least 6 months, which was up to September 2023, with a median follow-up time of 16 (12,20) months. The medication taken during follow-up was also recorded. The primary endpoint was the incidence of newly identified AVC, according to which patients were divided into new-onset AVC group (n = 43) and the opposite(n = 165).
Statistical analysis
Analyses were conducted using SPSS 26.0 and GraphPad Prism 10.1.2. The normality of the data was determined using the Kolmogorov-Smirnov test. Continuous variables with a normal distribution were given as mean ± standard deviation and compared using the two-independent sample T-test. While those without a normal distribution are presented as median and interquartile range values and compared using Mann-Whitney U test. Categorical variables were presented as numbers (percentages) and compared using Chi-square test or Fisher exact probability method. Independent predictors of new-onset AVC in patients with CAD were analyzed using Cox proportional hazard models to calculate hazard ratios (HRs) and 95% confidence intervals (CIs). A receiver operating characteristic (ROC) curve was used to derive the best cut-off value of the Lp(a) for predicting the new-onset AVC using Youden’s J statistic. The area under the curve (AUC) values were compared utilizing the MedCalc statistical software. The cumulative incidence of AVC-free during follow-up was described by Kaplan-Meier survival curve, and the difference of AVC-free between groups was compared by Log-Rank test. A p-value < 0.05 was considered statistical significance.
Results
Clinical baseline data
A total of 208 patients with CAD were included, with a median follow-up time of 16 (12, 20) months. The baseline clinical characteristics are shown in Table 1. Compared with AVC-free group, patients with new-onset AVC had higher body mass index (BMI) (25.1 kg/m2 vs. 23.8 kg/m2, p = 0.003), higher proportion of tree-vessel disease(53.5% vs. 23.0%, p < 0.001), higher rates of diabetes (46.5% vs. 21.8%, p = 0.001) and atrial fibrillation (23.3% vs. 9.7%, p = 0.017). Lp(a) levels were higher in the new-onset AVC group (70.4 nmol/L vs. 19.51nmol/L, p < 0.001), while there were no significant differences in other laboratory tests between the two groups. In terms of echocardiography, the lower left ventricular systolic function (LVEF) (53.0% vs. 60.0%, p < 0.001) and thicker left ventricular posterior wall (LVPW) (10.29 mm vs. 9.46 mm, p < 0.001) were found in the new-onset AVC group. There were no significant differences in medication during follow-up.
Table 1.
Baseline clinical characteristics
| All patients (n = 208) |
new-onset AVC (n = 43) |
AVC-free (n = 165) |
p value | |
|---|---|---|---|---|
| Demographic characteristics | ||||
| Age, years | 62.8 ± 10.7 | 60.7 ± 10.0 | 63.29 ± 10.8 | 0.153 |
| BMI, kg/m2 | 24.1 ± 2.7 | 25.1 ± 2.4 | 23.8 ± 2.7 | 0.003 |
| Male, n(%) | 136(65.4) | 28(65.1) | 108(65.5) | 0.967 |
| Risk factors | ||||
| Smoking, n(%) | 122(58.7) | 26(60.5) | 96(58.2) | 0.787 |
| drinking, n(%) | 82(39.4) | 18(41.9) | 64(38.8) | 0.713 |
| Hypertension, n(%) | 139(66.8) | 31(72.1) | 108(65.5) | 0.410 |
| Diabetes, n(%) | 56(26.9) | 20(46.5) | 36(21.8) | 0.001 |
| Atrial fibrillation, n(%) | 26(12.5) | 10(23.3) | 16(9.7) | 0.017 |
| Carotid plaque, n(%) | 177(85.1) | 38(88.4) | 139(84.2) | 0.498 |
| tree-vessel disease, n(%) | 61(29.3) | 23(53.5) | 38(23.0) | < 0.001 |
| Medication during follow-up | ||||
| Statin, n (%) | 203(97.6) | 41(95.3) | 162(98.2) | 0.280 |
| Dual antiplatelet, n(%) | 82(39.4) | 21(48.8) | 61(37.0) | 0.156 |
| β-blocker, n (%) | 179(86.1) | 40(93.0) | 139(84.2) | 0.139 |
| calcium channel antagonist, n(%) | 116(55.8) | 23(53.5) | 93(56.4) | 0.735 |
| ACEI/ARB/ARNI(%) | 169(81.3) | 37(86.0) | 132(80.0) | 0.366 |
| Laboratory examination | ||||
| WBC(G/L) | 6.97(5.76,8.27) | 7.24(6.02,8.58) | 6.90(5.72,8.20) | 0.266 |
| Hb(g/L) | 137.1 ± 15.2 | 136.3 ± 17.7 | 137.3 ± 14.5 | 0.689 |
| TC(mmol/L) | 4.69 ± 1.23 | 4.84 ± 1.44 | 4.66 ± 1.17 | 0.387 |
| TG(mmol/L) | 1.63(1.13,2.74) | 1.49(1.03,2.14) | 1.68(1.19,2.91) | 0.103 |
| HDL-C(mmol/L) | 1.11(0.91,1.33) | 1.13(0.96,1.39) | 1.11(0.91,1.32) | 0.473 |
| LDL-C(mmol/L) | 2.68(2.06,3.57) | 2.66(2.11,3.86) | 2.69(1.93,3.47) | 0.331 |
| sd-LDLC(mmol/L) | 0.92(0.65,1.35) | 0.95(0.65,1.23) | 0.91(0.65,1.35) | 0.931 |
| ApoA1(g/L) | 1.30(1.17,1.45) | 1.27(1.18,1.43) | 1.30(1.17,1.49) | 0.585 |
| ApoB(g/L) | 0.96(0.77,1.14) | 0.94(0.77,1.19) | 0.96(0.79,1.14) | 0.885 |
| Lp(a)(nmol/L) | 25.7(11.4,67.6) | 70.4(27.1,149.1) | 19.5(10.0,48.5) | < 0.001 |
| Hcy(umol/L) | 11.7(9.7,14.2) | 11.7(9.4,14.4) | 11.7(9.8,14.1) | 0.966 |
| HbA1c(%) | 6.1(5.7,7.0) | 6.3(5.7,7.0) | 6.0(5.7,7.1) | 0.810 |
| UA(umol/L) | 372.1 ± 105.9 | 351.2 ± 90.3 | 377.5 ± 109.2 | 0.147 |
| Ca(mmol/L) | 2.29 ± 0.11 | 2.27 ± 0.13 | 2.29 ± 0.11 | 0.223 |
| Alb(g/L) | 44.2(40.6,46.5) | 43.1(39.5,45.9) | 44.3(40.9,46.6) | 0.444 |
| eGFR(ml/min/1.73m2) | 85.8(68.5,95.0) | 87.4(66.3,98.0) | 85.7(68.9,94.4) | 0.487 |
| hsCRP(mg/L) | 1.47(0.89,3.28) | 1.64(0.97,4.10) | 1.40(0.85,3.11) | 0.316 |
| Echocardiography | ||||
| LVEF(%) | 58.0(52.2,60.8) | 53.0(50.0,58.0) | 60.0(55.0,61.0) | < 0.001 |
| LAs(mm) | 32.0(29.4,34.3) | 32.5(29.4,34.6) | 32.0(29.4,34.3) | 0.617 |
| LVED(mm) | 44.7(42.0,46.6) | 45.0(42.6,47.8) | 44.5(42.0,46.5) | 0.296 |
| IVS(mm) | 9.6(8.7,10.5) | 10.0(9.0,10.9) | 9.5(8.7,10.4) | 0.094 |
| LVPW(mm) | 9.63 ± 1.35 | 10.29 ± 1.11 | 9.46 ± 1.36 | < 0.001 |
Data are given as mean ± SD, n (%), or median (interquartile range). Abbreviations: ACEI, angiotensin converting enzyme inhibitors; Alb: albumin; ApoA1, apolipoprotein A1; ApoB, apolipoprotein B; ARB, angiotensin II receptor blockage; ARNI, angiotensin receptor neprilysin inhibitor; BMI, body mass index; eGFR, estimated glomerular filtration rate; Hb, hemoglobin; HbA1c, glycosylated hemoglobin; Hcy, homocysteine; HDL-C, high-density lipoprotein cholesterol; hsCRP, high-sensitive C-reactive protein; IVS, interventricular septal thickness; LAs, left atrial diameter; LDL-C, low-density lipoprotein cholesterol; Lp(a), lipoprotein(a); LVED, left ventricular end-diastolic diameter; LVEF, left ventricular ejection fraction; LVPW, left ventricular posterior wall; sd-LDLC, small and dense low-density lipoprotein cholesterol; TC, total cholesterol; TG, triglyceride; UA, uric acid; WBC, white blood cell.
Cox regression analysis of new-onset AVC in patients with CAD
The results of univariate Cox regression were shown in Table 2. BMI (HR 1.157, 95%CI 1.037–1.291, p = 0.009), diabetes (HR 2.118, 95%CI 1.161–3.861, p = 0.014), atrial fibrillation (HR 2.509, 95%CI 1.236–5.093, p = 0.011), three-vessel disease(HR 2.799, 95%CI 1.537–5.097, p = 0.001), Lp(a) > 26.65 nmol/L (HR 3.181, 95%CI 1.520–6.656, p = 0.002), LVEF (HR 0.937, 95%CI 0.908–0.967, p < 0.001) and LVPW (HR 1.425, 95%CI1.157-1.755, p = 0.001) were identified the risk factors of new-onset AVC in patients with CAD.
Table 2.
Univariate Cox regression analysis for New-Onset AVC
| Variables | β | HR | 95% CI | p value | |
|---|---|---|---|---|---|
| Lower limit | Upper limit | ||||
| Age | −0.016 | 0.984 | 0.957 | 1.013 | 0.274 |
| BMI | 0.146 | 1.157 | 1.037 | 1.291 | 0.009 |
| Male | 0.163 | 1.177 | 0.627 | 2.207 | 0.612 |
| Smoking | 0.110 | 1.116 | 0.605 | 2.057 | 0.725 |
| Drinking | 0.229 | 1.257 | 0.683 | 2.314 | 0.463 |
| Hypertension | 0.294 | 1.341 | 0.688 | 2.616 | 0.389 |
| Carotid plaque | 0.311 | 1.363 | 0.537 | 3.468 | 0.514 |
| Diabetes | 0.750 | 2.118 | 1.161 | 3.861 | 0.014 |
| Atrial fibrillation | 0.920 | 2.509 | 1.236 | 5.093 | 0.011 |
| tree-vessel disease | 1.029 | 2.799 | 1.537 | 5.097 | 0.001 |
| Lp(a)>26.65nmol/L | 1.157 | 3.181 | 1.520 | 6.656 | 0.002 |
| LVEF | −0.065 | 0.937 | 0.908 | 0.967 | <0.001 |
| LVPW | 0.354 | 1.425 | 1.157 | 1.755 | 0.001 |
Abbreviations: BMI body mass index, Lp(a) lipoprotein(a), LVEF left ventricular ejection fraction, LVPW left ventricular posterior wall
Indicators with p<0.1 in univariate Cox regression analysis were selected to conduct multifactor Cox regression analysis, shown in Table 3. Increased BMI (HR 1.195, 95%CI 1.050-1.361, p=0.007), three-vessel disease(HR 1.942, 95%CI 1.005-3.755, p=0.048), Lp(a)>26.65 nmol/L(HR 2.943,95%CI 1.369-6.331,P=0.006), increased LVPW (HR 1.390, 95%CI 1.084-1.782, p=0.009) were found independent risk factors for new-onset AVC. While increased LVEF (HR 0.951, 95%CI 0.9160.988, p=0.009) was a protective factor.
Table 3.
Multivariate Cox regression analysis for New-Onset AVC
| Variables | β | HR | 95% CI | p value | |
|---|---|---|---|---|---|
| Lower limit | Upper limit | ||||
| BMI | 0.178 | 1.195 | 1.050 | 1.361 | 0.007 |
| Diabetes | 0.022 | 1.022 | 0.521 | 2.006 | 0.950 |
| Atrial fibrillation | 0.350 | 1.419 | 0.660 | 3.048 | 0.370 |
| tree-vessel disease | 0.664 | 1.942 | 1.005 | 3.755 | 0.048 |
| Lp(a)>26.65nmol/L | 1.080 | 2.943 | 1.369 | 6.331 | 0.006 |
| LVEF | −0.050 | 0.951 | 0.916 | 0.988 | 0.009 |
| LVPW | 0.329 | 1.390 | 1.084 | 1.782 | 0.009 |
Abbreviations: BMI body mass index, Lp(a) lipoprotein(a), LVEF left ventricular ejection fraction, LVPW left ventricular posterior wall
Predictive value of Lp(a) for new-onset AVC in patients with CAD
Predictive value of Lp(a) for new-onset AVC in patients with CAD
As shown in Table 4; Fig. 1, using a cutoff level of 26.65 nmol/L, Lp(a) predicted new-onset AVC with a sensitivity of 79.1% and a specificity of 59.4% (AUC: 0.740, 95% CI: 0.657–0.823, p < 0.001). The number for BMI was 23.0 kg/m2, with a sensitivity of 83.7% and a specificity of 39.7% (AUC: 0.693, 95% CI: 0.550–0.728, p < 0.005). When combined Lp(a) with BMI, there present a higher AUC value of 0.752(95%CI: 0.668–0.836, p < 0.001); however, the statistical significance remains limited (p = 0.732).
Table 4.
Area under the receiver operating characteristic (ROC) curve for participants
| Area | Standard error | 95% CI | p value | ||
|---|---|---|---|---|---|
| Lower limit | Upper limit | ||||
| Lp(a) | 0.740 | 0.042 | 0.657 | 0.823 | <0.001 |
| BMI | 0.639 | 0.045 | 0.550 | 0.728 | 0.005 |
| Lp(a) combined with BMI | 0.752 | 0.043 | 0.668 | 0.836 | <0.001 |
| LVPW | 0.329 | 1.390 | 1.084 | 1.782 | 0.009 |
Abbreviations: BMI, body mass index; Lp(a), lipoprotein(a)
Fig. 1.

ROC Curve Analysis for the Predictive Value of Lp(a) and BMI on New-Onset AVC
Comparison of Kaplan-Meier survival curves in different groups
Grouped by cut-off values, Kaplan-Meier survival curves showed significant differences in cumulative AVC-free incidence (Fig. 2-4), which was lower in Lp(a) > 26.65nmol/L group compared to Lp(a) ≤ 26.65 nmol/L group (Log-Rank: p < 0.05) (Fig. 2), lower in BMI > 23.0 kg/m2 group compared to BMI ≤ 23.0 kg/m2 group (Log-Rank: p < 0.05) (Fig. 3), and lower in the three-vessel disease group compared to the non-three-vessel disease group (Log-Rank: p < 0.05) (Fig. 4).
Fig. 2.
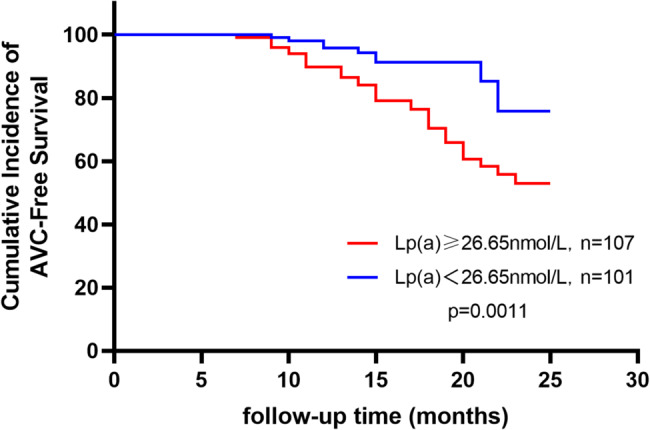
Kaplan-Meier Curves for Cumulative Incidence of AVC-Free Survival by Different Lp(a) Groups
Fig. 4.

Kaplan-Meier Curves for Cumulative Incidence of AVC-Free Survival by Different Vascular Lesion Subgroups
Fig. 3.
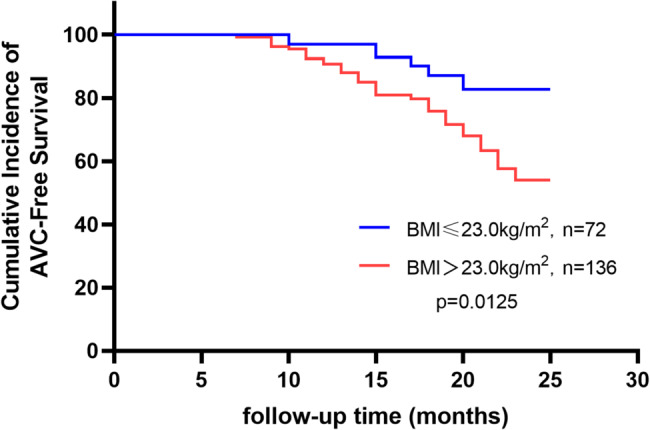
Kaplan-Meier Curves for Cumulative Incidence of AVC-Free Survival by Different BMI Groups
Discussion
Our study demonstrated the predictive value of Lp(a) for new-onset AVC in patients with CAD, and further explored and evaluated other risk factors of AVC.
It is known that higher Lp(a) level is associated with CAD and reduce Lp(a) is undoubtedly an important strategy to prevent CAD in the current treatment. Recently, its correlation with CAVD has made it a focus again. The study of Vongpromek R et al. [11] was the first to reveal the association between elevated Lp(a) and increased risk of AVC. A total of 129 asymptomatic heterozygous familial hypercholesterolemia(FH) patients (age 40–69 years) were included, and AVC was detected 38.2% using computed tomography scanning. After adjustment for all covariables, Lp(a) remained an only significant predictor of AVC, with an odds ratio per 10 mg/dL increase in Lp(a) concentration of 1.11 (95% CI 1.01–1.20, P = 0.03). Bouchareb R et al. [12] explained how Lp(a) and valve interstitial cells (VIC) promotes inflammation and mineralization of the aortic valve via Autotaxin (ATX) by Immunohistochemistry studies. Lp(a) transports oxidized phospholipids(OxPL) with a high content in lysophosphatidylcholine. ATX transforms lysophosphatidylcholine into lysophosphatidic acid. ATX-lysophosphatidic acid promotes the mineralization of the aortic valve through a nuclear factor κB/interleukin-6/bone morphogenetic protein pathway, which accelerates the development of CAVD. Furtherly, a case-control study performed within the Copenhagen General Population Study [13], including 725 CAVD cases and 1413 controls free of cardiovascular disease, revealed that OxPL-apoB and OxPL-apo(a) are novel genetic and potentially causal risk factors for CAVD and may explain the association of Lp(a) with CAVD. Capoulade et al. [14]also explored the role of OxPL and Lp(a) as key mediators in the progression of CAVD. OxPL-apoB, which reflects the biological activity of Lp(a), and Lp(a) levels were measured in 220 patients with mild-to-moderate AS, and the annualized increase in peak aortic jet velocity in m/s/year by Doppler echocardiography were measured to determine the progression rate of AS. After 3.5 ± 1.2 years of follow-up, results showed that top tertiles of Lp(a) and OxPL-apoB are associated with faster AS progression as well as increased risk of aortic valve replacement and cardiac death. Those findings above all hypothesis that Lp(a) mediates CAVD progression through its associated OxPL.
Another convincing and enlightening conclusion comes from the research from the Rotterdam Study [15], which investigated the non-enhanced cardiac computed tomography imaging of totally 922 individuals at baseline and after a median period of up to 14 years. The population-based study finally reported a robust association between Lp(a) and both baseline and new-onset AVC, but it does not correlate with the progression of AVC. This finding seems to indicate that interventions aimed at lowering Lp(a) may be most effective during the pre-calcific stages of CAVD, and explains the failure of statin applying to the patients who have already developed aortic stenosis in previous researches to a certain extent [16, 17]. However, imaging was conducted at only two time points, separated by a 14-year interval, which precludes the identification of the precise temporal onset of AVC. In the observational study by David S. Owens et al. [18], a significant association was identified between traditional cardiovascular risk factors and the incidence of AVC over a mean follow-up period of only 2.4 years. It is important to note that the follow-up testing in the study was conducted in two phases. Half of the cohort returned with an average between-scan interval of 1.6 years, while the other half had an interval of 3.2 years. Although it is regrettable that they were not analyzed separately, the study still yielded comprehensive positive results that incident AVC risk was associated with age, male gender, BMI, current smoking, and the use of both antihypertensive and lipid lowering medications. Furthermore, patients with CAD were excluded at baseline. In contrast, our study specifically focused on patients with CAD at baseline. In this population, the pathophysiological response pathway related to Lp(a) may have been activated. Although the average follow-up duration was shorter than that in previous studies, it may indicate that AVC shared a common pathophysiological mechanism with CAD. At present, a handful of trials targeting relevant molecular markers and pathways of the progression of CAVD are ongoing, and the most exciting development may be the recent success of Lp(a)-modifying therapies, particularly the siRNA molecule olpasiran, which has demonstrated an effective reduction in plasma Lp(a) levels during a phase 2 clinical trial [19]. However, there have been no finished studies to verify its clinical effectiveness at present. Our study firstly evaluated the relationship between Lp(a) and AVC in CAD patients rather than the general population or FH patients, and found a still satisfactory predictive value of Lp(a) for new-onset AVC although in the CAD cases who are themselves correlated with high Lp(a) levels, highlighting the important role of Lp(a) as a potential therapeutic target. Further studies were expected to explore exactly efficacious treatments.
There seems a more confusing relationship between BMI and AVC. A Mendelian randomization design [20] included 367,703 UK Biobank participants provides evidence that higher BMI and particularly fat mass index are associated with increased risk of AS. But the study by Mancio et al. [21]came to a different conclusion that BMI and abdominal visceral (VAF) were inversely associated with AVC in AS patients submitted to TAVR. A stratified analysis by obesity showed that in non-obese, VAF was inversely associated with mortality, whereas in obese, high VAF was associated with higher mortality (p < 0.05). This so-called “obesity paradox” challenges the conventional view that obesity always directly leads to an increased risk of cardiovascular disease, revealing a potentially more complex interaction between BMI and disease development, particularly in the context of AVC. Our study found that increased BMI remains a risk factor for new-onset AVC in patients with CAD after adjustment for other risk factors (HR 1.195, 95%CI 1.050–1.361, P = 0.007), which may seem different from the conclusions of Mancio et al. However, we included patients who did not get AVC at baseline instead of those submitted to TAVR, who have already suffered severe AVC. In other words, we only confirms that elevated BMI may be associated with new-onset AVC but not progression of AVC. Further studies are supposed to clarify the truth behind these observations to improve management strategies for patients with cardiovascular disease.
There are limited researches directly on the relationship between three-vessel disease and AVC, while the overlap clinical risk factors associated with CAD and AVC such as older age, male sex, hypertension, metabolic syndrome, smoking and so on suggest a potential correlation between them. Additionally, compelling histopathologic and clinical data have shown that CAVD is an active disease process akin to atherosclerosis with lipoprotein deposition, chronic inflammation, and active calcification [5, 22]. In our study, multivariate Cox regression analysis showed an almost double risk of new-onset AVC in patients with three-vessel disease (HR 1.942, 95%CI 1.005–3.755, p = 0.048), supporting the hypothesis for a potentially shared disease process.
Several studies have shown the impact of blood pressure on AVC. Pohle et al. [23] analyzed 1,000 patients using electron beam computed tomography (EBCT) and found AVC was detected more frequently in patients with hypertension (21.7% in patients with hypertension vs. 13.9% in patients without hypertension; p = 0.01). Shinichi Iwata et al. [24]indicated an independently association between diastolic (both mean awake diastolic BP and asleep diastolic BP) and advanced calcification of aortic valve leaflet in their study consisted of 737 patients underwent 24-hour ABP monitoring. The prospective study by Lionel Tastet et al. [25]confirmed that systolic hypertension is associated with faster AVC progression. But hypertension was not observed as a risk factor for new-onset AVC of patients with CAD in our study (HR 1.341, 95%CI 0.6888–2.616, P = 0.389). The reason may be that CAD is known associated with hypertension already, so that the positive impacts of hypertension become relatively reduced in this population. However, we found that an increase in LVPW was an independent predictor of new-onset AVC (HR 1.390, 95%CI 1.084–1.782, P = 0.009). It is known that the most common reason of thickened LVPW is increased pressure load due to high blood pressure, so it cannot be ruled out that the relationship between LVPW and new-onset AVC shown in our study may be partially mediated by hypertension.
There are numerous findings underlining the critical role of diabetes in the progression of CAVD. Letitia Ciortan et al. [26]developed a 3D model of the human aortic valve based on gelatin methacrylate and showed that hyperglycemia accelerated the progression of CAVD by inducing inflammation and remodeling mechanisms in valvular endothelial cells (VECs) and VICs. The research by Magdalena Kopytek et al. [27] furtherly revealed that type2 diabetes enhances in loco inflammation and coagulation activation within stenotic valve leaflets via upregulated expression of both NF-κB and BMP-2. Khai Le Quang et al. [28] verified the evidence that the dysmetabolic state of type 2 diabetes mellitus contributes to early mineralization of the aortic valve and CAVD pathogenesis through established the diabetes mellitus -prone LDLr(-/-)/ApoB(100/100)/IGF-II mouse as a new model of CAVD. In our study, univariate Cox regression analysis showed that diabetes increase the risk of new-onset AVC (HR 2.118, 95%CI 1.161–3.861, P = 0.014) of patients with CAD but not an independent predictor in multivariate cox regression analysis. This may be due to the fact that diabetes is also a clear risk factor of CAD, which confused the result. More clinical trials and experimental researches are needed to reveal the complex progression of inflammation, oxidative stress, and metabolic abnormalities in the pathogenesis of CAVD with diabetes.
There are unavoidable limitations in this study. Firstly, we employed echocardiography to identify AVC, which may exhibit lower accuracy in comparison to computed tomography scanning utilized in numerous more rigorous studies, thereby potentially constraining the validity of our research. Secondly, the study was a single-center, observational study with a relatively small sample size, which may undermine credibility. Thirdly, calcification of the valve is considered a long-term process, while the follow-up time of our study seemed to be relatively short. Lastly, we only investigated the association between Lp(a) and new-onset AVC in patients with CAD, but failed to declare its prognostic value.
Conclusion
High-level serum Lp(a) was independently associated with new-onset AVC in patients with CAD. Lp(a) demonstrates a significant predictive value for the onset of new AVC in CAD patients, with an established cut-off threshold of 26.65 nmol/L.
Acknowledgements
The study was supported by Hainan Province Clinical Medical Center and Hainan Clinical Research Center for Cardiology, and Zhujiang Hospital of Southern Medical University.
Authors’ contributions
Yuying Deng wrote the main manuscript text. Yao Ren collected and anylyzed the data. All authors reviewed the manuscript.
Funding
The author(s) received no financial support for the research, authorship, and/or publication of this article.
Data availability
No datasets were generated or analysed during the current study.
Declarations
Ethics approval and consent to participate
The study protocol was reviewed and approved by the local ethics committee of Zhujiang Hospital of Southern Medical University and was conducted in accordance with the Declaration of Helsinki. All the participants provided written informed consent.
Consent for publication
Not Applicable.
Competing interests
The authors declare no competing interests.
Footnotes
Publisher’s Note
Springer Nature remains neutral with regard to jurisdictional claims in published maps and institutional affiliations.
Yao Ren and Yuying Deng contributed equally to this work.
References
- 1.Yadgir S, et al. Global, regional, and national burden of calcific aortic valve and degenerative mitral valve diseases, 1990–2017. Circulation. 2020;141(21):1670–80. [DOI] [PubMed] [Google Scholar]
- 2.Khurrami L, et al. Cross-sectional study of aortic valve calcification and cardiovascular risk factors in older Danish men. Heart. 2021;107(19):1536–43. [DOI] [PubMed] [Google Scholar]
- 3.Yi B, et al. Changing epidemiology of calcific aortic valve disease: 30-year trends of incidence, prevalence, and deaths across 204 countries and territories. Aging. 2021;13(9):12710–32. [DOI] [PMC free article] [PubMed] [Google Scholar]
- 4.Razavi AC, et al. Risk markers for limited coronary artery calcium in persons with significant aortic valve calcium (from the Multi-ethnic study of atherosclerosis). Am J Cardiol. 2021;156:58–64. [DOI] [PMC free article] [PubMed] [Google Scholar]
- 5.Freeman RV, Otto CM. Spectrum of calcific aortic valve disease: pathogenesis, disease progression, and treatment strategies. Circulation. 2005;111(24):3316–26. [DOI] [PubMed] [Google Scholar]
- 6.Kronenberg F, Utermann G. Lipoprotein(a): resurrected by genetics. J Intern Med. 2013;273(1):6–30. [DOI] [PubMed] [Google Scholar]
- 7.Wang S, et al. The relationship between lipoprotein(a) and risk of cardiovascular disease: a Mendelian randomization analysis. Eur J Med Res. 2022;27(1):211. [DOI] [PMC free article] [PubMed] [Google Scholar]
- 8.Kronenberg F, et al. Lipoprotein(a) in atherosclerotic cardiovascular disease and aortic stenosis: a European atherosclerosis society consensus statement. Eur Heart J. 2022;43(39):3925–46. [DOI] [PMC free article] [PubMed] [Google Scholar]
- 9.Kamstrup PR, Tybjærg-Hansen A, Nordestgaard BG. Elevated lipoprotein(a) and risk of aortic valve stenosis in the general population. J Am Coll Cardiol. 2014;63(5):470–7. [DOI] [PubMed] [Google Scholar]
- 10.Virani SS, et al. 2023 AHA/ACC/ACCP/ASPC/NLA/PCNA guideline for the management of patients with chronic coronary disease: A report of the American heart association/american college of cardiology joint committee on clinical practice guidelines. Circulation. 2023;148(9):e9–119. [DOI] [PubMed] [Google Scholar]
- 11.Vongpromek R, et al. Lipoprotein(a) levels are associated with aortic valve calcification in asymptomatic patients with familial hypercholesterolaemia. J Intern Med. 2015;278(2):166–73. [DOI] [PubMed] [Google Scholar]
- 12.Bouchareb R, et al. Autotaxin derived from lipoprotein(a) and valve interstitial cells promotes inflammation and mineralization of the aortic valve. Circulation. 2015;132(8):677–90. [DOI] [PubMed] [Google Scholar]
- 13.Kamstrup PR, et al. Oxidized phospholipids and risk of calcific aortic valve disease: the Copenhagen general population study. Arterioscler Thromb Vasc Biol. 2017;37(8):1570–8. [DOI] [PMC free article] [PubMed] [Google Scholar]
- 14.Capoulade R, Phospholipids O, et al. Lipoprotein(a), and progression of calcific aortic valve stenosis. J Am Coll Cardiol. 2015;66(11):1236–46. [DOI] [PubMed] [Google Scholar]
- 15.Kaiser Y, et al. Lipoprotein(a) is associated with the onset but not the progression of aortic valve calcification. Eur Heart J. 2022;43(39):3960–7. [DOI] [PMC free article] [PubMed] [Google Scholar]
- 16.Cowell SJ, et al. A randomized trial of intensive lipid-lowering therapy in calcific aortic stenosis. N Engl J Med. 2005;352(23):2389–97. [DOI] [PubMed] [Google Scholar]
- 17.Rossebø AB, et al. Intensive lipid lowering with Simvastatin and Ezetimibe in aortic stenosis. N Engl J Med. 2008;359(13):1343–56. [DOI] [PubMed] [Google Scholar]
- 18.Owens DS, et al. Incidence and progression of aortic valve calcium in the Multi-ethnic study of atherosclerosis (MESA). Am J Cardiol. 2010;105(5):701–8. [DOI] [PMC free article] [PubMed] [Google Scholar]
- 19.O’Donoghue ML, et al. Small interfering RNA to reduce lipoprotein(a) in cardiovascular disease. N Engl J Med. 2022;387(20):1855–64. [DOI] [PubMed] [Google Scholar]
- 20.Larsson SC, et al. Body mass index and body composition in relation to 14 cardiovascular conditions in UK biobank: a Mendelian randomization study. Eur Heart J. 2020;41(2):221–6. [DOI] [PMC free article] [PubMed] [Google Scholar]
- 21.Mancio J, et al. Association of body mass index and visceral fat with aortic valve calcification and mortality after transcatheter aortic valve replacement: the obesity paradox in severe aortic stenosis. Diabetol Metab Syndr. 2017;9:86. [DOI] [PMC free article] [PubMed] [Google Scholar]
- 22.Rajamannan NM, agenda for research from the National Heart and Lung and Blood Institute Aortic Stenosis Working Group. Calcific aortic valve disease: not simply a degenerative process: A review and. Executive summary: Calcific aortic valve disease-2011 update. Circulation, 2011; 124(16): 1783-91.
- 23.Pohle K, et al. Association of cardiovascular risk factors to aortic valve calcification as quantified by electron beam computed tomography. Mayo Clin Proc. 2004;79(10):1242–6. [DOI] [PubMed] [Google Scholar]
- 24.Iwata S, et al. Higher ambulatory blood pressure is associated with aortic valve calcification in the elderly: a population-based study. Hypertension. 2013;61(1):55–60. [DOI] [PMC free article] [PubMed] [Google Scholar]
- 25.Tastet L, et al. Systolic hypertension and progression of aortic valve calcification in patients with aortic stenosis: results from the PROGRESSA study. Eur Heart J Cardiovasc Imaging. 2017;18(1):70–8. [DOI] [PMC free article] [PubMed] [Google Scholar]
- 26.Ciortan L, et al. Chronic high glucose concentration induces inflammatory and remodeling changes in valvular endothelial cells and valvular interstitial cells in a gelatin methacrylate 3D model of the human aortic valve. Polymers. 2020. 10.3390/polym12122786. [DOI] [PMC free article] [PubMed] [Google Scholar]
- 27.Kopytek M, et al. Diabetes concomitant to aortic stenosis is associated with increased expression of NF-κB and more pronounced valve calcification. Diabetologia. 2021;64(11):2562–74. [DOI] [PMC free article] [PubMed] [Google Scholar]
- 28.Le Quang K, et al. Early development of calcific aortic valve disease and left ventricular hypertrophy in a mouse model of combined dyslipidemia and type 2 diabetes mellitus. Arterioscler Thromb Vasc Biol. 2014;34(10):2283–91. [DOI] [PubMed] [Google Scholar]
Associated Data
This section collects any data citations, data availability statements, or supplementary materials included in this article.
Data Availability Statement
No datasets were generated or analysed during the current study.