Abstract
The antibacterial effects of moxifloxacin against Bacteroides fragilis, Clostridium perfringens, and gram-positive anaerobic cocci (GPAC) were studied in an in vitro pharmacokinetic model. Initially, a dose-ranging study with area under the concentration-time curve (AUC)/MIC ratios of 6.7 to 890 was used to investigate the effect of anaerobic conditions on the AUC/MIC antibacterial effect (ABE) relationship with Escherichia coli. The AUC/MIC ratios for 50% and 90% effects, using a log CFU drop at 24 h as the antibacterial effect measure, were 34 and 59, respectively, aerobic and 54 and 96, respectively, anaerobic. These values are not significantly different. Dose ranging at AUC/MIC ratios of 9 to 216 against the anaerobes indicated a differing AUC/MIC ABE pattern, and the AUC/MICs for 50% and 90% effects were lower: for B. fragilis, they were 10.5 and 25.7, respectively; for C. perfringens, they were 8.6 and 16.2; and for GPAC, they were 7.3 and 17.4. The maximum-effect log drops were as follows: for B. fragilis, −3.2 ± 0.2 logs; for C. perfringens, −3.7 ± 0.1 logs; and for GPAC, −2.5 ± 0.1 logs. Although the anaerobes were not eradicated, there was no emergence of resistance. Comparison of the ABE of moxifloxacin to that of ertapenem against B. fragilis indicated that moxifloxacin was superior at 24 h and 48 h. In contrast, ertapenem was superior to moxifloxacin against GPAC at 24 h and 48 h and against C. perfringens at 48 h. Both drugs performed equivalently against C. perfringens at 24 h. Monte Carlo simulations using human serum AUC data and an AUC/MIC anaerobe target of 7.5 suggests a >90% target achievement at MICs of <2 mg/liter. This divides the B. fragilis wild-type MIC distribution. The pharmacodynamic properties of moxifloxacin against anaerobes are different than those against aerobic species. The clinical implications of these differences need further exploration.
In vitro pharmacokinetic models have been widely used to establish and justify fluoroquinolone-dosing strategies against aerobic gram-positive and gram-negative bacteria. Indeed, fluoroquinolones are probably the most studied antibiotic class in terms of pharmacodynamics, with strong links established between observations in in vitro and animal pharmacodynamic systems and subsequent observations in humans (19, 20, 22). It can be argued that the present pharmacodynamic paradigm, in terms of optimizing therapeutic outcomes while minimizing the risk of antibiotic resistance, has been developed largely using data on fluoroquinolones (6).
In contrast to the situation with aerobic bacteria, the pharmacodynamics of fluoroquinolones against anaerobic species is very poorly studied; however, it is clear that the in vitro potencies of newer agents, such as clinafloxacin, moxifloxacin, sitafloxacin, and trovafloxacin, are good and include potencies against Bacteroides spp. (4). In addition, animal model data for some agents have been encouraging (3), as have the results of clinical trials against standard therapies (5, 18, 21, 23). Data using in vitro pharmacokinetic models are limited but also indicate the potential utility of fluoroquinolones to treat anaerobic infections (17, 25).
The aim of this study was to establish the relationship of drug exposure with moxifloxacin to its antibacterial effect against Bacteroides fragilis, Clostridium perfringens, and gram-positive anaerobic cocci (GPAC) in an in vitro pharmacokinetic model using a dose-ranging experimental design. These relationships were placed in context by a comparison of moxifloxacin's effects against Escherichia coli and the effect of β-lactams with proven clinical effect on anaerobes.
MATERIALS AND METHODS
In vitro pharmacokinetic model.
A New Brunswick (Hatfield, Hertfordshire, England) Bioflo 1000 in vitro pharmacokinetic model was used to simulate the free-drug concentrations associated with dosings of moxifloxacin, ertapenem, and piperacillin-tazobactam. The system was adapted from that used previously to study aerobes (13). The apparatus consists of a single central chamber connected to a dosing chamber (for oral dose simulations) which in turn is connected to a vessel for overflow. The contents of the dosing chamber and central chamber are diluted with broth by using a peristaltic pump (Isametric; Bennett & Co., Weston-super-Mare, Somerset, England). The temperature is maintained at 37°C, and the broth in the dosing and central chambers is agitated by a magnetic stirrer. Air is replaced in the central compartment by sparging through nitrogen at a flow rate of 1 liter/min. The use of dithiothreitol and cysteine hydrochloride in the anaerobic broth also helps to sustain anaerobic growth (see below).
Media.
Southmead anaerobic broth (SAB) (100%) was used to sustain anaerobic growth. It contains tryptone (1%), yeast extract (0.5%), 25 mg/liter dithiothreitol, and 500 mg/liter l-cysteine hydrochloride. Anaerobes were recovered from the central compartment onto Fastidious anaerobic agar (FAA) supplemented with 5% lysed horse blood. For moxifloxacin simulations, 1% magnesium chloride was also added to inhibit any remaining moxifloxacin, and for the ertapenem and piperacillin-tazobactam, a broad-spectrum β-lactamase (T. R. Walsh, University of Bristol) was used to destroy antibiotic activity. For the aerobic experiments, 6% Iso-Sensitest broth was used.
Strains.
The following strains were used: B. fragilis SMH 2612; C. perfringens ATCC 13124; Peptostreptococcus micros SMH 7605, a gram-positive anaerobic coccus (GPAC); and E. coli ATCC 25922.
Antibiotics.
Moxifloxacin was obtained from Bayer AG, Leverkusen, Germany. Ertapenem was obtained from Merck & Co., Pennsylvania, and piperacillin-tazobactam was obtained from Wyeth, Wayne, New Jersey. Stock solutions were prepared according to BSAC guidelines (2).
MICs.
MICs were determined by a standard broth dilution method according to the CLSI (formerly NCCLS) guidelines (15). Brucella broth with 5 mg/liter hemin and 10 mg/liter vitamin K was used.
Pharmacokinetics.
A number of moxifloxacin free-drug areas under the concentration-time curves (AUCs) were simulated in dose-ranging studies to produce AUC/MIC ratios in ranges from 9 to 216 for the anaerobes and from 6.7 to 890 for E. coli. The time to the maximum concentration of the drug in serum was 1 h and the half-life was 10 h. The free-serum concentration associated with 1 g intravenous ertapenem given at 24-h intervals, namely an initial peak of 13 mg/liter and a half-life of 4 h, was simulated. Piperacillin-tazobactam was dosed at 8-h intervals to produce maximum concentrations of drug in serum (Cmax) of 275 mg/liter for piperacillin and 35 mg/liter tazobactam and a half-life of 1 h. Serum concentrations were simulated over 48 h for all three drugs. Drug concentrations were determined using a bioassay method (1). For moxifloxacin, the indicator organism was E. coli NCTC 10418, the medium was DST with wells, the standard curve range was 0.25 to 4 mg/liter, and the limit of detection was 0.03 mg/liter. The coefficient of variation (CV) was 10.6. For ertapenem, the same indicator organism and medium were used, the standard curve range was 1 to 16 mg/liter with a minimum level of detection of 0.12 mg/liter, and the CV was 9.8. For piperacillin-tazobactam, Bacillus subtilis NCTC 10400 was used in Penassay seed agar with disks. The CV was 5.4.
Antibacterial effects.
For each experiment, an inoculum of 5 × 10⁶ CFU/ml was used. Each inoculum was prepared by a suspension from an overnight culture plate. Two milliliters of a 109-CFU/ml suspension of the test strain was inoculated into the central chamber (volume, 1,080 ml). The model was run for about 45 min to allow the inoculum to reach 5 × 10⁶ CFU/ml in log phase before the drug was dosed. Samples were taken throughout the 48-h period for determinations of viable counts. Bacteria were quantified by using a spiral plater (Don Whitley, Spiral Systems, Shipley, West Yorkshire, United Kingdom). The minimum level of detection was 102 CFU/ml. Additional aliquots were also stored at −70°C for the measurement of antibiotic concentration using a bioassay as described previously (1).
Emergence of resistance.
Resistance to moxifloxacin was assessed as before using population analysis profiles (PAP) (13) at time zero (pre-exposure) and at 24 and 48 h (postexposure). Samples were plated onto agar containing no drug and antibiotic at 1×, 2×, 4×, and 8× the MIC in order to quantify the resistant subpopulation.
All pharmacokinetic simulations to determine antibacterial effect and emergence of resistance were performed at least in triplicate.
Pharmacodynamics and measurement of antibacterial effect.
The antibacterial effects (ABE) of the antibiotics were calculated by determining the log changes in viable counts between time zero and 12 h (Δ12), 24 h (Δ24), 36 h (Δ36), and 48 h (Δ48). The time for the inoculum to fall to 99.9% of its value at time zero was also recorded (T99.9), and the area under the bacterial-kill curve (AUBKC; log CFU/ml · h) was calculated using the log linear trapezoidal rule for the periods 0 to 24 h (AUBKC0-24) and 0 to 48 (AUBKC0-48). The relationships between AUC/MIC and antibacterial effect were delineated using a sigmoid Emax model with WinNonlin (Scientific Consulting) and GraphPad Prism software (GraphPad Software Incorporated, San Diego, CA). Monte Carlo simulations were performed using Crystal Ball 2000 software from Decisioneering Inc., Colorado.
RESULTS
MICs.
The moxifloxacin MICs, as determined by using CLSI methods, were 0.25 mg/liter for B. fragilis, 0.25 mg/liter for C. perfringens, 0.12 mg/liter for GPAC, and 0.03 mg/liter for E. coli. The MICs in SAB were higher: for B. fragilis, the MIC was 1.0 mg/liter; for C. perfringens, 1.0 mg/liter; for GPAC, 1.0 mg/liter, and for E. coli, 0.06 mg/liter. This may be related to the higher calcium and magnesium concentrations in SAB. The ertapenem MICs were as follows (values shown are for the CLSI method and for the CLSI method carried out using SAB, respectively): for B. fragilis, 1 and 1 mg/liter; for C. perfringens, 0.12 and 0.12 mg/liter; and for GPAC, 0.03 and 0.06 mg/liter. MICs of piperacillin-tazobactam were as follows: for B. fragilis, 16 and 8 mg/liter; for C. perfringens, 0.25 and 0.03 mg/liter; and for GPAC, 0.5 and 0.5 mg/liter. When AUC/MIC ratios were calculated for moxifloxacin, the MICs in SAB were used. The E. coli MICs were 0.03 mg/liter in Iso-Sensitest broth aerobic conditions and 0.04 mg/liter in anaerobic conditions.
Pharmacokinetic curves and pharmacodynamic parameters.
There was good agreement between target and achieved moxifloxacin, ertapenem, and piperacillin-tazobactam concentrations. The moxifloxacin target concentrations associated with free-drug concentrations for 400 mg given at 24-h intervals were Cmax at 1 h of 1.6 mg/liter, at 12 h of 0.8 mg/liter, and at 24 h of 0.35 mg/liter. Measured moxifloxacin concentrations at 1 h, 12 h, and 24 h were 1.6 ± 0.2 mg/liter, 0.9 ± 0.1 mg/liter, and 0.5 ± 0.1 mg/liter, respectively. Ertapenem free-drug concentration targets were 13 mg/liter at 0 h, 10 mg/liter at 2 h, 6.5 mg/liter at 4 h, 4.1 mg/liter at 7 h, 1.6 mg/liter at 12 h, and 0.2 mg/liter at 24 h, and the measured concentrations were 13.0 ± 1.3 mg/liter at 0 h, 10.6 ± 1.5 mg/liter at 2 h, 7.3 ± 0.6 mg/liter at 4 h, 4.6 ± 0.7 mg/liter at 7 h, 2.7 ± 0.3 mg/liter at 12 h, and 0 ± 0.2 mg/liter at 24 h. With piperacillin-tazobactam, the target concentrations were 275 mg/liter at time zero (0 h), 138 mg/liter at 1 h, 69 mg/liter at 2 h, 17 mg/liter at 4 h, and 2.0 mg/liter at 7 h, and the achieved concentrations were 255 ± 14 mg/liter at time zero (0 h), 137 ± 9 mg/liter at 1 h, 73 ± 11 mg/liter at 2 h, 19 ± 2 mg/liter at 4 h, and 4 ± 0.5 mg/liter at 7 h.
Antibacterial effects: moxifloxacin.
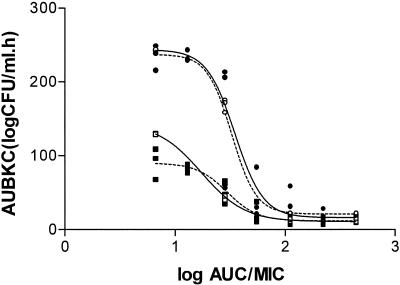
The first dose-ranging study was performed with E. coli under aerobic and anaerobic conditions. The relationships between the AUC/MIC ratio and AUBKC0-24 and AUBKC0-48 are shown in Fig. 1, and the AUC/MIC-to-Δ24 relationship is shown in Table 1. The AUC/MIC ratio for a static effect was 25 to 45, the 2-log clearance was 37 to 59, and the 99% effect for Δ24 occurred at an AUC/MIC ratio of >100 irrespective of the growth conditions. The maximum effect was a 4.5-log drop in count, i.e., clearance from the model (Table 1). Clearance occurred within the first 6 h.
FIG. 1.
Relationship of AUC/MIC and AUBKC for E. coli under aerobic (solid symbols) and anaerobic (open symbols) conditions. Squares represent AUBKC0-24, and circles represent AUBKC0-48.
TABLE 1.
Antibacterial-effect (Δ24)-moxifloxacin exposure relationships for E. coli (aerobic and anaerobic conditions), B. fragilis, C. perfringens, and GPAC
| Effect | Isolate
|
||||
|---|---|---|---|---|---|
|
E. coli
|
B. fragilis | C. perfringens | GPAC | ||
| Aerobic | Anaerobic | ||||
| Minimum effect (log CFU/ml) | +1.4 ± 0.5 | +1.5 ± 0.2 | +1.4 ± 0.5 | +2.2 ± 0.4 | +1.3 ± 0.3 |
| Maximum effect (log CFU/ml) | −4.4 ± 0.3 | −4.5 ± 0.2 | −3.2 ± 0.2 | −3.7 ± 0.1 | 2.5 ± 0.1 |
| AUC/MIC for static effect | 26 | 41 | 7.6 | 7.6 | 5.6 |
| −1-log kill | 30.9 | 49 | 10.7 | 9.1 | 8.7 |
| −2-log kill | 37.2 | 59 | 16.2 | 11.2 | 15.5 |
| −3-log kill | 44.7 | 69 | 37.2 | 15.2 | >216 |
| −4-log kill | 66.1 | 98 | >216 | >216 | >216 |
| 50% effect | 34 (26-44) | 54 (37-79) | 10.5 (8-13.8) | 8.6 (7.5-9.8) | 7.3 (5.6-9.4) |
| 90% effect | 59 | 96 | 25.7 | 16.2 | 17.4 |
| 99% effect | 105 | 148 | 81.0 | 31.6 | 42.7 |
| r2 for fit | 0.86 | 0.98 | 0.90 | 0.93 | 0.94 |
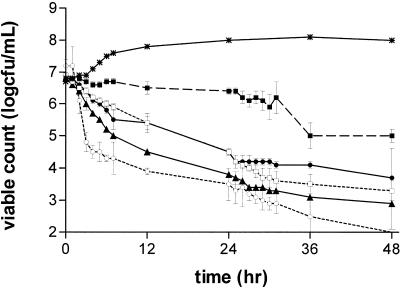
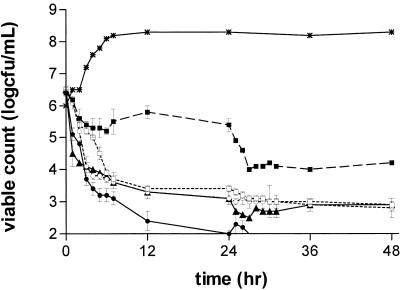
The antibacterial effects of moxifloxacin at AUC/MIC ratios of 9 to 216 against B. fragilis, C. perfringens, and GPAC are shown in Fig. 2, 3, and 4 and Table 2. Against B. fragilis at AUC/MIC ratios of 18 to 216, moxifloxacin produced a 2- to 3-log drop in count at 24 h and a 3- to 5-log drop at 48 h. There was no clear relationship between an increase in the AUC/MIC ratio and the effect in the range of 18 to 216, although the effects of the simulations with ratios of 18 and 36 appeared greater than those of the simulations with ratios of 72 and 216 (Fig. 2; Table 2). At an AUC/MIC of 9, moxifloxacin had little effect on the viable count at 24 h and produced a 1- to 2-log drop at 48 h. Against C. perfringens, moxifloxacin at an AUC/MIC of 9 produced a 1-log reduction in count at 24 h and a 2-log reduction at 48 h. At AUC/MIC ratios of 18 to 216, there was little relationship between exposure and effect, with all simulations producing >3-log reductions in counts at 24 h and 48 h (Fig. 3; Table 2).
FIG. 2.
Antibacterial effects of moxifloxacin at AUC/MIC ratios in a range of 9 to 216 against B. fragilis. Ratios: 9, ▪; 18, □; 36, •; 72, ○; 216, ▴. Growth control, ✹.
FIG. 3.
Antibacterial effects of moxifloxacin at AUC/MIC ratios in a range of 9 to 216 against C. perfringens. Ratios: 9, ▪; 18, □; 36, •; 72, ○; 216, ▴. Growth control, ✹.
FIG. 4.
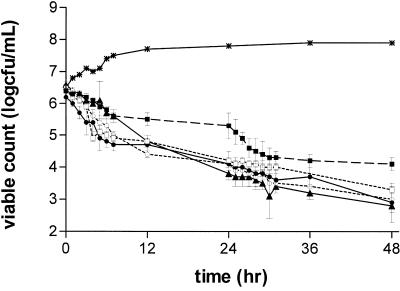
Antibacterial effects of moxifloxacin at AUC/MIC ratios in a range of 9 to 216 against GPAC. Ratios: 9, ▪; 18, □; 36, •; 72, ○; 216, ▴. Growth control, ✹.
TABLE 2.
Antibacterial effects of moxifloxacin on B. fragilis, C. perfringens, and GPAC at AUC/MIC ratios of 9 to 216 and Cmax/MIC ratios of 0.8 to 19.2
| AUC/MIC | Cmax/MIC |
B. fragilis
|
C. perfringens
|
GPAC
|
||||||
|---|---|---|---|---|---|---|---|---|---|---|
| T99.9 (h) | AUBKC0-24 | AUBKC0-48 | T99.9 (h) | AUBKC0-24 | AUBKC0-48 | T99.9 (h) | AUBKC0-24 | AUBKC0-48 | ||
| 9 | 0.8 | >48 | 90.1 ± 2.8 | 158.0 ± 0.2 | >48 | 77.4 | 117.4 | >48 | 78.7 ± 2.7 | 124.9 ± 8.0 |
| 18 | 1.6 | 29 | 62.7 ± 3.1 | 78.5 ± 7.7 | >48 | 33.2 ± 1.9 | 44.8 ± 5.5 | 48 | 60.4 ± 0.7 | 94.0 ± 0.5 |
| 36 | 3.2 | >48 | 62.2 ± 2.0 | 90.2 ± 8.8 | 5 | 25.7 ± 0.9 | 26.0 ± 0.7 | 48 | 60.2 ± 4.2 | 78.9 ± 4.6 |
| 72 | 6.4 | 7 | 23.3 ± 6.6 | 38.8 ± 1.8 | 7 | 28.1 ± 2.2 | 38.3 ± 6.1 | 36 | 55.2 ± 3.9 | 77.2 ± 10.4 |
| 216 | 19.2 | 24 | 48.2 ± 0.5 | 59.8 ± 4.1 | 12 | 25.1 ± 1.1 | 32.3 ± 2.0 | 27 | 58.1 ± 3.4 | 73.1 ± 17.0 |
Against GPAC, the pattern of activity was similar to those against B. fragilis and C. perfringens. At an AUC/MIC of 9, there was a 1-log reduction in count at 24 h and a 1- to 2-log reduction at 48 h. Drug exposures producing AUC/MIC ratios of 18 to 216 all produced similar effects, namely, 2- to 3-log reductions in count at 24 h and 3- to 4-log drops at 48 h (Fig. 4; Table 2).
Sigmoid Emax curves were used to describe the relationship between AUC/MIC and antibacterial effect as measured for Δ24 for each anaerobe species. The curve fit was good in each case (Table 1). The maximum log CFU drop for both B. fragilis and C. perfringens was 3 to 4 logs, and for GPAC, the maximum drop was 2.5 logs. In each case, the AUC/MIC for a static effect was in the range 5 to 10, and the 99% effect was between 30 and 85 (Table 1). The AUC/MIC antibacterial effect relationship was similar if AUBKC0-24 was used as the antibacterial effect measure. The AUC/MICs for a 50% effect were 12.0, 14.5, and 7.6 for B. fragilis, C. perfringens, and GPAC, respectively.
The AUC0-48/MIC ratio was also related to Δ48 and the AUC0-48/MIC ratio for 50% effect (95% confidence intervals were 15.3 [9.4 to 24.9], 13.9 [9.8 to 19.7], and 6.7 [1.6 to 27.0] for B. fragilis, C. perfringens, and GPAC, respectively; r2 values were >0.89 for each species). The AUC0-48/MIC ratios for 48-h static effects, −2-log reductions in count, and −4-log reductions in count were as follows: 8.9, 19.1, and 89.1 for B. fragilis; 10.2, 17.8, and >432 for C. perfringens; and 3.6, 14.5, and >432 for GPAC.
Antibacterial effects: piperacillin-tazobactam and ertapenem.
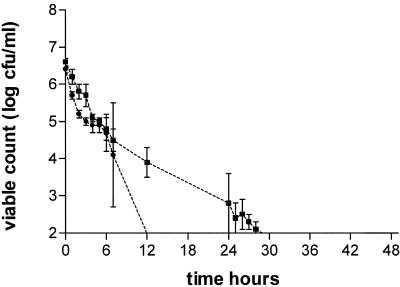
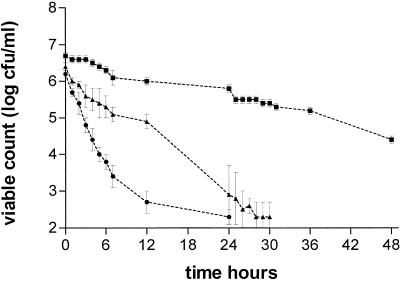
Piperacillin-tazobactam resulted in the clearance of B. fragilis and C. perfringens from the model by 24 h; however, it was not possible to sustain the growth of GPAC in the control experiments, indicating that this effect may be more related to increased washout linked to the higher pump speeds required to model drugs with shorter half-lives in in vitro systems (Fig. 5; Table 3). Therefore, a β-lactam with a longer half-life, i.e., ertapenem, was simulated. The growths of all three anaerobe strains were again possible. Ertapenem produced a 0.5- to 1-log reduction in the viable count of B. fragilis at 24 h and a 2-log reduction at 48 h (Fig. 6). When tested against C. perfringens, counts fell to almost undetectable levels (>4.5-log drop) at 24 h, and the same was observed with GPAC by 30 to 36 h (Fig. 6). The AUBKC0-24 and AUBKC0-48 were used to compare the antibacterial effects of ertapenem and moxifloxacin (AUC/MIC ratios of 18 to 216) against the three anaerobic strains. Against B. fragilis, moxifloxacin had significantly smaller AUBKC0-24 and AUBKC0-48 and caused greater drops in viable counts than ertapenem did (P < 0.001 all comparisons).
FIG. 5.
The antibacterial effects of piperacillin-tazobactam against B. fragilis (▪) and C. perfringens (•).
TABLE 3.
ABE of piperacillin-tazobactam and ertapenem on B. fragilis, C. perfringens, and GPAC at standard dose simulations
| Species | Agenta | ABE
|
|||||
|---|---|---|---|---|---|---|---|
| Δ12 (h) | Δ24 (h) | Δ36 (h) | Δ48 (h) | AUBKC0-24 (log CFU/ml · h) | AUBKC0-48 (log CFU/ml · h) | ||
| B. fragilis | Ertapenem | −0.7 ± 0.1 | −0.9 ± 0.1 | −1.4 ± 0.1 | −2.3 ± 0.1 | 82.5 ± 0.2 | 141.0 ± 2.0 |
| Pip-tazobactam | −2.6 ± 0.4 | −3.7 ± 0.8 | −4.6 ± 0.1 | −4.5 ± 0.2 | 38.2 ± 6.1 | 50.8 ± 5.2 | |
| C. perfringens | Ertapenem | −3.4 ± 0.4 | −3.9 ± 0.2 | −4.2 ± 0.1 | −4.1 ± 0.1 | 26.7 ± 1.5 | 26.7 ± 1.5 |
| Pip-tazobactam | −4.4 ± 0.1 | −4.4 ± 0.1 | −4.4 ± 0.1 | −4.4 ± 0.1 | 24.0 ± 2.0 | 24.0 ± 2.0 | |
| GPAC | Ertapenem | −1.5 ± 0.1 | −3.5 ± 0.8 | −4.4 ± 0.1 | −4.4 ± 0.1 | 40.5 ± 6.8 | 55.8 ± 6.6 |
Pip, Piperacillin.
FIG. 6.
Antibacterial effects of ertapenem against B. fragilis (▪), C. perfringens (•), and GPAC (▴).
Against C. perfringens, there was no significant difference in the AUBKC0-24, but AUBKC0-48 was significantly smaller with ertapenem (P < 0.05). Against GPAC, ertapenem had smaller AUBKC0-24 and AUBKC0-48 than moxifloxacin did (P < 0.05) (Table 3).
Emergence of resistance.
The PAP for B. fragilis, C. perfringens, and GPAC before and after 48 h of exposure to moxifloxacin at AUC/MIC ratios of 9 to 216 were compared. Before exposure to moxifloxacin, the three strains were nonheterogeneous in their PAP patterns: no resistant colonies were recovered on plates with MICs of >2. There was no evidence of emergence of resistance with any of the AUC/MIC ratios tested; even after 48 h of exposure to moxifloxacin, no resistant colonies were recovered from plates with MIC values of >2.
Monte Carlo analysis.
Moxifloxacin AUC distributions from 286 patients receiving 400 mg moxifloxacin in phase 1 studies were used (22). The mean AUC was 36.2 mg/liter, the 25th-percentile value was 29.4, the 75th-percentile value was 41.6, the minimum was 15.5, and the maximum was 75.5. Protein binding was taken as 41% (7). The free-drug AUC/MIC target was taken to be that for a static effect over 24 h, namely, 7.5. Target achievement at an MIC of 8 mg/liter was 0%; at 4 mg/liter, 7%; at 2 mg/liter, 91.1%; at 1 mg/liter, 99.5%; and at 0.5 mg/liter, 100%.
DISCUSSION
The selected strains of B. fragilis, C. perfringens, and GPAC had moxifloxacin MICs approximating reported MIC values at which 50% percent of the isolates tested were inhibited (MIC50) before the more recently reported emergence of fluoroquinolone resistance in Bacteroides spp. isolated in the United States (4, 8, 9). Hence, these strains represent the wild-type (non-antibiotic-exposed) population (www.eucast.org). Ertapenem MICs lie in the MIC50-to-MIC90 range and hence are probably representative (11, 16). The same is true for piperacillin-tazobactam, except in the case of the B. fragilis strain, which has an MIC over some reported MIC90s (11, 16). However, the results obtained with piperacillin-tazobactam in the in vitro model may be subject to bias due to the technical problems associated with comparing a drug with a short half-life with an agent with a long half-life by use of dilutional in vitro models (10).
This study shows that anaerobic conditions in themselves do not result in changes in the antibacterial effect of moxifloxacin, as evidenced by the use of E. coli as the target pathogen. The maximum antibacterial effects and the AUC/MIC ratios for various effects were similar in aerobic and anaerobic conditions. This builds on the earlier work of Wright et al. (24), who showed that levofloxacin, trovafloxacin, and moxifloxacin were rapidly bactericidal against staphylococci in an in vitro model, irrespective of aerobic or anaerobic growth conditions.
The moxifloxacin AUC/MIC-antibacterial effect relationships, whether measured by log changes in viable counts or areas under the bacterial-kill curve, differ depending on the use of the drug, i.e., against the anaerobes or against E. coli. First, the maximum drug effect is reduced such that even at high AUC/MIC exposures, the maximum pathogen clearance is a 2.5- to 3.7-log reduction in count. In addition, the AUC/MIC ratio required for a static or 50% effect is lower, so whereas the AUC/MIC ratio for a static effect with E. coli is 41 in anaerobic conditions, that for B. fragilis or C. perfringens is 7.6 and that for GPAC is 5.6. Previously, Ross et al. (17), working with B. thetaiotamicron and levofloxacin, sparfloxacin, and trovafloxacin in an in vitro model, showed that clearance occurred between 12 and 24 h with an AUC/MIC ratio of >50 and that regrowth to a count over the initial inoculum density occurred at AUC/MIC ratios of 1 to 4. An AUC/MIC ratio of 4 to 12 would have been associated with a net static effect over 24 h, had the investigators calculated this (17). These data correlate well with our own, which showed that an AUC/MIC ratio of 5.6 to 7.6 was related to a static effect against anaerobes and that the 99% effect occurred between 31.6 and 81.0.
Comparison of moxifloxacin to ertapenem, a drug with established clinical indications in anaerobic infection, indicated that it had a broad equivalence with moxifloxacin, which appeared to be superior to ertapenem against B. fragilis and exhibited superiority or equivalence against C. perfringens and GPAC. Although there are no other comparative data for moxifloxacin against anaerobes in in vitro models, moxifloxacin and another carbapenem, imipenem, showed equivalent outcomes in a murine mixed aerobic/anaerobic infection (18).
We were not able to show any emergence of resistance in the strains we used, unlike Ross et al. (17)—this is probably related to strain-to-strain differences, which are known to be important in some aerobic species (12).
Monte Carlo simulations using free-drug serum AUC values from phase 1 trials (22) indicate >90% target ascertainment, provided that MICs are <2 mg/liter. While it would be best to use AUC values from infected patients, building an adequate population pharmacokinetic model for moxifloxacin has proven difficult (H. Stass, personal communication). However, a pharmacodynamic breakpoint of 2 mg/liter is likely to divide the Bacteroides bacterial population, in which MICs range up to 128 mg/liter and the MIC90 may be 8 to 16 mg/liter (8, 14). Although detailed pharmacokinetic data are not available for trovafloxacin, the mean serum free-drug AUC/MIC50 ratio for Bacteroides spp. is in the range of 8 to 16 for a 200-mg 24-h dose (4, 14). This would indicate that with trovafloxacin, the average clinical AUC/MIC ratio for Bacteroides spp. is close to the AUC/MIC target defined in this model. Despite this and the implication that a large minority of patients would not reach the pharmacodynamic target, trovafloxacin was successful in clinical trials (5).
In conclusion, this study shows that the pharmacodynamics of moxifloxacin against anaerobic species differ from those against E. coli and that moxifloxacin and ertapenem have different but comparable antianaerobic activities in our in vitro pharmacokinetic model. As the AUC/MIC pharmacodynamic target divides the Bacteroides sp. MIC distribution, further data from pharmacodynamic animal models of infection and from human trials are needed to define the moxifloxacin antibacterial effect relationship. This is especially important, as an acute infection model is being used to predict a likely long-term effect of failed therapy, i.e., abscess formation (13).
Acknowledgments
We thank A. Dalhoff and E. Power for their encouragement and useful discussions surrounding the performance of these experiments.
Bayer-AG provided financial support.
REFERENCES
- 1.Andrews, J. 1999. Microbiological assays, p. 35-45. In D. S. Reeves, R. Wise, J. M. Andrews, and L. O. White (ed.), Clinical antimicrobial assays. Oxford University Press, Oxford, United Kingdom.
- 2.British Society for Antimicrobial Chemotherapy Working Party. 1991. A guide to sensitivity testing. BSAC, Birmingham, United Kingdom.
- 3.Brook, I., and J. D. Gillmore. 1993. In vitro susceptibility and in vivo efficacy of antimicrobials in the treatment of intraabdominal sepsis in mice. J. Antimicrob. Chemother. 31:393-401. [DOI] [PubMed] [Google Scholar]
- 4.Dalhoff, A., and F.-J. Schmitz. 2003. In vitro antibacterial activity and pharmacodynamics of new quinolones. Eur. J. Clin. Microbiol. Infect. Dis. 22:203-221. [DOI] [PubMed] [Google Scholar]
- 5.Donahue, P. E., D. L. Smith, A. E. Yellin, et al. 1998. Trovafloxacin in the treatment of intraabdominal infections: results of a double blind multicentre comparison with imipenem/cilistatin. Am. J. Surg. 197(Suppl. 6A):53-61. [Google Scholar]
- 6.Drusano, G. L. 2004. Antimicrobial pharmacodynamics: critical interactions of “bug and drug.” Nat. Rev. Microbiol. 2:289-300. [DOI] [PubMed] [Google Scholar]
- 7.European Medicines Agency. 2003. Summary of product characteristics—moxifloxacin hydrochloride 400mg tablets. European Medicines Agency, London, United Kingdom.
- 8.Golan, Y., L. A. McDermott, N. V. Jacobus, E. J. C. Goldstein, et al. 2003. Emergence of fluoroquinolone resistance among Bacteroides species. J. Antimicrob. Chemother. 52:208-213. [DOI] [PubMed] [Google Scholar]
- 9.Goldstein, E. J. C., D. M. Citron, C. V. Merriam, Y. Warren, and K. Tyrrell. 2000. Comparative in vitro activities of GAR-936 against aerobic and anaerobic animal and human bite wound pathogens. Antimicrob. Agents Chemother. 44:2747-2751. [DOI] [PMC free article] [PubMed] [Google Scholar]
- 10.Keil, S., and B. Wiedemann. 1995. Mathematical corrections for bacterial loss in pharmacodynamic in vitro dilutional models. Antimicrob. Agents Chemother. 39:1054-1058. [DOI] [PMC free article] [PubMed] [Google Scholar]
- 11.Livermore, D. M., M. W. Carter, S. Bagel, B. Wiedemann, F. Baquero, E. Loza, H. P. Endtz, N. van den Braak, C. J. Fernandes, L. Fernandes, N. Frimodt-Moller, L. S. Rasmussen, H. Giamarellou, E. Giamarellos-Bourboulis, V. Jarlier, J. Nguyen, C.-E. Nord, M. J. Struelens, C. Nonhoff, J. Turnidge, J. Bell, R. Zbinden, S. Pfister, L. Mixson, and D. L. Shungu. 2001. In vitro activities of ertapenem (MK-0826) against recent clinical bacteria collected in Europe and Australia. Antimicrob. Agents Chemother. 45:1860-1867. [DOI] [PMC free article] [PubMed] [Google Scholar]
- 12.MacGowan, A. P. 2003. Elements of design: the knowledge on which we build. Clin. Microbiol. Infect. 10(Suppl. 2):6-11. [DOI] [PubMed] [Google Scholar]
- 13.MacGowan, A. P., C. A. Rogers, H. A. Holt, and K. E. Bowker. 2003. Activities of moxifloxacin against, and emergence of resistance in, Streptococcus pneumoniae and Pseudomonas aeruginosa in an in vitro pharmacokinetic model. Antimicrob. Agents Chemother. 47:1088-1095. [DOI] [PMC free article] [PubMed] [Google Scholar]
- 14.Milatovic, D., F.-J. Schmitz, S. Brisse, J. Verhoeffand, and A. P. C. Fluit. 2000. In vitro activities of sitafloxacin and six other fluoroquinolones against 8,796 clinical bacterial isolates. Antimicrob. Agents Chemother. 44:1102-1107. [DOI] [PMC free article] [PubMed] [Google Scholar]
- 15.National Committee for Clinical Laboratory Standards 2000. Methods for dilution antimicrobial susceptibility test for bacteria that grow aerobically, 5th ed. Approved standard. NCCLS publication M7-A5. National Committee for Clinical Laboratory Standards, Wayne, Pa.
- 16.Pelak, B. A., D. M. Citron, M. Motyl, E. J. C. Goldstein, G. L. Woods, and H. Teppler. 2002. Comparative in vitro activities of ertapenem against bacterial pathogens from patients with acute pelvic infection. J. Antimicrob. Chemother. 50:735-741. [DOI] [PubMed] [Google Scholar]
- 17.Ross, G. H., D. H. Wright, L. B. Hovde, M. L. Peterson, and J. C. Rotschafer. 2001. Fluoroquinolone resistance in anaerobic bacteria following exposure to levofloxacin, trovafloxacin, and sparfloxacin in an in vitro pharmacodynamic model. Antimicrob. Agents Chemother. 45:2136-2140. [DOI] [PMC free article] [PubMed] [Google Scholar]
- 18.Schauman, R., R. Blatz, J. Beer, G. Ackermann, and A. C. Rodloff. 2004. Effect of moxifloxacin versus imipenem/cilastatin treatment on mortality of mice infected intravenously with different strains of Bacteroides fragilis and Escherichia coli. J. Antimicrob. Chemother. 53:318-324. [DOI] [PubMed] [Google Scholar]
- 19.Schentag, J. J., A. K. Meagher, and A. Forest. 2003. Fluoroquinolone AUIC breakpoints and the link to bacterial killing rates. Part 1: in vitro and animal models. Ann. Pharmacother. 37:1287-1298. [DOI] [PubMed] [Google Scholar]
- 20.Schentag, J. J., A. K. Meagher, and A. Forest. 2003. Fluoroquinolone AUIC breakpoints and the link to bacterial killing rates. Part 2: human trials. Ann. Pharmacother. 37:1478-1488. [DOI] [PubMed] [Google Scholar]
- 21.Solomkin, J. S., S. E. Wilson, N. V. Christou, et al. 2001. Result of a clinical trial of clinafloxacin versus imipenem/cilastatin for intra-abdominal infections. Ann. Surgery 233:79-87. [DOI] [PMC free article] [PubMed] [Google Scholar]
- 22.Stass, H., and A. Prove. 1999. Pharmacokinetic/pharmacodynamic estimates for the treatment of community-acquired respiratory tract infections with moxifloxacin. Clin. Microbiol. Infect. 5(Suppl. 5):292.11856271 [Google Scholar]
- 23.Thadepali, H., S. K. Chuah, U. Reddy, N. Hanna, R. Clark, R. J. Polzer, and S. Gollapudi. 1997. Efficacy of trovafloxacin for treatment of experimental Bacteroides infection in young and senescent mice. Antimicrob. Agents Chemother. 41:1933-1936. [DOI] [PMC free article] [PubMed] [Google Scholar]
- 24.Wright, D. H., B. W. Gunderson, L. B. Horde, G. H. Ross, K. H. Ibrahim, and J. C. Rotschafer. 2002. Comparative pharmacodynamics of three newer fluoroquinolones versus six strains of staphylococci in an in vitro model under aerobic and anaerobic conditions. Antimicrob. Agents Chemother. 46:1561-1563. [DOI] [PMC free article] [PubMed] [Google Scholar]
- 25.Zabinski, R. A., K. V. Bryan, A. J. Krinke, K. J. Walker, J. A. Moody, and J. C. Rotschafer. 1993. Evolution of activity of lemafloxacin against Bacteroides fragilis by an in vitro pharmacodynamic system. Antimicrob. Agents Chemother. 37:2454-2458. [DOI] [PMC free article] [PubMed] [Google Scholar]


