

ABSTRACT
Objective
Asthma affects about 10% of Canadian children, with significant impacts on the healthcare system. This study describes a cohort of children with asthma, exploring outcomes of targeted asthma education through a Community Pediatric Asthma Service (CPAS).
Methods
This retrospective cohort of children aged 1−17 years in Calgary, Alberta with asthma compares those who received CPAS 2016−2019 to the entire cohort. For CPAS recipients, rates of severe asthma exacerbations were evaluated biannually from 12 months before to 24 months after CPAS.
Results
Of 60,555 children with asthma, 3589 attended CPAS. Compared to the 56,966 controls, CPAS attendees were more likely to be male (60.2% vs. 58.4%), approximately 2 years younger at asthma diagnosis, and demonstrate poor asthma control (32.7% vs. 19.1% ED visits in the year following diagnosis). The incidence risk ratio (IRR) for asthma exacerbations for 2 years following CPAS was 0.85 (95% CI: 0.80−0.90). There was a reduction in ED visits (IRR: 0.82; 95% CI: 0.76−0.90) and oral steroid use (IRR: 0.86; 95% CI: 0.80−0.93). CPAS was not associated with reduced hospitalizations for asthma (IRR: 0.91; 95% CI: 0.68−1.22). A subset analysis demonstrated an 18‐month decrease in severe exacerbations for CPAS recipients (985) compared to propensity‐matched controls (985) that reached significance at 12−18 months with extinction of the positive CPAS effect by 2 years.
Conclusion
A targeted community asthma education service decreased severe exacerbations, with effect retention for at least 18 months. Educating children and their caretakers on asthma management thus provides an opportunity to improve pediatric lung health and should be considered for children at risk of asthma exacerbations.
Keywords: asthma, asthma education, asthma exacerbation, pediatric
1. Introduction
Asthma is a multifactorial chronic inflammatory airway disease with high and increasing global incidence and prevalence; and the most common chronic disease in children [1, 2]. It affects about 6.1 million children globally, extensively impacting quality of life, including morbidity, mortality, and social costs such as missed school and work days, and high healthcare system utilization [3, 4]. With effective management, most people with asthma have few disease symptoms and infrequent exacerbations. However, achieving and maintaining adequate asthma control can be challenging, especially in children. Focused asthma education for children and caregivers has a significant impact on asthma control and adherence to therapy, thus reducing the need for hospitalization and emergency department (ED) visits [5].
Community preventive asthma management programs improve outcomes and decrease the overall cost of care [6, 7, 8]. While there are successful examples of community asthma programs, some primarily or completely administered by allied health professionals, few present longitudinal data [9, 10, 11]. In 2001−2004, a pilot study in Calgary, Canada showed that targeted pediatric asthma education decreased ED visits and hospital days by 60% [12]. As a result, in 2005 the government‐funded Community Pediatric Asthma Service (CPAS) was initiated [7]. Since 2012, CPAS has provided asthma education for children in the greater Calgary area with mild to moderate asthma at risk of an exacerbation and their families. This retrospective population‐level analysis evaluates longer‐term effects of CPAS such as severe asthma exacerbations, using ED visits, hospitalizations, and oral corticosteroid (OCS) use as indicators. The primary outcome of this project was to assess the impact of CPAS asthma education on ED visits in the children with mild to moderate asthma and a risk of future severe exacerbations, based on presentation to the ED with an exacerbation as the catalyst for referral to the program. A secondary focus was a descriptive analysis of all pediatric asthma patients in the geographic region served by CPAS.
2. Methods
2.1. Study Design and Setting
This retrospective cohort study used population‐level administrative health data to evaluate the outcomes of a targeted asthma education program in the greater Calgary area. During the study, Calgary (population 1,392,609 [2016] to 1,481,806 [2021]) was the largest metropolitan area within the Canadian province of Alberta; 19% were between the ages of 1−17 [13]. Alberta residents have access to universal health care administered through a single‐payer system via Alberta Health Services, allowing for nearly universal capture of health care billing, which promotes accurate population‐level research.
2.2. Ethics Committee Approval
The study received research ethics approvals from the University of Alberta and University of Calgary Health Research Ethics Boards (Pro00114647) and adhered to the STrengthening the Reporting of OBservational studies in Epidemiology (STROBE) guidelines [14]. Informed consent was not required for accessing de‐identified population‐level data.
2.3. Study Population and Data Linkage
Children aged 1−17 years residing in the greater Calgary metropolitan area from January 2010 to December 2021 with a diagnosis of asthma, according to a validated case‐finding definition for asthma for administrative health data [15, 16], were included in the study. Briefly, patients with at least two medical visits with an asthma diagnosis in the first diagnostic field in a 2‐year period, or at least one hospital visit with a diagnosis of asthma ever in any diagnostic field, coded by the International Classification of Diseases (ICD), ninth or tenth revision (ICD‐9‐CM 493 or ICD‐10‐CA J45‐46) were included. The date of diagnosis was the date at which the patient met criteria [15].
Data for each child was linked across administrative data sets using unique personal healthcare identification numbers that are assigned to all residents of Alberta and recorded at all healthcare visits. To ensure anonymity, identification numbers were scrambled before the data was released. Information on physician billing, diagnostic codes, health care visits, and medication filled in Alberta pharmacies was available from 2010 forward. Information on CPAS participation extracted from the CPAS scheduling system was available from March 21, 2016 to June 28, 2022.
To ensure availability of data 1 year before and 2 years following CPAS, the cohort was restricted to children with an initial CPAS visit between March 21, 2016 and October 1, 2019, inclusively. Children with a first CPAS date occurring after their 18th birthday were excluded from the study.
Children who had not attended CPAS were included for comparison if:
-
a.
Their date of admission to the cohort was between January 1, 2010 and October 1, 2019, inclusively, and
-
b.
they were between 1 and 17 years of age at cohort admission, and
-
c.
the first three characters of their postal code matched the first three characters of the postal codes of children attending CPAS.
2.4. Data Availability Statement
Data access and linkage for this study were provided by Alberta Health Services. Inquiries about the data or data access can be sent to research.administration@ahs.ca.
2.5. Intervention: CPAS Versus Standard Care
The CPAS program is specifically designed to provide care for children age 18 months to 17 years with non‐urgent, mild asthma for education, development of a customized asthma action plan, and (for age ≥ 6 years), spirometry; younger children, those with severe or complex asthma or who are currently experiencing an exacerbation are referred to acute and/or specialty care based on their presentation [12]. Children who had a 1‐h session with a certified asthma educator through the CPAS program between 2016 and 2019 were identified using the CPAS electronic medical scheduling record. CPAS visits include taking an asthma history, spirometry for children ≥ 6 years old, verbal and electronic prescription review, device teaching, and providing a personalized written Asthma Action Plan. Visit results were reported to the primary care physician and referring physician. Patients are discharged from CPAS when asthma control meets Canadian guidelines for good control [17] and education deemed complete. If asthma control remains poor, or the patient meets “red‐flag” criteria including abnormal spirometry or features of a non‐asthma diagnosis, the CPAS asthma educator refers them to a pediatric respirologist for ongoing care. These patients were still considered in the CPAS cohort, since they were referred and had attended an appointment.
The control group consisted of children from the same region matched to the CPAS cohort based on the first three characters of their postal codes, who were diagnosed with asthma and received standard care without CPAS. Standard of care for pediatric patients with asthma depends on the practice and experience of their primary care provider; in Calgary, a visit with a certified asthma educator is generally not included.
2.6. Outcome Measures
The primary outcome was the sum of severe asthma exacerbations, defined as a composite asthma exacerbation score. The asthma exacerbation score was the sum of severe exacerbations (each represented by one or more of: ED visit, hospitalization or dispensation of OCS within each 6‐month period for 1 year before CPAS and 2 years after CPAS). ED visits for asthma were defined as asthma entered as the main diagnosis (i.e., ICD‐10 J45 or J46 the first diagnostic field) in emergency, acute, or urgent care data. Hospitalizations for asthma were defined as asthma recorded as the reason for hospitalization in the first diagnostic field (ICD‐10 J45 or J46). OCS prescriptions [15, 17] were identified from the Alberta Pharmaceutical Information Network data, a provincial repository of prescription dispensation data. The risk for duplicate recording of severe exacerbations was minimized by including only one of multiple ED visits and OCS prescriptions filled per 7‐day period, with an ED visit taking precedence over an OCS prescription. Secondary outcomes were the rates of asthma exacerbation indicators (ED visits, hospitalizations and OCS dispensation) before and after CPAS.
The severity of ED visits was evaluated based on the Canadian Triage and Acuity Scale (CTAS) score recorded at ED triage: a CTAS score of 1 was considered the highest level of acuity and 5 was considered the lowest. CTAS scores of 0 (patient deceased) and 9 (patient unconscious) were excluded since the attribution to asthma was unclear. Dispensation of asthma relievers such as short‐acting bronchodilators (SABA) and controller medications such as inhaled corticosteroids (ICS) within the first year of diagnosis (cohort entry) were recorded. Social and material deprivation were assessed based on the 2011 Pampalon index as the most deprived (quintile 1) to the least deprived (quintile 5) [18]. Neighborhood‐level family income was derived from 2011 census data as a proxy for socioeconomic status.
2.7. Statistical Analysis
Characteristics of the entire cohort were summarized using means and standard deviations for continuous data and frequencies and percentages for categorical data. To assess baseline differences between the comparison groups, unpaired t‐tests and Chi2 tests were used.
2.7.1. Pre/Post CPAS Analysis of the Cohort Who Received CPAS Education
Incidences of the number of significant asthma exacerbations and secondary outcomes (ED visits, hospitalizations, OCS dispensation) were calculated for 6‐month periods for children who attended CPAS. The 12‐ to 6‐month period before CPAS was used to represent pre‐intervention asthma control, since the incident (ED visit) resulting in CPAS referral typically occurred within the 6‐ to 0‐months of receiving the intervention. Post‐intervention incidences were calculated in 6‐month time windows for 2 years after the CPAS intervention by dividing the number of events per 6 months by the number of individuals per group. Temporal trends in incidence rate (IR) ratios (IRR) for each outcome were evaluated using Poisson regression analysis with time as the independent variable (reference: baseline) and the IR for each outcome as the dependent variable.
Statistical analysis was performed using Stata BE software version 17.0 (StataCorp LLC, College Station, TX, USA).
2.7.2. Propensity Score Matching
For propensity score estimation, logistic regression was used for its interpretability and verified credibility in clinical contexts [19]. Three alternative sets of covariates were considered to assess the robustness of treatment effect estimates to model specification. Following propensity score estimation, a 1:1 nearest neighbor matching without replacement using the estimated propensity was employed. This greedy matching approach utilizes a fixed treated group and iteratively selects the closest control unit based on propensity score distance, ensuring no control unit was reused. This setup aligns with the goal of estimating the Average Treatment effect on the Treated (ATT) [20] ATT is calculated was the average difference in outcomes between the treated group and the control group (ATT = mean [Treated]‐mean [Control]).
The degree of similarity between a treated individual and a potential control match in nearest neighbor matching was be constrained using a parameter known as a caliper to define the maximum allowable distance in propensity scores between matched subjects. If the distance between a treated and a control subject exceeds the caliper threshold, that potential control subject was discarded, and the algorithm searches for the next closest control within the allowed range. In this study, applying a caliper as a restriction to acceptable match distances resulted in poor match rates and worsened covariate balance, likely due to the exclusion of too many control subjects. Therefore, the final analysis was conducted without a caliper, instead prioritizing match completeness while still achieving acceptable balance through 1:1 nearest neighbor matching without replacement.
Covariates for Model 1 was selected based on statistical diagnostics and clinical relevance (Table 1). Additional variables were selected based on statistical criteria, including their contribution to improving model discrimination, as measured by the Area Under the Receiver Operating Characteristic Curve (AUC; Receiver Operating Characteristic curve ROC), balancing covariates (as reflected in Standardized Mean Differences, SMDs), and reducing potential confounding bias [19, 20, 21]. Considering three options helped ensure that the propensity score model was both meaningful and statistically robust [19, 20].
Table 1.
Groups of covariates tested for propensity score matching.
| Covariates | Model 1 | Model 2 | Model 3 |
|---|---|---|---|
| Sex | Y | Y | Y |
| Age at cohort entry | Y | Y | Y |
| OCS dispense 0−6 months before CPAS visit or equivalent offset for control cohort | Y | ||
| OCS dispense 6−12 months before CPAS visit or equivalent offset for control cohort | Y | Y | Y |
| ED visit 0−6 months before CPAS visit or equivalent offset for control cohort | Y | ||
| ED visit 6−12 months before CPAS visit or equivalent offset for control cohort | Y | Y | Y |
| Hospitalization 0−6 months before CPAS visit or equivalent offset for control cohort | Y | ||
| Hospitalization 6−12 months before CPAS visit or equivalent offset for control cohort | Y | Y | |
| Health care utilization 0−6 months before CPAS visit or equivalent offset for control cohort | Y | ||
| Health care utilization 6‐12 months before CPAS visit or equivalent offset for control cohort | Y | Y | |
| CTAS score 1−2 | Y | Y | Y |
| Reliever dispense 0−12 months before CPAS visit or equivalent offset for control cohort | Y | Y | |
| Controller dispense 0−12 months before CPAS visit or equivalent offset for control cohort | Y | Y |
Because the matching process was based on distance in propensity score space, standard scaling to the covariates was applied before estimating the propensity scores. This step ensured that variables measured on different scales did not influence the logistic regression model or the matching process, allowing for more reliable and interpretable matches. The quality of the propensity score model was assessed using the AUC, reflecting its ability to distinguish treated from control units. Covariate balance was examined using SMDs both before and after matching to ensure the comparability of groups. The overlap in propensity score distributions between treated and control groups was also visually inspected to assess common support and the feasibility of matching. Finally, the treatment effect was estimated using matched data, and the outcomes were categorized based on the statistical significance and direction of the effect (i.e., significant or near‐significant reductions or increases).
Propensity score‐matched comparisons using ATT were generated for ED visits, hospitalizations, health care utilization (based on all health care visits for asthma including community physician visits as well as ED visits and hospitalizations), and OCS prescription fills. Negative values of ATT suggested a reduction in the outcomes resulting from treatment and the positive values suggested the opposite. The time of initial CPAS visit was identified as time zero for comparison between CPAS and control cohorts.
To limit the potential impact of the COVID‐19 pandemic and subsequent public health precautions on comparing CPAS and matched control cohort members, only patients whose 24‐month analysis was completed by February 28, 2020, were included in the propensity score matching.
3. Results
3.1. Cohort Creation and Characteristics
Between January 1, 2010, and October 1, 2019, 60,555 children in the Calgary area met criteria for a diagnosis of asthma (Figure 1). Of these, 3589 were seen in CPAS and met study inclusion criteria. The remaining 56,966 children with asthma who lived within the same geographical area did not receive CPAS intervention during this period.
Figure 1.

Flowchart of pediatric asthma cohort creation.
Baseline characteristics for the entire cohort are shown in Table 2. Compared to the control group, children who attended CPAS were approximately 2 years younger at the time of asthma diagnosis, and more likely to be male and demonstrate outcome measures associated with poor asthma control.
Table 2.
Characteristics of the pediatric asthma cohort in Calgary, Canada.
| Characteristics | Overall (n = 60,555) | No referral (n = 56,966) | CPAS Referral (n = 3589) | p value | |
|---|---|---|---|---|---|
| Sex, male/female (%) | 35,421/25,134 (58.5/41.5) | 33,260/23,706 (58.4/41.6) | 2,161/1,428 (60.2/39.8) | 0.031 | |
| Mean age at asthma diagnosis, years (SD) | 7.73 (4.77) | 7.85 (4.80) | 5.83 (3.64) | < 0.001 | |
| Mean age at first CPAS visit | n/a | n/a | 8.12 (3.94) | n/a | |
| SES Social | 1st Quintile (%) | 15,255 (25.8) | 14,387 (25.9) | 868 (24.6) | 0.002 |
| 2nd Quintile (%) | 12,578 (21.3) | 11,738 (21.1) | 840 (23.8) | ||
| 3rd Quintile (%) | 11,565 (19.6) | 10,868 (19.6) | 697 (19.8) | ||
| 4th Quintile (%) | 10,556 (17.9) | 9956 (17.9) | 600 (17.0) | ||
| 5th Quintile (%) | 9145 (15.5) | 8627 (15.5) | 518 (14.7) | ||
| Missing, n | 1456 | 1390 | 66 | ||
| SES material | 1st Quintile (%) | 12,238 (20.7) | 11,465 (20.6) | 773 (21.9) | < 0.001 |
| 2nd Quintile (%) | 15,041 (25.5) | 14,050 (25.3) | 991 (28.1) | ||
| 3rd Quintile (%) | 11,559 (19.6) | 10,935 (19.5) | 724 (20.6) | ||
| 4th Quintile (%) | 8386 (14.2) | 7943 (14.3) | 443 (12.6) | ||
| 5th Quintile (%) | 11,875 (20.1) | 11,283 (20.3) | 492 (16.8) | ||
| Missing, n | 1456 | 1390 | 66 | ||
| Mean family income (SD), CAD | 55,873 (30,543) | 55,813 (30,830) | 56,812 (25,567) | 0.059 | |
| Patients with ED visits for asthma in the 1st year following diagnosis, n (%) | 12,034 (19.9) | 10,861 (19.1) | 1173 (32.7) | < 0.001 | |
| Total number of ED visits for asthma in the 1st year following diagnosis, n | 15,236 | 13,476 | 1760 | ||
| # Patients presenting to ED with CTAS = 1 (%) | 275 (1.8) | 225 (1.7) | 20 (2.9) | < 0.001 | |
| # Patients presenting to ED with CTAS = 2 (%) | 5700 (37.6) | 4787 (35.7) | 913 (52.0) | ||
| # Patients presenting to ED with CTAS = 3 (%) | 6560 (43.3) | 5901 (44.0) | 659 (37.6) | ||
| # Patients presenting to ED with CTAS = 4 (%) | 2402 (15.8) | 2276 (17.0) | 126 (7.2) | ||
| # Patients presenting to ED with CTAS = 5 (%) | 226 (1.5) | 219 (1.6) | 7 (0.4) | ||
| Patients hospitalized for asthma in 1st year following diagnosis, n (%) | 1325 (2.2) | 1145 (2.0) | 180 (5.0) | < 0.001 | |
| Total number of hospitalizations for asthma in the 1st year following diagnosis, n (rate/group) | 1422 (0.02) | 1230 (0.002) | 192 (0.05) | ||
Approximately one‐third (32.7%) of children in the CPAS group presented to the ED for asthma within the first year after meeting criteria for asthma diagnosis. This occurred more often than those without CPAS (19.1%, p < 0.001). Children in the CPAS group presented with greater acuity (CTAS 1 to CPAS: 2.9%, no CPAS: 1.7%; CTAS 2 to CPAS: 52.0%, no CPAS: 35.7%) and were more likely to be hospitalized in their first year after asthma diagnosis.
3.2. Indicators of Asthma Exacerbations before and after CPAS
A sharp rise in healthcare utilization for severe asthma exacerbations was seen during the 6 months immediately before CPAS (Figure 2a). This was expected as CPAS referrals were most often triggered by ED visits for asthma exacerbations. To account for this, the 12−6 months before CPAS was selected as the baseline time point when comparing IRR for indicators for asthma exacerbations before and after CPAS. The IR of asthma exacerbations declined from 185.0 per 1000 children at baseline to 98.1 per 1000 children at 18−24 months post‐CPAS. The IRR for asthma‐related healthcare utilization over the period was 0.85 (95% CI: 0.80−0.90, p < 0.001).
Figure 2.
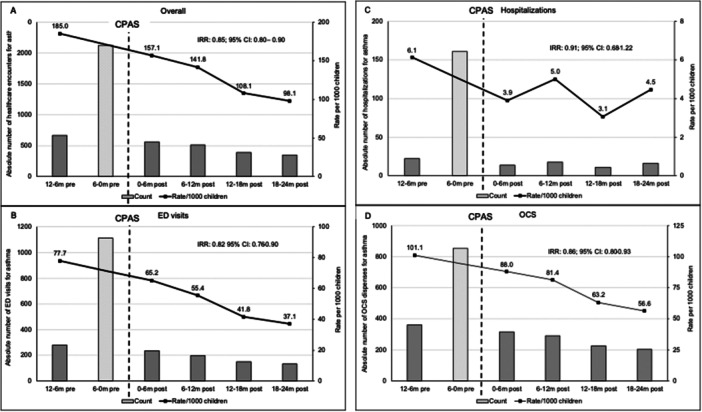
(A−D) Absolute numbers (left axis) and rates per 1000 children (right axis) of indicators of asthma exacerbations. A: Composite score; (B) ED visits; (C) hospitalizations; (D) OCS dispenses. 95% CI, 95% confidence interval; ED, emergency department; IRR, incidence rate ration; OCS, oral corticosteroids; m, months. The 6−0 m pre values are not included in IRR analysis.
The IR for ED visits for asthma exacerbation was 77.7 per 1000 children at baseline and declined to 37.1 per 1000 children at the last assessment period (Figure 2b). The overall IRR for ED visits for asthma over the baseline and 2 years post‐CPAS was 0.82 (95% CI: 0.76−0.90, p < 0.001).
The absolute number of hospitalizations for asthma exacerbations for all CPAS patients per 6 months was low (11−22) for all time points except in the 6‐ to 0‐months immediately before CPAS (161) (Figure 2C). While the trend of hospitalization rates decreased over time, it did not reach statistical significance (IRR: 0.91; 95% CI: 0.68−1.22, p = 0.353).
Figure 2D shows the absolute number of OCS dispenses and rates in OCS per 1000 children per 6 months over the assessment period. Compared to baseline, the rate of OCS dispenses was reduced from 101.1 to 88.0 per 1000 children post CPAS. Two years following CPAS, the rate of OCS dispenses was further reduced to 56.6 per 1000 children. The overall IRR for OCS was 0.86 (95% CI: 0.80−0.93, p < 0.001).
3.3. Selection of Covariates for Propensity Score Matching
The covariate combinations tested to identify the covariates that provided the most robust of three models tested for propensity score matching are shown in Table 1. In all three models, matching was evaluated with and without CTAS scores. The CTAS scores were not available for all cohort members, however because the propensity score AUC increased significantly by including this covariate, CTAS scores were included in propensity score matching. The control cohort for this analysis consisted of 9748 patients and the CPAS cohort 985 patients.
Age, sex and OCS dispense or ED visit in the 12−6 months preceding time zero (first CPAS visit or equivalent time from meeting criteria for an asthma diagnosis for the control cohort) are the only parameters considered in Model 1. This resulted in an AUC of 0.63; suggesting that insufficient covariates were included to reliably distinguish between treated and control groups. Model 2, which added hospitalizations and healthcare utilization in the 6−12 months and reliever and controller (ICS) dispenses before time zero demonstrated an AUC of 0.68, which still did not provide sufficient distinction between treated and control groups. Model 3 (Table 1), which added the same covariates in the 6‐ to zero months before time zero to Model 2 (12−6‐month period only), increased the AUC value to 0.8, demonstrating an improvement in the estimation of the propensity score that allowed for better distinction between the treated and control group. Thus, Model 3 was selected for analysis.
3.4. Comparison of CPAS‐Treated and Propensity Matched Control Cohorts
Health care utilization for asthma and markers of severe exacerbation including ED visits, hospitalizations and OCS prescriptions demonstrated a decreasing trend over the first 18 months after the first CPAS visit, compared with propensity‐matched controls (Figure 3). However, only healthcare utilization at 12 and 18 months, ED visits at 18 months and OCS prescription at 12 and 18 months reached significance. In all cases, the distinction between the CPAS and control cohorts was lost by 24 months.
Figure 3.

Average treatment effect (ATT) and 95% confidence intervals (error bars) for (A) overall healthcare utilization, (B) emergency department visits, (C) hospitalization, and (D) oral corticosteroid dispenses among children attending CPAS compared to a propensity‐matched control cohort at 6 months, 12 months, 18 months, and 24 months after CPAS entry. *Indicates statistical significance.
4. Discussion
This study evaluated a pediatric community asthma education program in 3589 children in the greater Calgary, Alberta, region between 2016 and 2019. Following the 2 years after the intervention, rates of severe asthma exacerbations were reduced, driven mainly by a reduction in ED visits and OCS rates. In a subset of patients that were propensity matched to children with asthma but who did not receive CPAS, markers of exacerbations were reduced up to 18 months post‐CPAS. These results indicate that CPAS is of benefit to children with asthma and presents an opportunity to improve pediatric lung health.
Pediatric asthma is common; preventive management is an attractive healthcare intervention with the potential to improve the wellbeing of up to 10% of the Canadian pediatric population (any children with asthma) and offset financial and resource costs to overloaded healthcare systems. Identifying a patient population that can safely receive benefits from an asthma educator led program is important. The CPAS referral base is drawn from children who have a significant exacerbation requiring emergency care or, occasionally, hospitalization, where care provided by a nurse or respiratory therapist asthma educator, in partnership with their primary healthcare provider, is anticipated to provide safe and adequate asthma care. The CPAS referral algorithm directs children with severe asthma or who have had a hospitalization requiring intervention beyond systemic steroid and low‐flow oxygen support or PICU admission to a pediatric respirologist or pediatrician with a special interest in asthma. This distinction distinguishes CPAS from other pediatric asthma interventions reported in the literature, where programs may focus on other patient demographics.
Patients referred for asthma education in the CPAS cohort were younger than the control group and presented with greater asthma exacerbation severity. This could be due to selection bias as the referral base was mainly from the pediatric ED. Patients who may have presented with severe asthma were less likely to receive CPAS referral, as their safe and adequate care would be triaged to evaluation by a pediatrician or pediatric respirologist.
Our pre/post‐intervention assessment of the CPAS intervention looked at a 2‐year impact of timely post‐exacerbation asthma education for the subset of children with mild to moderate asthma who required ED evaluation and/or hospitalization for exacerbations. In keeping with this referral base, an increase in ED visits 6 months before the first CPAS visit was noted. In addition, children referred to CPAS were more likely to present with higher acuity at ED triage than children who were not referred. As such, to avoid overestimating poor asthma control in CPAS patients, we used the 1 year to 6 months before CPAS referral rather than the 6 months immediately before CPAS evaluation to describe baseline asthma control.
The reduction in healthcare utilization after asthma education in this study are consistent with a pre‐CPAS pilot project that reported increased caregiver confidence, improved asthma‐related quality of life, and fewer severe asthma exacerbations after asthma education for approximately 160 preschoolers who had experienced an asthma exacerbation [7]. Our results are also in keeping with the existing literature surrounding asthma education; in a meta‐analysis, Liu et al. [3], found that asthma education in other settings evaluating children with asthma consistently reduced hospital admissions, ED visits and outpatient clinic visits.
Patients had to meet specific criteria for referral to the CPAS program, thus introducing selection bias to our total asthma cohort. To overcome this bias, we used propensity score matching to identify a control cohort for comparison with the CPAS cohort. Similarly to the pre/post CPAS cohort analysis, comparison of propensity‐matched control subjects to the CPAS cohort showed a trending decrease in severe asthma exacerbations (ED visits, hospitalizations and OCS prescriptions) that reached significance at 12−18 months after the first CPAS visit, although the effect was lost by 24 months post‐intervention. This loss of effect was not due to an increase in severe asthma exacerbations by 24 months post‐intervention; instead, it represented a decrease in severe exacerbations in the control as well as the CPAS cohort in that time frame. There are several possible reasons for this trend. In general, asthma exacerbations that are brought to medical attention are more common in younger age groups, and children with mild to moderately severe asthma, who likely represent the majority of this cohort, often show improved asthma control over time [1, 22, 23].
A retrospective chart review by Krupp et al. [24] reported similar findings from a specialized pediatric high risk asthma clinic. Asthma outcomes after referral to this clinic included consistent decreases in hospitalizations, ED visits, and significant cost savings, with the most obvious decreases evident for hospitalizations. Furthermore, a greater improvement in asthma outcomes was reported following an expansion of their clinic. Although these findings are in keeping with our study, their pediatric high risk asthma clinic not only included asthma education from an asthma educator, but also a social worker who was responsible for addressing barriers to care, referrals to other community resources, and motivational interviewing. Their study inclusion criteria describe a population with more severe asthma than the CPAS cohort, likely explaining the lower hospitalization rate we noted, and CPAS does not offer social work or other supports. Children with severe asthma are referred to a pediatric respirologist at our site and would not be captured by the CPAS study.
Cabana et al. [25] explored associations between pediatric ED visits for asthma and outpatient follow‐up. They found that 66% of children with an ED asthma visit did not complete an outpatient asthma follow‐up within 30 days. However, those that did have follow‐up visits within 30 days of an ED visit had an increased likelihood of a repeat ED asthma visit within 1 year. Follow‐up visits were based on billing codes only; no specific asthma education intervention was documented in this study. This suggests that simply having a patient return for asthma follow‐up does not guarantee improved outcomes. While these results suggest that asthma education may be the important difference between this study and educational intervention studies, including CPAS, other potential explanations include a possible selection bias where patients with more severe asthma would be more likely to attend follow‐up. Since the CPAS framework specifically selects patients whose future exacerbation risk can be safely managed by an educator, the motivation to attend may have been different than in the Cabana et al. [25] study.
Multiple implementation strategies for community asthma education programs are reported in the literature. For instance, several Australian communities trained pharmacists to provide education and demonstrated improved asthma control [26, 27]. There were no significant barriers to recruiting and training local providers even at remote/rural sites, and service was provided across a large, mixed urban and rural demographic similar to Canadian populations. A study by Plaza et al. [28] on adults with asthma suggests that even “simplified” educational interventions can be effective if they offer essential elements such as information on asthma management, a personalized asthma action plan, and training on proper inhaler technique. These findings support the premise that it is educational intervention specifically and not follow‐up alone that mitigates future exacerbation risk.
Aside from improvements in asthma outcomes, community asthma education programs also generate significant cost savings. Bhaumik et al. [29] performed a cost‐analysis study of an urban community asthma initiative (CAI) that demonstrated a significant 3‐year cost reduction for CAI patients over comparison groups, mostly attributed to reduced hospitalization costs. However, no reductions were found in ED costs for this intervention. In addition to cost savings, CAI participants reported significant quality of life improvements including fewer missed school and caregiver workdays. The CAI program provided more community support and addressed a more marginalized population than CPAS, which may explain the difference between interventions, where CPAS did significantly decrease ED rates, and CPAS patient hospitalization numbers were too low for significant findings.
Despite differences between reported interventions, ultimately, community asthma education programs demonstrate a clear improvement in asthma outcomes. Given that hospitals and emergency rooms are increasingly overwhelmed [30], proactive initiatives to improve preventative health maintenance and reduce their use can alleviate this load, with the additional benefit of improved health outcomes for individuals [1].
4.1. Strengths and Limitations
Alberta, Canada uses a government‐funded centralized health system, minimizing the potential to miss healthcare visits for asthma by capturing all inpatient, ED, urgent care, and physician office billings in the province. A major strength of the study is longitudinal data that allowed for individual patients to be followed for 1 year before the intervention, to look before the event that triggered referral and gain background information on asthma control, and a 2‐year post‐intervention assessment to examine whether the effect of asthma education was maintained. Medication purchase data is not complete, although pharmacy participation in the reporting system increased over the study period. Thus, the number of severe exacerbations requiring OCS without an ED visit is likely underestimated. Pitfalls in using administrative data include reliance on uniform use of billing codes to capture visits, which are addressed to some extent by adopting validated measures for defining the asthma cohort and visits [15, 16].
CPAS referral criteria were designed to select for patients at risk of additional severe exacerbations but not likely to require pediatrician or pediatric respirology evaluation, thus introducing selection bias; this also likely limited the number of patients requiring hospitalization. Due to the differences between the CPAS intervention and non‐intervention group (no CPAS referral), we used both a before and after study design with the CPAS group and propensity score matching to identify a control group that was sufficiently similar to the CPAS cohort for robust statistical analysis. The number of patients analyzed were decreased for three reasons: (1) limiting the data to account for the pandemic period; (2) the limited information for CTAS scores, which were not available for all patients and (3) the limited CPAS cohort in comparison to the control cohort; only 985 CPAS patients had CTAS scores available, so 985 propensity matched controls were selected. The lower number of eligible participants in the propensity matching study likely impacted the power of the analysis to identify significant trends. While the propensity‐matched cohorts were restricted to dates before the start of the COVID‐19 pandemic, the main analysis of the study captured follow‐up data until 2021. As healthcare utilization rates may have been impacted by the COVID‐19 pandemic, this is an important consideration for data interpretation. Because CPAS was only available in the Calgary area, the study has limited generalizability; in particular, only an urban site with access to tertiary care was reflected. Based on this data, future iterations of CPAS that provide asthma education in rural and remote populations—arguably a group that could benefit significantly from this type of intervention—are currently being proposed. Another limitation of the study is that the pre‐post retrospective analysis may have perpetuated the existing selection bias, although the propensity‐matched control cohort that was designed to address this concern demonstrated similar findings.
5. Conclusion
In pediatric patients with poorly controlled asthma, based on a recent ED visit or hospitalization for asthma exacerbation, whose presentation was not severe enough to warrant respirologist evaluation, targeted personalized education with a certified asthma educator reduced ED visits and severe exacerbations. The effect was persistent over 2 years after the intervention. This model presents an opportunity to improve health outcomes in children with asthma.
Author Contributions
Linn E. Moore: conceptualization, investigation, writing – original draft, methodology, writing – review and editing, formal analysis, data curation, supervision, visualization. Manizheh Ghaemidizaji: methodology, validation, visualization, formal analysis, writing – review and editing. Caseng Zhang: investigation, formal analysis, writing – review and editing, writing – original draft, funding acquisition. Florence Birru: writing – original draft, writing – review and editing. David W. Johnson: conceptualization, methodology, writing – review and editing, resources. Karen Kam: writing – review and editing, resources, conceptualization. Laleh Behjat: investigation, methodology, validation, supervision, writing – review and editing. Anne Hicks: conceptualization, investigation, funding acquisition, writing – original draft, methodology, writing – review and editing, supervision, resources, project administration.
Conflicts of Interest
The authors declare no conflicts of interest.
Acknowledgments
We would like to thank Shirley van de Wettering, director of CPAS until 2023, and Kathy Courtney, lead CPAS educator until May 2025, for their support throughout the project and for sharing their understanding of the CPAS program, and Taranpreet Kaur (Alberta Health Services) for data acquisition and linkages. We would also like to thank the Alberta Children's Hospital Health Research Institute for supporting the project by providing data. L.M. received partial salary funding of $10,000 CD from the Alberta Health Services Respiratory Health Strategic Clinical Network. C.Z. received partial salary funding of $3,000 through the Alberta Respiratory Center Dean Befus Summer Studentship. A.H. receives protected time for research through her Tier 2 Canada Research Chair in Children's Lung Health.
Moore L. E., Ghaemidizaji M., Zhang C., et al., “Impacts of Community Pediatric Asthma Education Program on Asthma Outcomes in Alberta, Canada,” Pediatric Pulmonology 60 (2025): 1‐11, 10.1002/ppul.71326.
Institutions: The primary institution where this study was conducted was the University of Alberta, with collaborators at the University of Calgary and Ottawa University.
Prior presentation: Early partial findings of this research were presented at the Alberta Respiratory Center Annual Research Day in November 2023 by F.B. There is no published abstract for this presentation.
Data Availability Statement
The data that support the findings of this study are available from Alberta Health Services. Restrictions apply to the availability of these data, which were used under license for this study. Data are available from the authors with the permission of Alberta Health Services.
References
- 1. Ismaila A. S., Sayani A. P., Marin M., and Su Z., “Clinical, Economic, and Humanistic Burden of Asthma in Canada: A Systematic Review,” BMC Pulmonary Medicine 13 (2013): 70, 10.1186/1471-2466-13-70. [DOI] [PMC free article] [PubMed] [Google Scholar]
- 2. Sears M. R., “Trends in the Prevalence of Asthma,” Chest 145 (2014): 219–225, 10.1378/chest.13-2059. [DOI] [PubMed] [Google Scholar]
- 3. Liu W.‐Y., Jiesisibieke Z. L., and Tung T.‐H., “Effect of Asthma Education on Health Outcomes in Children: A Systematic Review,” Archives of Disease in Childhood 107 (2022): 1100–1105, 10.1136/archdischild-2021-323496. [DOI] [PMC free article] [PubMed] [Google Scholar]
- 4. Kearney J., Everson L., Coppel J., et al., “Incorporating Medical Students into School‐Based Asthma Education Improves Asthma Knowledge in Children,” Journal of Asthma 58 (2021): 1407–1413, 10.1080/02770903.2020.1784193. [DOI] [PubMed] [Google Scholar]
- 5. Liu C. and Feekery C., “Can Asthma Education Improve Clinical Outcomes? An Evaluation of a Pediatric Asthma Education Program,” Journal of Asthma 38 (2001): 269–278, 10.1081/JAS-100000114. [DOI] [PubMed] [Google Scholar]
- 6. Woods E. R., Bhaumik U., Sommer S. J., et al., “Community Asthma Initiative: Evaluation of a Quality Improvement Program for Comprehensive Asthma Care,” Pediatrics 129 (2012): 465–472, 10.1542/peds.2010-3472. [DOI] [PubMed] [Google Scholar]
- 7. Ford A., Little C., Bronconnier C., et al., “The Community Pediatric Asthma Service—Together We'Re Better: Asthma Care in the Calgary Zone,” Canadian Journal of Respiratory Therapy 54 (2018): 77–82, 10.29390/cjrt-2018-015. [DOI] [PMC free article] [PubMed] [Google Scholar]
- 8. Clark N. M., Feldman C. H., Evans D., Levison M. J., Wasilewski Y., and Mellins R. B., “The Impact of Health Education on Frequency and Cost of Health Care Use by Low Income Children With Asthma,” Journal of Allergy and Clinical Immunology 78 (1986): 108–115, 10.1016/0091-6749(86)90122-3. [DOI] [PubMed] [Google Scholar]
- 9. Rachelefsky G. S., “Review of Asthma Self‐Management Programs,” Journal of Allergy and Clinical Immunology 80 (1987): 506–511, 10.1016/0091-6749(87)90087-X. [DOI] [PubMed] [Google Scholar]
- 10. Wigal J. K., Stout C., Brandon M., et al., “The Knowledge, Attitude, and Self‐Efficacy Asthma Questionnaire,” Chest 104 (1993): 1144–1148, 10.1378/chest.104.4.1144. [DOI] [PubMed] [Google Scholar]
- 11. Boulet L.‐P., Chapman K. R., Green L. W., and FitzGerald J. M., “Asthma Education,” Chest 106 (1994): 184S–196S, 10.1378/chest.106.4Supplement.184S. [DOI] [PubMed] [Google Scholar]
- 12. van de Wetering S., Little C., Courtney K., et al., Community Pediatric Asthma Service Together We're Better: Asthma Care in the Calgary Zone (Calgary, 2017). [DOI] [PMC free article] [PubMed] [Google Scholar]
- 13. Government of Canada SC . Census of Population [Internet]. 2001, accessed August 2, 2024, https://www12.statcan.gc.ca/census-recensement/index-eng.cfm.
- 14. Cuschieri S., “The Strobe Guidelines,” Saudi Journal of Anaesthesia 13 (2019): 31, 10.4103/sja.SJA_543_18. [DOI] [PMC free article] [PubMed] [Google Scholar]
- 15. To T., Dell S., Dick P. T., et al., “Case Verification of Children With Asthma in Ontario,” Pediatric Allergy and Immunology 17 (2006): 69–76, 10.1111/j.1399-3038.2005.00346.x. [DOI] [PubMed] [Google Scholar]
- 16. Li P., To T., and Guttmann A., “Follow‐Up Care After an Emergency Department Visit for Asthma and Subsequent Healthcare Utilization in a Universal‐Access Healthcare System,” Journal of Pediatrics 161 (2012): 208–213.e1, 10.1016/j.jpeds.2012.02.038. [DOI] [PubMed] [Google Scholar]
- 17. Yang C. L., Hicks E. A., Mitchell P., et al., “Canadian Thoracic Society 2021 Guideline Update: Diagnosis and Management of Asthma in Preschoolers, Children and Adults,” Canadian Journal of Respiratory, Critical Care, and Sleep Medicine 5 (2021): 348–361, 10.1080/24745332.2021.1945887. [DOI] [Google Scholar]
- 18. Pampalon R., Hamel D., Gamache P., and Raymond G., “A Deprivation Index for Health Planning in Canada,” Chronic Diseases in Canada 29 (2009): 178–191, 10.24095/hpcdp.29.4.05. [DOI] [PubMed] [Google Scholar]
- 19. Reiffel J. A., “Propensity Score Matching: The ‘Devil Is in the Details’ Where More May be Hidden Than You Know,” American Journal of Medicine 133 (2020): 178–181, 10.1016/j.amjmed.2019.08.055. [DOI] [PubMed] [Google Scholar]
- 20. Austin P. C., “An Introduction to Propensity Score Methods for Reducing the Effects of Confounding in Observational Studies,” Multivariate Behavioral Research 46 (2011): 399–424, 10.1080/00273171.2011.568786. [DOI] [PMC free article] [PubMed] [Google Scholar]
- 21. Wei D., Johnston S., Patkar A., and Buell J. F., “Comparison of Clinical and Economic Outcomes Between Minimally Invasive Liver Resection and Open Liver Resection: A Propensity‐Score Matched Analysis,” HPB: The Official Journal of the International Hepato Pancreato Biliary Association 23 (2021): 785–794, 10.1016/j.hpb.2020.09.017. [DOI] [PubMed] [Google Scholar]
- 22. Canadian Institute for Health Information , Asthma Hospitalizations Among Children and Youth in Canada: Trends and Inequalities. [Internet] (CIHI, 2018), https://www.cihi.ca/sites/default/files/document/asthma-hospitalization-children-2018-chartbook-en-web.pdf. [Google Scholar]
- 23. Rosychuk R. J., Voaklander D. C., Klassen T. P., Senthilselvan A., Marrie T. J., and Rowe B. H., “Asthma Presentations by Children to Emergency Departments in a Canadian Province: A Population‐Based Study,” Pediatric Pulmonology 45 (2010): 985–992, 10.1002/ppul.21281. [DOI] [PubMed] [Google Scholar]
- 24. Krupp N. L., Weist A., Fiscus C. D., et al., “Efficacy, Cost Effectiveness, and Sustainability of a Pediatric High Risk Asthma Clinic,” Pediatric Pulmonology 53 (2018): 538–543, 10.1002/ppul.23967. [DOI] [PubMed] [Google Scholar]
- 25. Cabana M. D., Bruckman D., Bratton S. L., Kemper A. R., and Clark N. M., “Association Between Outpatient Follow‐Up and Pediatric Emergency Department Asthma Visits,” Journal of Asthma 40 (2003): 741–749, 10.1081/JAS-120023499. [DOI] [PubMed] [Google Scholar]
- 26. Armour C., Bosnic‐Anticevich S., Brillant M., et al., “Pharmacy Asthma Care Program (PACP) Improves Outcomes for Patients in the Community,” Thorax 62 (2007): 496–592, 10.1136/thx.2006.064709. [DOI] [PMC free article] [PubMed] [Google Scholar]
- 27. Armour C. L., Reddel H. K., Lemay K. S., et al., “Feasibility and Effectiveness of an Evidence‐Based Asthma Service in Australian Community Pharmacies: A Pragmatic Cluster Randomized Trial,” Journal of Asthma 50 (2013): 302–309, 10.3109/02770903.2012.754463. [DOI] [PubMed] [Google Scholar]
- 28. Plaza V., Peiró M., Torrejón M., et al., “A Repeated Short Educational Intervention Improves Asthma Control and Quality of Life,” European Respiratory Journal 46 (2015): 1298–1307, 10.1183/13993003.00458-2015. [DOI] [PubMed] [Google Scholar]
- 29. Bhaumik U., Sommer S. J., Giller‐Leinwohl J., et al., “Boston Children's Hospital Community Asthma Initiative: Five‐Year Cost Analyses of a Home Visiting Program,” Journal of Asthma 54 (2017): 134–142, 10.1080/02770903.2016.1201837. [DOI] [PubMed] [Google Scholar]
- 30. Chao Y.‐S. and Li Y.. Emergency Department Overcrowding: Utilization Analysis.
Associated Data
This section collects any data citations, data availability statements, or supplementary materials included in this article.
Data Availability Statement
Data access and linkage for this study were provided by Alberta Health Services. Inquiries about the data or data access can be sent to research.administration@ahs.ca.
The data that support the findings of this study are available from Alberta Health Services. Restrictions apply to the availability of these data, which were used under license for this study. Data are available from the authors with the permission of Alberta Health Services.