

Abstract
Accurately predicting excited-state absorption (ESA) spectra is crucial for interpreting transient absorption spectroscopy (TAS) features, but it remains a challenge for electronic structure theory. Various density- and wave function-based methods can be used to predict ESA spectra, yet they often struggle to simultaneously achieve accuracy, computational efficiency, and molecular-orbital-based chemical intuition. This work presents a balanced approach for predicting ESA spectra (LR-TDA/ΔSCF) by combining the maximum overlap method (MOM) and Δ self-consistent-field (ΔSCF) with the linear-response Tamm-Dancoff approximation (LR-TDA). LR-TDA/ΔSCF captures excited-state orbital relaxation while preserving the computational efficiency and interpretability of standard LR-TDA calculations. Applying LR-TDA/ΔSCF to excited states of interest enables the mapping of TAS features to electronic and/or geometric species. Here, we benchmark LR-TDA/ΔSCF against femto- and nanosecond TAS data for three chromophores: azobenzene, a BODIPY derivative, and a zinc porphyrin complex. The results demonstrate that LR-TDA/ΔSCF can reproduce the experimental ESA spectra with good accuracy, even when neglecting vibronic effects and attempting to describe multiconfigurational excited states with a single Slater determinant. LR-TDA/ΔSCF offers an accurate and cost-effective approach that enables the assignment of TAS spectral features to particular species and transitions, making it a powerful tool for elucidating photochemical and photophysical mechanisms.

1. Introduction
Predicting ground-state absorption spectra (e.g., S 0 → S n and T 0/T 1 → T n ) with density- or wave function-based methods presents several challenges due to the complex interplay of electronic structure, solvation effects, and electron correlation. While methods like linear-response time-dependent density functional theory (LR-TDDFT) − have been quite successful at predicting excitation energies and oscillator strengths from a ground-state reference, their accuracy is sensitive to the choice of functional, basis set, and the treatment of electron correlation. , Additionally, since much of molecular photochemistry and photophysics occurs in solution, accurately modeling solvation effects is crucial. Implicit solvent models, such as the Conductor-like Polarizable Continuum Model (CPCM) and the Solvation Model based on Density (SMD) offer computational efficiency but often fail to capture important solute–solvent interactions, e.g., ion-dipole and dipole–dipole. Moreover, accurately describing excited states often requires accounting for multiple electron excitations (e.g., double, triple, etc.) and multiconfigurational character, i.e., cannot be described by a single Slater determinant, particularly in systems with significant electron correlation. As a result, nonexpert users or those studying large molecules often rely on black-box methods like LR-TDDFT and its approximations for their efficiency and ease of use.
These challenges are even more pronounced when predicting excited-state absorption spectra (e.g., S n → S m and T n → T m ). Unlike ground-state absorption, excited-state transitions often involve higher-order excitations, , spin-state mixing, and nonequilibrium excited-state geometries, making them significantly more complex to model. Consequently, LR-TDDFT or LR-TDA in the expectation value formalism , may provide less accurate descriptions of these systems. To improve the accuracy of excited-state properties, quadratic response TDDFT (QR-TDDFT) CASPT2 , and CC-based , (e.g., CCS, CC2, CCSD, CCSDR(3), and CC3) methods are often used, ,,− though they come with significant computational costs. LR-TDDFT and QR-TDDFT yield excited-state absorption spectra that align reasonably well with EOM-CC3, ADC(3), and RASPT2, despite the latter’s higher computational cost. , When transitions and oscillator strengths are combined, the overall spectral profiles and orbital contributions remain consistent across methods, aside from systematic energy shifts. Excited-state absorption spectra can also be predicted via real-time TDDFT (RT-TDDFT) propagation with an excited-state density obtained from linear-response TDDFT gradients, which calculates the linear response of the excited state rather than the quadratic response from the ground state, or with second linear response theory (SLR) , at double the cost of LR-TDDFT. Unfortunately, neither of these DFT- based methods has gained widespread adoption, particularly within the photochemistry and photophysics community.
Instead, molecular orbital-level insight into structure–function-dynamics relationships in photochemical systems is often obtained from ab initio excited-state calculations. While ground-state methods often provide a reasonable description of UV–vis absorption spectra, analysis of transient absorption spectroscopy (TAS) requires accurate prediction of excited-state absorption spectra. TAS is a powerful pump–probe technique that measures changes in absorption as a function of wavelength and time. TAS has been employed to study systems ranging from photoswitches to photoredox catalysts. In photoredox systems, spectro-electrochemistry yields spectra of key intermediates that can be used to fit time-resolved features and support mechanistic interpretations. Because it is difficult to generate excited-state absorption spectra for isolated states experimentally, species-associated difference spectra (SADS) cannot be used to fit TAS data that are mostly comprised of excited state absorption features. As a result, global lifetime analysis (GLA) of TAS is often employed to produce decay-associated difference spectra (DADS), separating transient signals into components with distinct lifetimes. However, despite the utility of GLA, assigning specific excited-state spectral features to individual processes or species remains challenging, particularly without reliable theoretical predictions of energies and oscillator strengths for energetically and spin-accessible states below the initial excited state(s).
In response theory, there are two ways to think of an excited-state absorption spectrum, either as an excitation of the excited-state electronic structure or as a double excitation of the ground state. QR-TDDFT methods take advantage of directly calculating double residues from the ground state to predict excited-state absorption features. This allows excited-state polarizabilities to be calculated in a similar fashion as oscillator strengths. Comparison of QR energies and oscillator strengths for a range of functionals reveals that CAM-B3LYP provides the most accurate QR-TDDFT excited state absorption spectra compared to EOM-CCSD and QR-CCSD. One would expect LR and QR to predict identical results in the full configuration interaction limit but diverge for approximate wave functions. However, for multiconfigurational wave functions, enlargement of the active space leads to mutual convergence between the LR and QR approaches. For density representations, LR-TDDFT and TDA excited state spectra are in good agreement with QR predictions for large oligofluorenes. In fact, both LR-TDDFT and QR-TDDFT predict the same first seven absorption features at the same energies. The QR and LR oscillator strengths are similar, however the QR values are lower than the LR for low energy transitions and higher for higher energy transitions. The TDA leads to an ∼0.1 eV blue shift in the predicted spectra and an increase in the oscillator strength error by ∼0.01. QR-TDDFT also reproduces experimental absorption spectra for larger molecular systems like small polythiophene oligomers.
This work introduces an alternative approach for predicting excited-state absorption spectra by combining the ΔSCF maximum overlap method (MOM) with the linear response Tamm-Dancoff approximation (LR-TDA). We refer to this approach as LR-TDA/ΔSCF. Excited states are self-consistently optimized using MOM, which has been shown to have high accuracy in both state energies and character. These initial excited states are directly compared to higher level CASPT2 or multireference Möller-Plesset energies and properties. Then, LR-TDA calculations on these configurations predict excited-state absorption spectra that can be directly compared to raw TAS and DADS data. Excited-state LR-TDA based on ground-state orbitals reproduces QR predictions, , higher-level theoretical results, , and experimental spectra with good accuracy.
Three chromophores (photoswitchable azobenzene (AB), emissive pentamethyl-BODIPY (BD), and phosphorescent zinc octaethylporphyrin (ZP) (Scheme ) with well studied excited-state dynamics are modeled using LR-TDA/ΔSCF method. Theoretical excited-state absorption spectra, derived from both ground- and excited-state geometries, are compared to raw and GLA-fitted TAS data. The effects of orbital relaxation are analyzed by comparing LR-TDA/ΔSCF spectra to LR-TDA expectation value formalism spectra. Key excited-state absorption features are assigned to hole–electron pairs to describe their character. Overall, this method offers a cost-effective, DFT-based approach for predicting excited-state absorption in systems that can be accurately described by a few low-energy excited states.
1. Well Studied Chromophores to Test the Breadth of LR-TDA/ΔSCF .

a AB is diphenyldiazene, BD is 1,3,5,7,8-Pentamethyl-4,4-difluoro-4-bora-3a,4a-diaza-s-indacene, and ZP is 2,3,7,8,12,13,17,18-Octaethyl-21H,23H-porphine zinc(II).
2. Theoretical Methods
2.1. Density Functional Theory: Optimization and Frequency Calculations
Molecular geometries were optimized in ORCA 6.0 using tight SCF convergence criteria, the PBE0 or LC-PBE XC-functional, a def2-TZVP basis set D4 dispersion corrections and a CPCM solvent model that matched experimental conditions. AB and BD were optimized in acetonitrile while ZP was optimized in chloroform. Subsequent frequency calculations confirmed that the optimized geometries were true local minima, with all real frequencies.
2.2. LR-TDA and LR-TDDFT Calculations on Aufbau Reference Determinants
Linear Response Time-Dependent DFT (LR-TDDFT) − and Tamm-Dancoff Approximation (LR-TDA) calculations were carried out on the optimized structures, using the same level of theory as the optimization and frequency calculations. The first 30 excited states of AB and BD and 60 excited states of ZP were calculated using a restricted singlet reference or an unrestricted triplet reference, depending on the molecule and/or the state of interest. Computed excitation energies and oscillator strengths were used to produce stem plots and Gaussian-broadened absorption spectra (σ = 0.4 eV) for comparison with experimental ground-state absorption spectra.
2.3. Excited-State Absorption Spectra via the Expectation Value Formalism
Predicting ground- or excited-state absorption spectra from first-principles calculations requires, at a minimum, excitation energies and oscillator strengths. Assuming that the excitation energy (ε JI ) from excited-state I, with energy E I , to excited-state J, with energy E J , is given by
| 1 |
excited-state to excited-state excitation energies can be approximated using either LR-TDDFT or LR-TDA. , Notably, this approximation neglects orbital and solvent relaxation effects, which can lead to significant energetic shifts relative to experiment. Previous studies have demonstrated that the accuracy of the expectation value formalism is functional-specific and depends on the fraction of exact exchange. , For instance, global hybrid functionals with lower exact exchange exhibit poor agreement with experimental data, while 50% exchange is recommended to improve accuracy. Range-separated hybrids, such as CAM-B3LYP, also predict spectra in good agreement with experiment.
To maintain consistency and ensure comparability with the LR-TDA/ΔSCF results presented in a later section, excitation energies and oscillator strengths were calculated using LR-TDA within the expectation value formalism. Excitation energies (ω) were determined by solving the Hermitian eigenvalue problem,
| 2 |
where A is the orbital rotation Hessian matrix, ω are the excitation energies, and is the eigenvector of excitation amplitudes. Excited-state to excited-state oscillator strengths,
| 3 |
were obtained as the product of the excitation energy and the squared norm of the transition dipole moment (⟨Ψ J |μ̂|Ψ I ⟩). Here, Ψ I and Ψ J denote excited-state determinants of the same spin multiplicity, and μ̂ is the dipole moment operator. In LR-TDA, excited-state determinants are expressed as linear combinations of singly excited configurations with excitation amplitudes ,
| 4 |
where the excitation amplitudes are normalized (i.e., ). ,
To cover the spectral window in the TAS experiments, the 30 lowest-energy singlet excited states were computed using LR-TDA for AB and BD, while 60 singlet and 60 triplet excited states were computed for ZP. Excited-state to excited-state energies and oscillator strengths were used to generate stick plots and Gaussian-broadened absorption spectra (σ = 0.4 eV). All calculations were carried out using methods implemented in ORCA 6.0.
2.4. ΔSCF to Variationally Converge an Excited-State Non-Aufbau Determinants
Molecular orbital coefficients in Hartree–Fock (HF) or Kohn–Sham DFT are generally determined in a variational and self-consistent manner to find solutions to the time-independent Schrödinger equation:
| 5 |
where k = 0 for a given spin state and geometry within the Born–Oppenheimer (BO) approximation. The self-consistent field (SCF) procedure seeks a minimum-energy Slater determinant corresponding to a stationary point of the energy expectation value. To determine excited states, methods such as LR-TDDFT, − LR-TDA, or more computationally demanding wave function-based approaches like EOM-CC, ADC, , CASSCF, and CASPT2, , are typically employed. While one can attempt to converge to excited-state (non-Aufbau) electron configurations using KS-DFT, standard SCF algorithms generally favor the lowest energy configuration, leading to variational collapse. To address this, nonstandard SCF algorithms, collectively known as ΔSCF , or orbital optimized (OO−)DFT, have been developed to avoid variational collapse while remaining self-consistently solvable.
Among these methods, the maximum overlap method (MOM) in ORCA 6.0 provides a way to self-consistently converge excited-state configurations. MOM enforces that the new set of occupied orbitals maximally overlaps with the set of previously occupied orbitals during each iteration of the SCF procedure. From this point forward, MOM and ΔSCF are used synonymously, with the latter being used more frequently.
An excited-state non-Aufbau configuration is typically generated by singly occupying a previously unoccupied orbital and singly unoccupying a previously doubly occupied orbital. For an unrestricted reference configuration, where the orbitals are singly occupied spin up (α) or spin down (β), the non-Aufbau excitation is created by singly occupying an unoccupied α/β-orbital and singly unoccupying a previously occupied α/β-orbital. This non-Aufbau guess configuration is relaxed energetically using ΔSCF, and, ideally, converges to the nearest excited-state solution, rather than the lowest energy ground-state solution.
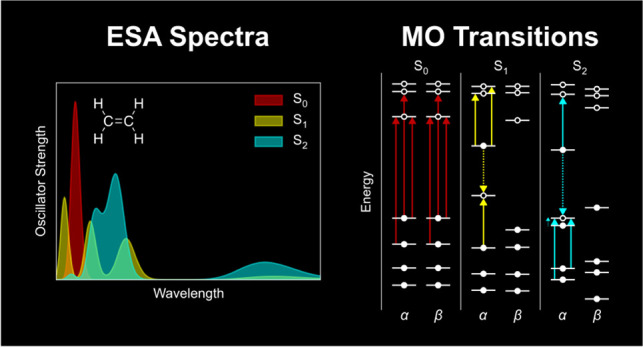
A simple example of ΔSCF in action is shown in Figure . Starting from the self-consistently optimized ground-state orbitals (Figure , left), a non-Aufbau configuration was generated by promoting an electron from the α-HOMO (π) to the α-LUMO (π*) of ethene (Figure , middle). This non-Aufbau configuration was then relaxed using ΔSCF and converged to the nearest energy solution (Figure , right). The set of ΔSCF-optimized orbitals approximates the lowest-energy π → π* excited-state of ethene.
1.

ΔSCF applied to the first excited state of ethene. (Left) Ground-state SCF molecular orbital (MO) diagram, (middle) non-Aufbau guess for the excited-state configuration without orbital relaxation, and (right) the first singlet ΔSCF excited-state of gas-phase ethene at the PBE0-D4/def2-TZVP level of theory.
Unfortunately, identifying and converging to excited states of interest with ΔSCF can be challenging without prior knowledge of the main orbitals involved in these excitations. A simple yet effective strategy to overcome this limitation is to use the results from LR-TDDFT or LR-TDA calculations to guide the selection of orbitals to excite from and into. By identifying the pair of orbitals with the largest contribution (i.e., the largest C 2) for a given excited state, this pair serves as a reliable starting point for converging the excited state using ΔSCF. If this initial pair fails to converge or results in an undesired excited state, the second or third largest contributing orbital pairs can be used to produce guess configurations for ΔSCF. Alternative procedures, like initial MOM (IMOM) and state-targeted energy projection (STEP), use different methods to optimize the non-Aufbau Slater determinants for systems that are difficult to converge with MOM. Once the desired excited state is successfully converged, ΔSCF excitation energies can be approximated as the energy difference between the excited- and ground-state. This strategy was used to converge one or two low-lying singlet excited states with ΔSCF for AB, BD, and ZP in various geometries.
2.5. LR-TDA Calculations on Non-Aufbau ΔSCF References (LR-TDA/ΔSCF)
Excited-state absorption spectra were predicted by performing LR-TDA calculations on ΔSCF excited-state configurations. The excited-state indices (e.g., S 1, S 2, etc.) from the ΔSCF calculations were validated by examining the number of negative eigenvalues obtained with LR-TDA. For example, if the system is in the first excited singlet state (S 1), LR-TDA on the ΔSCF configuration should predict a transition to the ground state with a negative energy corresponding to an approximate emission energy. Similarly, for the second excited state (S 2), two negative energy transitions should be predicted with LR-TDA. After confirming the identity of the excited states, molecular orbitals were analyzed to verify their excited-state character.
As above, Gaussian-broadened (σ = 0.4 eV) excited-state absorption spectra were generated from the energies and oscillator strengths predicted by LR-TDA/ΔSCF. Note, all oscillator strengths reported come from LR-TDA. By subtracting the LR-TDA ground-state absorption spectra from various LR-TDA/ΔSCF excited-state spectra, theoretical species-associated difference spectra were obtained. These theoretical difference spectra were be compared to the raw TAS and DADS to better understand the orbitals that contribute to the various features.
3. Results and Discussion
3.1. Overview
This section presents a detailed evaluation of the LR-TDA/ΔSCF method for predicting excited-state absorption spectra and interpreting TAS spectral features. LR-TDA/ΔSCF results are compared with excited-state absorption predictions obtained from the expectation value formalism. The first subsection examines the photoevolution of a relatively simple organic photoswitch, azobenzene (AB). Following excitation to the S 2 state, and its subsequent decay through the S 1/S 0 conical intersection, metastable Z-AB is formed (Scheme ). The second investigates a simple two-level system. A BODIPY derivative (BD) that fluoresces following excitation to the S 1 state (Scheme ) is used to examine subtle changes in excited-state absorption arising from geometric relaxation in the S 1 state. The third explores a multiconfigurational system, where LR-TDA/ΔSCF is expected to perform poorly. Octaethyl zinc porphyrin (ZP), which, upon excitation into the Q-bands (i.e., S 1 and S 2), can undergo intersystem crossing to the triplet manifold (Scheme ). In this system, both the ground and excited states have multiconfigurational character.
2. Jablonski Diagrams Illustrating the Established Photophysics of AB, BD, and ZP .

a Solid arrows correspond to absorption (blue) and emission, fluorescence (green) and phosphorescence (orange) and squiggly arrows represent non-radiative internal conversion (IC, grey) and intersystem crossing (ISC, pink).
3.2. Azobenzene
Azobenzenes, including AB, are prototypical photoswitches that undergo E-Z photoisomerization. Their main absorption feature corresponds to excitation to the S 2 state, which involves a π → π* transition. In contrast, the lower-energy S 1 state involves an n → π* transition that is formally symmetry-forbidden, but gains intensity through vibronic coupling. Excitation to S 2 is followed by rapid internal conversion to S 1. Once in the S 1 state, either by direct excitation or through relaxation from S 2, rotation about the azo-bond dihedral relieves geometric strain. Near a dihedral angle of 90◦, a conical intersection with the S 0 ground state enables relaxation to either the E reactant or the Z product. Modeling the photophysics of AB thus requires consideration of the S 2 and S 1 states, along with the optimized E, Z, and S 1 geometries along the rotational reaction coordinateScheme .
The ground-state (E(S 0)) and metastable (Z(S 0)) geometries of AB were optimized as true minima using the PBE0 and LC-PBE functionals (Figure ). The most significant differences between the PBE0- and LC-PBE-optimized structures occur in the Z-isomers (RMSD = 0.189 Å), likely due to variations in the long-range π - π interactions between the phenyl rings that can be sensitive to the amount of exact exchange. In contrast, the E-isomers primarily differ in their dihedral angles D1234 and D3456 (RMSD = 0.053 Å). The PBE0 structure has a D1234 = 179.8◦ and D3456 = 179.8◦ while the LC-PBE structure has D1234 = 170.8◦ and D3456 = 170.8◦. These structures are similar to those found with CASSCF.
2.

Three optimized geometries of AB. The ground state E-AB (trans) and metastable Z-AB (cis) are both S 0 states. S1-AB represents the lowest-energy geometry on the first excited-state surface, highlighting the rotational photoisomerization reaction coordinate (red arrow). Hydrogen atoms are white, carbon atoms are gray, and nitrogen atoms are blue. PBE0-D4/def2-TZVP/CPCM(MeCN) level of theory.
The LR-TDA approximation reliably describes the absorption spectrum of E-AB. The excitation energies obtained from LR-TDA are linearly correlated with those from LR-TDDFT (Figure ), though systematically blue-shifted in energy, as expected. However, the LR-TDA and LR-TDDFT oscillator strengths do not exhibit a linear correlation (Figure ). Given that LR-TDA violates the Thomas-Reiche-Kuhn sum rule which asserts that the integrated oscillator strength of a chromophore equals its number of electrons, this outcome is anticipated. Nevertheless, the overall shape and key features of the Gaussian-broadened ground-state absorption spectrum remain consistent between the two methods, with a 64% overlap between the LR-TDA and LR-TDDFT spectra (σ = 0.4 eV).
3.

Correlations between TDA and TDDFT energies and oscillator strengths for E-AB. Best fit lines: (top) y = 0.9901x – 0.0152 and R 2 = 0.9968, (middle) y = 0.5830x + 0.0484 and R 2 = 0.4333. (Bottom) Substantial overlap (64%) between spectra despite no correlation between TDA and TDDFT oscillator strengths. S 1 excitations with zero oscillator strength are represented by dotted lines.
The LR-TDA/PBE0 S 1 and S 2 excitation energies from the ground state geometry closely match the experimental absorption spectrum (Figure and Table ). Both PBE0 and LC-PBE predict that the S 1 state has an oscillator strength of approximately zero at the ground-state (E) geometry, as this corresponds to an n → π* transition, which is symmetry-forbidden. In practice, however, this state becomes accessible through vibronic coupling and solvent interactions that break symmetry, leading to a small but finite oscillator strength. This explains the weak absorption feature observed at 450 nm (2.73 eV) in the experimental spectrum (Figure ). In contrast, the S 2 excitation (3.87 eV) corresponds to a π → π* transition with a large oscillator strength, calculated to be 1.2 with LR-TDA/PBE0 and 1.1 with LR-TDA/LC-PBE. As expected, LR-TDA/LC-PBE systematically predicts excitation energies that are blue-shifted relative to both experiment and LR-TDA/PBE0 (Figure S17). Both are slightly red-shifted compared to CASPT2 excitation energies, by 0.196 and 0.339 eV for LR-TDA/LC-PBE0 S 1 and S 2, respectively. Thus, the rest of the analysis focuses on PBE0 and ΔPBE as they provide excitation energies in better agreement with experiment. LC-PBE results that systematically overestimate excitation energies are included in the Supporting Information for comparison.
4.

Normalized UV–vis absorption of E-AB in MeCN (black curve) and LR-TDA/PBE0 excitations (red sticks). The symmetry forbidden first excited state (S 1, n → π*) energy is plotted as a dotted line.
1. Predicted Excitations in the Main Absorption Features .
| Molecule | State | TDA/eV | TDDFT/eV | ΔSCF/eV | Exp./eV |
|---|---|---|---|---|---|
| AB | S 1 | 2.662 (2.986) | 2.604 (2.882) | 2.143 (2.327) | 2.73 |
| AB | S 2 | 3.837 (4.667) | 3.664 (4.496) | 3.054 (4.031) | 3.87 |
| BD | S 1 | 3.219 (3.193) | 2.944 (2.974) | 2.116 (2.615) | 2.51 |
| ZP | S 1 | 2.526 (2.579) | 2.462 (2.172) | 2.361 (DNC) | 2.17 |
| ZP | S 2 | 2.526 (2.579) | 2.462 (2.172) | DNC (2.730) | 2.33 |
S0 → Sn excitation energies in eV from TDA, TDDFT, and ΔSCF at PBE0-D4 (LC-PBE-D4) level of theory. Experimental energies determined from absorption maximum near the various features of interest.
Did not converge.
Approximate excited states are generated by (1) constructing non-Aufbau singly excited determinants through the exchange of one virtual and one occupied orbital (Figure middle) from the S 0-E-AB reference determinant (Figure left) and (2) allowing the orbitals to self-consistently relax using ΔSCF (Figure right). Occupied and virtual orbital pairs are selected based on the results of ground-state LR-TDA calculations. For example, LR-TDA predicts that the S 1 excited state of E-AB is primarily (C 2 = 0.98) characterized by the excitation of an electron from an n-orbital (α-HOMO–1) to a π*-orbital (α-LUMO) (Figure left). This non-Aufbau configuration converges to the S 2 state rather than the expected S 1 state with ΔSCF. The state has a depopulated α-π-orbital and a singly occupied α-π* orbital (Figure middle). Energetically, the resulting ΔSCF energy (3.05 eV) is closer to the experimental S 1 energy (2.73 eV) than to the experimental S 2 energy (3.87 eV). However, when attempting to converge to the S 2 state by exciting an electron from the α-π-orbital to the α-π*-orbital, a lower-energy excited state (2.14 eV) was obtained. This state has a depopulated α-n-orbital and a singly occupied α-π*-orbital (Figure right). These results indicate that the initial “S 1 guess” converged to the true S 2 state, while the “S 2 guess” instead converged to the true S 1 state.
5.

α-MO (left) and β-MO (right) diagrams for E-AB in the ground state (S 0, left), and first (S 1, middle) and second (S 2, right) excited states. PBE0-D4/def2-TZVP/CPCM(MeCN) and ΔPBE0-D4/def2-TZVP/CPCM(MeCN) levels of theory.
LR-TDA calculations on the S 1 and S 2 excited-state references confirm the state assignments. The lower-energy 2.14 eV ΔSCF excited state has a single negative excitation energy of −2.00 eV with ⟨S 2⟩ = 0.033674, where ⟨S 2⟩ is the square of the total spin angular momentum. In comparison, the unrestricted open-shell excited-state reference has ⟨S 2⟩ = 1.025705, indicating that this transition is a relaxation back to the closed-shell S 0 state. While open-shell singlet ΔSCF states (⟨S 2⟩ = 1) can have significant spin contamination, this ⟨S 2⟩ shows that the optimized state is mostly a singlet with ≈2.6% contamination. Analysis of the orbitals involved in the transition confirmed that it corresponds to a de-excitation from the α-π*-orbital to the α-n-orbital. The higher-energy 3.05 eV ΔSCF excited state has two negative excitation energies of −2.88 and −0.73 eV. The −2.88 eV transition corresponds to a de-excitation from the α-π*-orbital to the α-π-orbital and has ⟨S 2⟩ = 0.027084, suggesting relaxation to the closed-shell S 0 state. Meanwhile, the −0.73 eV transition corresponds to a de-excitation from the α-n-orbital to the α-π-orbital, with ⟨S 2⟩ = 1.012204.
The S 1 ΔSCF geometry optimization converged to an open-shell singlet (⟨S 2⟩ = 1.010254) with an azo dihedral angle of 109.3°, 16.5° larger than what has been predicted with CASSCF (92.8°). The absence of imaginary frequencies confirmed that the structure corresponds to the S 1 minimum rather than the rotational transition state of the ground state (S 0). A LR-TDA calculation further validated this assignment by predicting a single negative excitation energy of −0.026 eV and ⟨S 2⟩ = 0.048049, confirming de-excitation to the closed-shell S 0 state. The small de-excitation energy suggests that this geometry is near, if not at, the conical intersection. Since LR-TDA relies on the adiabatic approximation, it cannot explicitly converge to a true conical intersection. Notably, the ΔSCF de-excitation energy was even smaller at −0.016 eV, providing additional evidence that this structure corresponds to the conical intersection. A frequency calculation on the S 1 geometry in the closed-shell S 0 state revealed a single imaginary frequency, with the corresponding vibrational mode resembling a characteristic azo bond rotational transition state. Collectively, this strongly supports that the ΔSCF optimization converged to the S 1/S 0 conical intersection.
A comparison of the Gaussian-broadened spectra for the first 30 singlet excited states predicted by LR-TDA/ΔSCF and the expectation value formalism highlights the significance of orbital relaxation (Figure ). Three main absorption features are predicted by both methods, a hybrid and long-range corrected PBE functional. However, they appear at significantly different energies and oscillator strengths. With the PBE0 functional, it is clear that orbital relaxation has a substantial effect, as the ΔSCF S 2 and S 1 excited-state absorption spectra are significantly blue-shifted relative to the expectation value formalism spectra. The newly occupied exited-state α-HOMO is stabilized substantially with respect to the ground state α-LUMO, with only a minor shift in the energies of the unoccupied orbitals. As the α-HOMO energy level decreases, the energetic gap between it and the unoccupied orbitals increases. Interestingly, the magnitude of this blue shift is considerably reduced when using the long-range corrected LC-PBE functional, indicating that the effects of orbital relaxation are less pronounced.
6.

Predicted excited-state absorption of BD. ΔSCF (solid lines) vs expectation value formalism (dashed lines) of both the S 1 and S 2. X/Y indicates the X excited-state configuration at the Y geometry.
The AB TAS data is best fit with four lifetimes, which is generally consistent with previous reports for AB ,− (Figures S2–S4 and Table S1). Typically, the shortest lifetime, 0.2 ps, is assigned to the simultaneous vibrational cooling of the S 2 state and the internal conversion from the S 2 state to the S 1 state. The second lifetime, 1.0 ps, is assigned to the vibrational relaxation, through an azo dihedral rotation, to the S 1/S 0 conical intersection, where rapid internal conversion occurs. The third lifetime, 15.2 ps, is assigned to the cooling of the hot-S 0 state to either the trans- or cis-isomer. The fourth unresolved lifetime, i.e., beyond the 5.5 ns TAS window and undetectable by ns-TAS due to low signal, is assigned to the lifetime of the metastable cis-isomer.
Theoretical species-associated difference spectra, generated by subtracting the S 0-E- AB absorption spectra from various LR-TDA/ΔSCF excited-state absorption spectra, match the respective DADS in both overall shape and energy (Figure ). Specifically, the 0.2 ps DADS aligns with the S 2/E difference spectrum (excited-state absorption/geometry), the 1.0 ps DADS corresponds to the S 1/E difference spectrum, the 15.2 ps DADS matches the S 0/S 1 difference spectrum, and the unresolved DADS is consistent with the S 0/Z difference spectrum.
7.

Experimental vs theoretical difference spectra for AB. (Top) Raw TAS difference spectra at various time delays. (Middle) DADS and their respective lifetimes in picoseconds. (Bottom) ΔSCF excited-state difference spectra where X/Y indicates the X excited-state configuration at the Y geometry – the ground-state spectrum (S 0/E).
The LR-TDA/ΔSCF method not only enables the assignment of species to particular lifetimes, but also facilitates the mapping of excited-state spectral features to molecular orbital (MO) transitions, much like what is commonly done in ground-state LR-TDA or LR-TDDFT. The key excited-state transitions from various references are highlighted in Figure by their root, i.e., excited-state number, and orbital indexes. For E-AB, the 1st and 2nd roots (i.e., S 1 and S 2) are involved in E→Z photoisomerization. As a result, predicting the excited-state absorption spectra from these states is crucial for interpreting the TAS and DADS spectral features involved in AB photoisomerization.
8.

Molecular orbital transitions in the ground- and excited-state absorption spectra of AB. X/Y indicates the X excited-state configuration at the Y geometry. Red dotted lines mark the ground-state S 1 and S 2 excitation energies for reference. Select roots, i.e., excited-state indices, are labeled above the transitions. HOMO = 47α/β and LUMO = 48α/β.
From the S 2 ΔPBE0 reference, two prominent features with significant oscillator strength within or near the TAS spectral window (≈340 and 660 nm) are the 5th and 9th LR-TDA roots. The 5th root corresponds to a π → π* transition from a low-energy α-π-orbital to the α-LUMO (the former α-HOMO of S 0-E-AB), while the 9th root corresponds to a high-energy π → π* excitation from the α-HOMO (the former α-LUMO of S 0-E-AB) to the α-LUMO+3 orbital. The 9th root is within 20 nm of the experimental absorption feature between 400 and 500 nm, whereas the 5th root is red-shifted by more than 100 nm relative to the experimental feature around 600 nm.
From the S 1 ΔPBE0 reference, the main absorption feature (i.e., the 9th root) is red-shifted relative to the ground-state bleach. Like the 9th root from the S 2 reference, this transition involves a high-energy π → π* excitation from the α-HOMO to the α-LUMO+3 orbital and exhibits nearly identical character. However, the transition from the S 1 state has a higher energy than the corresponding 9th root from the S 2 state due to the distinct non-Aufbau molecular orbital configuration and the subsequent ΔSCF orbital relaxation. When comparing the S 1 and S 2 molecular orbital diagrams (Figure ), it is evident that the α-HOMO of the S 1 state is lower in energy than that of the S 2, while the π* energies remain essentially consistent. The shift in the α-HOMO energy of the S 1 state to a lower value than in the S 2 state explains the higher excitation energy in the S 1 state. The λ max of the S 1/E difference spectrum is once again within 20 nm of the λ max of the 1 ps lifetime.
Importantly, comparing the λ max of the theoretical difference spectra with the λ max of the DADS reveals a key distinction. Unlike the 9 th root from the S 2 state, which is well separated from the ground-state S 2 feature, theory suggests significant spectral overlap between the ground-state S 2 feature and the 9 th root from the S 1 state. This overlap leads to a red shift in the position of the feature away from the true λ max in the difference spectra. Therefore, in this case, comparing the difference spectra is likely to yield a closer match to experimental reality than simply considering the excitation energy of the 9th root.
Because the spectral window of the TAS is roughly between 340 and 680 nm, features that are blue-shifted to the ground-state bleach remain undetected. However, the 15th root from the S 1 reference is highlighted in Figure , as it could be resolved in a future study if the spectral window were extended to cover this region. This high-energy feature is particularly noteworthy because it involves a σ(C) → n*(N) transition from the α-HOMO–5 to the α-LUMO orbital, a transition not typically observed in small molecule organic compounds using UV–vis spectroscopy.
The λ max of both the 15.2 ps DADS and theoretical S 0/S 1 (i.e., the S 0 state at the S 1 minimum) difference spectra are approximately 360 nm, indicating that this lifetime likely corresponds to the relaxation of the hot-S 0. Because there is considerable overlap between the 4th root from the S 0/S 1 state and the S 2-E-AB, comparing the difference spectra may be more reliable than the excitation energy of the 4 th root to the λ max of the 15.2 ps DADS. This transition involves a π to mixed-n*/π* transition from the α-HOMO–1 to the α-LUMO. Additionally, the 8 th root is blue-shifted and well separated from the ground-state bleach and could likely be observed if the TAS spectral window could be adjusted appropriately. This transition involves a mixed-n/π to mixed-n*/π* transition from the α-HOMO to the α-LUMO+4 and its observation could further confirm that the 15.2 ps species is majority hot-S 0 rather than an S 1 excited state.
The long-lived, unresolved lifetime is most likely due to the thermal reversion from Z-AB to E-AB. The S 0/Z difference spectra matches the unresolved DADS well, and similar assignments are available in a plethora of literature. ,− Z-AB has only one singlet excited state red-shifted to the ground-state bleach. The 1st root has an excitation energy around 440 nm but exhibits a relatively small oscillator strength due to the poor, yet non-negligible, overlap between the α-HOMO–1 and α-LUMO orbitals. This transition is of mixed-n/π to mixed-n*/π* character and has the expected low oscillator strength because of the nearly orthogonal n-component of the orbitals. This detailed mechanistic understanding of the excited-state orbitals validates a complex photophysical mechanism that required years of study and hundreds of experiments to unravel.
3.3. BODIPY
The main absorption feature (S 1) of pentamethyl-BODIPY (BD, Figure ) and related BODIPYs corresponds to a HOMO–LUMO π → π* transition. Upon excitation, BD exhibits strong green fluorescence with no evidence of phosphorescence. BODIPYs with aromatic meso-substituents can undergo intramolecular charge transfer to access the triplet manifold but this intramolecular charge transfer is absent in BD due to its meso-methyl substitution. As a result, modeling the photophysics of BD requires consideration only of the ground state and first excited state, along with their optimized geometries.
9.

Optimized geometries of S0-BD and S1-BD at the PBE0-D4/def2-TZVP/CPCM(MeCN) level of theory. Hydrogen atoms are white, carbon atoms are gray, boron atoms are pink, nitrogen atoms are blue, and fluorine atoms are green.
The optimized ground-state (S 0) geometries of BD showed no significant deviations between the PBE0 and LC-PBE methods (RMSD = 0.077 Å). The ΔSCF first excited-state (S 1) geometries exhibit a pronounced puckering of the BODIPY backbone, causing both the methyl group on C14 and the BF2 unit to shift upward (Figure ). Additionally, the C14 methyl group undergoes rotation in the S 1 state, adopting a nearly ideal staggered conformation relative to the BF2 unit (Figure ). This kind of puckering is seen in the CASSCF, ADC(2), and CC2 optimized S 1 structures of unmethylated BODIPY.
Similar to AB, the excitation energies from LR-TDA and LR-TDDFT exhibit a linear correlation, with LR-TDA systematically blue-shifted relative to LR-TDDFT (Figure S21). While the oscillator strengths are not linearly correlated, the overall shape of the Gaussian-broadened LR-TDA absorption spectrum closely matches that of LR-TDDFT, with an integrated overlap of 52%. The largest discrepancies in excitation energy and oscillator strength between the two methods are observed in the S 1 feature. With the PBE0 functional, LR-TDDFT predicts an excitation energy of 3.219 eV, whereas LR-TDA predicts 2.944 eV. A similar trend is seen with the LC-PBE functional, where LR-TDDFT and LR-TDA yield excitation energies of 3.193 and 2.974 eV, respectively. Regardless of the functional or TD-approximation used, all methods predict an S 1 feature that is blue-shifted relative to the experimental λ max at 2.51 eV (Table and Figure ) and to the CASPT2 excitation energy (2.86 eV).
10.

Normalized UV–vis absorption of BD in MeCN (black curve) and LR-TDA/PBE0-D4/def2-TZVP/CPCM(MeCN) excitations (red sticks).
Since BD emits from the S 1 excited state, ground- and excited-state absorption spectra were predicted using LR-TDA and LR-TDA/ΔSCF, respectively, from the S 0 and S 1 geometries. The S 1 absorption feature from the S 0 state corresponds to a π → π* transition from the HOMO to the LUMO, with an oscillator strength of 0.9278 with LR-TDA/PBE0 (Figure ), which is larger than the oscillator strength of higher level methods (f CASPT2 = 0.65). A guess configuration with a singly occupied α-LUMO and a singly occupied β-HOMO was generated and ΔSCF converged to an orbital- and energetically-relaxed S 1 configuration with an α-HOMO and α-LUMO that closely resemble the S 0 LUMO (π*) and HOMO (π), respectively. The most significant difference is in the α-HOMO and α-LUMO energy levels, followed by the β-HOMO and β-LUMO energy levels. In the α-manifold, the highest occupied π* orbital is significantly stabilized, while the lowest unoccupied π orbital is destabilized by a comparable amount relative to their S 0 counterparts (Figure ). Additionally, the β-HOMO is partially stabilized, whereas the β-LUMO is slightly destabilized. The energies of orbitals below the α/β-HOMO or above the α/β-LUMO remained largely unperturbed. The orbital optimization results in smaller S 1 excitation energy (2.116 eV, Table ) than CASPT2 (2.64 eV).
11.

α-MO (left) and β-MO (right) diagrams for S 0-BD in the ground state (S 0, left) and first excited state (S 1, middle), as well as the optimized S 1-BD in the first excited state (S 1, right). PBE0-D4/def2-TZVP/CPCM(MeCN) and ΔPBE0-D4/def2-TZVP/CPCM(MeCN) levels of theory.
LR-TDA on the S 1 ΔSCF reference (1) confirms that this is indeed the S 1 state by predicting a single negative excitation energy and (2) provides its excited-state absorption spectrum. The S 1 ΔSCF state exhibits a negative excitation energy of −1.74 eV from the α-HOMO (occupied π*) to the α-LUMO (unoccupied π) with a ⟨Ŝ 2⟩ = 0.060456. In contrast, the reference open-shell S 1 state (ΔSCF state) has ⟨Ŝ 2⟩ = 1.032256 (3.2% spin contamination), confirming that de-excitation yields a closed-shell singlet that resembles the S 0 state.
The LR-TDA/ΔSCF S 1 excited-state absorption spectra predicted using the expectation value formalism and ΔSCF with both PBE0 and LC-PBE functionals show similar trends as AB (Figure ). The PBE0 functional shows more significant effects of orbital relaxation compared to LC-PBE. Orbital relaxation leads to a blue shift in ΔSCF excitation energies relative to the expectation value formalism predicted with the PBE0 functional. This shift is due to the substantial relaxation of the occupied π* orbital during the ΔSCF optimization. Since the unoccupied orbitals, apart from the α-LUMO, remain largely unchanged, excitations from the relaxed configuration occur at higher energies than those predicted by the unrelaxed expectation value formalism.
12.

Predicted excited-state absorption of BD. ΔSCF (solid lines) vs expectation value formalism (dashed lines) of both the S 1 and S 2. X/Y indicates the X excited-state configuration at the Y geometry.
Both methods and functionals predict all three main absorption features, but the effects of orbital relaxation are less pronounced in the LC-PBE excited-state absorption spectra (Figure ). The features from both LR-TDA/ΔSCF and the expectation value formalism align well and are generally consistent. Notably, the first excited-state feature predicted by the expectation value formalism is blue-shifted relative to the LR-TDA/ΔSCF feature, which differs from the PBE0 functional, where the first excited-state feature predicted by the expectation value formalism is significantly red-shifted.
Excited-state absorption spectra from the ΔSCF-optimized S 1 geometry provides insight into the emissive S 1 state. Both ΔPBE0 and ΔLC-PBE show that S 1 geometry optimization has little effect on the S 1/S 1 excited-state absorption spectrum compared to the S 1/S 0 spectrum (Figure ). This suggests that the raw TAS and DADS should show only minor differences in the excited-state absorption spectra.
When BD is selectively excited into the S 1 state with a 505 nm pump pulse (Figure ), near its λmax, three species contribute to the process: (1) the S 0 state at the S 0 geometry (S 0/S 0), (2) the S 1 state at the S 0 geometry (S 1/S 0), and (3) the S 1 state at the S 1 geometry (S 1/S 1). The fs- and ns-TAS of BD in MeCN is best fit with two distinct lifetimes: a short-lived vibrational relaxation within the S 1 state (15.6 ps) and a long-lived emissive process (5.883 ± 0.529 ns). However, based solely on the TAS data, it is unclear which excited state of the system the absorption features and geometries are associated with. For example, in BD, the long-lived component arises from the S 1 minimum geometry rather than the initially excited S 1.
13.

Experimental vs theoretical difference spectra for BD. (Top) Raw TAS difference spectra at various time delays. (Middle) DADS and their respective lifetimes in picoseconds. (Bottom) ΔSCF excited-state difference spectra where X/Y indicates the X excited-state configuration at the Y geometry – ground-state spectrum (S 0/S 0).
Theoretical difference spectra from the S 1 state at both the S 0 and S 1 geometries provide a way to assign the observed features in the raw TAS data as well as in the short- and long-lived DADS (Figure ). The PBE0 S 1 excited-state absorption spectra from the S 0 and S 1 geometries are very similar (Figure ), and consequently, their difference spectra show only minor variations (Figure ). Both geometries are predicted to have two distinct excited-state absorption features not present in the ground-state spectrum. The most prominent appears blue-shifted (around 310 nm) relative to the ground-state bleach, while a weaker red-shifted feature emerges around 560 nm.
The raw TAS data shows the growth of the blue-shifted feature on short time scales, followed by its decay on longer time scales (Figure ). This feature is also observed in both the 15.6 ps and 5.86 ns DADS. In general, the ΔPBE0 features from both the S 0 and S 1 geometries align well with the DADS, though they appear at slightly higher energies, as expected. However, the red-shifted feature with a low oscillator strength, predicted by both ΔPBE0 and ΔLC-PBE, was not observed in either the raw TAS or DADS. This feature comes from the 4th root of the S 1 configuration, corresponding to a π → π* excitation from the α-HOMO–3 to the α-LUMO (the unoccupied S 0 π-orbital) (Figure ). However, this red-shifted ESA is observed in toluene with greater intensity. This not only supports the computational assignment of this feature but directly shows how orbital level understanding of the ESA makes the LR-TDA/ΔSCF method particularly powerful for understanding TAS data.
14.

Molecular orbital transitions in the ground- and excited-state absorption spectra of BD. X/Y indicates the X excited-state configuration at the Y geometry. Red dotted line marks the ground-state S 1 excitation energy for reference. Select roots, i.e., excited-state indices, are labeled above the transitions. HOMO = 68α/β and LUMO = 69α/β.
The main excited-state absorption feature from the S 1 state corresponds to the 10th root. This excitation primarily involves two pairs of orbitals. The first pair (C 2 = 0.35) is a π → π* transition from the β-HOMO to the β-LUMO at the S 0 geometry. This transition, along with the initial excitation from the α-HOMO to the α-LUMO, effectively approximates a double excitation, or a doubly excited configuration. Alternatively, a double excitation could be optimized using standard ΔSCF by promoting both electrons from the π (HOMO) to the π* (LUMO). The second orbital pair (C 2 = 0.31) is a π → π* excitation from the α-HOMO (occupied π*) to the α-LUMO+1 at the S 0 geometry. At the S 1 geometry, the dominant configuration changes, but the orbital shapes and energies remain generally consistent. The excitation of the beta electron has C 2 = 0.32, while the excitation of the α-electron has C 2 = 0.35. Because these structural changes are minimal, the 10th root at the S 0 and S 1 geometries remains similar in both energy and oscillator strength. This supports assignment of the two lifetimes to S 1 → S 1 and S 1 → S 0, respectively. Thus, LR-TDA/ΔSCF identifies features that merit further investigation, either through solvatochromism or by modifying the chromophore’s structure.
3.4. Zinc Porphyrin
The orbital symmetry in zinc porphyrins (one of the simplest is ZP in Figure ), leads to symmetry-forbidden transitions (S 1 and S 2) between the degenerate HOMO/HOMO–1 → LUMO/LUMO+1. These “Q-band” excitations gain intensity through vibronic coupling. In addition, zinc porphyrins have a strong π → π* absorption in the blue, the Soret bands (i.e., S 5 and S 6). The Q and Soret bands of zinc porphyrins are well described by Gouterman’s four-orbital model (Figures (left) and (top)).
15.

Optimized geometries of S0-ZP and T1-ZP at the PBE0-D4/def2-TZVP/CPCM(CHCl3) level of theory. Hydrogen atoms are white, carbon atoms are gray, nitrogen atoms are blue, and zinc atoms are magenta.
16.

α-MO (left) and β-MO (right) diagrams for S 0-ZP in the ground state (S 0, left), first singlet excited state (S 1, middle), and optimized first triplet excited state (T 1, right). PBE0-D4/def2-TZVP/CPCM(CHCl3) and ΔPBE0-D4/def2-TZVP/CPCM(CHCl3) levels of theory.
20.

Molecular orbital transitions in the ground- and excited-state absorption spectra of ZP. X/Y indicates the X excited-state configuration at the Y geometry. The red dotted lines mark the ground-state Q-bands and the Soret band. Select roots, i.e., excited-state indices, are labeled above the transitions. HOMO = 94α/β (95α/β for T 1) and LUMO = 95α/β (96α/β for T 1).
When excited into the Q-bands, ZP can either relax via fluorescence back to the ground state or phosphorescence , through the triplet manifold via spin–orbit coupling between the S 1 or S 2 states and the T 4, T 3, T 2, or T 1 states. Therefore, at minimum, the lowest energy triplet state must be included in a model of ZP photophysics.
The optimized ground-state (S 0) and first triplet excited-state (T 1) geometries of an unsubstituted zinc porphyrin (ZP) (Figure ) are similar when calculated with either PBE0 and LC-PBE, showing minimal deviations (RMSD (S 0) = 0.041 Å and RMSD (T 1) = 0.040 Å) for either geometry. The most significant differences between the S 0 and T 1 geometries appear in the C–C and Zn–N bond lengths. In the T 1 geometry, there is a symmetric expansion around one N–Zn–N diagonal, this leads to elongation of C11–C12, C13–C14, C15–C16, C21–C22, C23–C24, and C25–C26 bonds, while the C14–C15 and C22–C23 bonds contract. Additionally, the Zn–N bonds exhibit elongation (Figure ).
Neither the first nor the second singlet excited states were successfully optimized to local minima using either ΔPBE0 or ΔLC-PBE using MOM. In both cases, the resulting structures exhibited one or more imaginary frequencies that could not be eliminated through finite displacements along the imaginary normal modes. It might be interesting to see if an S 1 geometry could be optimized with IMOM, STEP, or square gradient minimization (SGM). In particular, the high accuracy for both core and valence orbital energies provided by STEP might provide insight into the origin of the slight blue shifting of the 400–450 nm feature in the early TAS. Here, the excited states at the S 0 and T 1 geometries are analyzed to provide insight into the photophysics of ZP.
Like AB and BD, the LR-TDA excitation energies from the S 0 reference state and geometry are linearly correlated with, but systematically blue-shifted relative to, LR-TDDFT excitation energies (Figure S26). The oscillator strengths predicted using the PBE0 functional do not exhibit a linear correlation (Figure S26), whereas those predicted with LC-PBE do (Figure S27). The Q-band excitation energies predicted via LR-TDA and LR-TDDFT with PBE0 are in good agreement but remain blue-shifted by approximately 50 nm relative to experiment (Figure ). In contrast, LR-TDA and LR-TDDFT with LC-PBE yield significantly different Q-band excitation energies (Figure S27). Because of this, the LR-TDA approximation with the LC-PBE functional may be unsuitable for describing the Q-band excited states.
17.

Normalized UV–vis absorption of octaethyl-ZP in chloroform (black curve) and LR-TDA of unsubsituted-ZP (red sticks) and octaethyl-ZP (navy sticks). The symmetry-forbidden Q-bands (S 1 and S 2) are marked with dotted lines. PBE0-D4/def2-TZVP/CPCM(CHCl3) level of theory.
The PBE0 LR-TDA S 1 state consists of a mixed π → π* excitation, primarily involving transitions from the HOMO–1 to the LUMO+1 (C 2 = 0.50) and from the HOMO to the LUMO (C 2 = 0.48). Similarly, the S 2 state is a mixed π → π* excitation with contributions from the HOMO–1 to the LUMO (C 2 = 0.50) and the HOMO to the LUMO+1 (C 2 = 0.48). For unsubstituted ZP, the oscillator strength of these transitions is predicted to be 0.0049. Since vibronic coupling effects are not accounted for in the Gaussian-broadened spectra, the Q-bands remain degenerate at 2.54 eV according to PBE0 and do not exhibit the energy splitting observed experimentally (Figure ). Likewise, for octaethyl-substituted ZP, where the ethyl groups are either all eclipsed or all staggered, the Q-bands are predicted to be degenerate at 2.48 eV. Applying the Yamaguchi approximate projection (AP) model to a ΔSCF determinate might allow these vibrational states to be untangled. Thus, further analysis focuses on the unsubstituted ZP.
A non-Aufbau configuration of the S 1 state was optimized at the S 0 geometry by exciting an electron from the α-HOMO–1 to the α-LUMO+1, which represents the dominant S 0 → S 1 contribution according to LR-TDA. This ΔSCF S 1 excited state has a single LR-TDA negative excitation energy of −2.15 eV and an ⟨S 2⟩ value of 0.0801, indicating a de-excitation from an open-shell excited state (ΔSCF ⟨S 2⟩ = 1.051073) to a closed-shell S 0 state. This lines up well with the experimental 1.82 eV and the improved-virtual-orbital-multireference Möller-Plesset (IVO-MRMP) excitation of 1.98 eV. CASSCF and CASPT2 energies significantly devate from experiment for the lowest energy excitations in ZP. Moreover, the first positive excitation energy is 0.052 eV, which likely corresponds to the excitation to the nearly degenerate S 2 state. Interestingly, the α-LUMO of S 1, as expected, resembles the HOMO–1 of S 0 (Figure ). However, the α-HOMO of S 1 does not resemble either the α-LUMO or α-LUMO+1 of S 0. The β-HOMO of S 1 closely resembles the HOMO of S 0, but the β-LUMO does not. Notably, the α-HOMO and β-LUMO are related by a 90◦ rotation.
Only one ΔSCF state could be converged at the S 0 geometry. However, the S 1 and S 2 states are degenerate or nearly degenerate, and the expectation value formalism predicts identical excited-state absorption spectra for these states (Figure ) when neglecting vibronic coupling. An alternative guess for the S 1 state was constructed by exciting from the α-HOMO to the α-LUMO. This guess failed to converge within 124 SCF cycles. Similarly, two attempts were made to converge the S 2 excited state: one by exciting from the α-HOMO–1 to the α-LUMO and another from the α-HOMO to the α-LUMO+1. Neither approach achieved convergence within 124 SCF cycles. Convergence issues are primarily attributed to the use of a single-reference method to describe multiconfigurational excitations.
18.

Predicted excited-state absorption of unsubstituted ZP. ΔSCF (solid lines) vs expectation value formalism (dashed lines) of both the S 1 and S 2. X/Y indicates the X excited-state configuration at the Y geometry.
The LR-TDA/ΔSCF S 1 excited-state absorption spectrum of unsubstituted ZP is blue-shifted relative to the S 1 and S 2 excited-state absorption spectra predicted using the expectation value formalism with either the PBE0 or LC-PBE (Figure ). Similar to AB and BD, the effects of orbital relaxation are less pronounced for LC-PBE compared to PBE0. This is evident from the fact that the excitation energies predicted with LC-PBE in the expectation value formalism are in better agreement with the LR-TDA/ΔSCF results.
Selective excitation into the Q-bands of octaethyl-ZP in chloroform is best fit with two lifetimes (Figure ). A relatively long-lived 1.1 ns lifetime is attributed to the decay of the convoluted S 1 and S 2 populations into the triplet manifold. Due to slow intersystem crossing from small spin–orbit coupling the singlet excited states of ZP exhibit a significantly longer lifetime compared to the excited singlets of AB and BD. In turn, the 34.8 ± 2.0 μs lifetime is assigned as the lifetime of the T 1 population. Aside from the absence of vibronic structure, the theoretical excited-state absorption spectra of ZP align well with the experimental TAS and DADS spectra (Figure ). Similarly, the theoretical S 1 and T 1 absorption spectra of octaethyl-ZP are in good agreement with the experimental TAS and DADS spectra (Figures S31–S34). However, the triplet geometries of octaethyl-ZP do not represent true minima, as they exhibit one or more imaginary frequencies corresponding to the motion of the ethyl substituents.
19.

Experimental vs theoretical difference spectra for ZP. (Top) Raw TAS difference spectra at various time delays. (Middle) DADS and their respective lifetimes in picoseconds. (Bottom) ΔSCF excited-state difference spectra where X/Y indicates the X excited-state configuration at the Y geometry – ground-state spectrum (S 0/S 0). μs lifetime obtained from ns-TAS.
Experimentally, the difference spectra in the region between 400 and 500 nm show a blue shift over time as the S 1/S 2 population decays and the T n population grows. In contrast, the theoretical excited-state absorption spectra are nearly aligned in energy but differ in intensity. The blue shift from the excited singlet manifold to the excited triplet manifold, around 400–500 nm, can be understood by examining the excited-state absorption spectra in more detail (Figure ). Given the known multiconfigurational character of ZP, it is not surprising that the molecular orbital transitions (Figure ) involve multiple hole–electron pairs, though they can be generally summarized as π → π*.
Focusing on the 24th root, which corresponds to the approximate λ max , from both the S 1 and T 1 excited-state references, it is observed that the T 1 feature is blue-shifted relative to the S 1 feature. Additionally, the 24th root of the T 1 state aligns closely with the 5th and 6th roots from the S 0 reference, which effectively cancel each other out in the theoretical difference spectra, making this shift impossible to see.
Around 350 nm, TAS reveals an excited-state absorption feature that decays over time (Figure ). This feature persists throughout the 5.5 ns time window, gradually diminishing in intensity, and is attributed to the decay of the 37th root from the S 1 reference to the lower-intensity 34th root from the T 1 reference.
Surprisingly, LR-TDA/ΔSCF accurately captures the main excited-state absorption features revealed by TAS using a single reference. In fact, ground- and excited-state spectral features can be mapped to molecular orbital transitions (Figure ), providing a basis for evaluating how substitutions and synthetic modifications influence the spectra. If similar accuracy is observed for other transition metal complexes, LR-TDA/ΔSCF would be a powerful approach for investigating the photophysics of new systems lacking extensive TAS data.
4. Conclusions
LR-TDA/ΔSCF offers an accurate and efficient approach for predicting excited-state absorption spectra across a wide range of chromophores. Benchmarking against experimental TAS data for AB, BD, and ZP demonstrates its effectiveness in assigning transient spectral features and elucidating excited-state relaxation mechanisms. ΔSCF optimizes excited-state single-reference determinants and geometries, while LR-TDA applied to ΔSCF references reliably predicts excited-state absorption energies and oscillator strengths. Although the expectation value formalism with PBE0 results in significant red-shifting, using a long-range corrected hybrid like LC-PBE improves the agreement between calculated and experimental excitation energies for systems where non-Aufbau configurations are computationally expensive or difficult to converge. The complexity and diversity of the test systems demonstrate that LR-TDA/ΔSCF is a practical, efficient, and interpretable method for analyzing TAS spectral features. The molecular orbital-level understanding of excited-state transitions provided by LR-TDA/ΔSCF offers valuable chemical insights, making it an effective tool for exploring photophysical and photochemical mechanisms and for guiding the design of chromophores.
Supplementary Material
Acknowledgments
L.A.F. acknowledges support from a 2024 Sloan Research Fellowship from the Alfred P. Sloan Foundation. L.A.F. and Z.J.K. acknowledge support from the National Science Foundation under Grant No. CHE-2310205, and E.R.Y. and R.C.H. acknowledge support from the National Science Foundation under Grant No. CHE-2323290. Research computing resources were provided by Lehigh University, partially supported by the NSF CC* Compute program through Grant No. OAC-2019035. This work used Bridges2 at the Pittsburgh Supercomputing Center through allocation TG-CHE190011 from the Advanced Cyberinfrastructure Coordination Ecosystem: Services & Support (ACCESS) program, which is supported by National Science Foundation grants #2138259, #2138286, #2138307, #2137603, and #2138296. The authors thank the NSF Major Research Instrumentation Program (CHE-1428633) for funding that established the laser facility. This work used the Lehigh University NMR Facility, partially supported by NSF MRI-1725883. Acknowledgment is made to the donors of the American Chemical Society Petroleum Research Fund for partial support of this research.
The Supporting Information is available free of charge at https://pubs.acs.org/doi/10.1021/acs.jctc.5c00591.
Materials, sample preparation, and NMR; experimental methods for UV–vis, TAS, and GLA fitting; and BODIPY emission, as well as other DFT, ΔSCF, and TDDFT data and figures (PDF)
The authors declare no competing financial interest.
References
- Theoretical and Computational Photochemistry: Fundamentals, Methods, Applications and Synergy with Experimental Approaches; Cristina, G. I. ; Marazzi, M , Eds.; Elsevier: Amsterdam, Netherlands; Cambridge, MA, United States, 2023. [Google Scholar]
- Runge E., Gross E. K. U.. Density-Functional Theory for Time-Dependent Systems. Phys. Rev. Lett. 1984;52:997–1000. doi: 10.1103/PhysRevLett.52.997. [DOI] [Google Scholar]
- Gross E. K. U., Kohn W.. Time-Dependent Density-Functional Theory. Adv. Quantum Chem. 1990;21:255–291. doi: 10.1016/S0065-3276(08)60600-0. [DOI] [Google Scholar]
- Casida, M. E. Time-dependent density functional response theory for molecules. In Recent Advances in Computational Chemistry: Recent Advances In Density Functional Methods: (Part I); World Scientific, 1995; Vol. 1, pp. 155–192. [Google Scholar]
- Petersilka M., Gossmann U. J., Gross E. K. U.. Excitation Energies from Time-Dependent Density-Functional Theory. Phys. Rev. Lett. 1996;76:1212–1215. doi: 10.1103/PhysRevLett.76.1212. [DOI] [PubMed] [Google Scholar]
- Laurent A. D., Jacquemin D.. TD-DFT benchmarks: A review. Int. J. Quantum Chem. 2013;113:2019–2039. doi: 10.1002/qua.24438. [DOI] [Google Scholar]
- Huix-Rotllant, M. ; Ferré, N. ; Barbatti, M. . Quantum Chemistry and Dynamics of Excited States : Methods and Applications; 1st, ed.; González, L. ; Lindh, R. , Eds.; Wiley, 2020; pp. 13–46. [Google Scholar]
- Garcia-Ratés M., Neese F.. Effect of the Solute Cavity on the Solvation Energy and its Derivatives within the Framework of the Gaussian Charge Scheme. J. Comput. Chem. 2020;41:922–939. doi: 10.1002/jcc.26139. [DOI] [PubMed] [Google Scholar]
- Marenich A. V., Cramer C. J., Truhlar D. G.. Universal Solvation Model Based on Solute Electron Density and on a Continuum Model of the Solvent Defined by the Bulk Dielectric Constant and Atomic Surface Tensions. J. Phys. Chem. B. 2009;113:6378–6396. doi: 10.1021/jp810292n. [DOI] [PubMed] [Google Scholar]
- Bursch M., Mewes J.-M., Hansen A., Grimme S.. Best-Practice DFT Protocols for Basic Molecular Computational Chemistry**. Angew. Chem. Int. Ed. 2022;61(42):e202205735. doi: 10.1002/anie.202205735. [DOI] [PMC free article] [PubMed] [Google Scholar]
- Kucharski S. A., Włoch M., Musiał M., Bartlett R. J.. Coupled-cluster theory for excited electronic states: The full equation-of-motion coupled-cluster single, double, and triple excitation method. J. Chem. Phys. 2001;115:8263–8266. doi: 10.1063/1.1416173. [DOI] [Google Scholar]
- Maitra N. T., Zhang F., Cave R. J., Burke K.. Double excitations within time-dependent density functional theory linear response. J. Chem. Phys. 2004;120:5932–5937. doi: 10.1063/1.1651060. [DOI] [PubMed] [Google Scholar]
- Zhang C., Ye C., Yao J., Wu L.-Z.. Spin-related excited-state phenomena in photochemistry. Natl. Sci. Rev. 2024;11(9):nwae244. doi: 10.1093/nsr/nwae244. [DOI] [PMC free article] [PubMed] [Google Scholar]
- Wang J., Durbeej B.. How accurate are TD-DFT excited-state geometries compared to DFT ground-state geometries? J. Comput. Chem. 2020;41:1718–1729. doi: 10.1002/jcc.26213. [DOI] [PubMed] [Google Scholar]
- Sheng X., Zhu H., Yin K., Chen J., Wang J., Wang C., Shao J., Chen F.. Excited-State Absorption by Linear Response Time-Dependent Density Functional Theory. J. Phys. Chem. C. 2020;124:4693–4700. doi: 10.1021/acs.jpcc.9b10335. [DOI] [Google Scholar]
- Zhu H., Wang J., Wang F., Feng E., Sheng X.. Linear and quadratic response TDDFT methods for the excited-state absorption in oligofluorenes. Chem. Phys. Lett. 2021;785:139150. doi: 10.1016/j.cplett.2021.139150. [DOI] [Google Scholar]
- Sałek P., Vahtras O., Helgaker T., Ågren H.. Density-functional theory of linear and nonlinear time-dependent molecular properties. J. Chem. Phys. 2002;117:9630–9645. doi: 10.1063/1.1516805. [DOI] [Google Scholar]
- Andersson K., Malmqvist P. A., Roos B. O., Sadlej A. J., Wolinski K.. Second-order perturbation theory with a CASSCF reference function. J. Phys. Chem. 1990;94:5483–5488. doi: 10.1021/j100377a012. [DOI] [Google Scholar]
- Andersson K., Malmqvist P., Roos B. O.. Second-order perturbation theory with a complete active space self-consistent field reference function. J. Chem. Phys. 1992;96:1218–1226. doi: 10.1063/1.462209. [DOI] [Google Scholar]
- Cronstrand P., Christiansen O., Norman P., Ågren H.. Theoretical calculations of excited state absorption. Phys. Chem. Chem. Phys. 2000;2:5357–5363. doi: 10.1039/b006782m. [DOI] [Google Scholar]
- Cronstrand P., Christiansen O., Norman P., Ågren H.. Ab initio modeling of excited state absorption of polyenes. Phys. Chem. Chem. Phys. 2001;3:2567–2575. doi: 10.1039/b101627j. [DOI] [Google Scholar]
- Conti I., Cerullo G., Nenov A., Garavelli M.. Ultrafast Spectroscopy of Photoactive Molecular Systems from First Principles: Where We Stand Today and Where We Are Going. J. Am. Chem. Soc. 2020;142:16117–16139. doi: 10.1021/jacs.0c04952. [DOI] [PMC free article] [PubMed] [Google Scholar]
- Kochman M. A., Durbeej B., Kubas A.. Simulation and Analysis of the Transient Absorption Spectrum of 4-(N, N -Dimethylamino)benzonitrile (DMABN) in Acetonitrile. J. Phys. Chem. A. 2021;125:8635–8648. doi: 10.1021/acs.jpca.1c06166. [DOI] [PMC free article] [PubMed] [Google Scholar]
- Fedotov D. A., Paul A. C., Posocco P., Santoro F., Garavelli M., Koch H., Coriani S., Improta R.. Excited-State Absorption of Uracil in the Gas Phase: Mapping the Main Decay Paths by Different Electronic Structure Methods. J. Chem. Theory Comput. 2021;17:1638–1652. doi: 10.1021/acs.jctc.0c01150. [DOI] [PubMed] [Google Scholar]
- Širǔček J., Le Guennic B., Damour Y., Loos P.-F., Jacquemin D.. Excited-State Absorption: Reference Oscillator Strengths, Wave Function, and TDDFT Benchmarks. J. Chem. Theory Comput. 2025;21:4688–4703. doi: 10.1021/acs.jctc.5c00159. [DOI] [PubMed] [Google Scholar]
- Bowman D. N., Asher J. C., Fischer S. A., Cramer C. J., Govind N.. Excited-state absorption in tetrapyridyl porphyrins: Comparing real-time and quadratic-response time-dependent density functional theory. Phys. Chem. Chem. Phys. 2017;19:27452–27462. doi: 10.1039/C7CP04567K. [DOI] [PubMed] [Google Scholar]
- Fischer S. A., Cramer C. J., Govind N.. Excited State Absorption from Real-Time Time-Dependent Density Functional Theory. J. Chem. Theory Comput. 2015;11:4294–4303. doi: 10.1021/acs.jctc.5b00473. [DOI] [PubMed] [Google Scholar]
- Mosquera M. A., Chen L. X., Ratner M. A., Schatz G. C.. Sequential double excitations from linear-response time-dependent density functional theory. J. Chem. Phys. 2016;144(20):204105. doi: 10.1063/1.4950876. [DOI] [PubMed] [Google Scholar]
- Mosquera M. A., Jackson N. E., Fauvell T. J., Kelley M. S., Chen L. X., Schatz G. C., Ratner M. A.. Exciton Absorption Spectra by Linear Response Methods: Application to Conjugated Polymers. J. Am. Chem. Soc. 2017;139:3728–3735. doi: 10.1021/jacs.6b12405. [DOI] [PubMed] [Google Scholar]
- Hamburger R., Rumble C., Young E. R.. An Introduction to Processing, Fitting, and Interpreting Transient Absorption Data. J. Visualized Exp. 2024:65519. doi: 10.3791/65519. [DOI] [PubMed] [Google Scholar]
- Woodhouse J., Nass Kovacs G., Coquelle N., Uriarte L. M., Adam V., Barends T. R. M., Byrdin M., de La Mora E., Bruce Doak R., Feliks M.. et al. Photoswitching mechanism of a fluorescent protein revealed by time-resolved crystallography and transient absorption spectroscopy. Nat. Commun. 2020;11(1):741. doi: 10.1038/s41467-020-14537-0. [DOI] [PMC free article] [PubMed] [Google Scholar]
- Sakizadeh J. D., Weiss R., Scholes G. D., Kudisch B.. Ultrafast Spectroscopy and Dynamics of Photoredox Catalysis. Annu. Rev. Phys. Chem. 2025;76(1):203–229. doi: 10.1146/annurev-physchem-082423-013952. [DOI] [PubMed] [Google Scholar]
- Roseli R. B., Tapping P. C., Kee T. W.. Origin of the Excited-State Absorption Spectrum of Polythiophene. J. Phys. Chem. Lett. 2017;8:2806–2811. doi: 10.1021/acs.jpclett.7b01053. [DOI] [PubMed] [Google Scholar]
- Gilbert A. T. B., Besley N. A., Gill P. M. W.. Self-Consistent Field Calculations of Excited States Using the Maximum Overlap Method (MOM) J. Phys. Chem. A. 2008;112:13164–13171. doi: 10.1021/jp801738f. [DOI] [PubMed] [Google Scholar]
- Hirata S., Head-Gordon M.. Time-dependent density functional theory within the Tamm-Dancoff approximation. Chem. Phys. Lett. 1999;314:291–299. doi: 10.1016/S0009-2614(99)01149-5. [DOI] [Google Scholar]
- Kowalczyk T., Yost S. R., Voorhis T. V.. Assessment of the ΔSCF density functional theory approach for electronic excitations in organic dyes. J. Chem. Phys. 2011;134(5):054128. doi: 10.1063/1.3530801. [DOI] [PubMed] [Google Scholar]
- Hashimoto T., Choe Y.-K., Nakano H., Hirao K.. Theoretical Study of the Q and B Bands of Free-Base, Magnesium, and Zinc Porphyrins, and Their Derivatives. J. Phys. Chem. A. 1999;103:1894–1904. doi: 10.1021/jp984807d. [DOI] [Google Scholar]
- Neese F.. Software update: The ORCA program systemVersion 5.0. Wiley Interdiscip. Rev.: Comput. Mol. Sci. 2022;12:e1606. doi: 10.1002/wcms.1606. [DOI] [Google Scholar]
- Adamo C., Barone V.. Toward reliable density functional methods without adjustable parameters: The PBE0 model. J. Chem. Phys. 1999;110:6158–6170. doi: 10.1063/1.478522. [DOI] [Google Scholar]
- Iikura H., Tsuneda T., Yanai T., Hirao K.. A long-range correction scheme for generalized-gradient-approximation exchange functionals. J. Chem. Phys. 2001;115:3540–3544. doi: 10.1063/1.1383587. [DOI] [Google Scholar]
- Weigend F., Ahlrichs R.. Balanced basis sets of split valence, triple zeta valence and quadruple zeta valence quality for H to Rn: Design and assessment of accuracy. Phys. Chem. Chem. Phys. 2005;7:3297–3305. doi: 10.1039/b508541a. [DOI] [PubMed] [Google Scholar]
- Caldeweyher E., Ehlert S., Hansen A., Neugebauer H., Spicher S., Bannwarth C., Grimme S.. A generally applicable atomic-charge dependent London dispersion correction. J. Chem. Phys. 2019;150(15):154122. doi: 10.1063/1.5090222. [DOI] [PubMed] [Google Scholar]
- Yanai T., Tew D. P., Handy N. C.. A new hybrid exchange-correlation functional using the Coulomb-attenuating method (CAM-B3LYP) Chem. Phys. Lett. 2004;393:51–57. doi: 10.1016/j.cplett.2004.06.011. [DOI] [Google Scholar]
- Lu T.. A comprehensive electron wavefunction analysis toolbox for chemists, Multiwfn. J. Chem. Phys. 2024;161(8):082503. doi: 10.1063/5.0216272. [DOI] [PubMed] [Google Scholar]
- Szabo, A. ; Ostlund, N. S. . Modern quantum chemistry: Introduction to advanced electronic structure theory; Dover Publications: Mineola, N.Y, 1996. [Google Scholar]
- Geertsen J., Rittby M., Bartlett R. J.. The equation-of-motion coupled-cluster method: Excitation energies of Be and CO. Chem. Phys. Lett. 1989;164:57–62. doi: 10.1016/0009-2614(89)85202-9. [DOI] [Google Scholar]
- Mertins F., Schirmer J.. Algebraic propagator approaches and intermediate-state representations. I. The biorthogonal and unitary coupled-cluster methods. Phys. Rev. A. 1996;53:2140–2152. doi: 10.1103/PhysRevA.53.2140. [DOI] [PubMed] [Google Scholar]
- Dreuw A., Papapostolou A., Dempwolff A. L.. Algebraic Diagrammatic Construction Schemes Employing the Intermediate State Formalism: Theory, Capabilities, and Interpretation. J. Phys. Chem. A. 2023;127:6635–6646. doi: 10.1021/acs.jpca.3c02761. [DOI] [PubMed] [Google Scholar]
- Roos B. O., Taylor P. R., Sigbahn P. E.. A complete active space SCF method (CASSCF) using a density matrix formulated super-CI approach. Chem. Phys. 1980;48:157–173. doi: 10.1016/0301-0104(80)80045-0. [DOI] [Google Scholar]
- Corzo H. H., Abou Taka A., Pribram-Jones A., Hratchian H. P.. Using projection operators with maximum overlap methods to simplify challenging self-consistent field optimization. J. Comput. Chem. 2022;43:382–390. doi: 10.1002/jcc.26797. [DOI] [PubMed] [Google Scholar]
- Hait D., Head-Gordon M.. Orbital Optimized Density Functional Theory for Electronic Excited States. J. Phys. Chem. Lett. 2021;12:4517–4529. doi: 10.1021/acs.jpclett.1c00744. [DOI] [PubMed] [Google Scholar]
- Barca G. M. J., Gilbert A. T. B., Gill P. M. W.. Simple Models for Difficult Electronic Excitations. J. Chem. Theory Comput. 2018;14:1501–1509. doi: 10.1021/acs.jctc.7b00994. [DOI] [PubMed] [Google Scholar]
- Carter-Fenk K., Herbert J. M.. State-Targeted Energy Projection: A Simple and Robust Approach to Orbital Relaxation of Non-Aufbau Self-Consistent Field Solutions. J. Chem. Theory Comput. 2020;16:5067–5082. doi: 10.1021/acs.jctc.0c00502. [DOI] [PubMed] [Google Scholar]
- Waller M. P., Robertazzi A., Platts J. A., Hibbs D. E., Williams P. A.. Hybrid density functional theory for -stacking interactions: Application to benzenes, pyridines, and DNA bases. J. Comput. Chem. 2006;27:491–504. doi: 10.1002/jcc.20363. [DOI] [PubMed] [Google Scholar]
- Casellas J., Bearpark M. J., Reguero M.. Excited-State Decay in the Photoisomerisation of Azobenzene: A New Balance between Mechanisms. ChemPhyschem. 2016;17:3068–3079. doi: 10.1002/cphc.201600502. [DOI] [PubMed] [Google Scholar]
- Zheng L., Polizzi N. F., Dave A. R., Migliore A., Beratan D. N.. Where Is the Electronic Oscillator Strength? Mapping Oscillator Strength across Molecular Absorption Spectra. J. Phys. Chem. A. 2016;120:1933–1943. doi: 10.1021/acs.jpca.6b00692. [DOI] [PMC free article] [PubMed] [Google Scholar]
- Chang C.-W., Lu Y.-C., Wang T.-T., Diau E. W.-G.. Photoisomerization Dynamics of Azobenzene in Solution with S1 Excitation: A Femtosecond Fluorescence Anisotropy Study. J. Am. Chem. Soc. 2004;126:10109–10118. doi: 10.1021/ja049215p. [DOI] [PubMed] [Google Scholar]
- Taylor J. T., Tozer D. J., Curchod B. F. E.. On the description of conical intersections between excited electronic states with LR-TDDFT and ADC(2) J. Chem. Phys. 2023;159(21):214115. doi: 10.1063/5.0176140. [DOI] [PubMed] [Google Scholar]
- Lednev I. K., Ye T.-Q., Hester R. E., Moore J. N.. Femtosecond Time-Resolved UVVisible Absorption Spectroscopy of trans -Azobenzene in Solution. J. Phys. Chem. 1996;100:13338–13341. doi: 10.1021/jp9610067. [DOI] [Google Scholar]
- Bandara H. M. D., Burdette S. C.. Photoisomerization in different classes of azobenzene. Chem. Soc. Rev. 2012;41:1809–1825. doi: 10.1039/C1CS15179G. [DOI] [PubMed] [Google Scholar]
- Quick M., Dobryakov A. L., Gerecke M., Richter C., Berndt F., Ioffe I. N., Granovsky A. A., Mahrwald R., Ernsting N. P., Kovalenko S. A.. Photoisomerization Dynamics and Pathways of trans - and cis -Azobenzene in Solution from Broadband Femtosecond Spectroscopies and Calculations. J. Phys. Chem. B. 2014;118:8756–8771. doi: 10.1021/jp504999f. [DOI] [PubMed] [Google Scholar]
- Helal W., Alkhatib Q., Gharaibeh M.. Can time-dependent double hybrid density functionals accurately predict electronic excitation energies of BODIPY compounds? Comput. Theor. Chem. 2022;1207:113531. doi: 10.1016/j.comptc.2021.113531. [DOI] [Google Scholar]
- Imran M., Kurganskii I., Taddei M., Butera V., Zhao J., Fedin M. V., Di Donato M., Mazzone G.. Triplet Excited State Mechanistic Study of meso -Substituted Methylthio Bodipy Derivative: Time-Resolved Optical and Electron Paramagnetic Resonance Spectral Studies. ChemPhotochem. 2024;8(7):e202300320. doi: 10.1002/cptc.202300320. [DOI] [Google Scholar]
- DeVetta M., González L., Corral I.. The Role of Electronic Triplet States and High-Lying Singlet States in the Deactivation Mechanism of the Parent BODIPY: An ADC(2) and CASPT2 Study. ChemPhotochem. 2019;3:727–738. doi: 10.1002/cptc.201800169. [DOI] [Google Scholar]
- Strahan J., Popere B. C., Khomein P., Pointer C. A., Martin S. M., Oldacre A. N., Thayumanavan S., Young E. R.. Modulating absorption and charge transfer in bodipy-carbazole donor-acceptor dyads through molecular design. Dalton Trans. 2019;48:8488–8501. doi: 10.1039/C9DT00094A. [DOI] [PubMed] [Google Scholar]
- Liu X., Yeow E. K. L., Velate S., Steer R. P.. Photophysics and spectroscopy of the higher electronic states of zinc metalloporphyrins: A theoretical and experimental study. Phys. Chem. Chem. Phys. 2006;8:1298. doi: 10.1039/b516042a. [DOI] [PubMed] [Google Scholar]
- Gray V., Dreos A., Erhart P., Albinsson B., Moth-Poulsen K., Abrahamsson M.. Loss channels in triplet-triplet annihilation photon upconversion: Importance of annihilator singlet and triplet surface shapes. Phys. Chem. Chem. Phys. 2017;19:10931–10939. doi: 10.1039/C7CP01368J. [DOI] [PubMed] [Google Scholar]
- Yamaguchi K., Jensen F., Dorigo A., Houk K.. A spin correction procedure for unrestricted Hartree-Fock and Møller-Plesset wavefunctions for singlet diradicals and polyradicals. Chem. Phys. Lett. 1988;149:537–542. doi: 10.1016/0009-2614(88)80378-6. [DOI] [Google Scholar]
- Abou Taka A., Corzo H. H., PribramJones A., Hratchian H. P.. Good Vibrations: Calculating Excited-State Frequencies Using Ground-State Self-Consistent Field Models. J. Chem. Theory Comput. 2022;18:7286–7297. doi: 10.1021/acs.jctc.2c00672. [DOI] [PMC free article] [PubMed] [Google Scholar]
- Edwards L., Dolphin D. H., Gouterman M., Adler A. D.. Porphyrins XVII. Vapor absorption spectra and redox reactions: Tetraphenylporphins and porphin. J. Mol. Spectrosc. 1971;38(1):16–32. doi: 10.1016/0022-2852(71)90090-7. [DOI] [Google Scholar]
- Chaudhuri R. K., Freed K. F., Chattopadhyay S., Mahapatra U. S.. Application of an efficient multireference approach to free-base porphin and metalloporphyrins: Ground, excited, and positive ion states. J. Chem. Phys. 2011;135(8):084118. doi: 10.1063/1.3627153. [DOI] [PubMed] [Google Scholar]
Associated Data
This section collects any data citations, data availability statements, or supplementary materials included in this article.