Correction to: Bone Research 10.1038/s41413-018-0041-8, published online 20 February 2019
Following publication of the article,1 the authors detected unintentional image layout errors in the mice-12 weeks group p-S6 of Fig. 2b, the ΔTSC1group metaphysis of Fig. 6b, the normal lgG group OCN of Fig. 6c, and the ΔTSC1group osterix of supplementary Fig. 3g, which necessitate correction due to the improper use of images. These amendments are required; however, they do not alter the study's conclusions or the overall interpretation of the article.
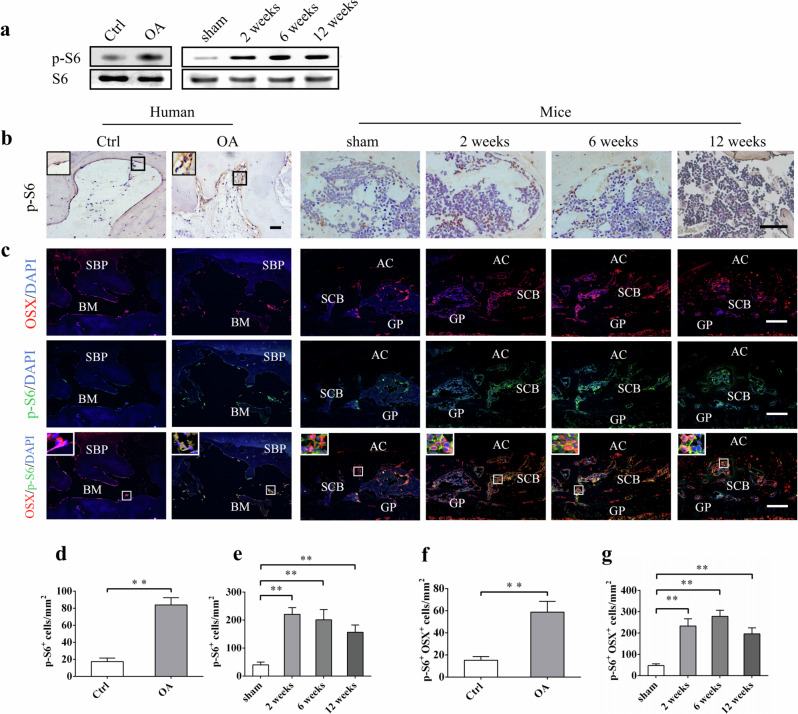
Fig. 2 mTORC1 is activated in subchondral bone preosteoblasts in OA patients and destabilized OA mice. a Western blot analysis of p-S6 expression in tibia subchondral bone tissues from patients and OA mice. b, d, e Representative immunostaining and quantitative analysis of p-S6+ cells in tibial subchondral bone of OA patients and OA mice. Scale bars, 200 μm. c, f, g Representative immunostaining and quantitative analysis of p-S6 in Osterix+ preosteoblasts in tibial subchondral bone of OA patients and OA mice. Boxed area is magnified on the top left corner. Scale bars, 100 μm. SBP subchondral bone plate, BM bone marrow, AC articular cartilage, SCB subchondral bone, GP growth plate. Data are shown as mean ± s.d. and analyze by Student’s t test or one-way ANOVA. n ≥ 8, **P < 0.01
Fig. 2 mTORC1 is activated in subchondral bone preosteoblasts in OA patients and destabilized OA mice. a Western blot analysis of p-S6 expression in tibia subchondral bone tissues from patients and OA mice. b, d, e Representative immunostaining and quantitative analysis of p-S6+ cells in tibial subchondral bone of OA patients and OA mice. Scale bars, 200 μm. c, f, g Representative immunostaining and quantitative analysis of p-S6 in Osterix+ preosteoblasts in tibial subchondral bone of OA patients and OA mice. Boxed area is magnified on the top left corner. Scale bars, 100 μm. SBP subchondral bone plate, BM bone marrow, AC articular cartilage, SCB subchondral bone, GP growth plate. Data are shown as mean ± s.d. and analyze by Student’s t test or one-way ANOVA. n ≥ 8, **P < 0.01
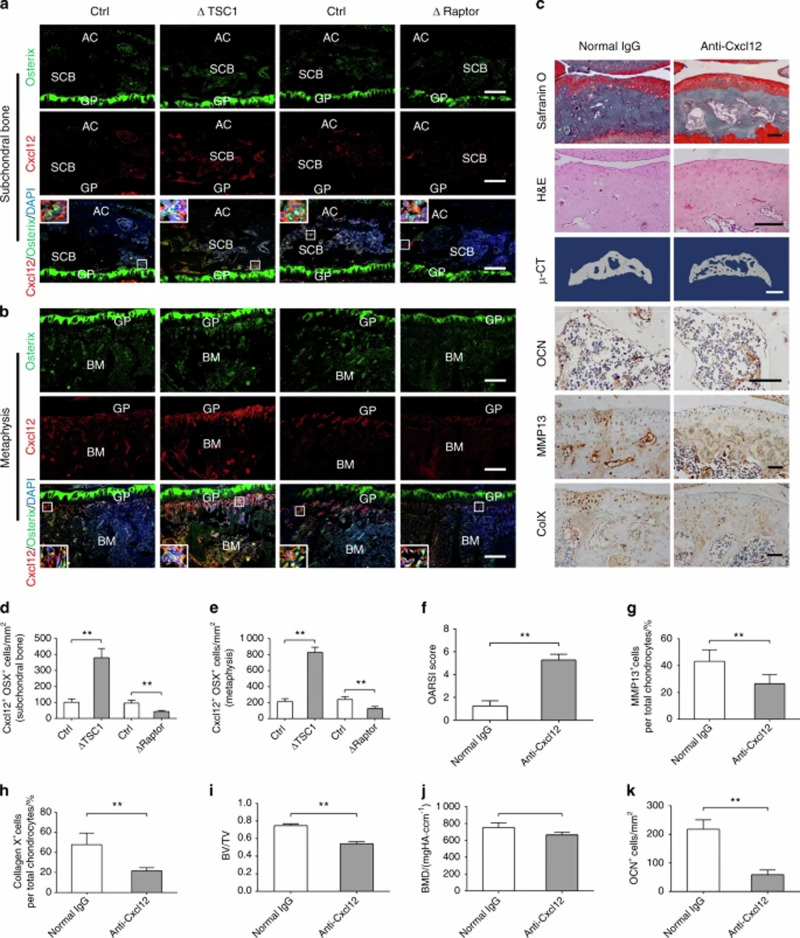
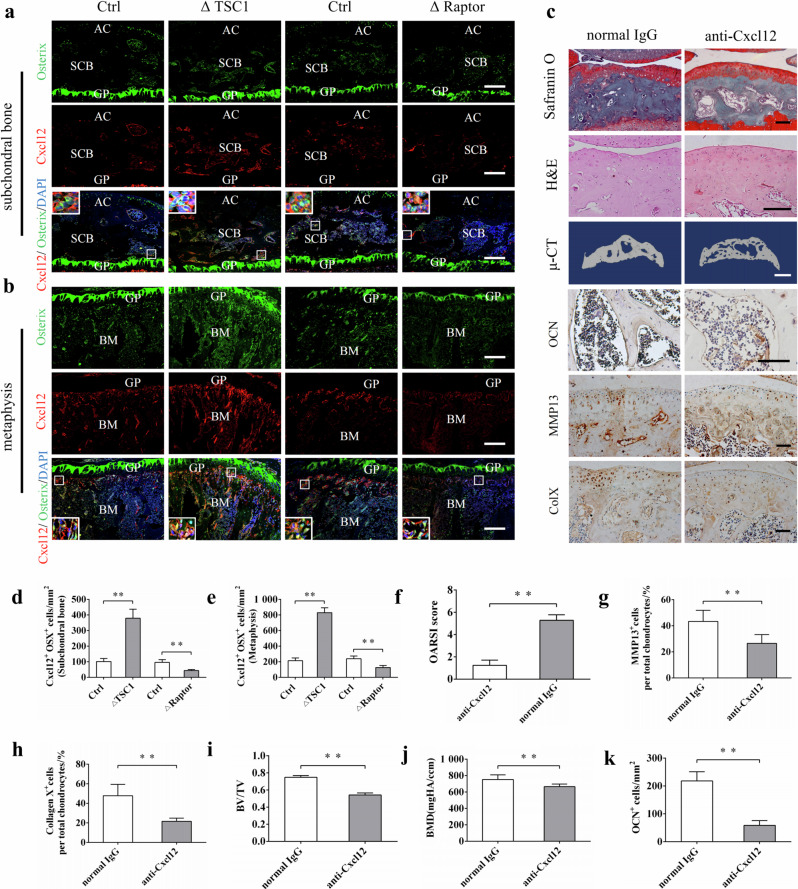
Fig. 6 Administration of anti-Cxcl12 antibody attenuated subchondral bone remodeling and articular cartilage degeneration in ACLT mice. a, b, d, e Representative immunostaining and quantitative analysis of Cxcl12 in Osterix+ preosteoblasts in the subchondral bone and metaphysis in ΔTSC1, ΔRaptor mice, and their littermates (Ctrl). Boxed area is magnified on the corner. Scale bar, 100 μm. AC articular cartilage, SCB subchondral bone, GP growth plate, BM bone marrow. c Representative Safranin O-Fast green, H&E staining, 3D reconstructed μ-CT images and immunohistochemical staining of OCN, type X collagen, and MMP-13 in ΔTSC1 mice administered with anti-Cxcl12 antibody or normal IgG for 6 weeks. Scale bar, 100 μm (Safranin O, H&E staining, OCN, type X collagen, and MMP-13), 1 mm (μ-CT). f OARSI scores based on the histological analysis. g, h Quantitative analysis of type X collagen and MMP-13 in articular cartilage. i, j Quantitative analysis of bone mass in subchondral bone: bone volume/total volume (BV/TV) and bone mineral density (BMD). k Quantitative analysis of OCN+ osteoblasts in tibial subchondral bone. Data are shown as mean ± s.d. and analyzed by Student’s t test. n ≥ 6, **P < 0.01
Fig. 6 Administration of anti-Cxcl12 antibody attenuated subchondral bone remodeling and articular cartilage degeneration in ACLT mice. a, b, d, e Representative immunostaining and quantitative analysis of Cxcl12 in Osterix+ preosteoblasts in the subchondral bone and metaphysis in ΔTSC1, ΔRaptor mice, and their littermates (Ctrl). Boxed area is magnified on the corner. Scale bar, 100 μm. AC articular cartilage, SCB subchondral bone, GP growth plate, BM bone marrow. c Representative Safranin O-Fast green, H&E staining, 3D reconstructed μ-CT images and immunohistochemical staining of OCN, type X collagen, and MMP-13 in ΔTSC1 mice administered with anti-Cxcl12 antibody or normal IgG for 6 weeks. Scale bar, 100 μm (Safranin O, H&E staining, OCN, type X collagen, and MMP-13), 1 mm (μ-CT). f OARSI scores based on the histological analysis. g, h Quantitative analysis of type X collagen and MMP-13 in articular cartilage. i, j Quantitative analysis of bone mass in subchondral bone: bone volume/total volume (BV/TV) and bone mineral density (BMD). k Quantitative analysis of OCN+ osteoblasts in tibial subchondral bone. Data are shown as mean ± s.d. and analyzed by Student’s t test. n ≥ 6, **P < 0.01
The Electronic supplementary material has been updated to correct Supplementary Fig. 3g.
The original article1 was updated.
Footnotes
These authors contributed equally: Chuangxin Lin, Liangliang Liu, Chun Zeng.
Contributor Information
Daozhang Cai, Email: cdz@smu.edu.cn.
Xiaochun Bai, Email: baixc15@smu.edu.cn.
Reference
- 1.Lin, C. et al. Activation of mTORC1 in subchondral bone preosteoblasts promotes osteoarthritis by stimulating bone sclerosis and secretion of CXCL12. Bone Res.7, 5, 10.1038/s41413-018-0041-8 (2019). [DOI] [PMC free article] [PubMed] [Google Scholar]


