

Abstract
Phosphorylation and dephosphorylation play a fundamental role in eukaryotic signaling. Some 30% of proteins are phosphorylated at any time, many on multiple sites, raising the question of how the cellular phosphorylation state is regulated. Previous work for one and two phosphorylation sites has revealed mechanisms, such as distributive phosphorylation, for switch-like regulation of maximally phosphorylated phosphoforms. These insights have led to the influential view that more phosphorylation sites leads to steeper switching, as proposed for substrates like cyclin E and the cyclin-dependent kinase inhibitor Sic1. An analytical study of the ordered distributive case reveals a more complex story. Multisite phosphorylation creates an efficient threshold: The proportion of maximally phosphorylated substrate is maintained close to 0 when the ratio of kinase to phosphatase activity lies below a suitable threshold, and this threshold increases with increasing numbers of sites, n. However, above the threshold, the response may not always abruptly switch between 0 and 1, as would be the case for an efficient switch, but may increase in a gradual manner, which becomes more hyperbolic with increasing n. Abrupt switching cannot be attributed merely to n being large. We point out that conventional measures of ultrasensitivity must be modified to discriminate between thresholding and switching; we discuss additional factors that influence switching efficiency and suggest new directions for experimental investigation.
Keywords: cellular phosphorylation state, distributive versus processive, ultrasensitivity, multistability
Phosphorylation and dephosphorylation (P&D) on serine, threonine, and tyrosine residues are ubiquitous and fundamental processes in eukaryotic signaling. Some 500 protein kinases, and perhaps half as many protein phosphatases, are thought to be present in the human genome (1), and 30% of all proteins in any eukaryotic cell are thought to be phosphorylated at any time (2), many on multiple sites.
A substrate molecule with n phosphorylation sites may occupy 2n potential states. A population of such molecules contains different proportions of molecules in each of these states; these proportions are being determined by the competitive balance between the relevant kinases and phosphatases. In principle, a population of N molecules could occupy (2n)N states. If it seems unlikely that a cell would fully utilize this enormous range of possibilities, that begs the question of how it regulates those phosphorylation states it uses.
Early studies for n = 1 uncovered two regulatory principles. First, P&D could integrate the contributions of multiple effectors and tune the proportion of a singly phosphorylated substrate to any point over a wide range (3). The 2N states in the population are utilized as a discrete proxy for a continuously tunable response. Second, P&D could also exhibit ultrasensitivity, in which a small change in kinase or phosphatase concentration causes a much larger change in the proportion of phosphorylated substrate (3, 4). This ultrasensitivity enables the substrate population to be abruptly switched between predominantly unphosphorylated and predominantly phosphorylated.
More recent studies of the mitogen-activated protein kinase cascade have revealed the importance of distributive catalysis as an additional mechanism for creating ultrasensitivity. Catalytic activity is distributive if at most one modification (phosphorylation or dephosphorylation) takes place before enzyme and substrate molecules part company. It is processive if two or more modifications take place during a single encounter. For n = 2, Huang and Ferrell (5) showed that distributive P&D causes the steady state proportion of doubly phosphorylated substrate to depend ultrasensitively on kinase concentration. In vitro experiments showed that Mek phosphorylation of Erk2 was distributive (6, 7), and later work found the same for the mitogen-activated protein kinase phosphatase MKP3 (8). Ultrasensitivity in the mitogen-activated protein kinase cascade is thought to underlie the all-or-none maturation of Xenopus oocytes (9).
In explaining the ultrasensitive impact of distributivity, (10) argues that, because a distributive mechanism requires two collisions for maximal phosphorylation, “the rate of conversion of phosphorylated MAPKK to doubly phosphorylated MAPKK will increase as the square of the stimulus concentration... (which) translates into a... Hill coefficient of 2.” By this reasoning, if two collisions are good, more are better, so that increasing numbers of phosphorylation sites result in even sharper switches. The proportion of maximally phosphorylated substrate is therefore expected to follow a Hill curve of the form un/(1 + un), where u is some (unspecified) measure of kinase activity relative to phosphatase activity and n is the number of phosphorylation sites, as illustrated in Fig. 1.
Fig. 1.

Hill curves hn(u) = un/(1 + un), for n = 1, 2, and 10, illustrating the current view of distributive phosphorylation. The horizontal axis represents some unspecified measure of kinase activity relative to phosphatase activity. The bold curve is the limit as n → ∞: the “perfect switch.”
This explanation has been widely accepted. In discussing the cyclin-dependent kinase inhibitor Sic1, Nash et al. (11) claim that “the requirement for six distributive phosphorylation events in Sic1 targeting creates an ultrasensitive response, as modeled by degradation = [kinase]nH/(Km + [kinase]nH) with a Hill coefficient (nH) of six.” The same view is reiterated by Welcker et al. (12) in their discussion of the multisite phosphorylation of cyclin E by Cdk2 and GSK3.
We undertake here an analysis of distributive P&D for an arbitrary number of sites. We find a more complex behavior to that suggested by the assertions above. When the enzymes are not saturated, if the relative enzymatic efficiencies (the ratio of kcat/KM for the kinase to that for the phosphatase) are similar at each site, we find the situation depicted in Fig. 2, rather than that in Fig. 1. We shall see that conventional measures of ultrasensitivity can fail to discriminate between these pictures by conflating the properties of thresholding and switching. The curves in Fig. 2 are good thresholds: The proportion of maximally phosphorylated substrate is maintained close to 0 when the ratio of kinase to phosphatase activity is below the threshold, and this threshold value increases with increasing n. However, above the threshold, the response does not switch abruptly from close to 0 to close to 1, as would be the case for an efficient switch, but increases in a hyperbolic manner, which becomes more marked with increasing n. Abrupt switching requires other factors: substantial disparities in the relative enzymatic efficiencies at different sites, saturation effects, or phosphorylation-dependent conformational change. Although the Hill curves are both good thresholds and good switches, multisite phosphorylation is a good threshold but can be a poor switch.
Fig. 2.

Behavior of ordered distributive P&D with n sites, showing ρn(u; 1), as defined in Eq. 10, for n = 1, 2, and 10. The bold curve is ρ(u; 1), defined in Eq. 11 as the limit of ρn(u; 1) as n → ∞.
We suggest in Discussion some experimental directions that would complement the analytical results presented here. We hope these suggestions may stimulate more intensive study of how kinases and phosphatases collectively regulate the cellular phosphorylation state.
Materials and Methods
The existence of multiple steady states was pointed out to the author by Martin Feinberg for the case n = 3 and confirmed for n = 2 to 5 by using the Chemical Reaction Network Theory toolbox (information available upon request). The calculations for Figs. 1, 2, 3 were done in matlab 7 (Mathworks, Natick, MA). All other conclusions were mathematically derived.
Fig. 3.

The Hill curves, hn(u) = un/(1 + un) (solid line), compared with the multisite phosphorylation curves, ρn(u; δ,..., δ, δ1-n), defined in Eq. 13 (dashed line), for δ = 0.1 and n = 2, 5, and 10.
Results
A Model for Ordered Distributive P&D. We consider kinase E and phosphatase F acting distributively on substrate S, having n phosphorylation sites. We focus on the maximally phosphorylated phosphoform, which is often the one relevant to downstream responses (the results hold symmetrically for the maximally unphosphorylated phosphoform). We seek to calculate its proportion in the substrate population at steady state.
Experiments suggest that approximate steady states exist in vivo, in which concentrations of key components remain roughly constant for a limited period (9, 13). This observation perhaps reflects a time scale intermediate between the events at the membrane (≈10 seconds) and initiation of gene transcription (≈30 minutes). Steady states may be reproduced in vitro but to do so requires both kinase and phosphatase to be present. Activated kinase and phosphatase can be mixed with substrate and supplied with the ingredients for phosphorylation, together with an ATP regenerating mechanism to maintain a constant ATP/ADP ratio, until the system reaches a steady state of phosphorylation that can be measured. We note that such experiments have not yet been undertaken.
We make the assumption that P&D is ordered, which allows the number of phosphoforms to be reduced from 2n to n + 1. This assumption simplifies analysis, at the cost of requiring that kinase and phosphatase cooperate to maintain the ordering. Ordered phosphorylation by a kinase is by no means unknown; the most vivid example being GSK3 in its mode of primed phosphorylation (14, 15). The first phosphorylation of Erk2 by Mek is predominantly on the tyrosine residue (6), providing further evidence of ordered phosphorylation. However, the first dephosphorylation of bisphosphorylated Erk2 by MKP3 is also predominantly on the tyrosine residue (8). Hence, in vitro, this pair of kinase and phosphatase, although individually ordered, do not cooperate in maintaining ordering: The substrate population will contain all four phosphoforms.
The assumption of ordered phosphorylation and dephosphorylation has been commonly made in previous studies of multisite phosphorylation, including the original studies for n = 2 (5, 6). We continue the tradition here because the ordered case is still instructive and allows us to understand what may happen in the unordered case. On that basis we argue below, in respect of how switching efficiency changes with n, that the unordered case does not improve over the ordered case.
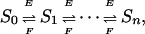
The Fundamental Formulas. Ordered distributivity leads to a chain of enzymatic reactions
 |
[1] |
where Si denotes the phosphoform with i sites phosphorylated. ATP is not explicitly included here as a substrate for the kinase. Suppose this chain is at steady state, so that the concentration of each Si is unchanging. Let ei be the net flux (rate of product formation) from Si to Si + 1 because of kinase E. Similarly, let fi be the net flux in the opposite direction, from Si + 1 to Si, due to F. Because the concentration of each phosphoform is unchanging, the net flux coming to it from the left must equal the net flux leaving it to the right. Hence,
 |
[2] |
But there can be no flux entering the chain from the left at S0 nor leaving it from the right at Sn. Hence, e1 - f1 = 0 and en-1 - fn-1 = 0. Either way, we see that
 |
[3] |
for each i. Hence, when the overall system is at steady state, each individual loop is at steady state. We note that this observation has been repeatedly made in different contexts.
It greatly simplifies the analysis. To exploit it, we need to make some assumptions about the biochemical mechanism behind P&D. We assume that both E and F subscribe to the same enzymatic mechanism
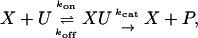 |
[4] |
where X is either E or F, whereas U and P are appropriate phosphoforms. The rate constants are those for mass-action kinetics assuming that the ATP/ADP ratio is held constant and its influence absorbed into the rate constants. Once again, these assumptions have commonly been made in previous work. Reversibility and product inhibition can make a theoretical difference (16–18), but their physiological relevance in P&D is unclear. We continue to follow tradition by using Eq. 3, but this issue needs clarification.
Eq. 4 takes place at each arrow in the enzymatic chain (Eq. 1). These reactions collectively result in 3(n + 1) chemical species: n + 1 phosphoforms, 2n enzyme–substrate complexes, and 2 free enzymes. The dynamics is constrained by three mass conservation laws, because the total amounts of kinase, [Etot]; phosphatase, [Ftot]; and substrate, [Stot], remain constant over any time evolution.
The net flux through Eq. 4 is kcat[XU], where [-] denotes the steady-state concentration. Because the concentration of XU is unchanging at steady state, the same “rate balancing” that we did for Eq. 1 shows that
 |
[5] |
It follows that kcat[XU] = (kcat/KM)[X][U], where the Michaelis-Menten constant is given by KM = (kcat + koff)/kon. Using this formula for the rates of phosphorylation and dephosphorylation between Si and Si+1, which are equal according to Eq. 3, yields
 |
[6] |
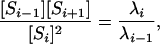
where λi is the ratio of the catalytic efficiency (kcat/KM) of the kinase acting on Si to that of the phosphatase acting on Si + 1. We note that E and F refer to free kinase and phosphatase, respectively: those amounts not bound in any enzyme–substrate complexes. Eq. 6 is central to the present paper.
We note two consequences of it in passing. First, together with mass conservation, it shows that the steady-state concentrations of the 3(n + 1) species in the system are determined by just three of them: [E], [F], and [Stot]. Conversely, if these three are given arbitrary positive values, they determine a steady state (result omitted). Although the system grows in complexity as n increases, the set of steady states remains a three-parameter family. Second, it follows from Eq. 6 that
 |
[7] |
which is independent of [E]/[F] and, therefore, constant across all experiments with the same E, F, and S. This observation provides a stringent test of assumptions. Departures from this formula can be used to discriminate between distributive and processive mechanisms for either kinase or phosphatase (result omitted).
The steady-state proportion of maximally phosphorylated substrate is
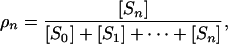 |
[8] |
which can now be determined as a function of u = [E]/[F] and λ0,..., λn-1. Using Eq. 6, we find that ρn(u; λ0,..., λn-1) is
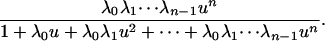 |
[9] |
Multistability. Eq. 9, although quite general, must be interpreted with care. The quantity u is not experimentally controllable. The amounts of free kinase and free phosphatase are set by the dynamics of the system. They depend on the initial state in which the system is prepared: its initial condition. In the in vitro experiment described above, the initial condition is that all kinase is free, all phosphatase is free, and the substrate is completely unphosphorylated. Only 3 of the 3(n + 1) chemical species have nonzero concentrations. The situation in vivo could be very different. Both intermediate phosphoforms and enzyme–substrate complexes could be present, before activation of the system as part of a signaling response. Moreover, an individual cell may have a different initial state at different times, due to protein number changes or cell growth, as may different cells at the same time. The in vivo system is hence likely to explore the space of initial conditions far more thoroughly than may normally be done in vitro.
The reason this difference makes a difference is that different initial conditions may lead to different steady states. Of course, if the initial conditions have different total concentrations, then mass conservation implies that the resulting steady states must exhibit a similar difference. The problem is that initial conditions with the same total concentrations may yield different steady states. Multisite phosphorylation exhibits multistability.
Multistability was first shown for n = 2 (18). It continues to occur for n ≥ 2 (but not for n = 1). This feature greatly complicates the analysis. The proportion of maximally phosphorylated substrate is determined by how u determines ρn(u) and how the initial conditions determine u. The former is explained by Eq. 9. The difficulty arises with the latter. Multistability means that total concentrations cannot be used as a convenient proxy for initial conditions. Two different initial conditions, having the same total concentrations, may give markedly different values of u.
We do not know whether multistability happens for all parameter values or, if not, whether it happens for physiologically realistic ones. If it does, it is difficult to believe that evolution has not made use of it for regulatory purposes. However, it may be difficult to demonstrate experimentally. Broad exploration of initial conditions, while keeping total concentrations fixed, may be needed to find distinct steady states. Controllably preparing such initial conditions in vitro is not straightforward. A different problem arises in vivo. Current methods of identifying phosphoforms are insensitive at single-cell resolution. If different cells in a population are in markedly different steady states, then the population average will smear out the differences.
Dose–Response of Multisite Phosphorylation. For analytical purposes, multistability can be sidestepped. We show that there is a regime (Eq. 19), in which [Stot] is low compared with [Etot] and [Ftot], where [E]/[F] is approximated by [Etot]/[Ftot]. In this regime, Eq. 9 gives an accurate picture of how the proportion of maximally phosphorylated substrate depends on the initial conditions. We outline what happens outside this regime in Discussion.
The behavior of ρn, as given by Eq. 9, depends in a complex way on both the number of sites, n, and on the relative catalytic efficiencies at these sites, λ0,..., λn-1. We first study how it depends on n. To do so, we must discount any change that comes from differences in the λis. Accordingly, assume that the relative catalytic efficiencies are approximately equal at all sites: λi ≈ λ. The proportion of maximally phosphorylated substrate is then given by
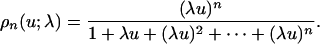 |
[10] |
By analogy with the Hill curves, which approach the perfect switch in Fig. 1 as the Hill coefficient increases, we ask what ρn(u) approaches as n increases. It is shown below that it approaches
 |
[11] |
The graph of ρ(u; λ), shown in Fig. 2 for λ = 1, is the standard hyperbolic Michaelis-Menten response translated to the right along the u axis by 1/λ. The response does not abruptly switch from a low value to a high value after the threshold at u = 1/λ but only attains a high value in a graded, hyperbolic manner. Furthermore, ρn(u; λ) rapidly approaches ρ(u; λ).
We now consider how ρn(u; λ0,..., λn-1) depends on the λis while keeping n fixed. A full treatment is beyond the scope of this paper, but the following calculation is instructive. To create abrupt switching, we can try to make ρn(u) close to the Hill curve hn(u) = un/(1 + un) by appropriate choice of λi. One way to do this approximation is to choose a small positive number δ and set
 |
[12] |
so that ρn(u;δ,..., δ, δ1-n) becomes
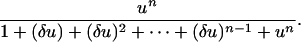 |
[13] |
The effect is to ensure that the denominator of ρn is dominated by 1 + un (at least for δu << 1). Fig. 3 compares hn with ρn for δ = 0.1 and n = 2, 5, and 10. The approximation is good and becomes even better with increasing n. We see that multisite phosphorylation is capable of producing high levels of conventional ultrasensitivity (we thank one of the reviewers for helping clarify this point). However, the cost of achieving this ultrasensitivity is substantial: A Hill coefficient of n requires a disparity in relative catalytic efficiencies of n orders of magnitude.
Measures of Switching and Thresholding. The above discussion has been qualitative. Quantitative measures of switching efficiency have been introduced, but care is needed in interpreting them. The Hill coefficient (19) is ruled out for curves like those in Fig. 2, which are not well approximated by Hill curves. The cooperativity index (4, 19) is f-1(0.9)/f-1(0.1), where y = f(u) is a normalized dose–response curve and u = f-1(y) is the inverse function. For the hyperbolic curve, h1(u) = u/(1 + u), (h1)-1(0.1) = 1/9 and (h1)-1(0.9) = 9, giving a cooperativity index of 81. A cooperativity index of <81 is interpreted as switching efficiency that is higher than hyperbolic, or, in Goldbeter and Koshland's definition, ultrasensitivity. However, if the curve f(u) is translated to the right by T > 0, giving fT(u) = f(u - T), then the cooperativity index changes to (T + f-1(0.9))/(T + f-1(0.1)), which is easily seen to be a decreasing function of T. The switching efficiency of any dose–response curve, as measured by the cooperativity index, increases to its limiting value merely by right translation.
This behavior is not the intuition we wish to convey. Right translation of h1(u) = u/(1 + u) gives the limiting curves for multisite phosphorylation in Eq. 11. If 0 < T1 < T2, we would say that (h1)T2 is a better threshold than (h1)T1, because it maintains the response at a low level for a larger dose range, but both are equally poor at switching between low and high.
The control curve of the dose–response curve y = f(u) is given by (u/y)(dy/du) (20). When evaluated at a steady state of a metabolic system, this quantity is the control coefficient of Metabolic Control Analysis (19). The control curve has the merit of being a function, rather than a number, and, thereby, being sensitive to local nuances of curve shape. However, it is also sensitive to translation and can give rise to striking contradictions when used in conjunction with the cooperativity index. Consider the Hill curve, h4, and the multisite phosphorylation curve, ρ10(u;1). Which is the better switch? The control curves for both may be readily calculated, and it is easily seen that the control curve of ρ10 is greater than that of h4 for all u ≥ 0. Hence, according to the control curve, ρ10 is a better switch than h4. However, the cooperativity index of h4 is 811/4 = 3, whereas that of ρ10 is 9.81. Hence, according to the cooperativity index, h4 is a better switch than ρ10.
Existing quantitative measures must be used with caution. They capture different qualities, which coexist uncomfortably under the banner of “ultrasensitivity.” The intuition we want to convey in the previous example is that ρ10 is a better threshold than h4 but that h4 is a better switch than ρ10. Existing measures fail to discriminate between thresholds and switches. To arrive at measures that do, we must clarify two points.
First, in the dose–response curve (Eq. 9), the independent variable, u = [E]/[F], is dimensionless. This feature gives us the freedom to use additive rather than multiplicative measures in studying multisite phosphorylation.
Second, there has been persistent confusion in the literature over what it means for a dose–response curve to be ultrasensitive, which is sometimes equated with being sigmoidal, or “S shaped.” This approach has the merit of admitting a precise definition: A (normalized) sigmoidal curve is one which increases from 0, approaches 1 asymptotically, and whose derivative first increases and then decreases. Equivalently, sigmoidal curves are the cumulative functions of unimodal probability distributions on [0, ∞) with positive modes. (Some care is required to make this definition precise, if limiting curves like those in Figs. 1 and 2 are to be admitted as sigmoidal functions.) This definition makes it clear that the class of sigmoidal functions is extremely broad. In particular, sigmoidal does not mean ultrasensitive. It can be shown (result not shown) that there are sigmoidal curves whose cooperativity index is any positive number, so that a curve may be sigmoidal yet have a cooperativity index arbitrarily >81 (negative cooperativity). Furthermore, it is unlikely that any single measure will work satisfactorily for all curves. Indeed, it is well known that a probability distribution cannot be captured in any single number such as a mean or mode, and no less should be expected of its cumulative function. This caveat should be borne in mind in respect of the measures below.
Suppose now that y = f(u) is a sigmoidal dose–response curve, which we assume to be normalized, with both y and u dimensionless. Let ε < 1 be a small positive number. Define the lower and upper ε thresholds of f to be, respectively, τε(f) = f-1(ε) and Θε(f) = f-1(1 - ε). Let the ε switch value of f be σε(f) = Θε(f) - τε(f). The cooperativity index may be recovered as 1 + σ0.1(f)/τ0.1(f). τε and σε separate the contributions arising from thresholding and switching that are conflated in the cooperativity index.
If f and g are two sigmoidal dose–response curves, we shall say that f is a better ε threshold than g if τε(f) > τε(g), so that f maintains its response at 0 (to within ε), for a larger dose range than g. We shall say that f is a better ε switch than g if σε(f) < σε(g), so that f requires less change in dose than g to switch between being 0 and 1 (to within ε). To avoid ad hoc choices of any particular ε, bearing in mind the diversity of sigmoidal functions, we shall drop the ε qualification if the conditions hold for all sufficiently small ε> 0. These properties are invariant under translation to the right by any amount. Provided translation to the left does not destroy sigmoidality and the amount of translation is less than any lower ε threshold, they are also invariant under left translation.
Let ρn = ρn(u;1) be the dose–response for multisite phosphorylation in Eq. 10. It can be shown (result not shown) that both hn and ρn are sigmoidal, as defined above, for n > 1. Although the standard hyperbolic response, h1 = ρ1, is not sigmoidal, it is convenient, following ref. 4, to use the corresponding ε switch value, sε = ε-1 - (1-ε)-1, as the demarcation point for abrupt switching. Simple arguments show the following. As expected, the Hill curves are increasingly good thresholds and switches as n increases. Multisite phosphorylation also creates an increasingly good threshold and is a better threshold than the Hill curve with the same n. Multisite phosphorylation also enables a higher threshold to be sustained than the Hill curves: for all sufficiently small ε > 0, τε(hn) < 1 for all n, whereas τε(ρn) > 1 if n is large enough. As for switching efficiency, multisite phosphorylation is worse than hyperbolic for any n > 1 and is thus less efficient at switching than any Hill curve: If n,m > 1, then, for all sufficiently small ε, σε(ρn) > sε > σε(hm).
The Unordered Case. Having worked out the ordered case, Eq. 9 suggests what will happen in the unordered case. Eq. 9 is a fraction in which the denominator contains a term for each phosphoform Si and the numerator contains only a term for Sn. It is the additional terms in the denominator, representing the intermediate phosphoforms S1,..., Sn-1, that cause the departure from a perfect switch. If they were absent, the response would be a Hill function, as suggested in ref. 10. Although the individual contribution from each Si may be small compared with that from Sn when u is large, the contributions add up as n gets large and causes the overall hyperbolic response seen in Eq. 11.
In the unordered case, a structurally similar fraction would be expected. It is not straightforward to write this fraction down explicitly because Eq. 3 no longer holds. However, we would expect the number of terms in the denominator to grow as 2n, instead of n + 1. The number of terms in the numerator would also increase because the maximally phosphorylated phosphoform can now be generated in n different ways, corresponding to the n precursor phosphoforms with just one site unphosphorylated. Because the number of terms of the numerator increases linearly, whereas that of the denominator increases exponentially, the proportion of maximally phosphorylated substrate is likely to increase far more slowly with n than in the ordered case. Although this argument is not rigorous, it suggests that unordered phosphorylation and dephosphorylation will not do any better, in respect of switching efficiency, than the ordered case discussed here.
The Remaining Details. Calculation of ρ(u). Using the formula for the sum of a geometric progression we may rewrite Eq. 10 as
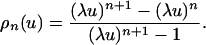 |
[14] |
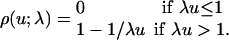
If λu < 1, then (λu)n → 0 as n → ∞, so that ρ(u) = 0. If λu > 1, then (λu)n → ∞ as n → ∞. Rewriting Eq. 14 so that
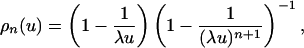 |
[15] |
we see that ρ(u) = 1 - 1/λu, which proves Eq. 11.
Condition for [Etot]/[Ftot] to approximate [E]/[F]. Eq. 6 and the three mass conservation laws can be used to write
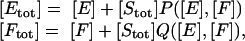 |
[16] |
where P and Q are certain rational functions of [E] and [F] satisfying 0 ≤ P, Q ≤ 1. Suppose that [Stot] << [Ftot], so that [Stot]/[Ftot] is negligible to the first order. The same is then true of ([Stot]Q)/[Ftot] and ([Stot]P)/[Ftot]. Therefore,
 |
[17] |
where ε denotes quantities negligible to the first order. Using the binomial theorem and neglecting terms of higher order in ε,
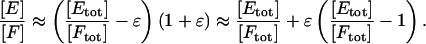 |
[18] |
Hence, [E]/[F] ≈ [Etot]/[Ftot] to the first order, provided that
 |
[19] |
Discussion
We have determined a general formula, Eq. 9, for the proportion of maximally phosphorylated substrate in ordered, distributive, multisite phosphorylation, as a function of [E]/[F] and the relative catalytic efficiencies, kcat/KM, at each site. When the enzymes are not saturated (Eq. 19), [E]/[F] ≈ [Etot]/[Ftot], and this formula gives an accurate picture of the behavior of multisite phosphorylation. We have shown that when the relative catalytic efficiencies are similar at each site, the dose–response of multisite phosphorylation makes a good threshold but a poor switch, as in Fig. 2. Conventional measures of ultrasensitivity, introduced for enzyme and metabolic regulation, have to be adjusted to distinguish these properties in phosphorylation regulation. Although abrupt switching is feasible, it requires substantial disparities between the relative catalytic efficiencies at different sites: to approximate a Hill curve with coefficient n requires a disparity of n orders of magnitude, as in Fig. 3. It remains to be seen to what extent nature has taken advantage of this mechanism, which seems an unwieldy way to make a good switch. We conclude that abrupt switching cannot be attributed merely to there being many phosphorylation sites. These results shed a different light on the regulation of phosphorylation to the comments cited in the Introduction.
They leave open the possibility of other mechanisms for abrupt switching. We discuss two such mechanisms, of which the last is interesting as a plausible general alternative.
Zero-Order Ultrasensitivity. In the Michaelis-Menten approximation for n = 1, increasing saturation of the enzymes by the substrate (the zero-order regime) leads to increasing ultrasensitivity (4). Yet, in the nonapproximate model discussed here, ρ1(u; λ) = λ0 u/(1 + λ0u) is hyperbolic. We see that zero-order ultrasensitivity arises solely in how the initial conditions determine u and not in how u determines ρ1(u;λ). Enzyme saturation lies at the opposite extreme to the regime (Eq. 19) used above, where the initial conditions are irrelevant. This regime is substantially more difficult to analyze. Preliminary calculations indicate that zero-order ultrasensitivity continues to hold outside the Michaelis-Menten approximation and that its effectiveness remains the same as n increases: it is as effective in improving abrupt switching for n = 1 as for n = 20. Although this behavior suggests it may be relevant for heavily phosphorylated substrates, evidence for its in vivo role has so far been limited (21, 22).
Conformational Change Linked to Phosphorylation. The transcription factor NFAT1 (23) is heavily phosphorylated in the cytoplasm of resting cells but translocates upon dephosphorylation of 13 sites by calcineurin. Anecdotal evidence suggests that translocation is decisive, indicating that dephosphorylation may be switch-like. NFAT1 undergoes a conformational change upon dephosphorylation with one conformation favoring retention in the cytoplasm and the other favoring translocation (24). If phosphorylation alters the equilibrium between the conformations, then a linear analysis following the Monod-Wyman-Changeux model of allostery (25) shows that the proportion of translocatable NFAT1 approximates a Hill curve whose coefficient is the number of phosphorylation sites (26). Conformational change linked to phosphorylation may therefore rescue heavily phosphorylated substrates from the increasing hyperbolicity of Fig. 2, allowing them the increasing ultrasensitivity of Fig. 1.
Quantitative studies of phosphorylation regulation have been limited, despite the pioneering work of Chock, Stadtman, and Ferrell. Much is known about kinases and phosphatases separately, and more about the former than the latter, yet both are collectively responsible for the phosphorylation state. In vivo measurements can only rarely be carried out at single cell resolution, the choice of Xenopus oocytes for the mitogen-activated protein kinase studies was not fortuitous, and population averages necessarily obscure the true responses, irrespective of any concerns about multistability. The main difficulty, however, both in vivo and in vitro, lies in distinguishing different phosphoforms. Although techniques for determining phosphorylation sites have advanced rapidly (2), the general problem faced in studying phosphorylation from the perspective of this paper is that of counting, say, of a protein with five phosphorylation sites, those molecules with only sites 1, 2, and 5 phosphorylated amidst a background of other phosphoforms. The mass spectrum from peptide dissociation in tandem mass spectrometry should uniquely identify each phosphopeptide, but deconvoluting the phosphoprotein mixture from that data is not straightforward (27).
The particular problem of determining the proportion of maximally phosphorylated substrate may be easier. An in vitro study with a synthetic substrate would be the best option for testing the results shown in Fig. 2, because the substrate could be made with varying numbers of a single phosphorylation motif. GSK3 is an interesting candidate kinase. In its primed phosphorylation mode, it creates its own phosphoserine-binding site while serially phosphorylating SXXXS repeat motifs (14, 15). Not only does it phosphorylate in order, once it is primed, but it must unbind from each phosphoserine to bind to the next. This behavior is strongly suggestive of a distributive mechanism with different kinase molecules responsible for each phosphorylation. We lack knowledge of a partner phosphatase that is known to be distributive, but any phosphatase that could be persuaded to participate, PP2A, perhaps, would give us more data than we have at present.
Acknowledgments
We thank Lew Cantley, Brian Seed, and Rebecca Ward for stimulating discussions and the reviewers for their helpful comments, which prompted the section on Measures of Switching and Thresholding.
Abbreviation: P&D, phosphorylation and dephosphorylation.
References
- 1.Manning, G., Whyte, D. B., Martinez, R., Hunter, T. & Sudarsanam, S. (2002) Science 298, 1912-1934. [DOI] [PubMed] [Google Scholar]
- 2.Mann, M., Ong, S.-E., Grønberg, M., Steen, H., Jensen, O. N. & Pandey, A. (2002) Trends Biotechnol. 20, 261-268. [DOI] [PubMed] [Google Scholar]
- 3.Shacter-Noiman, E., Chock, P. B. & Stadtman, E. R. (1983) Philos. Trans. R. Soc. London B 302, 157-166. [DOI] [PubMed] [Google Scholar]
- 4.Goldbeter, A. & Koshland, D. E. (1981) Proc. Natl. Acad. Sci. USA 78, 6840-6844. [DOI] [PMC free article] [PubMed] [Google Scholar]
- 5.Huang, C.-Y. F. & Ferrell, J. E., Jr. (1996) Proc. Natl. Acad. Sci. USA 93, 10078-10083. [DOI] [PMC free article] [PubMed] [Google Scholar]
- 6.Ferrell, J. E. & Bhatt, R. R. (1997) J. Biol. Chem. 272, 19008-19016. [DOI] [PubMed] [Google Scholar]
- 7.Burack, W. R. & Sturgill, T. W. (1997) Biochemistry 36, 5929-5933. [DOI] [PubMed] [Google Scholar]
- 8.Zhao, Y. & Zhang, Z.-Y. (2001) J. Biol. Chem. 276, 32382-32391. [DOI] [PubMed] [Google Scholar]
- 9.Ferrell, J. E. & Machleder, E. M. (1998) Science 280, 895-898. [DOI] [PubMed] [Google Scholar]
- 10.Ferrell, J. E. (1996) Trends Biochem. Sci. 21, 460-466. [DOI] [PubMed] [Google Scholar]
- 11.Nash, P., Tang, X., Orlicky, S., Chen, Q., Gertier, F. B., Mendenhall, M. D., Sicheri, F., Pawson, T. & Tyers, M. (2001) Nature 414, 514-521. [DOI] [PubMed] [Google Scholar]
- 12.Welcker, M., Singer, J., Loeb, K. R., Grim, J., Bloecher, A., Gurien-West, M., Clurman, B. E. & Roberts, J. M. (2003) Mol. Cell 12, 381-392. [DOI] [PubMed] [Google Scholar]
- 13.Bhalla, U. & Iyengar, R. (1999) Science 283, 381-387. [DOI] [PubMed] [Google Scholar]
- 14.Cohen, P. & Frame, S. (2001) Nat. Rev. Mol. Cell. Biol. 2, 769-776. [DOI] [PubMed] [Google Scholar]
- 15.Harwood, A. J. (2001) Cell 105, 821-824. [DOI] [PubMed] [Google Scholar]
- 16.Cornish-Bowden, A. & Cárdenas, M. L. (2001) Eur. J. Biochem. 268, 6616-6624. [DOI] [PubMed] [Google Scholar]
- 17.Ortega, F., Acerenza, L., Westerhoff, H. V., Mas, F. & Cascante, M. (2002) Proc. Natl. Acad. Sci. USA 99, 1170-1175. [DOI] [PMC free article] [PubMed] [Google Scholar]
- 18.Markevich, N. I., Hoek, J. B. & Kholodenko, B. N. (2004) J. Cell Biol. 164, 353-359. [DOI] [PMC free article] [PubMed] [Google Scholar]
- 19.Cornish-Bowden, A. (1995) Fundamentals of Enzyme Kinetics (Portland, London), 2nd Ed.
- 20.Brown, G. C., Hoek, J. B. & Kholodenko, B. N. (1997) Trends Biochem. Sci. 22, 288. [DOI] [PubMed] [Google Scholar]
- 21.LaPorte, D. C. & Koshland, D. E. (1983) Nature 305, 286-290. [DOI] [PubMed] [Google Scholar]
- 22.Meinke, M. H. & Edstrom, R. D. (1991) J. Biol. Chem. 266, 2259-2266. [PubMed] [Google Scholar]
- 23.Crabtree, G. R. & Olson, E. N. (2002) Cell 109, S67-S79. [DOI] [PubMed] [Google Scholar]
- 24.Okamura, H., Aramburu, J., Garcia-Rodriguez, C., Viola, J. P. B., Raghavan, A., Tahiliani, M., Zhang, X., Qin, J., Hogan, P. G. & Rao, A. (2000) Mol. Cell 6, 539-550. [DOI] [PubMed] [Google Scholar]
- 25.Monod, J., Wyman, J. & Changeux, J. P. (1965) J. Mol. Biol. 12, 88-118. [DOI] [PubMed] [Google Scholar]
- 26.Salazar, C. & Höfer, T. (2003) J. Mol. Biol. 327, 31-45. [DOI] [PubMed] [Google Scholar]
- 27.Zhou, H., Watts, J. D. & Aebersold, R. (2001) Nat. Biotechnol. 19, 375-378. [DOI] [PubMed] [Google Scholar]