

Abstract
Early animal development can be remarkably variable, influenced by lineage-specific reproductive strategies and adaptations. Yet, early embryogenesis is also strikingly conserved in certain groups, such as Spiralia. In this clade, a shared cleavage program (i.e., spiral cleavage) and similar cell lineages are ancestral to at least seven phyla. Why early development is so conserved in specific groups and plastic in others is not fully understood. Here, we investigated two annelid species (Owenia fusiformis and Capitella teleta) with spiral cleavage but different modes of specifying their primary progenitor cells. By generating high-resolution transcriptomic time courses from the oocyte to gastrulation, we demonstrate that transcriptional dynamics differ markedly between these species during spiral cleavage and instead reflect their distinct timings of embryonic organiser specification. However, the end of cleavage and gastrulation exhibit high transcriptomic similarity, when orthologous transcription factors share gene expression domains, suggesting this period is a previously overlooked mid-developmental transition in annelid embryogenesis. Together, our data reveal hidden transcriptomic plasticity during spiral cleavage, indicating an evolutionary decoupling of morphological and transcriptomic conservation during early embryogenesis.
Keywords: Spiral Cleavage, Maternal-to-Zygotic Transition, Zygotic Genome Activation, Phylotypic Stage, Annelida
Subject terms: Development, Evolution & Ecology
Synopsis

Despite the ancestral conservation of the cell division programme and cell lineages, transcriptional dynamics during spiral cleavage differ between species but converge at the gastrula stage, becoming influenced by the mode of cell fate specification.
Despite the conservation of the cleavage pattern, transcriptional dynamics differ markedly between species during spiral cleavage.
Zygotic genome activation occurs at similar developmental timings but with different intensities during conditional and autonomous spiral cleavage.
Transcriptional dynamics during early development converge at the gastrula stage, which may act as a mid-developmental transition in annelid embryogenesis.
Despite the ancestral conservation of the cell division programme and cell lineages, transcriptional dynamics during spiral cleavage differ between species but converge at the gastrula stage, becoming influenced by the mode of cell fate specification.
Introduction
Upon fertilisation, animal zygotes enter a phase of intense cell division called cleavage, resulting in an embryo––a blastula––made of developmentally committed cells that segregate into the main germ layers during gastrulation (Barresi and Gilbert, 2023; Wolpert et al, 2019). As a foundational stage for subsequent development, broadly conserved cleavage modes are recognised in animals (Barresi and Gilbert, 2023; Wolpert et al, 2019). In the holoblastic radial cleavage, the zygote and its daughter cells divide completely and maintain a radially symmetrical arrangement, at least during the early rounds of cell division. This cleavage mode is widespread, observed throughout the animal phylogeny, and is likely ancestral (Valentine, 1997). However, specific clades, such as tunicate chordates and acoel flatworms, have evolved idiosyncratic and highly stereotypic cleavage programmes, like bilateral cleavage and duet spiral cleavage, respectively (Kimura et al, 2021; Lemaire et al, 2008). Indeed, the initial steps of animal embryogenesis can vary greatly, often influenced by the reproductive strategies of each animal lineage. This is most obvious in animals whose eggs have large amounts of yolk, such as fish, birds, insects, and cephalopods (Barresi and Gilbert, 2023; Wolpert et al, 2019), where complete cytokinesis during cell division does not occur. Deviations in early cleavage can also be more subtle. For example, although sea stars and sea urchins share holoblastic radial cleavage, only the latter form their larval skeleton from a set of vegetal micromeres, a unique trait of this echinoderm lineage (Emura and Yajima, 2022). How do distinct cleavage modes evolve? How do novelties appear during early embryogenesis, and by what genetic and developmental mechanisms?
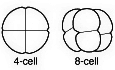
Spiral cleavage is an ancient and highly conserved early developmental programme found in at least seven major animal groups within Spiralia (or Lophotrochozoa), one of the three largest branches of bilaterally symmetrical animals (Laumer et al, 2015; Marletaz et al, 2019; Struck et al, 2014). The alternating shift of the mitotic spindle along the animal-vegetal embryonic axis from the 8-cell stage onwards characterises this cleavage mode and results in a spiral-like arrangement of the animal-pole blastomeres when viewed from above, hence the name of this early embryogenesis (Hejnol, 2010; Henry, 2014; Martin-Duran and Marletaz, 2020). In addition to the conserved pattern of cell divisions, embryos with spiral cleavage also exhibit broadly conserved cell lineages (Nielsen, 2004, 2005). Thereby, equivalent blastomeres in closely and more distantly phylogenetically related species often act as progenitors of similar cell types, tissues, and organs. Despite the conservation of cleavage patterns and cell lineages, embryos with spiral cleavage exhibit two markedly different strategies for specifying their primary cell lineages and establishing their axial patterning (Fig. 1) (Hejnol, 2010; Henry, 2014; Lambert, 2010; Martin-Duran and Marletaz, 2020). In the so-called equal (or conditional) spiral cleavage, bilateral symmetry is established with the inductive specification of a blastomere––the so-called 4d micromere–– that acts as an embryonic organiser at the fifth or sixth round of cell division (the 32- or 64-cell stages, depending on the species) (Fig. 1A–C) (Lambert, 2010). In molluscs and annelids, the FGF receptor pathway and the ERK1/2 transducing cascade regulate this process (Hejnol, 2010; Seudre et al, 2022a; Tan et al, 2022, 2023). However, symmetry breaking occurs much earlier in many molluscan and annelid embryos. In these species, spiral cleavage is regarded as unequal (or autonomous) because the asymmetric segregation of maternal determinants into a larger cell by the second round of cell division (the 4-cell stage) defines the posterodorsal fate and the progenitor lineage of the embryonic organiser (Fig. 1D–F) (Freeman and Lundelius, 1992; Render, 1989). While equal spiral cleavage occurs in all major animal clades with spiral cleavage and is considered the ancestral condition, the unequal mode has evolved independently multiple times (Freeman and Lundelius, 1992). Therefore, spiral cleavage, with overall conserved cell division patterns and cell lineages but recursively evolved distinct modes of cell fate specification and axial patterning, is an ideal system to explore the developmental and evolutionary mechanisms that generate phenotypic change during early animal embryogenesis.
Figure 1. Equal and unequal spiral cleavage in two annelid species.

(A, D) Schematic drawings of equal (or conditional) (A) and unequal (or autonomous) (D) spiral cleavage as exemplified by the early development of the annelids O. fusiformis (B) and C. teleta (E). The drawings highlight the two different types of first zygotic divisions, the idiosyncratic spiral arrangement of the animal and vegetal blastomeres at the 8-cell stage, the different timings of embryonic organiser specification, and distinct gastrula morphologies in embryos that will develop into planktotrophic (O. fusiformis) and lecithotrophic (C. teleta) larvae. (C, F) Z-projections of confocal stacks of oocytes and embryos at the exact stages collected for transcriptomic profiling in O. fusiformis (C) and C. teleta (F). Samples are stained against tubulin and actin (both in grey) to reveal cell membranes and contours. In C. teleta (F), the blastomere lineages at the 2-, 4- and 8-cell stages are highlighted. The cell acting as an embryonic organiser (the 4d micromere in O. fusiformis and the 2d blastomere in C. teleta) is false-coloured in red at the 5 hpf and 16-cell stage, respectively. Drawings are not to scale, and asterisks indicate the animal/anterior pole. bc blastocoele, bp blastopore, hpf hours post-fertilisation, pb polar bodies. In (C, F), scale bars are 50 μm. (C, F) All images come from representative specimens of at least two biological replicates. (E) Copyright 2025 by François Michonneau (CC-BY 4.0). Source data are available online for this figure.
Here, we investigate the genome-wide impact of conditional and autonomous cell fate specification strategies on spiral cleavage. Does the conservation of an ancient programme of cell division patterns and cell lineages constrain the unfolding of developmental programmes during spiral cleavage, or do differences in cell fate specification modes play a more prominent role in defining gene expression dynamics? To answer these, we generated high-resolution transcriptomic profiles at equivalent time points during the early embryogenesis of Owenia fusiformis and Capitella teleta, two annelid worms with equal/conditional and unequal/autonomous spiral cleavage, respectively (Fig. 1) (Amiel et al, 2013; Carrillo-Baltodano et al, 2021; Seudre et al, 2022a). Our findings reveal that these two annelids undergo roughly similar transcriptomic transitional phases during spiral cleavage, with maternal genes likely decaying around the 16-cell stage, and zygotic genome activation starting as early as the 4-cell stage. Nonetheless, the genes and temporal dynamics defining some of these phases are markedly different and mirror the timing and mechanistic differences in axial patterning and embryonic organiser specification between O. fusiformis and C. teleta (Amiel et al, 2013; Seudre et al, 2022a). Despite these differences, the embryos of these annelids exhibit a period of maximal similarity––at the transcriptomic and molecular patterning level––at the late cleavage and gastrula stage, suggesting that, unlike previous hypotheses (Levin et al, 2016; Paps et al, 2015; Wu et al, 2019; Xu et al, 2016), spiral-cleaving species exhibit a mid-developmental transition, or phylotypic stage, during embryogenesis. Together, our study uncovers an unexpected transcriptomic diversity between species with an otherwise broadly conserved cleavage programme, suggesting that distinct cell-fate specification strategies outweigh the conservation of cleavage patterns and overall cell lineages in the evolution of developmental programmes in Spiralia.
Results
Global transcriptional dynamics during spiral cleavage
To investigate the global transcriptional dynamics during annelid spiral cleavage, we generated high-resolution time courses of bulk RNA-seq data for the annelids O. fusiformis and C. teleta, collecting samples in biological duplicates of active or mature oocytes, zygotes, and at each round of cell division until the gastrula stages (Fig. 1C,F). In O. fusiformis, given the small size of the embryos, the 16-, 32-, and 64-cell stages were collected based on developmental timing (3-, 4-, and 5-h post-fertilisation [hpf], respectively), following a previous description of its early embryogenesis (Carrillo-Baltodano et al, 2021). In all cases, replicates correlated highly (Appendix Figs. S1A,B and S2A,B), with developmental timing accounting for most of the variance (62.4 and 57.6% for O. fusiformis and C. teleta, respectively) in both species (Fig. 2A,B). However, unlike the activated oocyte of O. fusiformis, the oocyte stage of C. teleta was markedly transcriptionally distinct from the fertilised zygote (Fig. 2B; Appendix Fig. 2A), suggesting that either the collected oocytes were not fully mature or that significant transcriptomic changes occur during mating and fertilisation in this species. Since fertilisation is poorly understood in C. teleta and cannot be experimentally controlled (Blake et al, 2009; Reish, 1974), we could not discern between these two possibilities. Thus, we discarded the oocyte stage for this species in the downstream analyses.
Figure 2. Global transcriptional dynamics during conditional and autonomous spiral cleavage.

(A, B) Principal component analyses support that developmental time accounts for the most considerable fraction of the variance in the transcriptomic time courses during spiral cleavage in O. fusiformis and C. teleta. (C) Similarity clustering reveals three primary sample groups during spiral cleavage in both species. (D) O. fusiformis and C. teleta show different dynamics in the total number of expressed genes during spiral cleavage, which align with the different timings of organiser specification in these species (highlighted by a yellow and green bar, respectively). (E, F) Bar plots depicting the number of differentially expressed genes (upregulated in red and downregulated in blue) during spiral cleavage in O. fusiformis (E) and C. teleta (F). The earliest signs of zygotic genome activation are highlighted with a yellow and green bar, respectively.
Similarity clustering revealed three transcriptionally distinct groups during spiral cleavage in the two annelids (Fig. 2C). The earliest cluster comprises the oocyte (in O. fusiformis) and early cleavage stages up to the 8-cell stage. The late cleavage time points (3 to 5 hpf in O. fusiformis and the 16-cell to 64-cell stages in C. teleta) and the gastrula stages make up the two other groups. Accordingly, the number of expressed genes (those with transcripts per million [TPM] values above 2; Appendix Figs. S1C and S2C) is relatively constant between stages in the first cluster in both species (Fig. 2D). However, there is a continuous increase in the number of expressed genes during the late cleavage and, particularly, with gastrulation. This increase in C. teleta starts as early as the 16-cell stage and occurs more sharply than in O. fusiformis, in which the rise is gradual and not evident until the 64-cell stage (Fig. 2D). Notably, these distinct dynamics mirror the different timings of axial specification in O. fusiformis and C. teleta (Figs. 1A,D and 2C) (Amiel et al, 2013; Seudre et al, 2022a), suggesting that conditional and autonomous specification of the embryonic organiser influence global transcriptional trends during cleavage in these annelids.
Statistically significant changes in gene expression support the distinct transcriptional activation dynamics between O. fusiformis and C. teleta (Fig. 2E,F). While there is a gradual increase in the differentially expressed genes (DEGs) becoming upregulated from 3 hpf onwards in O. fusiformis, the number of upregulated DEGs at the equivalent 16-cell stage is more prominent, and a steep change from the levels of DEGs in the previous pairwise comparison in C. teleta (78 in O. fusiformis vs 1890 in C. teleta) (Appendix Table S1; Datasets EV1–EV30). This agrees with the timing of specification of the embryonic organiser in C. teleta and supports its role in triggering transcriptional programmes involved in embryonic patterning and cell fate commitment at that stage in this species (Amiel et al, 2013). In both species, however, gastrulation involves a prominent transcriptional reshaping, with five to seven times more up- and downregulated DEGs at that stage compared with previous cleavage stages (Fig. 2E,F). Accordingly, Gene Ontology (GO) terms enriched in the genes upregulated in the gastrula of both species are involved in development and transcriptional regulation (Appendix Figs. S3H and S5G). Interestingly, we identified DEGs between the oocyte and zygote (in O. fusiformis) and the 2-cell stage and zygote (in C. teleta). In the two annelids, downregulated DEGs are more abundant at these stages (290 in O. fusiformis and 1,101 in C. teleta), are involved in metabolism and translation (O. fusiformis) and protein transport and localisation (C. teleta) and might likely represent maternal genes of quick decay (Fig. 2E,F; Appendix Figs. S4A and S6A). Nonetheless, we also detected 203 and 527 upregulated genes in O. fusiformis and C. teleta, respectively, at those stages (Fig. 2E,F). These are enriched for GO terms related to cellular organisation (Appendix Figs. S3A and S5A) and might represent differentially polyadenylated transcripts upon fertilisation and the first zygotic division, as observed in other invertebrates (Rouhana et al, 2023; Wilt, 1973). Altogether, our high-resolution dataset demonstrates that annelid embryos shared similar transcriptomic phases during spiral cleavage. Yet, the modes and timing of organiser specification influence the span and intensity of these phases during early development.
The maternal-to-zygotic transition in O. fusiformis and C. teleta
In O. fusiformis and C. teleta, the first prominent increase in DEGs occurs at the 16-cell stage, the fourth round of cell division after fertilisation (Fig. 2E,F). This suggests that zygotic genome activation, and thus the maternal-to-zygotic transition (MZT), might occur around that stage, albeit with different intensities, in the two annelids. To characterise the exact timing of zygotic genome activation, we treated embryos of O. fusiformis and C. teleta with actinomycin D, a commonly used transcriptional inhibitor (Sobell, 1985), in staggered time windows from the 2-cell stage until 6 hpf in O. fusiformis and the 32-cell stage in C. teleta (Fig. 3A,B). In both species, blocking zygotic transcription until the 8-cell stage does not compromise normal development, although the embryos of O. fusiformis look smaller (Fig. 3A,B). However, if zygotic transcription is inhibited until the 16-cell stage or later, the embryos develop abnormally (although some cellular differentiation is observed when treating between 3 and 4 hpf in O. fusiformis) (Fig. 3A,B), consistent with our RNA-seq data and the timing of the first wave of DGE in these annelids (Fig. 2E,F). Importantly, samples treated until 5 hpf (in O. fusiformis) and the 32-cell stage (in C. teleta) exhibited more severe phenotypes and failed to gastrulate, supporting that the large increase in zygotic activation occurs earlier in C. teleta and coincides with the specification of the embryonic organiser in both annelids (Fig. 3A,B). Immunostaining against RPB1, the largest subunit of DNA polymerase II, indicates that the nuclearisation of the transcriptional machinery starts at the 4-cell stage in both O. fusiformis and C. teleta (Fig. EV1A,C), despite rpb1 being a maternally provided transcript (Fig. EV1B,D). Interestingly, RPB1 exhibits an asymmetric nuclear signal at the 4-cell stage in C. teleta, with blastomeres C and D displaying a stronger signal than A and B (Fig. EV1C). Therefore, the timing of zygotic genome activation is equivalent in annelids with conditional and autonomous spiral cleavage, likely occurring between the 4- and the 16-cell stages in O. fusiformis and C. teleta.
Figure 3. The zygotic genome activation in O. fusiformis and C. teleta.

(A, B) Z-projections of confocal stacks showing the morphological phenotype of 24 h post-fertilisation O. fusiformis larvae (A) and stage 5 C. teleta larvae (B) after windows of actinomycin D treatment during early cleavage. Inhibition of zygotic transcription from the 16-cell stage on compromises normal embryogenesis in the two annelids. However, in O. fusiformis, there is cellular differentiation between 3 to 5 hpf (white arrows), and in both annelids, the most severe phenotypes appear when inhibiting zygotic genome activation during the specification of the embryonic organiser and major wave of differential gene expression (grey background). (C, D) Volcano plots indicating up- and downregulated genes in the 8-cell to 16-cell transition in O. fusiformis (C) and C. teleta (D). Only two one-to-one orthologs (fjx1 and jub) are differentially expressed at this stage in both species. LFC stands for log-fold change. P-values in (C, D) were derived from the described DESeq2 pipeline (Wald test) and Benjamini–Hochberg-adjusted. (E, F) Whole-mount in situ hybridisation of jbx1 from the 16-cell stage (or 3 hpf in O. fusiformis) until gastrulation in O. fusiformis (E) and C. teleta (F). In O. fusiformis, jbx1 is asymmetrically expressed in the anterior ectoderm. In C. teleta, jbx1 is broadly expressed during cleavage and asymmetrically localised in the anterior neuroectoderm and endoderm in the gastrula. All images come from representative specimens of at least two biological replicates. Asterisks in (E, F) indicate the animal pole. ao apical organ, bc blastocoele, bp blastopore, br brain, cb ciliary band, gp gastral plate, mo mouth. Source data are available online for this figure.
Figure EV1. Dynamics of RNA polymerase II nuclearisation during spiral cleavage.

(A, C) Z-projections of confocal stacks of embryos of O. fusiformis (A) and C. teleta (C) from the 2-cell stage to 4 h post-fertilisation (hpf) or the 32-cell stage. RNA polymerase II localises to the nuclei from the 4-cell stage onwards in both annelids. In C. teleta, the nuclearisation is more intense in the C and D blastomeres than in the A and B cells. (B, D) Expression dynamics of the RPB1 gene (largest subunit of the RNA polymerase II, recognised by the antibody used in A and C) in O. fusiformis (B) and C. teleta (D). In the two annelids, RPB1 is a highly abundant maternal gene. Gene expression values are the average of two biological replicates.
To explore the genes potentially involved in the zygotic genome activation and how this process compares between these species, we used previously calculated functional annotations and one-to-one orthologs in O. fusiformis and C. teleta (Martin-Zamora et al, 2023). Upregulated genes at 3 hpf (in O. fusiformis) and the 16-cell stage (in C. teleta) are enriched for GO categories related to transcription (Fig. 3C,D; Appendix Figs. S3E and S5D). In O. fusiformis, these involve over ten unclassified TALE homeoboxes, which are expanded in Spiralia and expressed during early cleavage along the animal-vegetal axis (Morino et al, 2017), and several Fox genes, including many of the expanded foxQ2 genes that are asymmetrically expressed in the animal pole at 3 hpf (Seudre et al, 2022b) and foxA, which is a well-known pioneer factor initiating chromatin opening (Barral and Zaret, 2024; Cirillo et al, 2002). As expected by their higher number, upregulated genes at the 16-cell stage are diverse and involved in numerous developmental processes in C. teleta. These include, among others, genes directly involved in transcriptional regulation (e.g. transcription elongation factors and histone demethylases), cell-fate specification transcription factors (e.g. Six genes, otx, otp, Fox genes) and signalling pathway components (e.g. Wnt ligands, Frizzled and FGF receptors and TGF-b modulators) (Dataset EV23). However, only two genes upregulated at the 16-cell stage in C. teleta had a differentially expressed ortholog at 3 hpf in O. fusiformis (Fig. 3C,D). One––fjx1, the homologue of four jointed in Drosophila melanogaster, involved in conferring positional information as a potential downstream target of the Notch Delta pathway (Buckles et al, 2001; Rock et al, 2005)––was upregulated in both species, but the other one––jub, a gene encoding for AJUBA, a protein involved in many developmental processes, from transcriptional co-repression to the negative regulation of the Hippo signalling (Schimizzi and Longmore, 2015)––was downregulated in O. fusiformis (Fig. 3C). Therefore, although MZT may occur at similar developmental stages, the first signs of zygotic genome activation largely involve different genes and regulatory outcomes in O. fusiformis and C. teleta.
Given the shared upregulation of fjx1 at the 16-cell stage, we compared the expression of this gene from this time point until gastrulation in O. fusiformis and C. teleta (Fig. 3E,F). Consistent with its modest upregulation (Fig. 3C), we did not detect expression for fjx1 by whole-mount in situ hybridisation at 3 hpf in O. fusiformis (Fig. 3E). At 4 and 5 hpf, fjx1 was, however, strongly expressed in the animal-most ectoderm but not in the top micromeres, becoming restricted to four radially symmetrical cell clusters in the animal hemisphere at the gastrula stage (Fig. 3E). This pattern is reminiscent of the expression of several foxQ2 genes during spiral cleavage in O. fusiformis, which are already expressed at the 16-cell stage (Seudre et al, 2022b). In C. teleta, however, fjx1 showed a broader expression domain from the 16- to the 64-cell stage, and its expression became restricted to the anterior neuroectoderm and endoderm at the gastrula stage (Fig. 3F). Therefore, orthologous genes also follow different spatial expression dynamics upon zygotic genome activation, which occurs asymmetrically throughout the embryo, at least in O. fusiformis.
Gene-specific transcriptional dynamics differ in spiral cleavage
Although spiral cleavage is a highly stereotypical developmental programme (Hejnol, 2010; Henry, 2014; Martin-Duran and Marletaz, 2020; Nielsen, 2004, 2005), our findings at the 16-cell stage hint at gene-specific differences between annelid embryos at similar developmental time points (Fig. 3C,D). To attain a comparative, genome-wide view of gene expression dynamics between O. fusiformis and C. teleta, we first used one-to-one orthologs (n = 7607) to calculate the Jensen-Shannon index of transcriptomic similarity during early development in the two annelids (Fig. 4A). Consistent with our observations at the 16-cell stage, transcriptomic similarity is low during cleavage stages but increases in the late blastula and gastrula stages (Fig. 4A). Notably, a similar trend is observed when comparing O. fusiformis and C. teleta with other annelids that have available transcriptomic data during spiral cleavage (Fig. EV2A,B), despite technical and sampling differences between these datasets. Soft k-means clustering of all expressed genes during early embryogenesis (31,323 for O. fusiformis and 38,662 for C. teleta) revealed five and seven clusters of temporally coexpressed genes in O. fusiformis and C. teleta, respectively (Fig. 4B,C; Datasets EV31 and EV32). The first two temporally active clusters in both species are maternal genes that are either oocyte-/zygote-specific (cluster 1; 3593 genes in O. fusiformis and 2934 in C. teleta) and have a different codon usage than zygotically expressed genes (Appendix Fig. S7A,C,D) or that peak shortly after fertilisation (cluster 2; 5317 genes in O. fusiformis and 5450 in C. teleta) (Fig. 4B,C). Genes in cluster 1 get quickly removed with fertilisation and the first zygotic division, while genes in cluster 2 decay before the 8-cell stage in both species. GO and KEGG pathway enrichment analyses indicate that these clusters are overrepresented by genes involved in metabolism, suggesting an early clearance of transcripts that may be involved in oocyte maturation (Appendix Figs. S8A–F and S9A–F). In O. fusiformis, 168 of the 290 differentially downregulated genes between the oocyte and the zygote (57.93%; Fig. 2D) are oocyte-specific (cluster 1), supporting a rapid elimination of transcripts potentially involved in oocyte maturation upon fertilisation (Appendix Fig. S4A). Likewise, 162 of the 203 upregulated genes with fertilisation (57.93%; Fig. 2D) in O. fusiformis, and potentially polyadenylated, were not cleared during early cleavage (i.e. were not in clusters 1 and 2), suggesting that, as in other organisms, polyadenylation might be a mechanism to differentially stabilise maternally deposited transcripts (Rouhana et al, 2023; Wilt, 1973).
Figure 4. Distinct transcriptomic routes during spiral cleavage in the annelids O. fusiformis and C. teleta.

(A) Jensen-Shannon distance represents the transcriptomic divergence during the spiral cleavage of O. fusiformis and C. teleta. The point of maximal transcriptomic similarity between these annelids occurs at the late cleavage and gastrulation. (B, C) Soft k-means clustering of temporally coexpressed genes in O. fusiformis (B) and C. teleta (C). In both species, the first two clusters likely represent maternal transcripts that decay early, while the rest largely or entirely comprise zygotically expressed genes. Unlike O. fusiformis, C. teleta has cleavage-specific clusters at the 16-cell, 32-cell and 64-cell stages. (D) Comparison of gene family cluster composition between O. fusiformis and C. teleta. Although gene-specific transcriptional dynamics are dissimilar, the deployment of gene families in maternal, early zygotic, and embryonic clusters is similar between these annelids. P values were derived from upper-tail hypergeometric tests and Benjamini–Hochberg-adjusted (adj. P value). (E) Alluvial plot depicting the comparative deployment of one-to-one orthologs (n = 7607) in clusters of temporally coexpressed genes during spiral cleavage in O. fusiformis and C. teleta. The embryonic clusters exhibit the most extensive conservation of gene composition between species. (F) Gene Ontology (GO) enrichment of shared orthologs between oocyte/zygote, maternal decay, early zygotic, and embryonic clusters, according to the GO annotation of O. fusiformis. While oocyte/zygotic genes are involved in metabolism, shared orthologs of maternal decay are involved in the cell cycle and cellular organisation, and early zygotic and embryonic genes are involved in transcriptional control and development. P values were computed from upper-tail Fisher’s exact tests to detect overrepresented terms.
Figure EV2. Transcriptomic dynamics during spiral cleavage in Annelida.

(A, B) Jensen-Shannon transcriptomic divergence during the spiral cleavage between O. fusiformis (A) and C. teleta (B) and four other annelid species with publicly available transcriptomic resources covering at least one cleavage stage and the gastrula stage. In all cases, the point of maximal transcriptomic similarity occurs at the late cleavage and gastrulation (grey horizontal bar).
In both species, the remaining clusters (3 to 5 in O. fusiformis and 3 to 7 in C. teleta) comprise genes that increase in expression around the 8-cell stage or later (Fig. 4B,C). In O. fusiformis, early zygotic genes (cluster 3; 4610 genes) become more highly expressed at the 8-cell stage but are primarily restricted to the 3- and 4-hpf stages. This early upregulation is consistent with a nuclearisation of the RNA polymerase II at the 4-cell stage (Fig. EV1). These genes are still involved in housekeeping functions, such as metabolism, cellular transport, and protein/organelle localisation (Fig. 4B; Appendix Fig. S8G–I). In contrast, late zygotic genes (cluster 4; 4109 genes) peak at 5 hpf and are enriched in GO terms involved in MAPK signalling, amongst other signalling pathways (Appendix Fig. S8J–L), which is consistent with the activation of ERK1/2 at this stage to define the embryonic organiser in O. fusiformis (Seudre et al, 2022a). Lastly, a large (13,695 genes) gene set enriched in GO terms related to animal development (cluster 5) emerges upon gastrulation in O. fusiformis (Fig. 4B; Appendix Fig. S8M–O). Capitella teleta also showed a gene set (cluster 3; 6161 genes) of early zygotic expression involved in metabolism, cellular transport, and protein localisation that is lowly expressed in the zygote and gradually increases its expression to peak at the 8-cell stage, again consistent with the dynamics of RNA polymerase II immunostaining at these stages (Fig. 4C; Appendix Fig. S9G–I). Likewise, this species also exhibits a large gene cluster restricted to gastrulation (cluster 7; 13,541 genes; Fig. 4C). However, unlike O. fusiformis, C. teleta exhibits stage-specific clusters of temporally coregulated genes for the 16-cell (2310 genes), 32-cell (3104 genes), and 64-cell (4841 genes) stages (Fig. 4C). Genes in these clusters involve diverse biological processes, but DNA metabolism and GPCR-mediated neuropeptide signalling are common (Appendix Fig. S9J–R). However, around half of the genes in these clusters do not have a functional annotation (1040 genes or 45% in cluster 4; 1565 or 50.42% in cluster 5; and 2161 genes or 44.64% in cluster 6), indicating that lineage-restricted genes might play a role at these cleavage stages in C. teleta. Altogether, our findings support that O. fusiformis and C. teleta generally follow similar transcriptional trends. However, C. teleta shows more complex and dynamic gene coexpression patterns of zygotically expressed genes, whereas O. fusiformis mainly restricts zygotic expression with and after the specification of the embryonic organiser at 5 hpf.
Despite the shared transcriptional trends between O. fusiformis and C. teleta (Fig. 4B,C), the gene-specific transcriptional similarity is low during spiral cleavage (Fig. 4A). This might indicate that either cluster composition is dissimilar, or similar genes comprise equivalent clusters but are expressed at different levels. To test this, we first performed cross-species pairwise comparisons of orthogroup composition between clusters of temporally coexpressed genes (Fig. 4D). Clusters comprising genes of maternal decay (clusters 2), early zygotic expression (clusters 3), and embryonic expression (cluster 5 in O. fusiformis and cluster 7 in C. teleta) showed high inter-species conservation, supporting these include gene families involved in core, conserved embryonic processes, such as early cell cycle progression, and body patterning (Appendix Figs. S8D–I,M–O and S9D–I,S–U). However, C. teleta’s cleavage-specific clusters showed little correspondence with any cluster in O. fusiformis (Fig. 4D). Moreover, embryonic clusters in both species, especially in C. teleta, showed similarity with earlier gene sets of coexpressed genes (Fig. 4D). Next, we compared the cluster allocation of one-to-one orthologs (Fig. 4E). Differences in orthogroup composition are general and profound (Figs. 4E and EV3A). For example, 8.18% (622) of embryonic genes in O. fusiformis exhibited maternal expression in C. teleta; conversely, 11.29% (859) of embryonic genes in C. teleta were maternal in O. fusiformis. However, as expected, embryonic (14.92% in O. fusiformis), early zygotic (6.02% in O. fusiformis), and maternal decay (4.23% in O. fusiformis) clusters show the highest (yet still relatively low) proportions of conserved one-to-one orthologs (Fig. EV3A). These shared orthologs are enriched in GO terms for cell-cycle progression and protein/organelle localisation (maternal decay clusters), morphogenesis (early zygotic) and transcription (embryonic) (Figs. 4F and EV3B–F). Although the long evolutionary distance between O. fusiformis and C. teleta likely influences the extent to which gene-specific transcriptional dynamics differ during cleavage in these species, our findings indicate extensive temporal differences in gene usage between O. fusiformis and C. teleta. Therefore, only a small proportion of genes might be essential and evolutionarily conserved to maintain the fundamental properties of spiral cleavage and annelid embryogenesis.
Figure EV3. The comparison of clusters of temporally coregulated genes between conditional and autonomous spiral cleavage.

(A) Upset plot indicating the number of shared one-to-one orthologs between clusters of temporally coregulated genes. The inset indicates the total number of genes in each cluster. (B–F) Bar plots indicating the top ten Gene Ontology (GO) categories amongst shared orthologous genes in the oocyte/zygote, maternal decay, early zygotic, and embryonic clusters, according to the GO annotation for the C. teleta ortholog. P values were computed from upper-tail Fisher’s exact tests.
Temporal shifts in the activation of developmental programmes
Because genes conserved between O. fusiformis and C. teleta are enriched in GO categories associated with morphogenesis and transcription (Fig. 4F), we hypothesised that a fraction of those would be transcription factors (TFs) sustaining conserved developmental programmes in early annelid embryogenesis. We thus first characterised the expression dynamics of TFs in these two annelid species. The number of expressed TFs increases as spiral cleavage proceeds in both species (Fig. 5A; Appendix Fig. S10A). However, TFs are especially abundant in the embryonic cluster of temporally coregulated genes (Fig. 5B; Appendix Fig. S10B), as expected for this gene set to be involved in transcription and activation of body patterning developmental programmes. As per TF class, zinc fingers of class C2H2 dominate the repertoire of expressed TFs (e.g. 454 and 178 at the gastrula stage and embryonic cluster in O. fusiformis, respectively; 235 and 187 at the gastrula stage and embryonic cluster in C. teleta, respectively), followed by homeodomain-containing and bHLH genes (Datasets EV33–EV36). To further understand how similar TF expression dynamics are between species, we compared the TF gene family composition of clusters of coexpressed genes (Fig. 5C). As with genome-wide approaches, inter-species similarity in TF expression is the highest in embryonic and maternal decay clusters. However, TF gene family composition was also similar between the embryonic cluster in O. fusiformis and the zygotic/maternal decay cluster in C. teleta and between the embryonic cluster in C. teleta and the maternal decay/early zygotic cluster in O. fusiformis (Fig. 5C). Therefore, the similarity in gene family usage at equivalent timings of development between these annelids is not only driven by the shared use of structural genes that are essential for animal cleavage (e.g. cell cycle and cytoskeleton-related genes) but also by similar transcription factors.
Figure 5. The comparative dynamics of transcription factor activation in conditional and autonomous annelids.

(A, B) Nightingale rose charts of transcription factor (TF) distribution according to developmental time points (A) and clusters of coexpressed genes (B). (C) Comparison of gene family cluster composition between O. fusiformis and C. teleta. TF similarity in clusters of genes showing maternal decay and embryonic expression is high. However, there are prominent shifts in TF gene families allocated to the embryonic cluster in one species to earlier clusters in the other. (D) Alluvial plot depicting the comparative deployment of one-to-one orthologs (n = 306) exhibiting shifts in temporal activation (TPM >2) during spiral cleavage in O. fusiformis and C. teleta. (E) Pie chart showing that most genes with a temporal shift between O. fusiformis and C. teleta are expressed earlier in the latter. (F) The bar plots indicate the allocation of genes with a temporal shift to the clusters of coregulated genes in O. fusiformis and C. teleta. Most genes exhibiting temporal shifts between these species belong to late clusters in O. fusiformis and shift towards earlier clusters in C. teleta. (G) Gene Ontology (GO) enrichment of one-to-one orthologs (n = 306) exhibiting temporal shifts in transcriptional activation between O. fusiformis and C. teleta, according to the GO annotation of C. teleta. P values were derived from upper-tail Fisher’s exact tests.
Despite the overall similarities in TF usage in early and late cleavage, genome-wide and TF-only inter-species cluster composition comparisons also support differential temporal activation of orthologous gene families during spiral cleavage in O. fusiformis and C. teleta (Figs. 4D and 5C). To identify the exact genes exhibiting these temporal shifts in expression, we compared the activation timing (TPM >2) of one-to-one orthologs during spiral cleavage in the two annelids (Fig. 5D). Consistent with inter-cluster comparisons (Figs. 4D and 5C), the majority of orthologs exhibit a shift from gastrula and late spiral cleavage (5 hpf) in O. fusiformis to early cleavage stages, including the zygote, in C. teleta (Fig. 5D). Indeed, temporal shifts in gene expression from late stages in O. fusiformis to earlier stages in C. teleta are more than twice as common as in the other direction (Fig. 5F). Most (75.98%) of the genes–– including 17 out of the 20 TFs (85%)––exhibiting temporal shifts in O. fusiformis belong to clusters 4 (late zygotic, with a peak of expression at 5 hpf) and 5 (embryonic, peaking at gastrulation) (Fig. 5E,F; Datasets EV37 and EV38). However, in C. teleta, the genes with heterochronic shifts exhibit more diverse temporal dynamics, with more than half belonging to the early clusters 1 to 4 (zygote-specific, maternal decay, early zygotic and 16-cell specific) (Fig. 5F). Generally, the genes exhibiting temporal shifts in transcriptional activation between these species are enriched in GO terms related to development, cell differentiation, transcriptional regulation, and intercellular signalling (e.g. BMP) (Fig. 5G). Maternal genes in O. fusiformis that are expressed later during cleavage in C. teleta are enriched in GO terms related to ERK1/2 regulation, neuronal development, and DNA methylation, among others (Appendix Fig. S11). Inversely, maternal genes in C. teleta that are expressed later in O. fusiformis are enriched in GO categories associated with diverse processes, including eye development, the Notch, JNK, and MAPK pathways, as well as cell adhesion and migration (Appendix Fig. S12). Our comparative analyses have thus identified a relatively reduced gene set (306 orthologs, including 35 DNA-binding genes) in O. fusiformis and C. teleta for future functional investigations, as they might be involved in the early developmental differences in axial and cell fate specification between these two annelids.
To investigate whether similar temporal shifts in gene expression are observed when considering other spiralian species, we compared the high-resolution developmental transcriptomes of O. fusiformis and C. teleta with the annelids Platynereis dumerilii (unequal/autonomous) and Urechis unicinctus (equal/conditional), and the mollusc Crassostrea gigas (unequal/autonomous) (Fig. EV4). The datasets available for these species covered several cleavage stages, allowing us to identify temporal differences in the activation of one-to-one orthologs during early spiralian development between pairs of species. A larger fraction of genes (between 55.26 and 58.73%) exhibits a predisplacement in their timing of activation between 5 hpf and gastrula stages in O. fusiformis and earlier cleavage stages in P. dumerilii and C. gigas, the two species with unequal development (Fig. EV4A,E). Interestingly, however, this also occurs between O. fusiformis and the annelid with equal/conditional spiral cleavage U. unicinctus (Fig. EV4B), supporting the observation that transcriptional dynamics during spiral cleavage are inherently plastic across species and evolutionary times (Fig. EV2A). Consistent with our expectation from the comparison with O. fusiformis (Fig. 5D), C. teleta showed an inverse trend, with only 11.74–26.86% of the genes shifting from a late activation (64-cell stage and gastrula) to earlier time points in the three species (Fig. EV4C,D,F). Notably, the genes exhibiting heterochronic shifts during spiral cleavage in all these comparisons are enriched in GO categories related to organismal development, transcription, morphogenesis and neurogenesis, among others (Appendix Fig. S13). Despite potential confounding factors associated with technical (e.g. number of replicates and sequencing strategy) and sampling (e.g. collecting by time point rather than developmental stage) differences, these broader evolutionary comparisons thus confirm the temporal shifts in the timing of activation of developmental regulators that are generally expressed at late cleavage and gastrulation stages in species with equal/conditional development to earlier cleavage stages in species with unequal/autonomous spiral cleavage.
Figure EV4. Heterochronic shifts in gene expression between selected molluscan and annelid species.

(A–F) Alluvial plots depicting the comparative deployment of one-to-one orthologs exhibiting shifts in temporal activation during spiral cleavage between O. fusiformis and P. dumerilii (A), O. fusiformis and U. unicinctus (B), C. teleta and P. dumerilii (C), C. teleta and U. unicinctus (D), O. fusiformis and C. gigas (E), and C. teleta and C. gigas (F). Generally, more genes shift from late cleavage stages in O. fusiformis to early stages in other species than when C. teleta is included in equivalent comparisons.
Shared expression domains of orthologous TFs in annelid gastrulae
To start to investigate the implications of temporal shifts in TF activation during spiral cleavage in O. fusiformis and C. teleta, we focused on seven TFs with well-known roles during animal development (pax2/5/8, tbx2/3, vsx2, AP2, uncx, HNF4 and prop1) (Achim et al, 2018; Angotzi et al, 2011; Arenas-Mena, 2013; Denes et al, 2007; Erclik et al, 2008; Focareta et al, 2014; He et al, 2023; Lacin et al, 2020; Martin-Duran and Hejnol, 2015; Miller et al, 1992; Planques et al, 2019; Seudre et al, 2022a; Stolfi and Levine, 2011; Tian et al, 2021; Valencia et al, 2021; Vellutini and Hejnol, 2016; Wollesen et al, 2015; Xing et al, 2021) that follow the most common temporal change between these two annelids (Fig. 5D,F), namely expressed at or after organiser specification in O. fusiformis (5 hpf and gastrula) but at earlier time points in C. teleta. In agreement with the detected expression in the RNA-seq time course (Dataset EV39), none of these genes show expression during cleavage until 5 hpf in O. fusiformis (Fig. 6A–G). The only exception is pax2/5/8, which, as expected, exhibits broad maternal expression throughout the embryo (Fig. 6A). At 5 hpf, however, all TFs show restricted expression domains (Fig. 6A–G). pax2/5/8 is expressed in a few apical ectodermal cells that extend to encircle the entire anterior apical ectoderm in the gastrula (Fig. 6A). Additionally, pax2/5/8 is detected on one side, potentially the posterior, of the blastopore in O. fusiformis (Fig. 6A). As with pax2/5/8, tbx2/3, vsx2, and uncx are also detected in the apical ectoderm at 5 hpf and gastrula stages in O. fusiformis, but also in the gastral plate, endoderm, and the posterior blastopore rim for uncx (Fig. 6B–D). The TF AP2 shows expression in discrete ectodermal cells in the future dorsoposterior side of the embryo (Fig. 6E). Finally, HNF4 and prop1 are expressed in the gastral plate at 5 hpf (Fig. 6F,G). While we did not detect expression of HNF4 at the gastrula stage for O. fusiformis, prop1 is expressed in the internalised cells and seven further bilaterally symmetrical clusters of two cells around the equatorial ectoderm of the gastrula (Fig. 6F,G).
Figure 6. Spatial expression dynamics of orthologous transcription factors in O. fusiformis and C. teleta.

(A–N) Whole-mount in situ hybridisation of seven orthologous transcription factors (pax2/5/8, tbx2/3, vsx2, uncx, AP2, HNF4, and prop1) during mid and late cleavage and at the gastrula stage in O. fusiformis (A–G) and C. teleta (H–N). In O. fusiformis, pax2/5/8 (A), tbx2/3 (B), vsx2 (C) and uncx (D) are expressed in the anterior neuroectoderm (arrowheads), as well as in the posterior blastoporal rim (pax2/5/8 and uncx, arrows) and endoderm (tbx2/3 and vsx2). AP2 (E) is expressed in the posterior ectoderm (arrowhead), and HNF4 (F) and prop1 (G) are in the gastral plate before gastrulation and in seven equatorial clusters of two ectodermal cells in the gastrula (prop1, arrowheads). No expression is detected before 5 hpf for any of these genes. In C. teleta, pax2/5/8 (H), tbx2/3 (I), vsx2 (J), uncx (K) and AP2 (L) are broadly expressed during mid and late cleavage. In the gastrula, pax2/5/8, tbx2/3, vsx2 and uncx are detected in the anterior neuroectoderm (arrowheads), four cell clusters posterior to the foregut (pax2/5/8, arrows), the endoderm (tbx2/3 and uncx) and two lateral mesodermal clusters (uncx, arrows). HNF4 (M) is broadly detected at 32- and 64-cells and in the endoderm of the gastrula, and prop1 (N) expression is only apparent at the 64-cell stage. Insets are animal/vegetal views, except for the gastrula stage in (H–N), which are lateral views. All images come from representative specimens of at least two biological replicates. Asterisks indicate the animal pole. bc blastocoele, bp blastopore, en endoderm, gp gastral plate.
Consistent with in silico datasets (Dataset EV39), these seven TFs were expressed during mid and late cleavage in C. teleta (Fig. 6H–N). However, unlike in O. fusiformis, the early expression of these TFs in C. teleta is broad and generally distributed throughout all embryonic blastomeres for most of the genes, and more restricted expression domains only appeared at the gastrula stage (Fig. 6H–N). The early broad expression was unexpected and warrants further investigation, for example, through gene-specific knockouts (Neal et al, 2019). At the gastrula stage, pax2/5/8 is detected in the anterior ectoderm (i.e. the developing brain) and four ventral clusters posterior to the foregut (Fig. 6H). Similarly, tbx2/3, vsx2 and uncx are also expressed in the anterior neuroectoderm of the gastrula. Additionally, tbx2/3 and uncx show expression in the internalised endoderm and uncx is also detected in two lateral domains, reminiscent of the most lateral clusters of pax2/5/8 that might correspond to the developing mesoderm (Fig. 6I,J). Finally, we did not observe expression for AP2 and prop1 in the gastrula, but HNF4 is weakly expressed in the endoderm of C. teleta at that stage (Fig. 6L–N). Altogether, the comparison of the expression domains of these seven TFs is consistent with the higher transcriptional similarity at the gastrula stage between O. fusiformis and C. teleta (Fig. 4A), as most of these genes (pax2/5/8, tbx2/3, vsx2, uncx, and HNF4) have shared expression patterns in the late blastula and gastrula despite their different transcriptional dynamics during early cleavage.
An hourglass-like dynamic of gene expression in spiral cleavage
Our findings support the gastrula as a generally conserved developmental stage––in transcriptional levels, orthogroup and gene deployment, and gene expression patterns––during early annelid embryogenesis despite the diverse morphologies at that embryonic period. Indeed, the comparative analysis of transcriptomic similarity throughout the entire development of O. fusiformis and C. teleta (from oocyte to competent larvae and juvenile stages) strengthens that the late cleavage and gastrulation stages are the most transcriptionally similar stages in the life cycle of these species, followed by the juvenile stages (Fig. 7A). The late cleavage and gastrulation thus act as a mid-developmental transition between two phases of higher transcriptomic dissimilarity, namely an earlier period during spiral cleavage and a later phase during larval development. Notably, when comparing annelids with Crassostrea gigas, a bivalve mollusc with autonomous spiral cleavage, the late spiral cleavage and gastrulation are not periods of maximal transcriptomic similarity, but spiral cleavage is still a phase of high transcriptional dissimilarity (Figs. 7B and EV5). Instead, the larval stages act as stages of maximal transcriptomic similarity, consistent with previous comparisons among metazoan larvae (Martin-Zamora et al, 2023).
Figure 7. A mid-developmental transition in spiral cleavage.

(A, B) Jensen-Shannon transcriptomic divergence between all possible inter-species pairwise comparisons during the entire life cycle, from oocyte to juvenile or competent larva of O. fusiformis and C. teleta (A) and O. fusiformis and C. gigas (B). The point of maximal transcriptomic similarity between these annelids occurs at the late cleavage and gastrulation, while it happens at the ciliated larval stage between O. fusiformis and C. gigas. (C, D) Bar plots indicate the distribution of expressed genes according to their age or phylostratum at each cluster of temporally coregulated genes in O. fusiformis (C) and C. teleta (D). More ancestral genes comprise around half of the transcriptome during spiral cleavage in both species, except in the stage-specific clusters of C. teleta at the 16-cell, 32-cell, and 64-cell stages. (E, F) The heatmaps display the stages with the highest gene expression, categorised by age. In O. fusiformis (E), metazoan, protostomian, and lophotrochozoan genes are more expressed at the 5 hpf and gastrula, while in C. teleta (F), metazoan and bilaterian genes are highly expressed at the gastrula stage.
Figure EV5. Transcriptional similarity between Molluscan and Annelid development.

(A–F) Jensen-Shannon transcriptomic divergence between all possible inter-species pairwise comparisons during the entire life cycle, from oocyte or cleavage to juvenile or competent larva, between molluscan and annelid species with a high-resolution time course. In intra-phylum comparisons, the stages of maximal similarity are at or around gastrulation. In contrast, in inter-phylum comparisons, the larval stages are more transcriptionally similar (except for the O. fusiformis versus Haliotis discus hannai comparisons, which might be due to the poor quality of the molluscan dataset).
These intra- and inter-phyletic transcriptomic similarities remain when extending the analyses to other annelid and molluscan species (Fig. EV5). We first compared the developmental transcriptomic dynamics of C. gigas with those of the Mediterranean mussel Mytilus galloprovincialis and the abalone Haliotis discus hannai (Fig. EV5A,B). As observed in annelids (Fig. 7A), molluscan development is more similar at late gastrula and early trochophore stages. However, annelid and molluscan development exhibit the maximal transcriptomic similarity at the larval stages, even when including in the analysis the echiuran worm U. unicinctus, and with the only exception of the O. fusiformis and H. discus hannai comparison (Fig EV5C–F). Thus, despite technical and sampling differences (mainly affecting the abalone dataset), these comparisons support that the gastrula and larval stages are more transcriptomically conserved developmental stages at the phylum and spiralian level, respectively.
Deployment and enrichment in genes of ancestral origin have been associated with developmental stages of high inter-species conservation (Domazet-Loso and Tautz, 2010; Xu et al, 2016). To assess this in annelids, we assigned genes based on their phylogenetic origin and evaluated their contribution to the clusters of coregulated genes. In both species, old genes (i.e. ancestral to Metazoa and originated in Bilateria, Protostomia and Spiralia) account for more than 50% of the genes in all but the oocyte-specific clusters in O. fusiformis and all but the cleavage-specific clusters (16-cell, 32-cell, and 64-cell) in C. teleta (Fig. 7C,D). These cleavage-specific clusters exhibit more than 50% of C. teleta-specific genes (Fig. 7D), supporting the lack of functional annotation for many of the genes expressed at those time points in this annelid. Consistent with the gene distribution by phylostratum, the expression of genes of Metazoa, Protostomia, and Spiralia origin is higher at the gastrula stage in O. fusiformis (Fig. 7E), and Metazoa/Bilateria genes are highly expressed in the gastrula of C. teleta (Fig. 7F). However, the expression of species-specific genes is higher during mid-cleavage stages in both annelids, from the 8-cell stage to 4 hpf in O. fusiformis and from the 16-cell to the 64-cell stages in C. teleta (Fig. 7E,F). Therefore, our findings indicate that annelids undergo a mid-developmental transition in their life cycle around gastrulation when embryos deploy more ancestral genes and exhibit a high degree of transcriptomic and gene expression pattern similarity.
Discussion
Our work profiles, with an unprecedented temporal resolution for spiral cleavage (Chou et al, 2016; Harry and Zakas, 2024; Martin-Duran et al, 2021; Zhang et al, 2012), the transcriptomic dynamics during early embryogenesis in O. fusiformis and C. teleta, two annelids with equal/conditional and unequal/autonomous spiral cleavage, respectively. Although the evolutionary distance between O. fusiformis and C. teleta likely influences some of our observations, our extensive dataset defines a novel comparative framework to investigate the genetics and mechanisms controlling and diversifying spiral cleavage, one of the most ancient and broadly conserved cleavage programmes (Hejnol, 2010; Henry, 2014; Martin-Duran and Marletaz, 2020).
The early transcriptomic dynamics in spiral cleavage
The transition from a maternally regulated development to one controlled by the zygotic genome––the so-called maternal-to-zygotic transition––is a fundamental event in early animal embryogenesis (Brantley and Di Talia, 2024; Lee et al, 2014; Tadros and Lipshitz, 2009; Vastenhouw et al, 2019). This involves the degradation of maternal transcripts and proteins, as well as the epigenetic remodelling of the zygotic genome to enable transcription (i.e. zygotic genome activation). These often, but not always, coincide with the desynchronisation of cell cycles between different embryonic regions (Lu et al, 2009; Newport and Kirschner, 1982; O’Farrell et al, 2004). Notably, the timing of these events varies dramatically, even between phylogenetically closely related lineages (O’Farrell et al, 2004; Vastenhouw et al, 2019). Yet, how and when these critical steps occur during embryogenesis remains unknown in most animals, especially those exhibiting spiral cleavage. In the annelid leech Helobdella triserialis, which displays a modified spiral cleavage (Dohle, 1999), embryonic transcription begins early, when the embryo has ~20 cells, only in a subset of blastomeres, and is essential to control spindle orientation (Bissen and Smith, 1996). Based on transcriptomic profiling, zygotic genome activation appears to occur around the 64-cell stage in the annelid P. dumerilii (Chou et al, 2016). However, only two earlier time points (the 8- and 30-cell stages) were sampled in that study. In O. fusiformis and C. teleta, maternal transcripts are largely cleared in two waves by the 16- and 32-cell stages, and the first signs of gene expression occur around the 4- and 8-cell stages, with the differential upregulation of genes at the 16-cell stage (the fourth cell cycle) being essential for normal development in both species (Figs. 2D–F, 3A,B, 4B,C, 8A). This is consistent with a recent report on the zygotic genome activation of the annelid with equal/conditional spiral cleavage Ophelia limacina occurring at the 8-cell stage (Grinberg et al, 2025). Notably, the first cleavage asymmetry in O. fusiformis occurs two cell cycles later (64-cell stage or 5 hpf), with the formation of the 4q micromeres, one of which will become the embryonic organiser (Seudre et al, 2022a). Therefore, the maternal-to-zygotic transition may be a very early phenomenon (occurring between the 4- and 16-cell stages) and not coincide with the desynchronisation of cell divisions in annelids; yet inter-species variation is likely. A more extensive taxon sampling that includes other groups with spiral cleavage, along with more precise approaches to measuring zygotic transcription and maternal transcript dynamics than poly(A)-selection based RNA-seq (Lee et al, 2014; Vastenhouw et al, 2019), will provide a more comprehensive view of the maternal-to-zygotic transition in Spiralia.
Figure 8. Transcriptional and morphological dynamics are decoupled in spiral cleavage.

(A) Schematic summary of the transcriptomic dynamics during spiral cleavage in O. fusiformis and C. teleta. Two waves of mRNA decay (one that is oocyte/zygote-specific and another that extends to about the 8-cell stage) occur during early cleavage. Zygotic genome activation and the maternal-to-zygotic transition (MZT) likely occur between the second (4-cell stage) and fourth cell division (16-cell stage) and more intensely in C. teleta, as it coincides with the specification of the embryonic organiser (schematic drawing and dotted vertical line). The large increase in zygotic transcriptional activity occurs at the sixth cell division (64-cell stage) in O. fusiformis, when the embryonic organiser is established in this species (dotted line and schematic drawing). (B) Schematic comparison of broad areas of developmental competence at the gastrula stage between O. fusiformis and C. teleta (see main text for details). (C) Differently from other animal phyla, morphological and transcriptomic similarities are uncoupled during development in Annelida. The early embryonic phase of spiral cleavage is morphologically stereotypical but transcriptionally divergent. However, annelid embryos converge into a broad transcriptomic and molecular patterning similarity phase by the gastrula stage, which acts as a mid-developmental transitional period. Annelid embryos diverge (morphologically and transcriptionally) upon gastrulation as they develop into lineage-specific larval forms. Drawings are not to scale.
Although it happens at similar developmental time points, the zygotic genome activation appears to be more pronounced in C. teleta than in O. fusiformis at the 16-cell stage (Figs. 2E,F and 8A). This coincides and is consistent with the specification of the embryonic organiser and the activation of head patterning programmes at this stage in C. teleta (Fig. 1D) (Amiel et al, 2013; Carrillo-Baltodano and Meyer, 2017). Similarly, the specification of the embryonic organiser by the 64-cell stage is concomitant with an increase in gene upregulation in O. fusiformis (Fig. 2E) (Seudre et al, 2022a). As observed in the leech H. triseralis (Bissen and Smith, 1996), our data also support that zygotic genome activation is not uniform throughout the embryo, at least in O. fusiformis, as some of the upregulated genes, such as the expanded foxQ2 genes (Seudre et al, 2022b) and fjx1, exhibit asymmetric expression along the animal-vegetal axis at these early stages of development. These markers concentrate in the animal ectodermal pole (Seudre et al, 2022b) (Fig. 3E), which generates anterior neuroectodermal derivatives in most spiralians and bilaterians (Martin-Duran and Hejnol, 2021; Nielsen, 2004, 2005). This reinforces the hypothesis that anterior neural structures develop early and more autonomously in embryos with both autonomous and conditional modes of spiral cleavage (Carrillo-Baltodano and Meyer, 2017). In equal/conditional spiral cleavage, the posterior/vegetal pole likely remains uncommitted as new tiers of micromeres are produced (Morrill et al, 1973; van den Biggelaar and Guerrier, 1979) and until the inductive signalling event mediated by the FGF-ERK1/2 pathway primes one of the blastomeres to become the embryonic organiser (Seudre et al, 2022a; Tan et al, 2022, 2023), restricting anterior fates and activating posterodorsal developmental on one side of the embryo (Seudre et al, 2022a). Therefore, although embryos with equal/conditional and unequal/autonomous spiral cleavage share general transcriptional dynamics during early embryogenesis (Fig. 8A), the different modes of cell-fate specification, which determine the timing of axial patterning and the onset of body regionalisation, outweigh the conservation of the cleavage programme and cell lineages in shaping specific transcriptional trends during early embryogenesis.
The transcriptomic convergence during axial patterning in annelid embryos
Despite their different early transcriptional dynamics and modes of cell fate specification, late cleavage and gastrula stages are the most similar between O. fusiformis and C. teleta. The analysis of seven transcription factors activated late (5 hpf and gastrula) in O. fusiformis but much earlier in C. teleta demonstrates that similarity in transcription levels at the gastrula stage is often accompanied by similarity in expression domains (Fig. 6). This is consistent with studies in these annelids of candidate transcription factors with evolutionarily conserved expression domains across distantly related animals, which act as “marker” genes for the development of specific structures. Foregut genes, such as nkx2.1, foxA and gsc, are expressed in the prospective oral ectoderm of the gastrula, while endodermal markers, such as GATA4/5/6 paralogs, localise to the internalised cells (Fig. 8B) (Boyle and Seaver, 2008; Boyle et al, 2014; Martin-Duran et al, 2016). Likewise, anterior neuroectodermal genes (e.g. sox genes and those in this study) are expressed in the animal/anterior pole in the gastrulae of O. fusiformis and C. teleta (Fig. 8B) (Carrillo-Baltodano et al, 2024; Meyer and Seaver, 2009; Sur et al, 2017). Notably, however, the two species differ in the extent and levels of trunk mesodermal and neuroectodermal gene expression (e.g. pax3/7, evx, cdx, twist). While the precursors of the ecto- and mesodermal trunk occupy a large lateral domain in the gastrula of C. teleta (Dill et al, 2007; Frobius and Seaver, 2006; Seaver et al, 2012), these are restricted to one side of the blastoporal rim and the few possible descendants of the embryonic organiser in O. fusiformis (Martin-Duran et al, 2018; Martin-Duran et al, 2016; Seudre et al, 2022a) (Fig. 8B). These differences reflect the temporal and developmental differences in trunk formation between these two species, which are ultimately linked to their distinct larval types and life cycle strategies (Martin-Zamora et al, 2023). Equally, in annelids with heteromorphic larval types (i.e. planktotrophic and lecithotrophic), such as Streblospio benedicti, genes exhibiting temporal shifts are connected to morph-specific developmental and physiological traits, like the formation of a functional gut in the planktotrophic type and the metabolism of the maternal nourishment in the lecithotrophic type (Harry and Zakas, 2024). Therefore, despite the conservation of the cleavage programme and the early transcriptional differences, a shared body and molecular patterning that reflects subsequent species-specific developmental traits only emerge during gastrulation in annelid embryogenesis.
A mid-developmental transition in annelid development
In some animal clades, there is a period during mid-development when phylogenetically related taxa exhibit a significant degree of morphological and transcriptomic similarity (Kalinka and Tomancak, 2012; Slack et al, 1993; Waddington, 1956). This is thought to be the stage at which the body plan’s essential traits of the clade are established; thus, this phase is also termed the phylotypic stage (Duboule, 1994; Sander, 1994). Although the phylotypic stage concept is contested (Bininda-Emonds et al, 2003; Hall, 1997; Hejnol and Dunn, 2016; Richardson, 1995), an equivalent phenomenon has been described during the development of plants, fungi, and brown algae (Cheng et al, 2015; Lotharukpong et al, 2024; Quint et al, 2012). Therefore, the phylotypic stage may reflect an emergent property of multicellular systems that occurs when genetic programmes become active and interact to define the different body regions, creating a stage that is more sensitive to evolutionary change (Bogdanovic et al, 2016; Galis and Metz, 2001; Liu et al, 2021; Marletaz et al, 2018; Tena et al, 2014; Uchida et al, 2022; Uesaka et al, 2019; Zalts and Yanai, 2017). From a morphological standpoint, however, the highest degree of embryonic similarity amongst the disparate and distantly related animal groups with spiral cleavage occurs during the earliest zygotic divisions (Fig. 8C). This has led some authors to claim that there is no phylotypic stage in Spiralia (Wu et al, 2019), while others have argued that the larva is the phylotypic stage in annelids and molluscs (Cohen and Massey, 2008; Levin et al, 2016; Paps et al, 2015; Xu et al, 2016). Yet, life cycles are vastly diverse in Spiralia, and larvae differ dramatically in their morphology and ecology, even within a phylum (Liang et al, 2024; Rouse, 2008). Thus, a mid-developmental phylotypic stage in Spiralia has remained a matter of controversy.
Our data highlights the gastrula as a critical developmental time point in the spiralian embryos we studied (Fig. 8B,C). Although the amount of maternally provided nourishment heavily influences embryonic morphologies and morphogenetic processes at this stage (e.g. gastrulation by invagination or epiboly), the gastrulae of O. fusiformis and C. teleta exhibit high overall transcriptomic similarity, shared molecular expression patterns, and areas of developmental competence (Fig. 8B; see above). Morphological and transcriptomic similarities are thus uncoupled during spiral cleavage, indicating that the extreme conservation of this early embryogenesis relies on a limited gene set and/or maternal proteins contributing to conserved cellular physical mechanics (Brun-Usan et al, 2017). Moreover, developmental system drift in the specification of homologous cell types and body regions may be widespread in these lineages, even between closely related species (Carrillo-Baltodano et al, 2025; Lanza and Seaver, 2020). Therefore, unlike in other animal groups, such as vertebrates and insects, a mid-developmental phylotypic stage occurring around gastrulation is only evident at the transcriptomic level in Spiralia. This stage marks the transition from an early morphologically similar but transcriptionally divergent phase of cleavage to a late morphologically and transcriptionally divergent period during organogenesis that results in the formation of a larva or juvenile (Fig. 8C). This scenario challenges previous interpretations of spiralian development (Cohen and Massey, 2008; Levin et al, 2016; Paps et al, 2015; Wu et al, 2019; Xu et al, 2016), proposing a stage in embryogenesis where the astonishing body plan diversity of animal lineages with spiral cleavage may emerge.
In summary, our work provides an unparalleled characterisation of the transcriptional dynamics during early embryogenesis in O. fusiformis and C. teleta. These two annelids exhibit spiral cleavage but autonomous and conditional specification of their body plans, respectively. Unexpectedly, the transcriptomic profiles during their early development are highly divergent, influenced by their strategies and different timings to define the embryonic organiser and bilateral symmetry. This indicates that the high conservation of the spiralian cleavage programme does not constrain the deployment of transcriptional programmes during the development of these annelids. Thus, maternal proteomes and/or biophysical properties might play a more significant role in maintaining the spiral cleavage pattern of cell divisions. Yet, the embryos of these two annelids converge in their transcriptomic and body patterning profiles at gastrulation, which appears as a mid-developmental transitional phase in annelid embryogenesis. In the future, exploiting low-input epigenomic profile approaches, such as ATAC-seq and CUT&Tag (Buenrostro et al, 2015; Kaya-Okur et al, 2019), will complement our transcriptomic resources and help infer the functional and regulatory dynamics underpinning the differences in gene expression between species with autonomous and conditional spiral cleavage. Altogether, our study provides a unique, high-resolution resource for investigating the early stages of animal embryogenesis in two emerging spiralian models, proposing new conceptual scenarios to explore the developmental mechanisms that control spiral cleavage, an iconic and ancient mode of animal development.
Methods
Reagents and tools table
| Reagent/resource | Reference or source | Identifier or catalogue number |
|---|---|---|
| Experimental models | ||
| Owenia fusiformis | Field collection | |
| Capitella teleta | In-house culture | |
| Recombinant DNA | ||
| Antibodies | ||
| Mouse anti-acetylated α-tubulin (clone 6-11B-1) | Merck-Sigma | #MABT868 |
| mouse anti-beta-tubulin | Developmental Studies Hybridoma Bank | E7 |
| mouse anti-RNA polymerase II, clone CTD4H8 | Merck-Sigma | #05623 |
| Rabbit anti-serotonin | Merck-Sigma | #S5545 |
| AlexaFluor-conjugated secondary antibodies | ThermoFisher Scientific | A-21428, A-32731, A-21235 |
| Oligonucleotides and other sequence-based reagents | ||
| PCR primers | This study | Appendix Table S4 |
| Q5® High-Fidelity 2X Master Mix | New England Biolabs | M0492L |
| Chemicals, Enzymes and other reagents | ||
| Monarch Total RNA Miniprep kit | New England Biolabs | T2010S |
| RNA ScreenTape | Agilent | 5067-5576 |
| RNA ScreenTape Ladder | Agilent | 5067-5578 |
| RNA ScreenTape Sample Buffer | Agilent | 5067-5577 |
| Qubit™ RNA High Sensitivity (HS) | Thermo Fisher Scientific | Q32852 |
| Qubit™ RNA High Sensitivity (BR) | Thermo Fisher Scientific | Q10210 |
| MEGAscript™ T7 Transcription Kit | Thermo Fisher Scientific | AM1334 |
| Actinomycin D | Cell Signaling Technology | #15021 |
| AlexaFluor 488 Phalloidin | Thermo Fisher Scientific | A12379 |
| Software | ||
| Kallisto (0.46.2) | Bray et al, 2016 | |
| DESeq2 (1.30.1) | Love et al, 2014 | |
| Limma (3.46.0) | Ritchie et al, 2015 | |
| EnhancedVolcano (1.8.0) | Blighe et al, 2018 | |
| Mfuzz (2.50.0) | Kumar and M, 2007 | |
| NbClust (3.0.1) | Charrad et al, 2014 | |
| ComplexHeatmap (2.6.2) | Gu, 2022; Gu et al, 2016 | |
| OrthoFinder (2.5.5) | Emms and Kelly, 2019 | |
| TopGO (2.42.0) | Alexa and Rahnenfuhrer, 2024 | |
| Scikit-learn (1.7) | Pedregosa et al, 2011 | |
| KEGGREST (1.30.1) | Tenenbaum and Maintainer, 2024 | |
| Pheatmap (1.0.13) | Kolde R (2025) | |
| ClusterProfiler (3.18.1) | Wu et al, 2021 | |
| Biostrings (2.30.1) | Pagès et al, 2024 | |
| seqinR (4.2-30) | Charif and Lobry, 2007 | |
| coRdon (1.24.0) | Elek et al, 2024 | |
| Primer3 (4.1.0) | Untergasser et al, 2012 | |
| Other | ||
| Illumina NovaSeq6000 | Illumina | |
| Leica DMRA2 microscope | Leica | |
| Leica Stellaris 8 confocal microscope | Leica | |
Methods and protocols
Animal culture and sample collection
Sexually mature Owenia fusiformis Delle Chiaje, 1844 adults were collected from subtidal waters near the Station Biologique de Roscoff and cultured in the laboratory as previously described (Carrillo-Baltodano et al, 2021). In vitro fertilisation and collection of embryonic stages were performed as previously outlined (Carrillo-Baltodano et al, 2021). Capitella teleta (Blake, Grassle and Eckelbarger, 2009) was cultured, and embryos were collected following established protocols (Seaver, 2005). For oocyte collection, females whose offspring were used to collect cleavage stages were isolated and dissected after 1 week with abundant mud to obtain their oocytes.
Library preparation and sequencing
O. fusiformis developmental samples encompassing active oocyte, zygote, 2-cell, 4-cell and 8-cell stages, 3 h post-fertilisation (hpf), 4 and 5 hpf (blastula), and gastrula (9 hpf) were collected in duplicates, flash frozen in liquid nitrogen, and stored at −80 °C for total RNA extraction. Samples within replicates were paired, with each one containing 500 embryos coming from the same in vitro fertilisation. Reciprocal developmental stages for C. teleta, namely the oocyte, zygote, 2-, 4-, 8-, 16-, 32-, and 64-cell stages, and gastrulae were collected in duplicates using similar genetic pools of different brood tubes. Total RNA was isolated using a Monarch Total RNA Miniprep kit (New England Biolabs), RNA quality was assessed using the Agilent RNA TapeStation (Agilent), and RNA quantity was measured with the Qubit RNA HS Assay Kit (Thermo Fisher Scientific) before library preparation. Following the supplier’s recommendations, we used to prepare strand-specific mRNA Illumina libraries that were sequenced at the Oxford Genomics Centre (University of Oxford, UK) over three lanes of an Illumina NovaSeq6000 system in 2 × 150 bp mode to a depth of around 50 million reads per sample (Appendix Tables S2 and S3).
RNA-seq analyses
To profile gene expression dynamics during development, we first utilised Kallisto (0.46.2) (Bray et al, 2016) to map RNA-seq reads to the reference gene models of O. fusiformis and C. teleta. Mapping statistics are provided in Appendix Tables S2 and S3. Quality control was conducted using TPM (transcripts per million) matrices, visualising read distributions, ridge plots, and scatter plots of sample correlations. Genes with TPM >2 were defined as expressed in each developmental stage. Gene expression across all samples was normalised using DESeq2 (Love et al, 2014), and correlation coefficients were calculated to elucidate relationships among developmental stages. For O. fusiformis, batch effects between the two replicates were removed using the limma package (Ritchie et al, 2015). To identify differentially expressed genes (DEGs) between adjacent developmental stages, pairwise comparisons were performed using DESeq2 (Love et al, 2014), and DEGs were visualised with EnhancedVolcano (Blighe et al, 2018). To recover subtle changes and allow the inclusion of all differences in expression between stages, the log2(fold change) cutoff was set to 0.
Gene clustering
To elucidate genes with similar expression patterns, we applied soft clustering using the Mfuzz package (Kumar and M, 2007), clustering gene expression profiles based on the average normalised values from DESeq2. To determine the optimal number of clusters, we applied the 'centroid' clustering method, 'Euclidean' distance with 'ch' index by the R package NbClust (version 3.0.1) (Charrad et al, 2014). Hierarchical clustering was also performed to resolve relationships among developmental stages. Clusters were categorised according to their expression profiles, particularly the stages of highest expression, along with insights from hierarchical clustering and PCA analyses. Gene expression dynamics across the whole profile and within individual clusters were visualised using ComplexHeatmap (Gu, 2022; Gu et al, 2016) and line plots. Furthermore, each group was characterised for transcription factor composition based on TF families, and the results were visualised numerically and proportionally using Nightingale rose charts.
Jensen-Shannon distance (JSD) comparisons
We employed the Jensen-Shannon distance (JSD) (Endres and Schindelin, 2003; Lin, 1991) to estimate inter-sample distances and explore sample relationships across developmental stages between species. For post-gastrula stages in O. fusiformis, C. teleta and other annelid and molluscan species, we used publicly available datasets (Dataset EV40) (Burns and Pechenik, 2017; Data ref: Burns and Pechenik, 2017; Chou et al, 2016; Data ref: Chou et al, 2016; Harry and Zakas, 2024; Data ref: Harry and Zakas, 2024; Martin-Zamora et al, 2023; Data ref: Martin-Zamora et al, 2023; Miglioli et al, 2024; Data ref: Miglioli et al, 2024; Park et al, 2018; Data ref: Park et al, 2018; Xu et al, 2016; Data ref: Xu et al, 2016). We first identified all one-to-one orthologous genes between the species with OrthoFinder (Emms and Kelly, 2019) and extracted their corresponding TPM values. These TPM values were then quantile-transformed using the QuantileTransformer (Scikit-learn (1.7)) Python script to convert them into probability distributions (Pedregosa et al, 2011). We calculated raw JSD values for each pair of developmental stages across species using these distributions. To ensure comparability of JSD values across different stages, we normalised the raw JSD values using a method described in (Martin-Zamora et al, 2023). The raw JSD values were visualised in a heatmap, while the normalised values were presented in a line plot alongside the raw data.
Heterochrony analyses between species
To define gene expression thresholds for downstream heterochrony analysis, we examined the transcriptome-wide distributions of log₂-transformed TPM values from publicly available datasets for each species. These distributions exhibited asymmetric unimodal patterns, and expression cutoffs were defined based on dataset-specific inflexion points: O. fusiformis and C. teleta: TPM ≥2 (log₂TPM ≥1); Platynereis dumerilii: TPM ≥1 (log₂TPM ≥0); Crassostrea gigas: TPM ≥4 (log₂TPM ≥2); Urechis unicinctus: TPM ≥16 (log₂TPM ≥4). Heterochronic shifts were identified using one-to-one orthologous genes across species, with a focus on early developmental stages. The equivalent early developmental stages were excluded from specific pairwise comparisons. In U. unicinctus vs. O. fusiformis and U. unicinctus vs. C. teleta comparisons, the following stages were excluded: 1-cell, 2-cell, 4-cell, 8-cell and blastula. In the C. gigas vs. O. fusiformis and C. gigas vs. C. teleta comparisons, 1-cell, 2-cell, 4-cell, 8-cell, blastula and gastrula were excluded.
Inter-species inter-clusters comparison analysis
To investigate the global similarity between the two species beyond one-to-one ortholog comparisons, we performed inter-cluster comparisons based on the complete set of orthologous relationships, including one-to-one, one-to-many, and many-to-many orthologues, as defined by OrthoFinder (Emms and Kelly, 2019). For each cluster pair across the two species, we conducted a hypergeometric test to evaluate the statistical significance of gene overlap, and the p values were adjusted using the Benjamini–Hochberg method. The adjusted p values were visualised as a heatmap using the pheatmap package (Kolde, 2025) in RStudio, with values represented on a −log₁₀(p) transformation.
GO and KEGG enrichment
We performed GO term enrichment analyses using the TopGO package (Alexa and Rahnenfuhrer, 2024) to explore the possible biological functions of each cluster. The GO universe was defined based on the annotations in Datasets EV41 and EV42. Enrichment statistics were calculated using the Fisher test, and the top 10 or 15 enriched GO terms for each cluster were selected for visualisation. In KEGG pathway enrichment analyses, we first retrieved pathway names using the KO IDs listed in Datasets EV43 and EV44 with the KEGGREST package (Tenenbaum and Maintainer, 2024). After constructing the KEGG annotation table, we performed enrichment analysis using the ClusterProfiler package (Wu et al, 2021), setting a p value cutoff of 0.05 and a q value cutoff of 0.5 without p value adjustment. The results of KEGG pathway enrichment were presented in dot plots for clarity and interpretation.
Phylostratigraphy analysis
To investigate the contribution of evolutionary genes to development, we used available gene ages based on previous gene family evolutionary analyses (Martin-Zamora et al, 2023). The proportion of genes within each phylostratum was calculated according to their developmental origins across the entire gene profile and visualised using bar plots. To assess the abundance of these genes across developmental stages, we performed quantile normalisation for each stage, and the normalised values were presented in a heatmap to illustrate their distribution and trends.
Codon usage
To determine whether there is a bias in codon usage among different clusters, we extracted the transcripts within each cluster and calculated their codon usage individually using the R packages biostrings, seqinR, and coRdon (Charif and Lobry, 2007; Elek et al, 2024; Pagès et al, 2024). To identify changes in codon usage, pairwise comparisons were performed for each codon, with the log2(Ratio) used to represent the magnitude of change between clusters. These changes were visualised in bar plots, where, for O. fusiformis, codons on the left side of the plot were identified as unstable, while those on the right were classified as stable.
Gene cloning and in situ hybridisation
To generate riboprobes for whole-mount in situ hybridisation and gene expression analyses, the coding sequences of candidate genes were extracted from the genomes of both species, and gene-specific primers were designed via the Primer3 web tool (Untergasser et al, 2012) to amplify gene products ranging from 1000 to 1500 bp (Appendix Table S4). The genes were amplified using cDNA from a mix of developmental stages, and the amplicons were validated by Sanger sequencing. Fixation and whole-mount in situ hybridisation (ISH) were performed according to previously published protocols (Carrillo-Baltodano et al, 2021; Martin-Duran et al, 2016; Seaver, 2005; Seudre et al, 2022a).
Actinomycin D treatments
Actinomycin D (Cell Signaling Technology, #15021) 10 mM stocks were made in dimethyl sulfoxide (DMSO). Working solutions were prepared in ASW to the desired concentrations (75 µM for O. fusiformis and 25 µM for C. teleta). Embryos of O. fusiformis and C. teleta were treated in overlapping developmental time windows from the 2-cell stage, washed four times in ASW with 60 µg/mL penicillin and 50 µg/mL streptomycin (ASW + PS), and grown in ASW + PS until the 24 hpf mitraria larva (O. fusiformis) and stage 5 larva (C. teleta).
Immunostaining
Fixation and antibody staining were performed as described elsewhere (Carrillo-Baltodano et al, 2021). The primary antibodies mouse anti-acetylated α-tubulin (clone 6-11B-1, Merk-Sigma, #MABT868, 1:800), rabbit anti-serotonin antibody (Merck-Sigma, #S5545, 1:300) mouse anti-beta-tubulin (E7, Developmental Studies Hybridoma Bank, 1:20) and mouse anti-RNA polymerase II (clone CTD4H8, Merk-Sigma, #05623, 1:200) were diluted in 5% normal goat serum (NGS) in phosphate-buffered saline with 0.5% Triton X-100 (PTx) and incubated overnight at 4 °C. After several washes in 1% bovine serum albumin (BSA) in PTx, samples were incubated with AlexaFluor-conjugated secondary antibodies (ThermoFisher Scientific, 1:600) plus DAPI (stock 2 mg/ml, 1:2000) and 1:100 AlexaFluor 488 Phalloidin (Thermo Fisher Scientific, cat#: A12379) diluted in 5% NGS in PTx overnight at 4 °C.
Imaging
Representative embryos were cleared and mounted in 70% glycerol in phosphate-buffered saline. Whole-mount in situ hybridisation samples were imaged with a Leica DMRA2 upright microscope equipped with an Infinity5 camera (Lumenera) using differential interference contrast (DIC) optics. Confocal laser scanning microscopy (CLSM) images were taken with a Leica Stellaris 8. CLSM Z-stack projections were built with ImageJ2 (Rueden et al, 2017) and Nikon NIS-Elements software. DIC images were digitally stacked with Helicon Focus 7 (HeliconSoft). Brightness and contrast were edited with Adobe Photoshop CC, and figures were built with Adobe Illustrator CC (Adobe Inc.).
Supplementary information
Acknowledgements
We thank members of the Martín-Durán lab for their support and comments on this manuscript. This study employed computational resources from the high-performance computing facility Apocrita at Queen Mary University of London. BBSRC grant BB/W019698/1 supported the research reported in this paper. This work was also funded by the European Union Horizon 2020 Framework Programme (European Research Council Starting Grant agreement number 801669) and the Biotechnology and Biological Sciences Research Council (BB/Y004221/1) to JMMD. JW is supported by a China Scholarship Council doctoral fellowship (CSC NO. 202306330025), and AMCB is supported by a Biotechnology and Biological Sciences Research Council grant (BB/Y004221/1).
Expanded view
Author contributions
Yan Liang: Conceptualisation; Formal analysis; Investigation; Visualisation; Writing—original draft; Writing—review and editing. Jingcheng Wei: Formal analysis; Investigation; Visualisation; Writing—original draft; Writing—review and editing. Yue Kang: Investigation. Allan M Carrillo-Baltodano: Data curation; Formal analysis; Investigation; Visualisation; Writing—original draft; Writing—review and editing. José M Martín-Durán: Conceptualisation; Data curation; Formal analysis; Supervision; Funding acquisition; Investigation; Visualisation; Writing—original draft; Project administration; Writing—review and editing.
Source data underlying figure panels in this paper may have individual authorship assigned. Where available, figure panel/source data authorship is listed in the following database record: biostudies:S-SCDT-10_1038-S44319-025-00569-4.
Data availability
The new sequencing data generated in this project have been deposited at the Gene Expression Omnibus portal with BioProject accession number PRJNA1019281 (https://www.ncbi.nlm.nih.gov/bioproject/PRJNA1019281). The original confocal and differential interference contrast images have been deposited at the BioImage Archive with accession number S-BIAD2125 (https://www.ebi.ac.uk/biostudies/bioimages/studies/S-BIAD2125).
The source data of this paper are collected in the following database record: biostudies:S-SCDT-10_1038-S44319-025-00569-4.
Disclosure and competing interests statement
The authors declare no competing interests.
Supplementary information
Expanded view data, supplementary information, appendices are available for this paper at 10.1038/s44319-025-00569-4.
References
- Achim K, Eling N, Vergara HM, Bertucci PY, Musser J, Vopalensky P, Brunet T, Collier P, Benes V, Marioni JC et al (2018) Whole-body single-cell sequencing reveals transcriptional domains in the annelid larval body. Mol Biol Evol 35:1047–1062 [DOI] [PMC free article] [PubMed] [Google Scholar]
- Alexa A, Rahnenfuhrer J (2024) topGO: Enrichment Analysis for Gene Ontology. R package version 2.58.0
- Amiel AR, Henry JQ, Seaver EC (2013) An organizing activity is required for head patterning and cell fate specification in the polychaete annelid Capitella teleta: new insights into cell-cell signaling in Lophotrochozoa. Dev Biol 379:107–122 [DOI] [PubMed] [Google Scholar]
- Angotzi AR, Mungpakdee S, Stefansson S, Male R, Chourrout D (2011) Involvement of Prop1 homeobox gene in the early development of fish pituitary gland. Gen Comp Endocrinol 171:332–340 [DOI] [PubMed] [Google Scholar]
- Arenas-Mena C (2013) Brachyury, Tbx2/3 and sall expression during embryogenesis of the indirectly developing polychaete Hydroides elegans. Int J Dev Biol 57:73–83 [DOI] [PubMed] [Google Scholar]
- Barral A, Zaret KS (2024) Pioneer factors: roles and their regulation in development. Trends Genet 40:134–148 [DOI] [PMC free article] [PubMed] [Google Scholar]
- Barresi M, Gilbert S (2023) Developmental Biology. Oxford University Press, Oxford
- Bininda-Emonds OR, Jeffery JE, Richardson MK (2003) Inverting the hourglass: quantitative evidence against the phylotypic stage in vertebrate development. Proc Biol Sci 270:341–346 [DOI] [PMC free article] [PubMed] [Google Scholar]
- Bissen ST, Smith CM (1996) Unequal cleavage in leech embryos: zygotic transcription is required for correct spindle orientation in subset of early blastomeres. Development 122:599–606 [DOI] [PubMed] [Google Scholar]
- Blake JA, Grassle JP, Eckelbarger KJ (2009) Capitella teleta, a new species designation for the opportunistic and experimental Capitella sp I, with a review of the literature for confirmed records. Zoosymposia 2:25–53 [Google Scholar]
- Blighe K, Rana S, Lewis M (2018) EnhancedVolcano: publication-ready volcano plots with enhanced colouring and labeling
- Bogdanovic O, Smits AH, de la Calle Mustienes E, Tena JJ, Ford E, Williams R, Senanayake U, Schultz MD, Hontelez S, van Kruijsbergen I et al (2016) Active DNA demethylation at enhancers during the vertebrate phylotypic period. Nat Genet 48:417–426 [DOI] [PMC free article] [PubMed] [Google Scholar]
- Boyle MJ, Seaver EC (2008) Developmental expression of foxA and gata genes during gut formation in the polychaete annelid, Capitella sp. I. Evol Dev 10:89–105 [DOI] [PubMed] [Google Scholar]
- Boyle MJ, Yamaguchi E, Seaver EC (2014) Molecular conservation of metazoan gut formation: evidence from expression of endomesoderm genes in Capitella teleta (Annelida). Evodevo 5:39 [DOI] [PMC free article] [PubMed] [Google Scholar]
- Brantley S, Di Talia S (2024) The maternal-to-zygotic transition. Curr Biol 34:R519–R523 [DOI] [PubMed] [Google Scholar]
- Bray NL, Pimentel H, Melsted P, Pachter L (2016) Near-optimal probabilistic RNA-seq quantification. Nat Biotechnol 34:525–527 [DOI] [PubMed] [Google Scholar]
- Brun-Usan M, Marin-Riera M, Grande C, Truchado-Garcia M, Salazar-Ciudad I (2017) A set of simple cell processes is sufficient to model spiral cleavage. Development 144:54–62 [DOI] [PubMed] [Google Scholar]
- Buckles GR, Rauskolb C, Villano JL, Katz FN (2001) Four-jointed interacts with dachs, abelson and enabled and feeds back onto the Notch pathway to affect growth and segmentation in the Drosophila leg. Development 128:3533–3542 [DOI] [PubMed] [Google Scholar]
- Buenrostro JD, Wu B, Chang HY, Greenleaf WJ (2015) ATAC-seq: a method for assaying chromatin accessibility genome-wide. Curr Protoc Mol Biol 109:21 29 21–21 29 29 [DOI] [PMC free article] [PubMed] [Google Scholar]
- Burns R, Pechenik J (2017) Transcriptomic basis of metamorphic competence in the salt-marsh-dwelling polychaete Capitella teleta. Biol Bull 232:158–170 [DOI] [PubMed] [Google Scholar]
- Burns R, Pechenik J (2017) Transcriptomic basis of metamorphic competence in the salt-marsh-dwelling polychaete Capitella teleta. Biol Bull 232:158–170 [DATASET] [DOI] [PubMed] [Google Scholar]
- Carrillo-Baltodano AM, Donnellan RD, Williams EA, Jekely G, Martin-Duran JM (2024) The development of the adult nervous system in the annelid Owenia fusiformis. Neural Dev 19:3 [DOI] [PMC free article] [PubMed] [Google Scholar]
- Carrillo-Baltodano AM, Haillot E, Meha SM, Luqman I, Pashaj A, Lee Y-J, Lu T-M, Ferrier DEK, Schneider SQ, Martín-Durán JM (2025) Developmental system drift in dorsoventral patterning is linked to transitions to autonomous development in Annelida. Preprint at bioRxiv 2025.2005.2029.656861
- Carrillo-Baltodano AM, Meyer NP (2017) Decoupling brain from nerve cord development in the annelid Capitella teleta: insights into the evolution of nervous systems. Dev Biol 431:134–144 [DOI] [PubMed] [Google Scholar]
- Carrillo-Baltodano AM, Seudre O, Guynes K, Martin-Duran JM (2021) Early embryogenesis and organogenesis in the annelid Owenia fusiformis. Evodevo 12:5 [DOI] [PMC free article] [PubMed] [Google Scholar]
- Charif D, Lobry J (2007) SeqinR 1.0-2: a contributed package to the R project for statistical computing devoted to biological sequences retrieval and analysis. In: Bastolla U, Porto M, Roman H, Vendruscolo M (eds.) Structural approaches to sequence evolution: molecules, networks, populations. Springer Verlag, New York, pp 207–232.
- Charrad M, Ghazzali N, Boiteau V, Niknafs A (2014) NbClust: an R package for determining the relevant number of clusters in a data set. J Statl Softw 61:1–36 [Google Scholar]
- Cheng X, Hui JH, Lee YY, Wan Law PT, Kwan HS (2015) A “developmental hourglass” in fungi. Mol Biol Evol 32:1556–1566 [DOI] [PubMed] [Google Scholar]
- Chou HC, Pruitt MM, Bastin BR, Schneider SQ (2016) A transcriptional blueprint for a spiral-cleaving embryo. BMC Genomics 17:552 [DOI] [PMC free article] [PubMed] [Google Scholar]
- Chou HC, Pruitt MM, Bastin BR, Schneider SQ (2016) A transcriptional blueprint for a spiral-cleaving embryo. BMC Genomics 17:552 [DATASET] [DOI] [PMC free article] [PubMed] [Google Scholar]
- Cirillo LA, Lin FR, Cuesta I, Friedman D, Jarnik M, Zaret KS (2002) Opening of compacted chromatin by early developmental transcription factors HNF3 (FoxA) and GATA-4. Mol Cell 9:279–289 [DOI] [PubMed] [Google Scholar]
- Cohen J, Massey BD (2008) Larvae and the origins of major phyla. Biol J Linn Soc 19:321–328 [Google Scholar]
- Denes AS, Jekely G, Steinmetz PR, Raible F, Snyman H, Prud’homme B, Ferrier DE, Balavoine G, Arendt D (2007) Molecular architecture of annelid nerve cord supports common origin of nervous system centralization in bilateria. Cell 129:277–288 [DOI] [PubMed] [Google Scholar]
- Dill KK, Thamm K, Seaver EC (2007) Characterization of twist and snail gene expression during mesoderm and nervous system development in the polychaete annelid Capitella sp. I. Dev Genes Evol 217:435–447 [DOI] [PubMed] [Google Scholar]
- Dohle W (1999) The ancestral cleavage pattern of the clitellates and its phylogenetic deviations. Hydrobiologia 402:267–283 [Google Scholar]
- Domazet-Loso T, Tautz D (2010) A phylogenetically based transcriptome age index mirrors ontogenetic divergence patterns. Nature 468:815–818 [DOI] [PubMed] [Google Scholar]
- Duboule D (1994) Temporal colinearity and the phylotypic progression: a basis for the stability of a vertebrate Bauplan and the evolution of morphologies through heterochrony. Dev Suppl 135–142 [PubMed]
- Elek A, Kuzman M, Vlahovicek K (2024) coRdon: codon usage analysis and prediction of gene expressivity
- Emms DM, Kelly S (2019) OrthoFinder: phylogenetic orthology inference for comparative genomics. Genome Biol 20:238 [DOI] [PMC free article] [PubMed] [Google Scholar]
- Emura N, Yajima M (2022) Micromere formation and its evolutionary implications in the sea urchin. Curr Top Dev Biol 146:211–238 [DOI] [PMC free article] [PubMed] [Google Scholar]
- Endres DM, Schindelin JE (2003) A new metric for probability distributions. IEEE Trans Inform Theory 49:1858–1860 [Google Scholar]
- Erclik T, Hartenstein V, Lipshitz HD, McInnes RR (2008) Conserved role of the Vsx genes supports a monophyletic origin for bilaterian visual systems. Curr Biol 18:1278–1287 [DOI] [PubMed] [Google Scholar]
- Focareta L, Sesso S, Cole AG (2014) Characterization of homeobox genes reveals sophisticated regionalization of the central nervous system in the European cuttlefish Sepia officinalis. PLoS ONE 9:e109627 [DOI] [PMC free article] [PubMed] [Google Scholar]
- Freeman G, Lundelius J (1992) Evolutionary implications of the mode of D quadrant specification in coelomates with spiral cleavage. J Evol Biol 5:205–247 [Google Scholar]
- Frobius AC, Seaver EC (2006) ParaHox gene expression in the polychaete annelid Capitella sp. I. Dev Genes Evol 216:81–88 [DOI] [PubMed] [Google Scholar]
- Galis F, Metz JA (2001) Testing the vulnerability of the phylotypic stage: on modularity and evolutionary conservation. J Exp Zool 291:195–204 [DOI] [PubMed] [Google Scholar]
- Grinberg MG, Borisenko IE, Kozin VV (2025) Evidence of early zygotic genome activation in development of the annelid Ophelia limacina. OG 56:14–23 [Google Scholar]
- Gu Z (2022) Complex heatmap visualization. Imeta 1:e43 [DOI] [PMC free article] [PubMed] [Google Scholar]
- Gu Z, Eils R, Schlesner M (2016) Complex heatmaps reveal patterns and correlations in multidimensional genomic data. Bioinformatics 32:2847–2849 [DOI] [PubMed] [Google Scholar]
- Hall BK (1997) Phylotypic stage or phantom: is there a highly conserved embryonic stage in vertebrates? Trends Ecol Evol 12:461–463 [DOI] [PubMed] [Google Scholar]
- Harry ND, Zakas C (2024) The role of heterochronic gene expression and regulatory architecture in early developmental divergence. Elife 13:RP93062 [DOI] [PMC free article] [PubMed] [Google Scholar]
- Harry ND, Zakas C (2024) The role of heterochronic gene expression and regulatory architecture in early developmental divergence. Elife 13:RP93062 [DATASET] [DOI] [PMC free article] [PubMed] [Google Scholar]
- He S, Shao W, Chen SC, Wang T, Gibson MC (2023) Spatial transcriptomics reveals a cnidarian segment polarity program in Nematostella vectensis. Curr Biol 33:2678–2689.e2675 [DOI] [PubMed] [Google Scholar]
- Hejnol A (2010) A twist in time-the evolution of spiral cleavage in the light of animal phylogeny. Integr Comp Biol 50:695–706 [DOI] [PubMed] [Google Scholar]
- Hejnol A, Dunn CW (2016) Animal evolution: are Phyla real? Curr Biol 26:R424–426 [DOI] [PubMed] [Google Scholar]
- Henry JQ (2014) Spiralian model systems. Int J Dev Biol 58:389–401 [DOI] [PubMed] [Google Scholar]
- Kalinka AT, Tomancak P (2012) The evolution of early animal embryos: conservation or divergence? Trends Ecol Evol 27:385–393 [DOI] [PubMed] [Google Scholar]
- Kaya-Okur HS, Wu SJ, Codomo CA, Pledger ES, Bryson TD, Henikoff JG, Ahmad K, Henikoff S (2019) CUT&Tag for efficient epigenomic profiling of small samples and single cells. Nat Commun 10:1930 [DOI] [PMC free article] [PubMed] [Google Scholar]
- Kimura JO, Ricci L, Srivastava M (2021) Embryonic development in the acoel Hofstenia miamia. Development 148:dev188656 [DOI] [PMC free article] [PubMed] [Google Scholar]
- Kolde R (2025) Pretty heatmaps.
- Kumar L, M EF (2007) Mfuzz: a software package for soft clustering of microarray data. Bioinformation 2:5–7 [DOI] [PMC free article] [PubMed] [Google Scholar]
- Lacin H, Williamson WR, Card GM, Skeath JB, Truman JW (2020) Unc-4 acts to promote neuronal identity and development of the take-off circuit in the Drosophila CNS. Elife 9:e55007 [DOI] [PMC free article] [PubMed] [Google Scholar]
- Lambert JD (2010) Developmental patterns in spiralian embryos. Curr Biol 20:R72–77 [DOI] [PubMed] [Google Scholar]
- Lanza AR, Seaver EC (2020) Functional evidence that activin/nodal signaling is required for establishing the dorsal-ventral axis in the annelid Capitella teleta. Development 147:dev189373 [DOI] [PMC free article] [PubMed] [Google Scholar]
- Laumer CE, Bekkouche N, Kerbl A, Goetz F, Neves RC, Sorensen MV, Kristensen RM, Hejnol A, Dunn CW, Giribet G et al (2015) Spiralian phylogeny informs the evolution of microscopic lineages. Curr Biol 25:2000–2006 [DOI] [PubMed] [Google Scholar]
- Lee MT, Bonneau AR, Giraldez AJ (2014) Zygotic genome activation during the maternal-to-zygotic transition. Annu Rev Cell Dev Biol 30:581–613 [DOI] [PMC free article] [PubMed] [Google Scholar]
- Lemaire P, Smith WC, Nishida H (2008) Ascidians and the plasticity of the chordate developmental program. Curr Biol 18:R620–631 [DOI] [PMC free article] [PubMed] [Google Scholar]
- Levin M, Anavy L, Cole AG, Winter E, Mostov N, Khair S, Senderovich N, Kovalev E, Silver DH, Feder M et al (2016) The mid-developmental transition and the evolution of animal body plans. Nature 531:637–641 [DOI] [PMC free article] [PubMed] [Google Scholar]
- Liang Y, Carrillo-Baltodano AM, Martin-Duran JM (2024) Emerging trends in the study of spiralian larvae. Evol Dev 26:e12459 [DOI] [PubMed] [Google Scholar]
- Lin JH (1991) Divergence measures based on the Shannon entropy. IEEE Trans Inform Theory 37:145–151 [Google Scholar]
- Liu J, Viales RR, Khoueiry P, Reddington JP, Girardot C, Furlong EEM, Robinson-Rechavi M (2021) The hourglass model of evolutionary conservation during embryogenesis extends to developmental enhancers with signatures of positive selection. Genome Res 31:1573–1581 [DOI] [PMC free article] [PubMed] [Google Scholar]
- Lotharukpong JS, Zheng M, Luthringer R, Liesner D, Drost HG, Coelho SM (2024) A transcriptomic hourglass in brown algae. Nature 635:129–135 [DOI] [PMC free article] [PubMed] [Google Scholar]
- Love MI, Huber W, Anders S (2014) Moderated estimation of fold change and dispersion for RNA-seq data with DESeq2. Genome Biol 15:550 [DOI] [PMC free article] [PubMed] [Google Scholar]
- Lu X, Li JM, Elemento O, Tavazoie S, Wieschaus EF (2009) Coupling of zygotic transcription to mitotic control at the Drosophila mid-blastula transition. Development 136:2101–2110 [DOI] [PMC free article] [PubMed] [Google Scholar]
- Marletaz F, Firbas PN, Maeso I, Tena JJ, Bogdanovic O, Perry M, Wyatt CDR, de la Calle-Mustienes E, Bertrand S, Burguera D et al (2018) Amphioxus functional genomics and the origins of vertebrate gene regulation. Nature 564:64–70 [DOI] [PMC free article] [PubMed] [Google Scholar]
- Marletaz F, Peijnenburg K, Goto T, Satoh N, Rokhsar DS (2019) A new spiralian phylogeny places the enigmatic arrow worms among Gnathiferans. Curr Biol 29:312–318.e313 [DOI] [PubMed] [Google Scholar]
- Martin-Duran JM, Hejnol A (2015) The study of Priapulus caudatus reveals conserved molecular patterning underlying different gut morphogenesis in the Ecdysozoa. BMC Biol 13:29 [DOI] [PMC free article] [PubMed] [Google Scholar]
- Martin-Duran JM, Hejnol A (2021) A developmental perspective on the evolution of the nervous system. Dev Biol 475:181–192 [DOI] [PubMed] [Google Scholar]
- Martin-Duran JM, Marletaz F (2020) Unravelling spiral cleavage. Development 147:dev181081 [DOI] [PubMed] [Google Scholar]
- Martin-Duran JM, Pang K, Borve A, Le HS, Furu A, Cannon JT, Jondelius U, Hejnol A (2018) Convergent evolution of bilaterian nerve cords. Nature 553:45–50 [DOI] [PMC free article] [PubMed] [Google Scholar]
- Martin-Duran JM, Passamaneck YJ, Martindale MQ, Hejnol A (2016) The developmental basis for the recurrent evolution of deuterostomy and protostomy. Nat Ecol Evol 1:5 [DOI] [PubMed] [Google Scholar]
- Martin-Duran JM, Vellutini BC, Marletaz F, Cetrangolo V, Cvetesic N, Thiel D, Henriet S, Grau-Bove X, Carrillo-Baltodano AM, Gu W et al (2021) Conservative route to genome compaction in a miniature annelid. Nat Ecol Evol 5:231–242 [DOI] [PMC free article] [PubMed] [Google Scholar]
- Martin-Zamora FM, Liang Y, Guynes K, Carrillo-Baltodano AM, Davies BE, Donnellan RD, Tan Y, Moggioli G, Seudre O, Tran M et al (2023) Annelid functional genomics reveal the origins of bilaterian life cycles. Nature 615:105–110 [DOI] [PMC free article] [PubMed] [Google Scholar]
- Martin-Zamora FM, Liang Y, Guynes K, Carrillo-Baltodano AM, Davies BE, Donnellan RD, Tan Y, Moggioli G, Seudre O, Tran M et al (2023) Annelid functional genomics reveal the origins of bilaterian life cycles. Nature 615:105–110 [DATASET] [DOI] [PMC free article] [PubMed] [Google Scholar]
- Meyer NP, Seaver EC (2009) Neurogenesis in an annelid: characterization of brain neural precursors in the polychaete Capitella sp. I. Dev Biol 335:237–252 [DOI] [PubMed] [Google Scholar]
- Miglioli A, Tredez M, Boosten M, Sant C, Carvalho JE, Dru P, Canesi L, Schubert M, Dumollard R (2024) The Mediterranean mussel Mytilus galloprovincialis: a novel model for developmental studies in mollusks. Development 151:dev202256 [DOI] [PubMed] [Google Scholar]
- Miglioli A, Tredez M, Boosten M, Sant C, Carvalho JE, Dru P, Canesi L, Schubert M, Dumollard R (2024) The Mediterranean mussel Mytilus galloprovincialis: a novel model for developmental studies in mollusks. Development 151:dev202256 [DATASET] [DOI] [PubMed] [Google Scholar]
- Miller DM, Shen MM, Shamu CE, Burglin TR, Ruvkun G, Dubois ML, Ghee M, Wilson L (1992) C. elegans unc-4 gene encodes a homeodomain protein that determines the pattern of synaptic input to specific motor neurons. Nature 355:841–845 [DOI] [PubMed] [Google Scholar]
- Morino Y, Hashimoto N, Wada H (2017) Expansion of TALE homeobox genes and the evolution of spiralian development. Nat Ecol Evol 1:1942–1949 [DOI] [PubMed] [Google Scholar]
- Morrill JB, Blair CA, Larsen WJ (1973) Regulative development in the pulmonate gastropod, Lymnaea palustris, as determined by blastomere deletion experiments. J Exp Zool 183:47–55 [Google Scholar]
- Neal S, de Jong DM, Seaver EC (2019) CRISPR/CAS9 mutagenesis of a single r-opsin gene blocks phototaxis in a marine larva. Proc Biol Sci 286:20182491 [DOI] [PMC free article] [PubMed] [Google Scholar]
- Newport J, Kirschner M (1982) A major developmental transition in early Xenopus embryos: I. characterization and timing of cellular changes at the midblastula stage. Cell 30:675–686 [DOI] [PubMed] [Google Scholar]
- Nielsen C (2004) Trochophora larvae: cell-lineages, ciliary bands, and body regions. 1. Annelida and Mollusca. J Exp Zool B Mol Dev Evol 302:35–68 [DOI] [PubMed] [Google Scholar]
- Nielsen C (2005) Trochophora larvae: cell-lineages, ciliary bands and body regions. 2. Other groups and general discussion. J Exp Zool B Mol Dev Evol 304:401–447 [DOI] [PubMed] [Google Scholar]
- O’Farrell PH, Stumpff J, Su TT (2004) Embryonic cleavage cycles: how is a mouse like a fly? Curr Biol 14:R35–45 [DOI] [PMC free article] [PubMed] [Google Scholar]
- Pagès H, Aboyoun P, Gentleman R, DebRoy S (2024) Biostrings: efficient manipulation of biological strings.
- Paps J, Xu F, Zhang G, Holland PW (2015) Reinforcing the egg-timer: recruitment of novel lophotrochozoa homeobox genes to early and late development in the pacific oyster. Genome Biol Evol 7:677–688 [DOI] [PMC free article] [PubMed] [Google Scholar]
- Park C, Han YH, Lee SG, Ry KB, Oh J, Kern EMA, Park JK, Cho SJ (2018) The developmental transcriptome atlas of the spoon worm Urechis unicinctus (Echiurida: Annelida). Gigascience 7:1–7 [DOI] [PMC free article] [PubMed] [Google Scholar]
- Park C, Han YH, Lee SG, Ry KB, Oh J, Kern EMA, Park JK, Cho SJ (2018) The developmental transcriptome atlas of the spoon worm Urechis unicinctus (Echiurida: Annelida). Gigascience 7:1–7 [DATASET] [DOI] [PMC free article] [PubMed] [Google Scholar]
- Pedregosa F, Varoquaux G, Gramfort A, Michel V, Thirion B, Grisel O, Blondel M, Prettenhofer P, Weiss R, Dubourg V et al (2011) Scikit-learn: machine learning in Python. J Mach Learn Res 12:2825–2830 [Google Scholar]
- Planques A, Malem J, Parapar J, Vervoort M, Gazave E (2019) Morphological, cellular and molecular characterization of posterior regeneration in the marine annelid Platynereis dumerilii. Dev Biol 445:189–210 [DOI] [PubMed] [Google Scholar]
- Quint M, Drost HG, Gabel A, Ullrich KK, Bonn M, Grosse I (2012) A transcriptomic hourglass in plant embryogenesis. Nature 490:98–101 [DOI] [PubMed] [Google Scholar]
- Reish DJ (1974) The establishment of laboratory colonies of polychaetous annelids. Thalassia Jugosl 10:181–195 [Google Scholar]
- Render J (1989) Development of Ilyanassa obsoleta embryos after equal distribution of polar lobe material at first cleavage. Dev Biol 132:241–250 [DOI] [PubMed] [Google Scholar]
- Richardson MK (1995) Heterochrony and the phylotypic period. Dev Biol 172:412–421 [DOI] [PubMed] [Google Scholar]
- Ritchie ME, Phipson B, Wu D, Hu Y, Law CW, Shi W, Smyth GK (2015) limma powers differential expression analyses for RNA-sequencing and microarray studies. Nucleic Acids Res 43:e47 [DOI] [PMC free article] [PubMed] [Google Scholar]
- Rock R, Heinrich AC, Schumacher N, Gessler M (2005) Fjx1: a notch-inducible secreted ligand with specific binding sites in developing mouse embryos and adult brain. Dev Dyn 234:602–612 [DOI] [PubMed] [Google Scholar]
- Rouhana L, Edgar A, Hugosson F, Dountcheva V, Martindale MQ, Ryan JF (2023) Cytoplasmic polyadenylation is an ancestral hallmark of early development in animals. Mol Biol Evol 40:msad137 [DOI] [PMC free article] [PubMed] [Google Scholar]
- Rouse GW (2008) Trochophore concepts: ciliary bands and the evolution of larvae in spiralian Metazoa. Biol J Linn Soc 66:411–464 [Google Scholar]
- Rueden CT, Schindelin J, Hiner MC, DeZonia BE, Walter AE, Arena ET, Eliceiri KW (2017) ImageJ2: imageJ for the next generation of scientific image data. BMC Bioinformatics 18:529 [DOI] [PMC free article] [PubMed] [Google Scholar]
- Sander K (1994) The evolution of insect patterning mechanisms: a survey of progress and problems in comparative molecular embryology. Dev Suppl 187–191
- Schimizzi GV, Longmore GD (2015) Ajuba proteins. Curr Biol 25:R445–446 [DOI] [PubMed] [Google Scholar]
- Seaver EC (2005) Growth patterns during segmentation in the two polychaete annelids, Capitella sp. I and Hydroides elegans comparisons at distinct life history stages. Evol Dev 7:312–326 [DOI] [PubMed]
- Seaver EC, Yamaguchi E, Richards GS, Meyer NP (2012) Expression of the pair-rule gene homologs runt, Pax3/7, even-skipped-1 and even-skipped-2 during larval and juvenile development of the polychaete annelid Capitella teleta does not support a role in segmentation. Evodevo 3:8 [DOI] [PMC free article] [PubMed] [Google Scholar]
- Seudre O, Carrillo-Baltodano AM, Liang Y, Martin-Duran JM (2022a) ERK1/2 is an ancestral organising signal in spiral cleavage. Nat Commun 13:2286 [DOI] [PMC free article] [PubMed] [Google Scholar]
- Seudre O, Martin-Zamora FM, Rapisarda V, Luqman I, Carrillo-Baltodano AM, Martin-Duran JM (2022b) The Fox gene repertoire in the annelid Owenia fusiformis reveals multiple expansions of the foxQ2 class in Spiralia. Genome Biol Evol 14:evac139 [DOI] [PMC free article] [PubMed] [Google Scholar]
- Slack JM, Holland PW, Graham CF (1993) The zootype and the phylotypic stage. Nature 361:490–492 [DOI] [PubMed] [Google Scholar]
- Sobell HM (1985) Actinomycin and DNA transcription. Proc Natl Acad Sci USA 82:5328–5331 [DOI] [PMC free article] [PubMed] [Google Scholar]
- Stolfi A, Levine M (2011) Neuronal subtype specification in the spinal cord of a protovertebrate. Development 138:995–1004 [DOI] [PubMed] [Google Scholar]
- Struck TH, Wey-Fabrizius AR, Golombek A, Hering L, Weigert A, Bleidorn C, Klebow S, Iakovenko N, Hausdorf B, Petersen M et al (2014) Platyzoan paraphyly based on phylogenomic data supports a noncoelomate ancestry of spiralia. Mol Biol Evol 31:1833–1849 [DOI] [PubMed] [Google Scholar]
- Sur A, Magie CR, Seaver EC, Meyer NP (2017) Spatiotemporal regulation of nervous system development in the annelid Capitella teleta. Evodevo 8:13 [DOI] [PMC free article] [PubMed] [Google Scholar]
- Tadros W, Lipshitz HD (2009) The maternal-to-zygotic transition: a play in two acts. Development 136:3033–3042 [DOI] [PubMed] [Google Scholar]
- Tan S, Huan P, Liu B (2022) Molluskan dorsal-ventral patterning relying on BMP2/4 and chordin povides insights into spiralian development and evolution. Mol Biol Evol 39:msab322 [DOI] [PMC free article] [PubMed] [Google Scholar]
- Tan S, Huan P, Liu B (2023) Functional evidence that FGFR regulates MAPK signaling in organizer specification in the gastropod mollusk Lottia peitaihoensis. Mar Life Sci Technol 5:455–466 [DOI] [PMC free article] [PubMed] [Google Scholar]
- Tena JJ, Gonzalez-Aguilera C, Fernandez-Minan A, Vazquez-Marin J, Parra-Acero H, Cross JW, Rigby PW, Carvajal JJ, Wittbrodt J, Gomez-Skarmeta JL et al (2014) Comparative epigenomics in distantly related teleost species identifies conserved cis-regulatory nodes active during the vertebrate phylotypic period. Genome Res 24:1075–1085 [DOI] [PMC free article] [PubMed] [Google Scholar]
- Tenenbaum D, Maintainer B (2024) KEGGREST: client-side REST access to the Kyoto Encyclopedia of Genes and Genomes (KEGG).
- Tian Q, Sun Y, Gao T, Li J, Hao Z, Fang H, Zhang S (2021) TBX2/3 is required for regeneration of dorsal-ventral and medial-lateral polarity in planarians. J Cell Biochem 122:731–738 [DOI] [PubMed] [Google Scholar]
- Uchida Y, Shigenobu S, Takeda H, Furusawa C, Irie N (2022) Potential contribution of intrinsic developmental stability toward body plan conservation. BMC Biol 20:82 [DOI] [PMC free article] [PubMed] [Google Scholar]
- Uesaka M, Kuratani S, Takeda H, Irie N (2019) Recapitulation-like developmental transitions of chromatin accessibility in vertebrates. Zool Lett 5:33 [DOI] [PMC free article] [PubMed] [Google Scholar]
- Untergasser A, Cutcutache I, Koressaar T, Ye J, Faircloth BC, Remm M, Rozen SG (2012) Primer3-new capabilities and interfaces. Nucleic Acids Res 40:e115 [DOI] [PMC free article] [PubMed] [Google Scholar]
- Valencia JE, Feuda R, Mellott DO, Burke RD, Peter IS (2021) Ciliary photoreceptors in sea urchin larvae indicate pan-deuterostome cell type conservation. BMC Biol 19:257 [DOI] [PMC free article] [PubMed] [Google Scholar]
- Valentine JW (1997) Cleavage patterns and the topology of the metazoan tree of life. Proc Natl Acad Sci USA 94:8001–8005 [DOI] [PMC free article] [PubMed] [Google Scholar]
- van den Biggelaar JA, Guerrier P (1979) Dorsoventral polarity and mesentoblast determination as concomitant results of cellular interactions in the mollusk Patella vulgata. Dev Biol 68:462–471 [DOI] [PubMed] [Google Scholar]
- Vastenhouw NL, Cao WX, Lipshitz HD (2019) The maternal-to-zygotic transition revisited. Development 146:dev161471 [DOI] [PubMed] [Google Scholar]
- Vellutini BC, Hejnol A (2016) Expression of segment polarity genes in brachiopods supports a non-segmental ancestral role of engrailed for bilaterians. Sci Rep 6:32387 [DOI] [PMC free article] [PubMed] [Google Scholar]
- Waddington C (1956) Principles of embryology. George Allen & Unwin Ltd, London
- Wilt FH (1973) Polyadenylation of maternal RNA of sea urchin eggs after fertilization. Proc Natl Acad Sci USA 70:2345–2349 [DOI] [PMC free article] [PubMed] [Google Scholar]
- Wollesen T, Rodriguez Monje SV, Todt C, Degnan BM, Wanninger A (2015) Ancestral role of Pax2/5/8 in molluscan brain and multimodal sensory system development. BMC Evol Biol 15:231 [DOI] [PMC free article] [PubMed] [Google Scholar]
- Wolpert L, Tickle C, Martinez Arias A (2019) Principles of development. Oxford University Press, Oxford
- Wu L, Ferger KE, Lambert JD (2019) Gene expression does not support the developmental hourglass model in three animals with spiralian development. Mol Biol Evol 36:1373–1383 [DOI] [PubMed] [Google Scholar]
- Wu T, Hu E, Xu S, Chen M, Guo P, Dai Z, Feng T, Zhou L, Tang W, Zhan L et al (2021) clusterProfiler 4.0: a universal enrichment tool for interpreting omics data. Innovation 2:100141 [DOI] [PMC free article] [PubMed] [Google Scholar]
- Xing C, Pan R, Hu G, Liu X, Wang Y, Li G (2021) Pitx controls amphioxus asymmetric morphogenesis by promoting left-side development and repressing right-side formation. BMC Biol 19:166 [DOI] [PMC free article] [PubMed] [Google Scholar]
- Xu F, Domazet-Loso T, Fan D, Dunwell TL, Li L, Fang X, Zhang G (2016) High expression of new genes in trochophore enlightening the ontogeny and evolution of trochozoans. Sci Rep 6:34664 [DOI] [PMC free article] [PubMed] [Google Scholar]
- Xu F, Domazet-Loso T, Fan D, Dunwell TL, Li L, Fang X, Zhang G (2016) High expression of new genes in trochophore enlightening the ontogeny and evolution of trochozoans. Sci Rep 6:34664 [DATASET] [DOI] [PMC free article] [PubMed] [Google Scholar]
- Zalts H, Yanai I (2017) Developmental constraints shape the evolution of the nematode mid-developmental transition. Nat Ecol Evol 1:113 [DOI] [PubMed] [Google Scholar]
- Zhang G, Fang X, Guo X, Li L, Luo R, Xu F, Yang P, Zhang L, Wang X, Qi H et al (2012) The oyster genome reveals stress adaptation and complexity of shell formation. Nature 490:49–54 [DOI] [PubMed] [Google Scholar]
Associated Data
This section collects any data citations, data availability statements, or supplementary materials included in this article.
Supplementary Materials
Data Availability Statement
The new sequencing data generated in this project have been deposited at the Gene Expression Omnibus portal with BioProject accession number PRJNA1019281 (https://www.ncbi.nlm.nih.gov/bioproject/PRJNA1019281). The original confocal and differential interference contrast images have been deposited at the BioImage Archive with accession number S-BIAD2125 (https://www.ebi.ac.uk/biostudies/bioimages/studies/S-BIAD2125).
The source data of this paper are collected in the following database record: biostudies:S-SCDT-10_1038-S44319-025-00569-4.