

Abstract
To address the issues of poor harvesting efficiency, unsatisfactory cutting performance, and high energy consumption in current golden needle mushroom harvesting machinery, this study designed a novel rotary cutter-type root cutting device featuring a slitting cutting angle cutter. The device utilizes a clamping mechanism on a feed turntable to secure the mushrooms, with root cutting achieved through synchronized rotation of the rotary cutter and the turntable. The study commenced with a theoretical analysis of the device’s trajectory displacement model and cutting process, determining the structural form and parameter ranges for key components. Utilizing EDEM discrete element software, simulation optimization tests were conducted using cutting force and unit area power consumption as evaluation metrics. Experiments investigated the effects of rotary cutter geometry and operational parameters, ultimately identifying the optimal cutter parameter combination: a sliding cutting angle of 26°, a cutting edge angle of 15°, and a thickness of 2 mm. The best operational parameters were determined to be a cutting speed of 1400 r/min, a turntable feed speed of 6 r/min, and a cutting height of 20 mm An test platform was constructed to validate the simulation results. The findings demonstrated that the new slitting angle cutter reduced cutting force by 39.4% and unit area power consumption by 24.5%. Additionally, the design significantly improved cutting flatness, ensuring that the device’s performance and efficiency met the design requirements. This study provides an effective solution to key technical challenges in the mechanized harvesting of golden needle mushrooms.
Keywords: Rotary cutter, Test, Golden needle mushroom, Cutting force, Power
Subject terms: Engineering, Mathematics and computing
Introduction
The golden needle mushroom, also known as winter mushroom and Flammulina velutipes with hairy stipe, is rich in vitamins, amino acids, and flammulin, etc. It helps the human body absorb nutrients and enhances the body’s ability to resist cancer cells, thus playing a positive role in improving human health1–6. The modern golden needle mushroom industry has shown a trend of development towards mechanization, automation, intensification, and standardization. However, as the golden needle mushroom grows in clusters, the diameters and lengths of the caps, stipes, and mycelium within each cluster vary, lacking consistency and standardization. It is difficult to achieve reliable automatic positioning and fixation when using mechanical equipment to process it. Moreover, the golden needle mushroom is highly flexible and brittle. Traditional mechanical devices are likely to damage it, resulting in poor harvesting effects. Therefore, at present, the subsequent processes such as harvesting, cutting, sorting, weighing, and packaging of the golden needle mushroom are basically completed manually, with low mechanization and efficiency levels. In addition, the trend of population aging will seriously restrict the development of the golden needle mushroom industry. Therefore, improving the mechanization and automation levels of golden needle mushroom production is of great practical significance for promoting the development of the golden needle mushroom industry7,8.
Cutting the roots is one of the crucial procedures in the harvesting process of golden needle mushrooms. At present, the machinery commonly employed for cutting roots and removing stems of crops, both domestically and internationally, typically utilizes a method that involves clamping before cutting. Related technologies are frequently applied to crops including cotton stalks, sugarcane, and bast fibers9–14. Relevant researchers have also analyzed the optimization of process parameters during the cutting process and achieved certain results. Mcrandal et al.15 found that different cutting methods consume different amounts of cutting energy, and the higher the speed, the lower the cutting energy consumed. Johnson et al.16 investigated the impact of cutting speed and cutting angle on the cutting quality and energy consumption for greenhouse leafy vegetables, demonstrating a positive correlation between these variables and cutting performance parameters. Zhang et al.17 designed a device aimed at addressing issues such as complex procedures, ineffective outcomes, and high cutting forces encountered during the basal root removal process of water chestnut buds. Utilizing the EDEM discrete element method alongside response surface methodology, they performed simulation optimization analysis on the parameters of key components. Through optimizing the parameter combination, they achieved a 23.29% reduction in the cutting force required for water chestnut bud processing. Song et al.18 optimized the structural parameters of the moving blade with the aim of enhancing cutting efficiency for corn stalks. Huang et al.19 designed an equal-interval rotating mechanism to achieve coordination between the intermittent rotation of sugarcane and the reciprocating motion of the peeling cutter, thereby enabling the mechanized peeling of sugarcane. Tian et al.20 applied bionics principles to design hemp-cutting blades, aiming to achieve reduced drag and lower energy consumption. Kong21 designed a disc-cutting-type castor harvesting device in combination with the physiological characteristics of castor plants to achieve stable cutting and reduce the loss rate. However, it should be noted that the crops targeted by the aforementioned studies generally exhibit high hardness and are resistant to deformation. However, golden needle mushrooms are flexible bodies themselves. If the root-cutting operation is carried out at a low speed like water chestnuts or other stem crops, the extrusion phenomenon of the tool on the mushroom body is obvious, which is likely to cause damage to the mushroom body tissue, resulting in an uneven cut surface and thus affecting the harvesting quality of golden needle mushrooms. Moreover, the energy-saving factor has not been fully considered, resulting in large energy losses during the operation process. Therefore, the machinery commonly employed for root cutting and stem removal in crops is not directly applicable to the harvesting process of golden needle mushrooms.
Despite recent advances in harvesting machinery for delicate crops, including the development of a robotic arm-based adaptive harvesting end-effector that reduces mushroom damage through bilateral synchronized cutting and soft gripping, such designs primarily focus on mitigating uneven stem stress and preventing cap tearing—making them suitable for mushroom varieties with stems possessing certain rigidity. However, golden needle mushroom grow in dense clusters, featuring extremely slender stems (approximately 2 mm in diameter) with high flexibility and fragility. Conventional low-speed cutting methods induce significant compressive effects, leading to tissue damage and uneven cut surfaces. Consequently, existing approaches fail to fundamentally resolve the conflict between high-speed, efficient cutting and minimal damage in enoki mushroom harvesting.
To address this limitation, this study deviates from traditional low-speed cutting methods and proposes an innovative design incorporating high-speed rotary cutting combined with a blade featuring a specific sliding-cutting angle. The core innovation lies in utilizing high-speed blade motion (1400 r/min) to drastically reduce contact time with the golden needle mushroom, thereby minimizing compressive deformation caused by their inherent flexibility. Simultaneously, the optimized sliding-cutting angle (26°) and blade edge angle (15°) enable the blade to smoothly “slide into” and sever the hyphal bundles rather than “crushing” through them, effectively preventing stem tearing and irregular cut surfaces. This high-speed sliding-cutting mechanism is specifically optimized for the unique physical properties of golden needle mushroom, representing the primary distinction from prior research.
First, a theoretical analysis of the device’s trajectory, displacement model, and cutting process is conducted to determine the structural configuration and parameter ranges of its key components. Subsequently, a quadratic orthogonal experiment designed using Design-Expert software is employed for optimization analysis of the rotary cutter’s structural and operational parameters via EDEM discrete element simulation. This analysis investigates the relationships between blade structural parameters and cutting force, as well as between operational parameters and power consumption. Finally, an experimental platform is established to compare experimental results with simulation outcomes, thereby validating the reliability of the simulation.
In recent years, advanced statistical and optimization methods have been successfully applied in the field of materials processing, providing important methodological references for this study.
In a study published in Polymers, Korkmaz et al.22 employed Analysis of Variance (ANOVA) to identify the significant effects of laser power, cutting speed, and printed layer thickness on the quality of CO₂ laser-cut FFF-printed ASA parts, including surface roughness and heat-affected zone width. Based on this, they further constructed a high-precision multi-output prediction model using Artificial Neural Networks (ANN) and the Grey Wolf Optimizer (GWO), achieving multi-objective optimization of process parameters. This study serves as a prime example of combining statistical analysis with machine learning to solve complex engineering problems.
Ahmad et al.23, in their work published in Proceedings of the Institution of Mechanical Engineers, Part E: Journal of Process Mechanical Engineering, skillfully integrated the Fuzzy Analytic Hierarchy Process (Fuzzy AHP), a multi-criteria decision-making method (MCDM), with Response Surface Methodology (RSM). They first used Fuzzy AHP to determine the importance weights of multiple output responses (such as kerf width and surface roughness) in laser cutting of polyethylene, and then performed multi-objective optimization using models established by RSM, obtaining process parameters with optimal overall performance. This study demonstrates an advanced strategy that combines subjective decision-making with objective statistical modeling.
Another study by Korkmaz and Güney24, also published in Polymers, systematically investigated the quality of laser-cut FFF-printed ABS. The work quantified the significance of process parameters using Design of Experiments (DOE) and ANOVA, and successfully applied machine learning algorithms such as Support Vector Regression (SVR) and Random Forest to accurately predict cutting quality, with prediction results showing high agreement with experimental data (R² > 0.97).
The above-mentioned studies strongly demonstrate the critical role of statistical tests (such as ANOVA) and modern optimization algorithms in process parameter analysis and optimization. Inspired by these works, this study similarly adopts repeated experiments and statistical testing (t-test) to rigorously verify the significance of differences in tool performance, ensuring the scientific validity and reliability of the conclusions.
Motion analysis and key component design
Overall machine structure
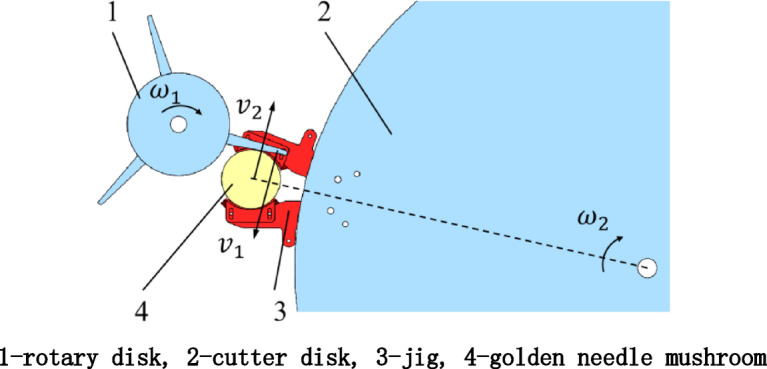
The high-speed downward-rotating cutter-type device for cutting the basal parts of golden needle mushrooms mainly consists of a frame, a rotating cutter, a golden needle mushroom fixture, a conveyor turntable, and other components. The overall structure is shown in Fig. 1.
Fig. 1.

Schematic diagram of the root cutting device of golden needle mushroom mushrooms with rotary cutter.
The conveyor turntable rotates around its own axis. There are six positioning fixtures on the turntable surface for clamping golden needle mushrooms. The fixtures clamp the golden needle mushrooms by means of tensile force, restricting their horizontal and vertical displacements to achieve the positioning function. The rotating cutter includes three evenly distributed cutters, with an included angle of 120° between adjacent cutters. The cutter group rotates around the installation central axis, and the blade edges of the blades are in contact with the surface of the disc to cut the basal parts of the golden needle mushrooms.
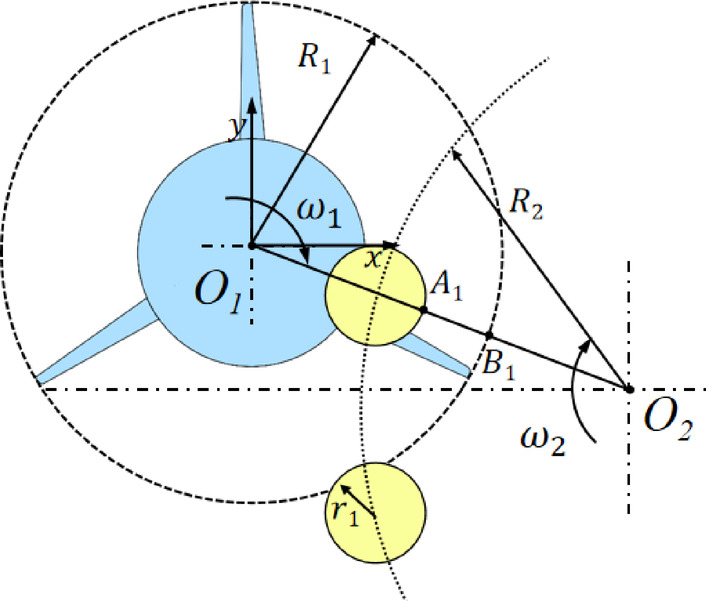
During operation, the clamped golden needle mushrooms rotate around the axis together with the disc. When the golden needle mushrooms are conveyed to the cutting radius range of the rotating cutter, the rotating cutter starts to perform the root-cutting operation on the golden needle mushrooms. The disc and the rotating cutter group rotate in the same direction. As shown in Fig. 2, during the cutting process, the linear velocity directions of the two are opposite to enhance the cutting effect.
Fig. 2.
Principle diagram of golden needle mushroom mushroom root excision.  is the rotary cutter angular speed;
  s the disk angular speed;
  is the rotary cutter linear speed;
  is the turntable linear speed.
Synchronization working principle
The core motion synchronization of this device relies on two independently controlled rotational movements: the continuous rotary motion of the conveying turntable and the continuous high-speed rotation of the rotary cutting tool assembly. Their coordinated operation proceeds as follows:
Initiation of the Operating Cycle: The conveying turntable, driven by a servo motor, rotates continuously, transporting golden needle mushroom clamped by fixtures into the cutting station.
Cutting Process: When the mushroom held by the turntable reaches the cutting station—positioned within the cutting radius of the rotary blade assembly—the high-speed rotating cutter (directly driven by a motor) performs the root-cutting operation. This continuous high-speed rotary cutting method ensures mushroom stem stability during the instant of cutting, thereby guaranteeing cut surface quality.
Synchronization Mechanism: Synchronization is achieved through the control system. The main controller (PLC) receives position signals from sensors monitoring the turntable and accordingly sends commands to the two motors. Throughout the process, the cutter motor remains continuously powered and rotating at high speed. Thus, during the period when the turntable rotates to position a mushroom for cutting, the high-speed blade is ready to complete the root-cutting operation precisely at the designated moment.
Through the coordinated integration of this mechanical structure and control logic, precise synchronization between the turntable’s feeding motion and the cutting tool’s operation is achieved, ensuring both high production efficiency and consistent cutting stability and quality.
Motion analysis and key component design
Rotary cutting model analysis
Clamping force analysis
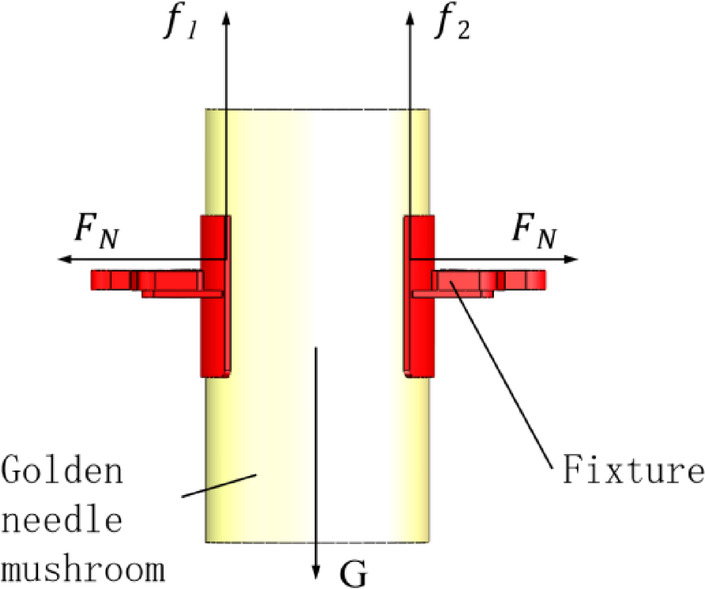
The design of the fixture is crucial for achieving stable clamping while preventing tissue damage. The fixture in this device features a clamping surface lined with flexible rubber material (Shore hardness A approximately 40–50) and incorporates shallow textured teeth on its surface to increase the coefficient of friction. This design is based on the following considerations: the rubber material exhibits excellent elastic deformation capability, enabling it to provide sufficient normal pressure while significantly reducing the contact pressure on the mushroom stem surface by increasing the effective contact area, thereby avoiding crushing of the delicate stem tissue. Meanwhile, the shallow textured teeth effectively enhance the static friction coefficient without excessively penetrating the stem surface. As a result, slippage and detachment are prevented even under relatively low clamping forces, ensuring stable and reliable fixation during handling and cutting operations.
After being fixed by the fixture, the golden needle mushroom is subjected to the action of its own gravity G, the clamping forces  on both sides of the fixture, and the frictional forces
  and
and  between the golden needle mushroom and the material. The forces are shown in Fig. 3.
Fig. 3.
Analysis of gripping force of golden needle mushroom.
According to the static equilibrium conditions, in order to prevent the golden needle mushroom from falling off, the following conditions need to be satisfied:
 |
1 |
where, G=mg,  , m is the mass of the golden needle mushroom, and
  is the friction coefficient between the golden needle mushroom and the contacting material.
Therefore, based on the static force equilibrium equation, with the mass m of a single cluster of golden needle mushroom approximately 0.5 kg, gravitational acceleration  ,and the friction coefficient
  , the required clamping force can be calculated as follows:
 |
Considering potential vibrations induced by the impact of the cutting tool during operation, a safety factor (e.g., k = 3) is applied to ensure reliable clamping. Therefore, the required design holding force for a single fixture is approximately:
 |
The clamping force provided by the spring mechanism in this device is designed to exceed this value, ensuring reliable and stable fixation during operation. This overdesign margin guarantees that the fixture maintains sufficient holding force even under dynamic conditions such as vibration or impact during high-speed cutting, thereby preventing slippage or detachment of the enoki mushroom cluster while minimizing the risk of mechanical damage.
Rotary cutting force analysis
During the root-cutting process, the golden needle mushroom is simultaneously subjected to the pushing force  exerted by the fixture on the golden needle mushroom, the pushing force
  exerted by the cutter on the golden needle mushroom, the pressing force
  exerted by the fixture on the golden needle mushroom, and the frictional force (since the direction of the frictional force is vertical and the horizontal force situation is being analyzed here, the frictional force is not shown in the Fig. 4). Therefore, a rotational cutting force model is established, as shown in Fig. 4.
Fig. 4.
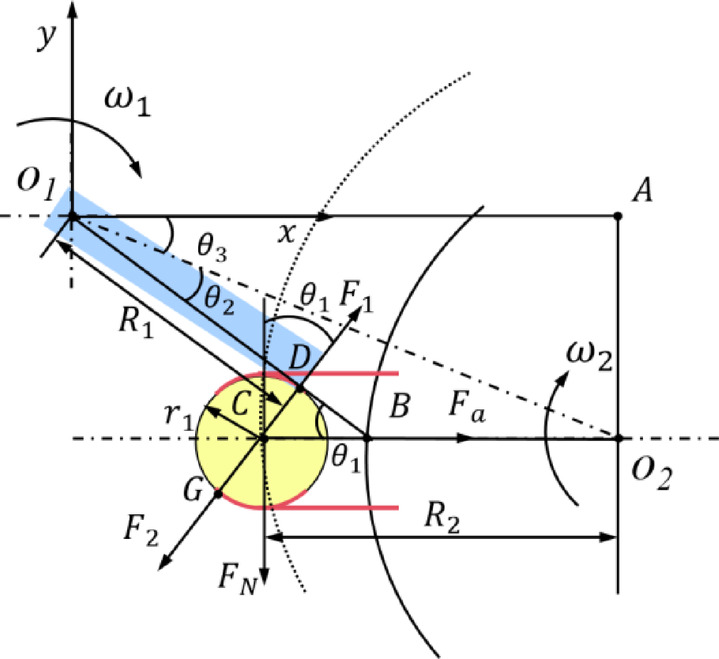
Cutting contact force analysis.  ,
,  are the cutter and turntable center points, respectively;
  is the radius of the rotary cutter;
  is the radius of rotation of the turntable;
  is the radius of the bacterial body;
  is the thrust of the fixture on the golden needle mushroom and the point of action is G;
  is the thrust of the cutter on the golden needle mushroom and the point of action is D;
  for the pressure of the jig on the golden needle mushrooms;
  for centripetal force; A is the intersection of the horizontal line through
  and the vertical line through
  ; B is the intersection of the extension of
  with line
  ; C is the center point of the golden needle mushroom; D is the point of intersection of the cutter’s thrust
  against the golden needle mushroom; G is the point of contact between the edge of the jig and the golden needle;
  is the angle between the rotary cutter and the horizontal line;
  is the angle of
  and
and  ;
;  is the angle of
  and
and  .
.
At the instant of cutting contact between the rotating cutter and the golden needle mushroom, the pushing force of the cutter on the golden needle mushroom is zero, i.e.,. Then, the force equilibrium relationship is:
 |
2 |
where,  can be obtained from Eq. (1) as
  , and the centripetal force is
  .
.
To achieve the best cutting effect, it is necessary to first determine the optimal distance between the center of the turntable and the center of the cutter disc, namely  . And there is the following relationship between
  :
:  .
.
Among them,  refers to:
 |
3 |
 |
4 |
During the transportation of the golden needle mushroom on the turntable, when the center of the golden needle mushroom is on  , the positions and line segment relationships illustrated in Fig. 5 can be used to determine whether the golden needle mushroom can be completely cut during this process. Thus, it can be concluded that:
 |
5 |
Fig. 5.
Perfect cutting condition.
where,  ,
,  .
.
According to the actual working conditions, the distance  between the two centers is initially selected as 765 mm; the rotating radius
  of the cutter is 175 mm; the rotating radius
  of the turntable is 640 mm; the radius
  of the golden needle mushroom body is 46.22 mm. Then
  is 709 mm and
  is 287 mm.
Motion analysis of interactions
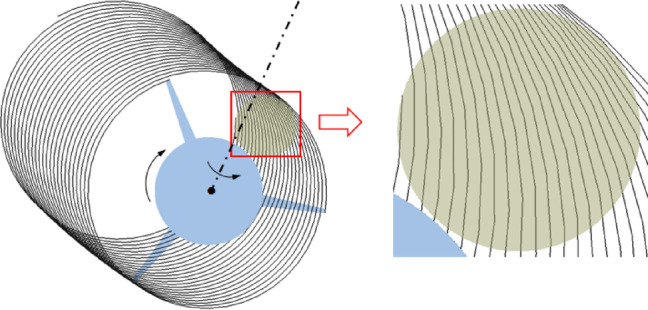
The interaction trajectories of the cutter and the golden needle mushroom are shown in Fig. 6a. The two rotating bodies perform circular motions in the same direction. The golden needle mushroom is conveyed from position  to the position
  to be cut by the turntable with an angular velocity of
  . For the convenience of subsequent analysis, the golden needle mushroom is now regarded as the reference object. That is, the rotating cutter moves in a circular motion around the center
  in the opposite direction
  , and at the same time, the cutter rotates around its own origin
  with an angular velocity of
  in a self-rotating circular motion. The motion schematic diagram is shown in Fig. 6b.
Fig. 6.

The cutter and bacteria interact with each other (a) Motion of the golden needle mushroom relative to the cutter plate (b) Movement of the cutter plate relative to the golden needle mushrooms. The dashed area indicates the area of the rotary cutter cutting area; the light yellow shaded area indicates the area of the mushroom area;  is the angular velocity of the center of the cutter disk around
  ;
;  s the linear velocity of the cutter disk with respect to the mushroom;
  and
and  are the locations of the mushroom center of the circle;
  and
and  are the locations of the cutter disk center of the circle.
Therefore, We can get Eq. (6):
 |
6 |
where,  .
.
Motion trajectory displacement modeling
The analysis of the rotary cutter movement process is shown in Fig. 7.
Fig. 7.
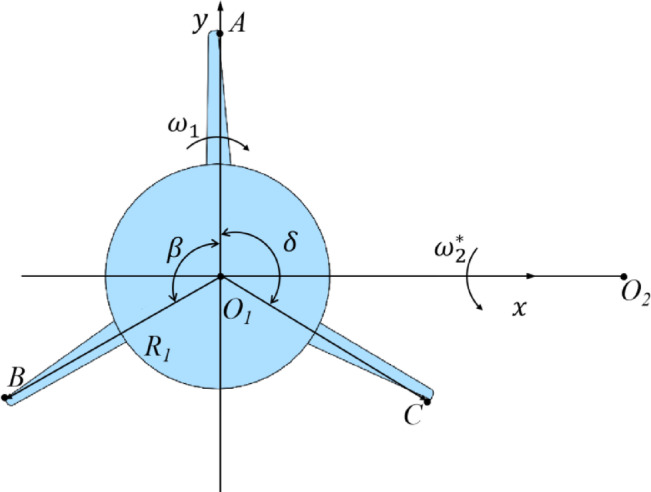
Cutting motion analysis of rotary cutter.
Let the position shown in Fig. 7 be the initial moment position. Then the motion equations of the outer end points A, B and C of the three blades are respectively:
 |
7 |
 |
8 |
 |
9 |
The cutting speed ratio  is a key dynamic parameter influencing the cutting process. Its magnitude determines the number of interactions between the cutting tool and the mushroom stem, as well as the undeformed chip thickness per cutting engagement, thereby significantly affecting cutting efficiency and cutting quality—particularly in terms of compression-induced damage. Based on the following analysis, the
  is adopted as a critical indicator for evaluating cutting performance. By examining the interaction trajectories between the cutter and golden needle mushroom at various
  values, the optimal operating speed is determined.
Effect on Cutting Efficiency: The  —defined as the ratio of the cutter disk rotational speed to the turntable feed rotational speed—directly governs the relative cutting speed. A higher
  generally results in a shorter cutting duration per mushroom cluster, which contributes to improved processing efficiency.
Effect on Cutting Quality: The  significantly influences both the number of tool-stem interactions and the effective cutting area per engagement. If the
  is too low, there may be insufficient cutting events, leading to incomplete separation or excessive material deformation due to prolonged compression. Conversely, if the
  is too high, although the contact time is reduced, it may lead to redundant cutting passes or localized stress concentration, potentially damaging the fragile hyphal structure.
Therefore, selecting an appropriate  is essential for achieving both high cutting efficiency and high-quality results, ensuring clean cuts with minimal tissue damage and optimal surface integrity.
The initial motor speed range is set as:  =800 to 1400 r/min, and the disc speed range is set as:
  = 6–12 r/min. That is,
  = 66–233. Two cases, where
  = 66 and
  233, are selected for analysis.
(1) When  =66
=66
At this time, the motion trajectories of cutters A, B and C are shown in Fig. 8. It can be seen that the number of interactions between each cutter and the mushroom body is 2 to 3 times.
Fig. 8.

The cutter motion path when  = 66.
= 66.
After the motion trajectories of the three cutters are coupled, as shown in Fig. 9. It can be seen that for the golden needle mushroom to be completely cut, the cutter needs to interact with the mushroom body 8 times, and the interacting area first increases and then decreases.
Fig. 9.

The cutting process when  ratio is 66.
(2) When  =233
=233
At this time, the motion trajectories of cutters A, B and C are shown in Fig. 10. It can be seen that each cutter interacts with the mushroom body 8 to 9 times.
Fig. 10.

The cutter motion path when  = 233.
After the motion trajectories of the three cutters are coupled, as shown in Fig. 11. It can be seen that for the golden needle mushroom to be completely cut, the cutter needs to interact with the mushroom body 26 times. The area of each interaction region is greatly reduced compared with the case when  = 66, but the interacting area still firstly increases and subsequently decreases.
Fig. 11.
The cutting process when  ratio is 233.
From the above analysis, it can be concluded that the larger the ratio  is, the more times the cutter interacts with the mushroom body.
Since the motor directly drives the blade to rotate at a high speed25, the cutting force of the cutter is:
 |
10 |
where, F represents the cutting force of the cutter;  represents the linear velocity of the cutter; P represents the motor power.
It can be seen that the rotational speed of the cutter disc is inversely proportional to the cutting force.
Considering that the golden needle mushroom itself is a flexible body, a low-speed rotating cutter will exert obvious pressure on the mushroom body, which can easily damage the mushroom body tissue and result in an unsatisfactory cutting effect. Therefore, the cutter disc needs to rotate at a high speed, that is, the larger the value of  , the better. As can be seen from Eq. (10), the larger the
  is, the smaller the F will be, which is more energy-saving and consumption-reducing.
Therefore, the optimal value of  = 233 is selected for this device.
Rotary cutter design
Based on common cutter parameters26,27 and considering that an overly small cutter blade angle is likely to cause blade chipping, which in turn affects the cutting efficiency28,29, a slitting cutter with a blunting plane as shown in Fig. 12 is designed.
Fig. 12.

Preliminary rotary cutter design.
Among the aforementioned parameters, the sliding cutting angle and the edge angle (or wedge angle) are the two most critical geometric factors influencing cutting performance.
Sliding Cutting Angle (α in Fig. 12): This is defined as the angle between the cutting edge line and the radial direction of the tool. Its working principle lies in enabling the cutting edge to engage the mushroom stem with a sliding motion rather than a direct perpendicular impact. This sliding action effectively reduces the initial cutting resistance and guides the blade to smoothly “slide into” and sever the hyphal bundle, minimizing compressive deformation. As a result, this mechanism significantly improves cut surface flatness and reduces tissue damage.
Edge Angle (β in Fig. 12): This refers to the included angle formed by the two beveled surfaces of the cutting edge. It governs the trade-off between blade sharpness and edge strength. A smaller edge angle produces a sharper blade with lower cutting resistance, facilitating easier penetration; however, it compromises edge durability and increases the risk of chipping or blunting. Conversely, a larger edge angle enhances the mechanical strength and wear resistance of the cutting edge, but at the cost of higher cutting forces. Therefore, an optimal edge angle must be carefully selected by balancing the mechanical properties of the enoki mushroom—specifically its high flexibility and fragility—with the need for both cutting efficiency and tool longevity.
The synergistic optimization of these two geometric parameters is essential for achieving high-precision, low-damage cutting in the context of delicate, high-moisture biological materials such as golden needle mushroom.
The preliminary design parameters are as follows: cutter width of 20 mm; cutter length of 160 mm; slitting angle of 20° − 32°; blade edge angle of 15° − 45°; blade thickness of 1–5 mm; blunting plane length of 0.3 mm and an angle of 60°; blade material being white steel.
Simulation optimization experiment
Experimental design for cutter parameter optimization
Simulation modeling and parameter setting
Golden needle mushrooms are cluster-growing plants. In previous simulation modeling of such plants, they were often regarded as a vague large cylindrical entity30,31, ignoring the mutual independence of hyphae. Based on the measured average golden needle mushroom body diameter and the diameter of individual golden needle mushrooms, this study establishes a two-dimensional planar coordinate model for an entire cluster of golden needle mushrooms within the sketch drawing interface of SolidWorks. This is achieved through coordinate parameterization, using the diameter of a single golden needle mushroom as the unit of measurement, as illustrated in Fig. 13. Among them, the diameter of a single golden needle mushroom is 2.14 mm, there are 1377 mushrooms in a cluster, and the diameter of the whole cluster of golden needle mushrooms is 92.45 mm.
Fig. 13.
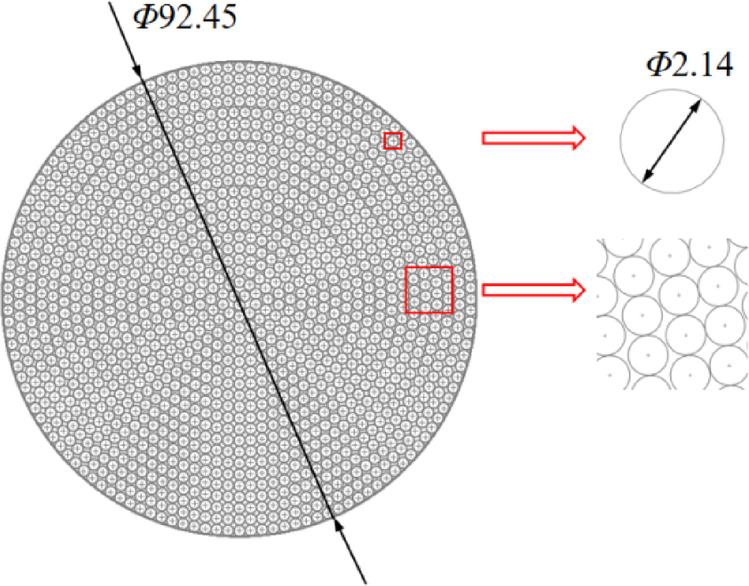
Establishment of coordinate parameter model of golden needle mushroom.
Using the EDEM (Discrete Element Method) simulation software, a discrete element model of golden needle mushroom was established, along with a simulation model of the rotary cutting process. EDEM is a particle mechanics simulation software based on the discrete element method, widely used in agricultural engineering, mining, pharmaceuticals, and other fields to simulate the behavior of particle groups and their interactions with machinery.
To ensure that the simulation outputs (cutting force, power consumption) reflect the actual tissue fracture mechanism of golden needle mushroom, rather than merely the contact mechanics between particles, the EDEM model in this study introduced a key core setting—the Bonding Model. The principle of this model is as follows: a single enoki mushroom stem is simulated as a cylinder composed of multiple spherical particles connected by “bonds”. Each bond is assigned a set of strength parameters (critical normal stress and critical tangential stress). In the elastic phase, when the tool acts on the stem, the generated stress is transmitted through the bonds between particles. Before the stress is lower than the critical strength, the bond undergoes elastic deformation, and this phase realistically simulates the elastic mechanical behavior of the stem. In the fracture phase, when the stress applied by the tool exceeds the critical strength of the bond, the bond breaks and the particles separate. This process directly simulates the microscopic fracture failure mechanism of enoki mushroom tissue.
In the discrete element simulation of this study, the following key assumptions were made regarding the mechanical properties and behavior of enoki mushroom stems, which are based on a trade-off between physical reality and computational efficiency:
Constitutive model assumption: A linear elastic-brittle fracture model was adopted. This assumption holds that in the elastic phase, before the stress reaches the critical value, the bonds between stem particles exhibit linear elastic behavior (defined by normal/tangential contact stiffness); in the fracture behavior, when the stress exceeds the set critical normal/tangential stress (see Table 1), the bond undergoes instantaneous and complete fracture, and the particles separate accordingly. This assumption simplifies the real, possibly existing complex fracture process of golden needle mushroom involving plastic deformation and partial tearing, but captures the main characteristics of macroscopic brittle fracture.
Table 1.
Parameter setting of golden needle mushroom discrete element simulation.
| Parameters | Value |
|---|---|
| Poisson’s ratio for golden needle mushrooms | 0.2996 |
| White steel cutter Poisson’s ratio | 0.3 |
| golden needle mushroom shear modulus/Pa | 9.59 × 10⁶ |
| White steel cutter shear modulus/Pa | 7 × 10¹⁰ |
| Density of golden needle mushrooms/(kg-m-3) | 772.97 |
| Density of white steel knives/(kg-m-3) | 7850 |
| golden needle mushroom - golden needle mushroom Collision Recovery Coefficient | 0.513 |
| Golden Needle-White Steel cutter Collision Recovery Coefficient | 0.38 |
| golden needle mushroom - Coefficient of static friction of golden needle mushroom | 0.198 |
| Coefficient of static friction of gold-needle mushroom-white steel cutter | 0.82 |
| Agaricus blazei - Agaricus blazei coefficient of kinetic friction | 0.072 |
| Coefficient of kinetic friction of gold-needle mushroom-white steel cutter | 0.002 |
| Normal contact stiffness/N-m-1 | 3.70 × 10⁸ |
| Tangential contact stiffness/N-m-1 | 2.51 × 10⁸ |
| Critical normal stress/Pa | 9.0 × 10⁶ |
| Critical tangential stress/Pa | 9.0 × 10⁶ |
Homogenization assumption: The entire cluster of golden needle mushroom is regarded as an assembly of spherical particles bonded together with identical mechanical parameters. This assumption ignores the mechanical gradient changes along individual stems from cap to base and the differences in mechanical properties between stems.
Isotropy assumption: It is assumed that the mechanical properties of the material are the same in all directions, ignoring the anisotropy of the fibrous structure of golden needle mushroom (such as differences in mechanical properties between longitudinal and transverse directions).
The impact of these assumptions on result accuracy is mainly reflected in the following: cutting force peak prediction—the model can well predict the trend and peak of macro cutting force, because the peak force is mainly determined by overcoming the maximum bond strength (i.e., critical stress). This is the core indicator of concern in this study, so the simplified model is effective; fracture process details—the model cannot accurately simulate the progressive damage details such as micro-tearing and fiber pulling during the cutting process. However, since this study focuses on the overall cutting performance of the device (force, power consumption) rather than the material damage mechanism, this simplification is acceptable.
Within the SolidWorks software environment, the model of the rotary cutter-type device for cutting the roots of golden needle mushrooms is simplified. This simplification retains only the components that come into direct contact with the mushrooms: namely, the turntable, the fixture, and the rotary cutter. After creating the geometric assembly model, the file is saved as an STL (*.stl) file format and imported into the Geometries module of the EDEM discrete element simulation software. The established discrete element simulation model of golden needle mushrooms is set within the fixture through the particle factory. At the same time, rotational drives are added at the center of the turntable and the center of the cutter disc respectively, enabling them to rotate around their respective centers in a circular motion. Their movement speeds can be adjusted according to the experimental design. The simulation process model is shown in Fig. 14. The simulation parameters are set according to the calibration results, and the specific values are shown in Table 1.
Fig. 14.

Establishment of discrete element cutting root model.
Design of simulation test
Using EDEM software to simulate the cutting of golden needle mushrooms in order to reveal their force rules. Based on the BoxBehnken principle and the positional relationship analyzed previously, an experiment was designed, taking the maximum cutting force  of the first cut as the evaluation index and the geometric parameters of the cutter (including the slitting angle J of the cutter, the blade angle K of the cutter, and the thickness
  of the cutter) as influencing factors.
EDEM software was utilized to simulate the cutting process of golden needle mushrooms, aiming to reveal the underlying force rules. Based on the Box-Behnken design principle and the positional relationships analyzed previously, an experimental design was developed. The maximum cutting force  during the first cut was selected as the evaluation index, while the geometric parameters of the cutter—including the slitting angle J, the blade angle K, and the thickness
  —were considered as influencing factors. The coding of each factor is shown in Table 2.
Table 2.
Cutter optimization simulation test factor horizontal coding.
| Horizontal coding | Slip angle 
|
Edge angle 
|
Thicknesses  /mm /mm |
|---|---|---|---|
| −1 | 20 | 15 | 1 |
| 0 | 26 | 30 | 3 |
| 1 | 32 | 45 | 5 |
Analysis of experimental results of cutter parameter optimization experiment
The simulation test results of cutter parameter optimization are shown in Table 3.
Table 3.
Cutter simulation test scheme and results.
| Serial number |

|

|
 /mm /mm |
 /N /N
|
|---|---|---|---|---|
| 1 | 20 | 15 | 3 | 109.8 |
| 2 | 32 | 15 | 3 | 96.4 |
| 3 | 20 | 45 | 3 | 146.2 |
| 4 | 32 | 45 | 3 | 94.8 |
| 5 | 20 | 30 | 1 | 133.4 |
| 6 | 32 | 30 | 1 | 110.4 |
| 7 | 20 | 30 | 5 | 152.3 |
| 8 | 32 | 30 | 5 | 91.7 |
| 9 | 26 | 15 | 1 | 69.9 |
| 10 | 26 | 45 | 1 | 92.1 |
| 11 | 26 | 15 | 5 | 91.7 |
| 12 | 26 | 45 | 5 | 89.5 |
| 13 | 26 | 30 | 3 | 102.5 |
| 14 | 26 | 30 | 3 | 101.6 |
| 15 | 26 | 30 | 3 | 107.7 |
| 16 | 26 | 30 | 3 | 87.0 |
| 17 | 26 | 30 | 3 | 99.4 |
Multiple regression fitting of the test results was performed using Design-Expert 13 software. The analysis revealed that the coefficient of determination  for the regression equation is 95.18%, indicating a strong fit between the model and the observed data. The simulation of the cutting process of golden needle mushrooms closely mirrors real-world conditions, demonstrating that the shearing process can be effectively modeled using the discrete element method. The regression model equation describing the cutting force
  is presented in Eq. (11).
 |
11 |
A variance analysis was conducted on the aforementioned models, with the results presented in Table 4.
Table 4.
Regression model analysis of variance.
| Source | Square sum | Degrees of freedom | Mean square | F-value | P-value |
|---|---|---|---|---|---|
| Model | 6986.55 | 9 | 776.28 | 15.37 | <0.01** |
| J | 2752.82 | 1 | 2752.82 | 54.51 | <0.01** |
| K | 375.38 | 1 | 375.38 | 7.43 | 0.0295* |
| h1 | 47.05 | 1 | 47.05 | 0.9316 | 0.3666 |
| JK | 361.00 | 1 | 361.00 | 7.15 | 0.0318* |

|
353.44 | 1 | 353.44 | 7.00 | 0.0332* |
| Kh1 | 148.84 | 1 | 148.84 | 2.95 | 0.1297 |

|
2456.49 | 1 | 2456.49 | 48.65 | <0.01** |
| K2 | 605.81 | 1 | 605.81 | 12.00 | 0.0105* |

|
14.33 | 1 | 14.33 | 0.2838 | 0.6107 |
| Residual | 353.50 | 7 | 50.50 | ||
| Lost proposal | 116.69 | 3 | 38.90 | 0.6570 | 0.6198 |
| Pure error | 236.81 | 4 | 59.20 | ||
| Total | 7340.05 | 16 |
** indicates highly significant (P<0.01), * indicates significant (P<0.05).
As shown in Table 5, the P-values of the cutting force model in the regression model is less than 0.01, indicating that the overall model is extremely significant. The results show that the P-values of the lack-of-fit item is greater than 0.05, indicating a good fit of the model. This model can well explain the relationship between the cutting force value and the slitting angle, blade angle, and thickness during the simulation cutting process. The P-values of the square terms of J and J is less than 0.01, indicating an extremely significant impact on the results; the P-values of the square terms of K, JK,  and K are all less than 0.05, indicating a significant impact on the results; the P-values of the remaining factors are greater than 0.05, indicating no significant impact on the results. Based on the F-values of the regression model, the significance order of each factor’s influence on the cutting force of golden needle mushrooms is as follows:
  .
.
Table 5.
Simulation verification test.
| Maximum values | Minimum value | Standard deviation | Coefficient of variation | Average value | |
|---|---|---|---|---|---|
| Simulated cutting force verification value/N | 85.1 | 79.1 | 2.83 | 0.03 | 82.2 |
The influence of the interaction between each factor on the results derived from the regression equation is illustrated in Fig. 15.
Fig. 15.

cutter parameter interactive response surface diagram (a)Slip tangent angle interacts with edge angle (b) Slip tangent angle interacts with thickness (c) Edge angle interacts with thickness.
As shown in Fig. 15a, when the blade angle K of the cutter is fixed, the cutting force  exhibits a parabolic trend that initially decreases and then increases with an increase in the slitting angle J, forming an upward-opening parabola. Specifically, as the slitting angle J reaches a certain value, the cutting force
  reaches its minimum; beyond this point, the cutting force increases again. Conversely, when the slitting angle J is fixed, the cutting force
  initially increases with an increase in the blade angle K, followed by a gradual decrease.
As shown in Fig. 15b, when the slitting angle J is fixed, the cutting force  shows an approximately linear trend with an increase of the thickness
  . However, the change in the cutting force
  remains relatively gentle, indicating a smaller impact of thickness on the cutting force. Conversely, when the thickness
  is fixed, the cutting force
  initially decreases and then gradually increases as the slitting angle J increases.
As shown in Fig. 15c, when the blade angle K is fixed, the cutting force  increases slightly with an increase in the thickness
  , though the change is not significant. Conversely, when the thickness
  is fixed, the cutting force
  initially shows a relatively obvious increasing trend with an increase in the blade angle K, and then stabilizes.
In summary, the slitting angle J and the blade angle K of the cutter have a greater impact on the cutting force  , while the thickness
  of the cutter has a relatively small impact on the results. When the slitting angle J is large and the blade angle K is small, the cutter exhibits a flat and sharp profile, resulting in an improved cutting-in effect and consequently reducing the cutting force.
In order to explore the optimal cutter structure parameters and achieve the minimum cutting force for golden needle mushroom roots, Design-Expert 13 software was utilized to perform optimization analysis on the regression model. The objective was set to minimize the response value, resulting in the following optimal parameter combination: slitting angle of the cutter J= 26°, blade angle of the cutter K= 15°, and thickness of the cutter  = 2 mm. At this setting, the predicted cutting force is 80.87 N. Simulation verification was conducted using these predicted parameters, with the experiment repeated 25 times. The simulation results are summarized in Table 5. The measured cutting force was found to be 82.2 N, with a relative error of 1.64% compared to the predicted value. This error falls within acceptable engineering limits, indicating that the mathematical regression model is accurate and reliable
Optimization analysis of operating condition parameters
Experimental design for simulated working conditions
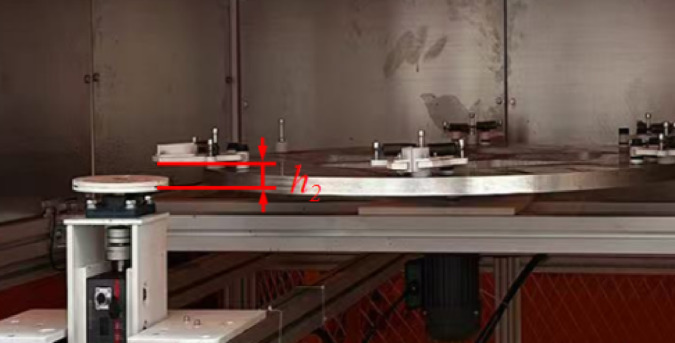
In this study, “enoki mushroom cutting height” is a key operational parameter, defined as the vertical distance between the cutting trajectory plane of the tool and the fixture positioning surface on the conveying turntable, as shown in Fig. 16. This parameter directly determines the length of the portion to be removed, thereby affecting cutting resistance and power consumption. Different cutting height settings can be achieved by adjusting the overall vertical position of the rotary cutter disk assembly.
Fig. 16.
Schematic diagram of enoki mushroom cutting height.
The main working condition parameters in the cutting process are the cutting speed  of the cutter, the feeding speed
  of the turntable, and the cutting height
  of the golden needle mushroom body. Using the minimum specific cutting power consumption
  during the cutting process as the test index, a three-factor and three-level orthogonal experiment was conducted to analyze its impact on the actual working condition. This analysis aims to explore the optimal combination of factors that results in the lowest specific cutting power consumption per unit area.
In this study, “specific cutting energy per unit area for a single blade” is a key indicator for evaluating cutting energy efficiency. Its physical meaning is the energy consumed by the rotary cutter disk blade to cut a unit area of the enoki mushroom base. The calculation of this indicator is based on the average power consumption measured during the cutting process of a single blade in simulation or experiments, taking into account the total cross-sectional area of the enoki mushroom being cut. Its defining equation is as follows:
 |
12 |
where:
Ps — specific cutting energy per unit area (J).
P — average power consumed to overcome cutting resistance (W).
A — cross-sectional area of the enoki mushroom being cut (mm²).
The factor level coding settings for the working condition optimization simulation test are shown in Table 6.
Table 6.
Condition optimization simulation test factor horizontal coding.
| Horizontal coding | Cutting speed  /(r/min) /(r/min) |
Feed rate  /(r/min) /(r/min) |
Cutting height  /mm /mm |
|---|---|---|---|
| −1 | 800 | 6 | 15 |
| 0 | 1100 | 9 | 20 |
| 1 | 1400 | 12 | 25 |
Analysis of multi - factor experimental results
The test scheme and results are shown in Table 7.
Table 7.
Working condition simulation test scheme and results.
| Serial number |
 /(r/min) /(r/min) |
 /(r/min) /(r/min) |
 /mm /mm |
 /J /J |
|---|---|---|---|---|
| 1 | 800 | 6 | 20 | 25.532 |
| 2 | 1400 | 6 | 20 | 21.632 |
| 3 | 800 | 12 | 20 | 39.804 |
| 4 | 1400 | 12 | 20 | 33.384 |
| 5 | 800 | 9 | 15 | 27.836 |
| 6 | 1400 | 9 | 15 | 26.32 |
| 7 | 800 | 9 | 25 | 36.592 |
| 8 | 1400 | 9 | 25 | 25.036 |
| 9 | 1100 | 6 | 15 | 25.896 |
| 10 | 1100 | 12 | 15 | 37.788 |
| 11 | 1100 | 6 | 25 | 23.852 |
| 12 | 1100 | 12 | 25 | 36.748 |
| 13 | 1100 | 9 | 20 | 32.74 |
| 14 | 1100 | 9 | 20 | 32.672 |
| 15 | 1100 | 9 | 20 | 34.668 |
| 16 | 1100 | 9 | 20 | 29.532 |
| 17 | 1100 | 9 | 20 | 30.872 |
Through the Design-Expert 13 software, multiple regression fitting is carried out on the experimental results. The results show that the coefficient of determination  of the regression equation is 93.58%. It can be seen that the simulation of the working conditions is close to the real situation, indicating that the cutting process of golden needle mushrooms under different working conditions can be simulated by the discrete element method. The regression equation of the specific cutting power consumption per unit area
  is:
is:
Using Design-Expert 13 software, multiple regression fitting was performed on the test results. The analysis revealed that the coefficient of determination  of the regression equation is 93.58%. This indicates that the simulation of the working conditions closely approximates real-world scenarios, demonstrating that the cutting process of golden needle mushrooms under different operating conditions can be effectively modeled using the discrete element method. The regression equation of cutting power per unit area is shown in Eq. (13)
 |
13 |
Variance analysis was performed on the above models, as shown in Table 8.
Table 8.
Regression model analysis of variance.
| Source | Square sum | Degrees of freedom | Mean square | F-value | P-value |
|---|---|---|---|---|---|
| Model | 444.63 | 9 | 49.40 | 11.34 | <0.01** |

|
68.40 | 1 | 68.40 | 15.70 | <0.01** |

|
322.73 | 1 | 322.73 | 74.07 | <0.01** |

|
2.41 | 1 | 2.41 | 0.5524 | 0.4815 |

|
1.59 | 1 | 1.59 | 0.3644 | 0.5651 |

|
25.20 | 1 | 25.20 | 5.78 | 0.0471* |

|
0.2520 | 1 | 0.2520 | 0.0578 | 0.8168 |

|
17.99 | 1 | 17.99 | 4.13 | 0.0817 |

|
0.0142 | 1 | 0.0142 | 0.0033 | 0.9561 |

|
4.95 | 1 | 4.95 | 1.14 | 0.3220 |
| Residual | 30.50 | 7 | 4.36 | ||
| Lost proposal | 15.07 | 3 | 5.02 | 1.30 | 0.3893 |
| Pure error | 15.43 | 4 | 3.86 | ||
| Total | 475.13 | 16 |
** indicates highly significant (P<0.01), * indicates significant (P<0.05).
As shown in Table 8, the P-values of the cutting force model in the regression model is less than 0.01, indicating that the overall model is extremely significant. The results show that the P-values of the lack-of-fit item is greater than 0.05, indicating that the model fits well. This model can well explain the relationship between different working condition parameters and the specific cutting power consumption per unit area. The P-values of  and
and  is less than 0.01, indicating an extremely significant impact on the results; the P-value of
  is less than 0.05, indicating a significant impact on the results; the P-value of the remaining factors is greater than 0.05, indicating no significant impact on the results. Based on the F-value of the regression model, the significance order of each working condition factor’s impact on the specific cutting power consumption per unit area is as follows:
  .
.
The influence of the interaction of each factor on the results obtained from the regression equation is shown in Fig. 17.
Fig. 17.

Interactive response surface diagram of working condition parameters (a) Cutting speed interacts with feed rate (b) Cutting speed interacts with cutting height (c) Feed rate interacts with cutting height.
As shown in Fig. 17a, when the feed speed  remains constant, the specific cutting power consumption per unit area
  exhibits a gradual increase with the rise in cutting speed
  . Conversely, when the cutting speed
  is fixed, the specific cutting power consumption per unit area
  varies significantly with the increase in feed speed
  . Given that the trend of
  increasing with
  is steeper than that with
  ,
,  exerts a more pronounced influence on
  . This observation aligns with the fact that the mean square of
  is greater than that of
  in the analysis of variance table. As shown in Fig. 17b, when the cutting height
  is held constant, the specific cutting power consumption per unit area
  increases steadily with the increase of the cutting speed
  . In contrast, when the cutting speed
  is fixed, the specific cutting power consumption per unit area
  increases more significantly with the increase of the cutting height
  . As shown in Fig. 17c, when the cutting height
  remains unchanged, the specific cutting power consumption per unit area
  increases sharply and steeply with the increase of the feed speed
  . When the feed speed
  remains unchanged, the specific cutting power consumption per unit area
  remains essentially unchanged with the change of the cutting height
  .
.
Using Design-Expert 13 software, an optimization analysis was conducted on the regression model with the objective of minimizing the response value. The optimal combination of working condition parameters is as follows: cutter cutting speed  = 1400 r/min, turntable feeding speed
  = 6 r/min, and cutting height
  of the mushroom body = 20 mm. At this setting, the predicted specific cutting power consumption per unit area for a single cutter is 23.87 J. Simulation verification was performed using these predicted parameters, resulting in a measured specific cutting power consumption per unit area for a single cutter of 22.24 J. The relative error between the measured value and the predicted value is 6.83%, which meets engineering requirements. This confirms that the mathematical regression model is accurate and reliable
Analysis of single - factor experimental results
To determine the influence of individual factors on the cutting power consumption per unit area, the levels of the remaining factors were set to 0, as shown in Fig. 18. Within the specified range of each parameter, as the cutting speed  , feeding speed
  , and cutting height
  increase, the cutting power consumption per unit area decreases, increases, and remains essentially unchanged, respectively. Specifically, a higher cutting speed leads to lower power consumption, while a smaller feeding speed results in lower cutting power. Since the trend of power consumption per unit area with an increase in feeding speed is steeper than that with an increase in cutting speed,
  has a more significant impact on the cutting power consumption per unit area. This observation aligns with the analysis of variance table, which shows that
  has a greater mean square value compared to
  .
.
Fig. 18.

Single factor influence diagram of working condition parameters (a)Single-factor graph of cutting speed (b) Single-factor graph of feed speed (c) Single-factor graph of cutting height.
Design of bench experiment
To further verify the reliability of the simulation results, a rotary cutter was manufactured with the optimized parameters, as shown in Fig. 19a. The slitting angle, blade angle, and thickness of the cutter are 26°, 15°, and 2 mm, respectively. At the same time, a comparative verification test was carried out between the new slitting angle cutter and the ordinary flat-blade cutter (as shown in Fig. 19b).
Fig. 19.

Comparison of old and new cutters.
Rotary cutter cutting force verification test
It is worth noting that the cutting force verification experiment in Sect. 4.1 is primarily aimed at verifying the reliability of the optimization results from Chap. 3 based on EDEM simulation, and at comparing the new tool with the traditional tool.
Regarding the theoretical cutting force model in Sect. 3.2, as shown in Eq. (10), its primary purpose is to theoretically and qualitatively reveal the inverse relationship among cutting force, motor power, and tool linear velocity, thereby providing a theoretical basis for selecting a high-speed cutting strategy, rather than enabling precise quantitative prediction.
The force measurement device is illustrated in Fig. 20. A pressure sensor is mounted at the rear end of the force-measuring support block. Based on Newton’s third law of motion (action-reaction principle), the pressure value detected by the sensor can be approximately considered as the cutting force exerted on the golden needle mushroom. Comparative experiments were carried out using the new slitting angle cutter designed in this study and the ordinary flat-blade rotary cutter respectively. The experiment was repeated 25 times.
Fig. 20.

Rotary shear force measuring platform.
The results are shown in Table 9. It can be observed from the results that to complete the cutting task, the cutting force required by the new slitting angle cutter is 88.5 N. The relative error compared with the simulation value of 82.2 N is 7.1%, and this error meets engineering requirements. At the same time, compared to a conventional flat-blade rotary cutter, the cutting force required by the new slitting angle cutter is reduced by 39.4%, indicating significant energy savings and reduced consumption.
Table 9.
Results of cutting force comparison test.
| Maximum values | Minimum value | Standard deviation | Coefficient of variation | Average value | |
|---|---|---|---|---|---|
| Cutting force required for a normal flat cutter/N | 149.2 | 142.2 | 2.91 | 0.02 | 146.2 |
| Cutting force required for new slip angle cutter/N | 91.7 | 86.2 | 2.39 | 0.02 | 88.5 |
Verification test of working condition optimization
Based on the original force measurement platform, a turntable and fixture assembly were constructed as shown in Fig. 21.
Fig. 21.

Working condition power test platform.
A high-precision torque sensor (Model: DYN-200, Range: 10 N·m, Accuracy: ±0.1% F.S.) and a speed sensor are installed at the driving end of the cutter spindle. The torque sensor directly measures the real-time torque M (unit: N·m) required for the cutter disk to overcome resistance during the cutting process, while the speed sensor synchronously measures the actual rotational speed n of the cutter disk (unit: r/min). The cutting power P (unit: W) is calculated from the measured torque M and angular velocity ω, using the following formula:
 |
14 |
Similarly, the specific cutting energy per unit area is calculated using Eq. (14).
According to the results of the working condition simulation optimization, the cutting speed of the cutter disc was adjusted to 1400 r/min, the feed rate of the turntable was set to 6 r/min, and the cutter disc was positioned for cutting at a height of 20 mm. Comparative experiments were also conducted under these optimized conditions. The experiment was repeated 25 times to ensure reliability of the results.
The results are shown in Table 10. It can be observed from the results that the average actual power consumption per unit area of the new slitting angle cutter to complete the work is 21.92 J. The test results are largely consistent with the simulation predictions. Under these working conditions, the cutting performance and operational efficiency meet the design requirements. Additionally, compared to a conventional flat-blade rotary cutter, the new slitting angle cutter reduces the cutting power consumption by 24.5%, indicating significant energy savings.
Table 10.
Results of cutting power comparison test.
| Maximum values | Minimum value | Standard deviation | Coefficient of variation | Average value | |
|---|---|---|---|---|---|
| The average cutting power consumption per unit area required by ordinary flat-edge cutting tools/J | 29.8 | 27.92 | 2.18 | 0.03 | 29.02 |
| The average cutting power consumption per unit area required by the new type of sliding Angle cutting tool/J | 22.44 | 21.4 | 1.16 | 0.02 | 21.92 |
Comparison test of tool cutting performance
Figure 22 shows a comparison of the cutting effects. Specifically, Fig. 22a displays the golden needle mushroom before cutting, Fig. 22b illustrates the cutting effect using a conventional flat-blade cutter, and Fig. 22c presents the cutting effect using the new slitting angle cutter. The height difference between the lowest and highest points on the cutting plane after processing is defined as the unevenness  . As can be observed from the comparison between Fig. 22b,c, the unevenness
  is significantly greater than
  , indicating that the cutting performance of the new slitting angle cutter is markedly superior to that of the conventional flat-blade cutter
Fig. 22.

Comparison of golden needle mushroom mushrooms before and after bench cutting.
In conclusion, the experimental analysis of cutting force, cutting power consumption, and cutting effect comprehensively validates the effectiveness of the new slitting angle cutter designed in this study.
Comparative tests of different parameters of the new sliding-cutting tool
Based on the newly developed sliding-cutting tool under study, the influencing factor in this experiment is the shape of the blade tip, as shown in the Fig. 23.
Fig. 23.

Different parameter sliding-cutting angle tools.
Figure 24a and b show the relationship between different blade tip shapes and the enoki mushroom harvesting rate and damage rate, respectively. It can be seen that, under the same cutting conditions, tool a has the lowest harvesting rate (96.51%) and the highest damage rate (4.75%), tool b has a harvesting rate of 97.46% and a damage rate of 4.41%, while tool c achieves the highest harvesting rate (97.83%) and the lowest damage rate (3.96%). The main reason for the differences in harvesting and damage rates is the difference in the edge radius at the sliding-cutting portion of the blade tip. A larger edge radius results in higher harvesting efficiency and lower damage rate.
Fig. 24.

Relationship of cutting effects for sliding-cutting tools with different parameters.
As shown in the Fig. 25, the cutting quality of tools a, b, and c is represented, with the quality increasing in sequence from tool a to tool c.
Fig. 25.

Cutting quality of sliding-cutting tools with different parameters.
Conclusions
This study addresses the current challenges of poor harvesting performance, unsatisfactory cutting results, and high energy consumption associated with existing golden needle mushroom harvesting machines. It introduces the design of a high-speed rotary blade device for cutting the roots of golden needle mushroom, featuring a novel sliding-cut angle tool. The structural configuration of the device is defined, and theoretical analyses are conducted on its key components to establish the value ranges for the structural parameters.
The golden needle mushroom and the root-cutting device are modeled in the EDEM discrete element simulation software. Through the response surface analysis method, the structural parameters of the cutter and the working condition parameters of the device are optimized by simulation successively. The optimal combination of the cutter structural parameters is obtained as follows: the slitting angle of the cutter is 26°, the blade angle of the cutter is 15°, and the thickness of the cutter is 2 mm; the optimal combination of the working condition parameters is as follows: the cutting speed is 1400 r/min, the feeding speed is 6 r/min, and the cutting height is 20 mm.
A bench comparison test is carried out under the optimized parameters. The performance of the newly designed slitting cutter is compared with that of an ordinary flat-blade rotating cutter. The results show that the cutting force and the specific cutting power consumption required by the new slitting cutter are reduced by 39.4% and 24.5% respectively. The cutting flatness is significantly improved, and the cutting effect and working efficiency of the cutting device basically meet the design requirements.
Discussion and outlook
This study primarily focuses on the design, simulation-based optimization, and bench testing of a rotary cutting device for root removal. As pointed out by the reviewers, given the high operating speed of the cutter disk (up to 1400 r/min), long-term reliability, maintenance requirements, and tool wear are critical issues that must be addressed in future practical applications. Although this study does not include in-depth life testing, the following aspects have been considered during the design phase:
Wear resistance design
The rotary cutting blades are made of white steel (high-speed tool steel), which is known for its high hardness, excellent wear resistance, and good hot hardness. This material effectively resists abrasive wear caused by enoki mushroom fibers.
Maintainability design
The cutter disk adopts a modular design. The tools are mounted with standard fasteners, enabling quick disassembly, replacement, or re-sharpening, significantly reducing maintenance difficulty and time cost.
Potential wear analysis
The primary wear mechanism is expected to be abrasive wear at the cutting edge. Wear will lead to an increase in edge radius and changes in the sliding-cutting angle and edge angle, resulting in a gradual rise in cutting force and power consumption. Ultimately, this will manifest as degraded cut quality (increased surface roughness). Monitoring cutting force can serve as an indirect indicator for early warning of tool wear.
Outlook
In future work, dedicated studies will be conducted on tool wear mechanisms and service life. A mapping relationship between cutting force/power consumption and tool wear amount will be established to provide a theoretical basis for predictive maintenance. Furthermore, tool materials and surface treatment processes (e.g., coating technologies) will be optimized to enhance the economic efficiency and reliability of the device.
Author contributions
Limin Xie: Investigation, Methodology, Software, Validation, Visualization, Writing – original draft. Yuxuan Gao: Investigation, Methodology, Software, Validation, Visualization, Writing – original draft. Zhiqiang Lin: Formal analysis, Validation, Visualization, Writing – review & editing. Feifan He: Formal analysis, Validation, Visualization, Writing – review & editing.Wenxin Duan: Formal analysis, Validation,, Writing – review & editing. Dapeng Ye: Formal analysis, Project administration, Supervision, Visualization, Writing – review & editing.
Funding
(1) Natural Science Foundation of Fujian Province (KJB23066XA), (2) Major special projects of Fujian Province (2021NZ0101), (3) Fujian Province Forestry Science and Technology Research Project (2023FKJ01).
Data availability
The datasets used and analysed during the current study available from the corresponding author on reasonable request.
Declarations
Competing interests
The authors declare no competing interests.
Footnotes
Publisher’s note
Springer Nature remains neutral with regard to jurisdictional claims in published maps and institutional affiliations.
References
- 1.Bai, L. Essential summary of edibleness and commercial production of golden mushroom. Agricultural Science&Technology Equip.4, 60–61 (2017). (in Chinese). [Google Scholar]
- 2.Hou, R. Economic value of edible fungi and its processing and utilization analysis. Farm. Prod. Process.11, 74–76 (2018). (in Chinese). [Google Scholar]
- 3.Liu, K. et al. Yi S.Research progress on genetic breeding of golden mushroom velutipes.2019. Jiangsu Agricultural Sci.47, 14 (2019). [Google Scholar]
- 4.Liu, Q., Shen, Y., Zhang, Y., Xiao, H. & Song, Y. Effects of Ozone treatment on preservation effect of flammulian velutipes. Sci. Technol. Food Ind.17, 280–284 (2019). [Google Scholar]
- 5.Tang, C. et al. golden mushroom: A Culinary Medicine with Evidenced-Based Biological Activities and Health Promoting Properties. Frontiers in Pharmacology7, 474 (2016). [DOI] [PMC free article] [PubMed] [Google Scholar]
- 6.Xie, C., Gong, W., Zhu, Y. L., Hu, Z. & Peng, Z. Biodegradation of ramie stalk by golden mushroom velutipes: mushroom production and substrate utilization.. AMB Expr.7, 171 (2017). [DOI] [PMC free article] [PubMed] [Google Scholar]
- 7.Shi, H. et al. Mechanical Design ofAutomatic Harvesting of golden mushrooms. Fujian Agricultural Machinery4, 1–5 (2022). [Google Scholar]
- 8.Bi, W., Liu, R., Zhou, D., Fu, Q. & Wang, S. Factorized Production Status and Development Trend of Edible Fungus. Forestry Machinery & Woodworking Equip.6, 12–14 (2017). [Google Scholar]
- 9.Huang, W. et al. Coupling separation simulation analysis and test of corn stalk ༲ind-pith based on Abaqus. Trans. Chin. Soc. Agricultural Mach.07, 124–133 (2021). (in Chinese). [Google Scholar]
- 10.Zhang, M., Chen, X. & Yang, Y. L. Design and test of master-slave straw returning and residual film recycling combine machine.. Trans. Chin. Soc. Agricultural Eng. (Transactions CSAE)19, 11–19 (2019). [Google Scholar]
- 11.Bai, Q., Jian, Z., Wu, Y., Zhao, S. & Li, G. Automatic height-adjustment for a cutter disk on a sugarcane harvester using cutting pressure.. Trans. Chin. Soc. Agricultural Eng. (Transactions CSAE)3, 19–26 (2021). [Google Scholar]
- 12.Shen, C. et al. Bench experiment and analysis on Ramie stalk cutting. Trans. Chin. Soc. Agricultural Eng. (Transactions CSAE)01, 68–76 (2016). [Google Scholar]
- 13.Jia, H., Li, C., Zhang, Z. & Wang, G. Design of bionie saw blade forcorn stalk cutting.. J. Bionic Eng.10, 497–505 (2013). [Google Scholar]
- 14.Manhäes, C. M. C. et al. Evaluation ofvisible losses and damage to the Ratoon cane in the mechanizedharvesting of sugarcane for different displacement speeds. Am. J. Plant. Sci.5, 2956–2964 (2014). [Google Scholar]
- 15.Mcrandal, D. M. & Mcnulty, P. B. Impact cutting behaviour of forage crops I. Mathematical models and laboratory tests.. J. Agric. Eng. Res.3, 313–328 (1978). [Google Scholar]
- 16.Johnson, P. C., Clementson, C. L., Mathanker, S. K., Grift, T. E. & Hansen, A. C. Cuttingcharacteristics of miscanthus x giganteus stems withenergyvarying oblique angle and cutting speed. Biosyst. Eng.112, 42–48 (2012). [Google Scholar]
- 17.Zhang, G. et al. Design and experiment of the rotary blade type synchronous cutting device for water chestnut buds and roots. Trans. Chin. Soc. Agricultural Eng. (Transactions CSAE)13, 10–19 (2022). [Google Scholar]
- 18.Song, Z. et al. Optimizing design on cutter section of reciprocating cutter bars for harvesting cotton stalk. Trans. Chin. Soc. Agricultural Eng. (Transactions CSAE)06, 42–49 (2016). [Google Scholar]
- 19.Huang, C., Zhang, G. & Li, Y. Design of reciprocating sugarcane peeling device. J. Agricultural Mechanization Res.04, 42–49 (2022). [Google Scholar]
- 20.Tian, K. et al. Design and test of cutting blade of cannabis harvester based on longicorn bionic principle.. Trans. Chin. Soc. Agricultural Eng. (Transactions CSAE)5, 56–61 (2017). [Google Scholar]
- 21.Kong, F. et al. Design and experiment of disc-cutting picking device of castor.. Trans. Chin. Soc. Agricultural Eng. (Transactions CSAE)23, 1–9 (2021). [Google Scholar]
- 22.Korkmaz, M. E. et al. Multi-Output prediction and optimization of CO2 laser cutting quality of FFF-Printed ASA thermoplastics based on machine learning methods. Polymers17, 1910 (2025). [DOI] [PMC free article] [PubMed] [Google Scholar]
- 23.Ahmad, N. et al. Multi-objective optimization of process parameters for laser cutting of polyethylene using a fuzzy AHP-based MCDM approach. Proc. Inst. Mech. Eng. (2025).
- 24.Korkmaz, M. E., Güney, M. (2024) Experimental evaluation and machine learning prediction of laser cutting quality of FFF printed abs thermoplastics. Polymers 17 1728. [DOI] [PMC free article] [PubMed]
- 25.Mao, W. K. Analysis and Simulation of Tobacco Rotary Leaf-Cutting Machine. (Unnan Agricultural University, 2013)
- 26.Ji, B., Li, Y., Xu, L. & Yi, Q. Reed Harvesting Technology and Equipment.. Agricultural Eng.06, 11–16 (2021). [Google Scholar]
- 27.Cao, J. et al. Design and test of cutter plate potato peeling device. Agricultural Eng.10, 48–54 (2020). [Google Scholar]
- 28.Zeng, G., Chen, J., Xia, X. & Ye, J. Design and Experiment on Pull Type of Tassel Fruit Separation for Carrot.. Trans. Chin. Soc. Agricultural Machinery10, 73–79 (2018). [Google Scholar]
- 29.Arad, B. et al. Development of a sweet pepper harvesting robot. J. Field Robot.6, 1027–1039 (2020). [Google Scholar]
- 30.Zhou, S. Design and Test of the Bottle-planted White Hypsizygus Marmoreus Harvesting Device for Factory Production. (Shandong Agricultural University, 2023).
- 31.Zhao, J. Research and experiments on key technologies for automatic harvesting of golden mushrooms in bottles. (Fujian Agriculture and Forestry University, 2022).
Associated Data
This section collects any data citations, data availability statements, or supplementary materials included in this article.
Data Availability Statement
The datasets used and analysed during the current study available from the corresponding author on reasonable request.