

Abstract
Proppant breakage is a significant concern in fracturing treatments in deep reservoirs, reducing the efficiency of enhanced geothermal systems (EGS). However, little research has been conducted on the breakage process of proppants under high closure stress conditions. A visualization experiment was designed to investigate processes of proppant breakage and layer deformation in real-time under 100 °C and high closure stress (0–50 MPa) conditions. We observed significant non-uniform breakage in the multi-size proppant layer, which resulted in large-size pores with high connectivity in the regions of low breakage degree, potentially maintaining permeability. Moreover, the non-uniform breakage forms a composite structure in two stages. This process mitigates subsequent proppant breakage, thereby preserving the non-uniform breakage pattern and maintaining a locally high-connectivity porous structure. In addition, we discussed the nonlinear deformation and stiffness of the proppant layer under stress loading. Finally, the applicability of the conclusions has been demonstrated by comparing granite-proppant experiments with the same conditions. The non-uniform breakage characterization of multi-size proppant layer in the granite-proppant experiments was observed as well. This research reveals the breakage mechanism of the multi-size proppant, which is expected to facilitate the optimization of proppant placements in deep fracturing operations.
Keywords: Proppant breakage, Proppant deformation, Multi-size proppants, Deep reservoir, Visualization
Subject terms: Geothermal energy, Petrol, Ceramics
Introduction
With the development of sustainable energy sources exploitation technology and the growth of environmental awareness, the focus of researchers and engineers has shifted from conventional reservoirs to the abundant resources of deep reservoirs (≥ 4500 m). In particular, natural geothermal reservoirs of hard and tight rocks, such as granite, have been exploited to harvest renewable and sustainable energy1. Geothermal energy has gained significant attention as a renewable source due to its high conversion efficiency and operational stability. Current extraction primarily relies on hydraulic circulation systems, where fluid is injected into subsurface reservoirs to enable continuous heat recovery through production wells2,3. However, geothermal energy extraction faces major geological challenges, particularly the low permeability of deep rock formations. Enhanced geothermal systems (EGS) address this by artificially stimulating reservoirs to increase permeability and improve energy recovery efficiency3,4.
Hydraulic fracturing is one of the most important stimulations for enhancing the efficiency of geothermal energy conversion by inducing artificial fractures and improving the permeability of medium fluids like water in rock masses. The sustainable maintenance of hydraulically induced fracture networks in EGS necessitates strategic proppant injection to counteract fracture closure caused by substantial in-situ stresses5–9.
The development of EGS is fraught with numerous difficulties, largely attributable to the presence of complex conditions such as high temperatures and stresses. Therefore, some scenarios seriously limit the efficacy of hydraulic fracturing, including fracturing fluid damage, low sand concentrations, and proppant breakage10,11. Moreover, with the propagation of hydraulic fracture, apertures gradually reduce, resulting in lower concentrations of proppants in regions that are farther from the perforation12. In these regions, proppant breakage occurs significantly (Region I in Fig. 1), with large amounts of proppant debris migrating and obstructing flow pathways (Region II in Fig. 1), leading to decreased fracture conductivity. Furthermore, the significant thermochemical environment in reservoirs can accelerate the proppant diagenesis process13,14.
Fig. 1.
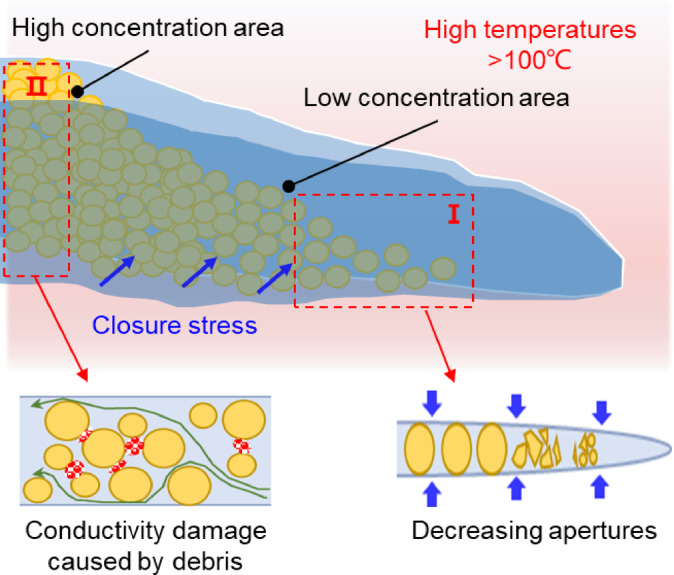
Effects of proppant breakage in hydraulic fractures within deep reservoirs.
Despite the proposal of certain fracturing technologies devoid of proppants by some researchers, which rely on self-support to ensure a certain conductivity and to reduce costs, the utilization of proppants remains essential for deep reservoirs, where high stresses induce severe fracture closure15,16. Bijay et al. confirmed that the use of sintered bauxite particles as proppants is expected to enhance the fracture conductivity. However, due to proppant breakage and other behaviors, the effectiveness of EGS will significantly decrease over time7. Current research primarily identifies the mechanisms and factors that affect proppant breakage under geothermal reservoir conditions, to optimize the proppant performance17–19. Specifically, the research of proppant breakage should incorporate its structure characterizations and rock contacts into the analysis, based on the material yield criterion20,21. For instance, the efficacy of improving the material strength, reducing the size of proppants, and coating has been demonstrated22–26. In addition, researchers are no longer limited to the proppant pack in the macroscopic scale, and microscopic breakage processes can be captured to study the damage mechanism27–30. Nevertheless, it is difficult to obtain real-time information on the deformation and breakage processes of proppants under high stresses. A significant number of current studies have been grounded in obtaining qualitative insights through optical observations after testing31–34. As a result, the conclusions drawn from this method may necessitate further validation.
Furthermore, to increase the proppant placement area in branch fractures with various apertures, some researchers have proposed and optimized the pumping schedule of multi-size proppant35–38. Through numerical and experimental methods, they investigated the transport and final distribution of multi-size proppants under different pumping sequences, fracture geometry, and fracture types. The results demonstrate that when the fractures are straight, the mixing feature of the different proppants is insignificant, with the distribution areas non-overlapping (Fig. 2a,b, and j). However, the actual fracture geometry is more complex, and the effects of the tortuosity on the proppant transport cannot be disregarded. It is manifested as the mixing of large and small proppants occurring in the vertical tortuous fracture under certain pumping sequences (Fig. 2c,i). In contrast, proppants in the horizontal tortuous fracture are distributed in clusters while the mixing phenomenon presents more obviously (Fig. 2f–h). Consequently, the multi-size proppant distribution in the actual hydraulic fracture is non-uniform, with the mixing phenomenon of different-size proppants being prevalent, under which the proppant breakage and fracture closure behaviors will be more complicated as well.
Fig. 2.

The distribution of multi-size proppants with different pumping sequences, fracture roughness, and fracture types. The results are obtained from the studies36–38.
We firmly believe that current research must address three critical issues: (1) the characteristics of proppant breakage under low concentrations in deep-hard rock reservoirs; (2) the evolution of the proppant layer’s pore structure with increasing breakage; and (3) the effects of size ratios in multi-size proppant placement on breakage, layer deformation, and pore structure evolution.
In this paper, we designed a visualization experiment to study processes of proppant breakage in real-time under deep and hard rock reservoir conditions (0–50 MPa, 100 °C). Four major research contents were carried out as follows:
Based on the visual method, the breakage process of multi-size proppants was captured.
The correlation between the deformation of the proppant layer and the breakage mechanism of multi-size proppant was established.
The characterization of interparticle pores and the evolution of pore volumes in the proppant layer was clarified.
Advanced discussions about the limitations of the visual method were stated, and the reliability of our results was validated in the particular condition.
Methods
The introduction to the visual experiment
We designed a visual experimental method to capture the proppant breakage image in real time (Fig. 3). The visualized experiment device primarily consists of a hydraulically driven piston (capable of providing 0–50 MPa), a high-transparency sapphire window (light transmittance > 90%), a microscope (magnification range of 1–7×), and an LVDT (measurement range of 0.01–4 mm with an accuracy of 0.01 mm). Using the axial movement of the piston pump, the specimen was exerted to compressive stress. To obtain clear optical images of the proppants, we selected a transparent and high-strength sapphire above the specimen. An optical microscope was placed above the visualization window to record the proppant images at loading times. The field of view of the microscope covers a square area of 11 mm × 11 mm at the center of the specimen.
Fig. 3.

The visual experimental system of proppant breakage.
The mixing ratio of multi-size proppants varies across different conditions, it is anticipated that the hydraulic fracture complexity increases induced by natural fracture interactions in the reservoir, leading to a reduction in the proportion of larger-size proppants within the fracture tip37. Therefore, to investigate the fracture closure and pore damage behavior of the proppant pack caused by proppant breakage in various conditions is necessary. To simulate the mixing characterization of multi-size proppants in the hydraulic fracture, five proppant placement patterns with different ratios of 20/40 mesh and 40/70 mesh low-density ceramic proppant (LDC) were conducted. The elastic modulus of the ceramic proppant is about 37.2 GPa, its hardness is about 15.9 GPa.
Using the ratio of 20/40 mesh proppant as the single variable, the ratios were set at 0% (pure 40/70 mesh proppant), 30%, 50%, 70%, and 100% (pure 20/40 mesh proppant) (Fig. 4). This ratio gradient design, transitioning from pure small-sized to pure large-sized proppants (with interval gradients of 30%, 20%, 20%, and 30%), systematically characterizes the mechanism of multi-size proppant ratios on proppant breakage. Following a thorough mixing process involving ceramics of different sizes, a uniform monolayer proppant was placed on the surface of a steel cylindrical plug (diameter: 25 mm, height: 12.5 mm).
Fig. 4.
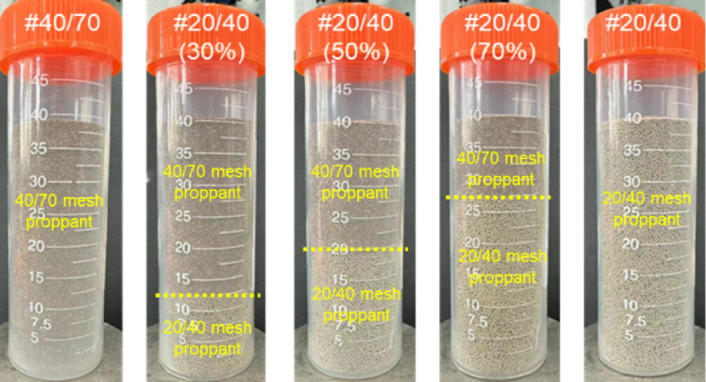
Varying ratios of 20/40 mesh and 40/70 mesh proppants (Before mixing).
While this study simplifies the proppant placement to facilitate mechanistic analysis and high-resolution visualization, it does not fully replicate the multi-layer proppant distribution in near-wellbore regions of field-scale hydraulic fractures. Investigation of multi-layer proppant breakage will be addressed in future research. The experiment has the advantage of capturing images of proppant breakage in real-time and analyzing the evolution of pore structure in the proppant layer. However, two key controversies surrounding the visualization device coexist: Is the contact between sapphire-proppant-steel similar to that of proppant-rock? Why was the steel used instead of the real rock? Both issues are discussed in “Discussions” section to ensure the analogy and reliability of our experimental results.
Table 1 illustrates the experimental parameters. The specimens correspond to five placement patterns, categorized into two types: the single-size range of proppants-placed specimens (SP) and the multi-size proppants-placed specimens (MP). The proppant concentration slightly increased with the ratio of 20/40 mesh proppants enhancing. Additionally, the experimental temperature was set at 100 °C.
Table 1.
The experimental parameter.
| Specimen ID | Specimen type | Volume ratio | Concentration (kg/m2) | Temperature (°C) |
|---|---|---|---|---|
| #40/70 | SP | 40/70: 100%, 20/40: 0% | 0.42 | 100 |
| #20/40(30%) | MP | 40/70: 70%, 20/40: 30% | 0.44 | |
| #20/40(50%) | 40/70: 50%, 20/40: 50% | 0.45 | ||
| #20/40(70%) | 40/70: 30%, 20/40: 70% | 0.48 | ||
| #20/40 | SP | 40/70: 0%, 20/40: 100% | 0.5 |
The distributions of proppant diameter
To evaluate the statistical representativeness of microscopically observed areas in proppant-placed specimens, this study systematically acquired full-field surface topography data using three-dimensional laser scanning technology (resolution ≈ 0.01 mm). A comparative spatial distribution analysis was conducted between the global specimen data and microscopic observation areas (Fig. 5). Parametric characterization through normal distribution modeling revealed that the mean difference range was 2.5–6.7%, and the standard deviation fluctuation amplitude was 2.5–19.7%. These results systematically demonstrate that the local observation areas under microscopy effectively represent the global statistical features of proppant placement, and confirm the validity of partial investigations for characterizing global proppant breakage behavior.
Fig. 5.

The 3D scanning results of five proppant-placed specimens (left). Comparative analysis of global height distribution and microscopic visual areas (right).  is the mean of the global height of the specimen,
  is the mean of the height of the observation area,
  is the standard deviation of the global height of the specimen,
  is the standard deviation of the height of the observation area. (a) #40/70; (b) #20/40(30%); (c) #20/40(50%); (d) #20/40(70%); (e) #20/40.
The loading setup
Setup 1: Before conducting the formal experiment, adjust the position of the plunger to make the proppant and sapphire come into contact. Record the value of the LVDT at this moment as the initial aperture. The initial aperture approximates the maximum proppant diameter, which can be independently quantified via 3D scanning.
Setup 2: Kerosene was injected into the plunger pump at a constant rate (1 mL/min) to exert closure stresses on the rock specimen. Simultaneously, the deformation data of the proppant layer from the LVDT and microscope was recorded simultaneously until the closure stress reached 50 MPa. The curves of closure stress corresponding to the loading time can be seen in Fig. 6.
Fig. 6.

The loading curves of experiments.
Setup 3: Following experimental execution, systematic analysis of microscopic imaging datasets and LVDT recordings was performed. The methodological framework governing image quantification and displacement data processing will be comprehensively detailed in later sections.
The image processing
Microscopic images were processed as Fig. 7. To obtain such pore size or projection area, the Weka Segmentation plugin of the ImageJ software was utilized to identify proppants in the original image (identified as the red area). The proppant particles were then extracted from the binary images. Finally, the particles were segmented by implementing a watershed operation.
Fig. 7.
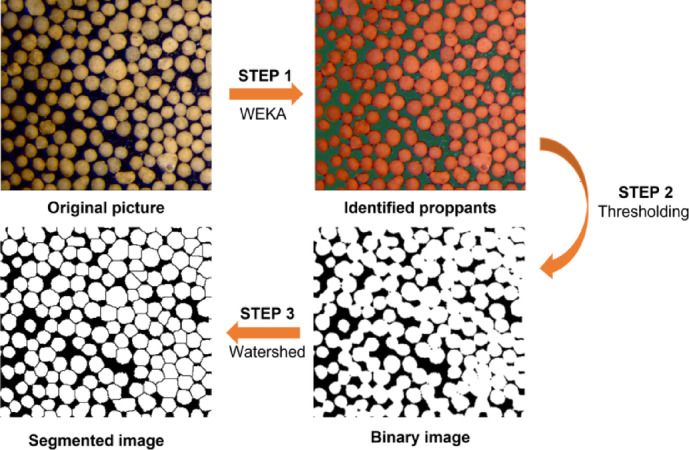
The processing flow of proppant breakage images.
Results
The process of proppant breakage
Figures 8, 9, 10, 11 and 12 demonstrate images of proppant breakage at closure stresses of 0 MPa, 5 MPa, 25 MPa, and 50 MPa respectively. For the SP (#40/70 and #20/40), only a small portion of proppants break at 5 MPa (Figs. 8a and 12a), while almost all proppants are crushed at 50 MPa (Figs. 8d and 12d). However, a different phenomenon is observed in the MP: a significant non-uniform breakage occurs with the closure stress increasing. Under low closure stress conditions (less than 5 MPa), 20/40 mesh proppants are broken, followed by the failure of 40/70-mesh proppants (Figs. 9, 10, 11 and 12). Notably, as the closure stress progressively increases to 50 MPa, the number of broken 40/70 mesh proppants in #20/40(50%) become significantly lower compared to #40/70 (Figs. 8d and 10d). Additionally, fragments of crushed 20/40 mesh proppants are compressed, inducing radial deformations and contacting or even covering the adjacent smaller proppants (Fig. 10d).
Fig. 8.

Proppant breakage physical images (left) and binary images (right) of #40/70.
Fig. 9.

Proppant breakage physical images (left) and binary images (right) of #20/40(30%).
Fig. 10.

Proppant breakage physical images (left) and binary images (right) of #20/40(50%).
Fig. 11.

Proppant breakage physical images (left) and binary images (right) of #20/40(70%).
Fig. 12.

Proppant breakage physical images (left) and binary images (right) of #20/40.
Moreover, the proppant axial projection area increases significantly with proppant breakage. We can quantitatively discuss the proppant breakage severity level through image analysis. Thus, the proppant breakage degree  is defined as follows:
 |
1 |
where  is the proppant projection area at the current closure stress, mm2;
  is the proppant projection area at 0 MPa, mm2.
Figure 13 illustrates  values of different patterns corresponding to the closure stress
  . It is evident that as
  increases, there is a corresponding increase in proppant breakage, resulting in a larger
  . Moreover, when
  reaches 50 MPa, the value of
  of the SP outweighs that of the MP. In addition, the
  of #40/70 is the largest (0.59), followed by #20/40 (0.52), with #20/40(50%) exhibiting the lowest breakage degree, with only 0.39. After comparing the results, we confirm that #20/40(50%) can effectively reduce the proppant breakage degree by 5.8–33.9%.
Fig. 13.

 of different specimens corresponding to
  .
.
To reveal the non-uniform breakage behavior of the MP, we obtain and compare the breakage degrees of local regions at 50 MPa, denoted as  . We divide the entire microscope observation area into several local analysis units of the same size. As shown in Fig. 14a, we determine the number of proppant centroids
  of square units at 0 MPa after executing image segmentation. We have established that the side length of a square unit is 0.85 mm, approximately equaling the diameter of 20 mesh proppant, which is done to ensure that the
  of each unit is greater than or equal to 1. However, subsequent analyses will exclude some units with
  = 0 at the edge of the image. Consequently, it is reasonable to infer that the proppant is more numerous and densely packed in the unit with a larger
  . In other words, it suggests that units with smaller
  normally contain the large-size proppant.
Fig. 14.

The relationship between  and
and  obtained by statistical methods.
Figure 14b–f show different relationships between  and
and  of various patterns. Importantly, the mean value of
  for each
  tends to decrease as
  increases. In addition, when
  increases between 1 and 3, the decrease in
  of the MP is greater than that of the SP. To compare quantitatively the non-uniform breakage of each specimen, we define the non-uniform proppant breakage coefficient
  which can be calculated as follows:
 |
2 |
where  is the mean value of
  corresponding to the given
  ,
,  is the maximum of
  obtained from the initial image segmentation. Generally, there is more significant non-uniform breakage if
  is larger in accordance with the definition.
Figure 14g demonstrates the value of  for varying ratios of 20/40 mesh proppant (
 ). The
  value for #20/40(50%) is the largest, indicating that the most significant non-uniform proppant breakage occurs at this pattern among five specimens. On the other hand, #20/40 with the smallest
  exhibit a comparatively more uniform breakage pattern.
We discuss the mechanism of proppant breakage by analyzing images with higher magnification. Without considering the embedment and matrix deformation, individual proppant axial compression is analogous to the scenario of contact between an elastic sphere and a rigid plate39. With the closure stress increasing, the contact between the proppant and sapphire induces a nearly circular contact area, which is shown in Fig. 15a at 5 MPa. According to the Hertzian contact mechanics, radial tensile stress is induced inside the contact area and exceeds its maximum value at the edge of the contact area19. Particularly, sand and uncoated ceramic proppant are brittle, and their failures typically follow the maximum tensile stress criterion. Thus, when the tensile stress at the edge reaches the material tensile strength, the tensile failure occurs, and fractures propagate along the proppant meridian. If the material is homogeneous and isotropic relatively, multiple tensile fractures occur, resulting in the “orange peel” failure. In addition, the point located approximately halfway down the radius of the contact area from its center has the largest shear stress, inducing a conical shear band is induced40. As a consequence, the mixed failure of tension and shear is the primary mode of proppant breakage.
Fig. 15.

Proppant breakage images of local units.
After initial fracturing during the compression, the proppant still retains residual resistance. As the process of loading continues, more fractures are generated, and the failure mode undergoes a transition from localized breaking (such as exfoliating or splitting) to overall crushing (as shown in Fig. 15a at 25 MPa). The proppant breakage of #20/40 is more uniform, and almost all proppants are crushed (as shown in Fig. 15a at 50 MPa). Similarly, proppant crush is observed in #20/40 and 40/70 (Fig. 15a,f), with a significant amount of fine within interparticle pores.
For #20/40(50%), only a few large proppants have been broken within the unit. It can be observed from Fig. 15b that the closure stress continues to exert on the proppant fragments, inducing radial deformations following the breakage. Since proppants packed closely, the fragments of large proppants will contact the adjacent smaller proppants to fill the interparticle voids (Fig. 15c).
At 0 MPa, unbonded discrete proppants are only axially compressed, with no stress transferring by interparticle force chains. The non-negligible stress concentration effect in the small contact areas aggravates the failure. When the fragment generated by large proppant breakage deforms in the radial direction and contacts undamaged small proppants, a higher coordination number is generated, facilitating interparticle stress transfer. At the same time, the contact area becomes significantly larger while the stress concentration effect is eliminated. Small proppants, in conjunction with the fragments, construct a composite structure to resist closure stresses.
In addition, many local units contain solely 40/70 mesh proppants, as shown in Fig. 15d and e. When the closure stress reaches 25 MPa, a minority of proppants break down into fragments. However, at 50 MPa, the broken proppants are not crushed completely, which remains the resistance against closure stresses.
To quantitatively contrast the evolution of local breakage behaviors, Fig. 16a illustrates the local breakage degree  of the units in Fig. 15 corresponding to
  . Firstly, we observe a consistent variation trend among all units of #20/40(50%): the increment of
  obviously decreases as
  increases. After 25 MPa, the increment of
  is close to 0. In contrast, although the increment of
  for the units of #20/40 and #40/70 is getting smaller with
  loading, it is much larger than that of #20/40(50%). Figure 16b demonstrates that there is a significant difference in the slopes of
  versus
  curves. It has been established that the slope values for all curves are similar before the application of 25 MPa, with a range of 0.005–0.08. After 25 MPa, a significant decrease in slope values in four curves with different
  of #20/40 (50%) is observed, with a reduction of approximately 10–1000 times. The four
  versus
  curves with different
  of #20/40(50%) can be directly split into two stages based on their slopes, which are related to the behaviors of proppant breakage (Fig. 16c):
Stage 1: For the units containing 20/40 mesh proppants, closure stress concentration occurs in the contact area of the large proppant, inducing its breakage into fragments, which
 increases significantly with the applied load. For the units without 20/40 mesh proppants, the increment of
  corresponding to
  is relatively smaller.
Stage 2: The fragmental 20/40 mesh proppants are crushed and deformed, contacting with adjacent proppants. This process ultimately forms the composite structure, creating large contact areas and generating interparticle stress transfers. Thus, the composite structure alleviates the stress concentration, under which small proppants in the structure are less likely to break. As a result, the increment of
 in response to
  decreases, and the slope of this stage becomes much smaller. Moreover, partial composite structures akin to “strong pillars” play a pivotal role in resisting closure stresses and indirectly mitigating proppant breakage in other regions, which leads to a decrease in the slope of
  versus
  curves for units without 20/40 mesh proppants as well.
Fig. 16.

The two-stage process of partial composite structure in multi-size proppants.
In contrast, the slope of the #20/40  and #40/70
  curves remain relatively larger, which are not distinguished by the presence of two stages. Consequently, the two-stage formation of the composite structure is necessarily coterminous with the non-uniform breakage of multi-size proppants. In order to form the composite structure, the non-uniform breakage is a prerequisite. In turn, the composite structure prevents the continued breakage of overall proppants, thus ensuring the maintenance of the non-uniform breakage.
The deformation of proppant layer
Figure 17 shows the deformation of the proppant layer ( ) corresponding to
  . with a highly nonlinear relationship between
  and
and  . When
  is low (< 5 MPa), the value of
  rapidly increases rapidly, and the slope of the curves is similar for several specimens. Furthermore, as
  increases, the slope increases significantly. The nonlinear mechanical behavior is governed by proppant deformations and breakage33, resulting in different trends of the
  –
– relationship for various proppant placements. However, due to the presence of proppants, the aperture cannot be completely closed without embedment, and
  approximately reaches to the maximum proppant diameter under the high closure stress.
Fig. 17.

The deformation and normal stiffness of proppant layer induced by closure stresses.
In order to capture the deformation gradient of the proppant layer, we introduce the concept of normal stiffness  . To illustrate,
  represents the closure resistance, which means the higher
  , the smaller
  under the same closure stress.
  can be calculated as follows:
 |
3 |
As illustrated in Fig. 17b, the variation in the relationship between  and
and  is presented. The scatter points represent the stiffness values calculated from the experimental curves, while the straight line indicates the fitting result (Table 2). It is evident that as
  increases,
  enhances significantly, essentially following the linear function (Eq. 4). Furthermore, there is a significant difference in the parameter of linear fitting (
 ) of the five specimens, following the order: #40/70 > #20/40 (30%) > #20/40 (50%) > #20/40 (70%) > #20/40. The results indicate that the proppant layer presents a lower stiffness in correlation with an increase in the ratio of 20/40 mesh proppants in this study.
 |
4 |
Table 2.
The function of linear fitting for different specimens.
| Sampe ID | Fitting function |
|---|---|
| #40/70 | y = 10.743 x |
| #20/40(30%) | y = 7.403 x |
| #20/40(50%) | y = 5.807 x |
| #20/40(70%) | y = 5.244 x |
| #20/40 | y = 3.749 x |
As the 20/40 mesh proppant breaks and the composite structure in the MP is formed, the fragment of the 20/40 mesh proppant and the 40/70 mesh proppant resist the closure stresses and deform in equal deformation. The proppant layer can be regarded as an equivalent medium, analogous to the scenario depicted by the Voigt model41 (Fig. 18a). The Voigt model is a classical theoretical framework for predicting the effective elastic modulus of multiphase composite materials, particularly suitable for characterizing the equivalent mechanical behavior of multicomponent rock systems42,43. This model operates under three fundamental assumptions: (a) All constituent materials experience identical strain in the same spatial direction; (b) The macroscopic stress of the composite material equals the volumetric-weighted average of stresses within individual components; (c) The material exhibits macroscale homogeneity when analyzed through a statistical continuum approach.
Fig. 18.

The comparison of Voigt model predictions and experimental data.
For the rock medium containing  components, the equivalent elastic modulus
  can be expressed as:
 |
5 |
In Eq. (5),  is the volume fraction of the i-th component, subject to the normalization condition
  , and
, and  is its corresponding elastic modulus.
Analogously, the constitutive relationship for the closed stress-deformation behavior in multi-component media under uniform deformation conditions can be formulated. For a containing  components, the equivalent stiffness
  can be expressed as:
 |
6 |
where  is the stiffness of the i-th component.
For the multi-size proppant placement investigated in the study, the equivalent stiffness of the multi-size proppant layer can be calculated under the specific closure stress using Eq. (7):
 |
7 |
where  represents the normal stiffness of fragmental 20/40 mesh proppant, MPa mm−1;
  equals to the normal stiffness of 40/70 mesh proppant, MPa mm−1.
The variation rules of  and
and  corresponding to the closure stress are simplified to the linear fitting function of #20/40 and #40/70, and the correspondence between
  and
and  of the MP can be calculated by Eq. (7) (Fig. 18b). It is worth noting that the application of Eq. (7) is an approximation requiring careful consideration of its underlying assumptions. Crucially, fragmental proppant particles transition into non-elastic continua exhibiting plastic behavior, thereby violating the fundamental elastic deformation premise of the Voigt model. Nevertheless, this simplified approach remains applicable to complex system analyses and retains practical prediction value in engineering contexts (Fig. 18b). The model demonstrates an ability to predict the overall trend of the variation of the proppant layer stiffness in the experiments, and the experimental results fluctuated around the values predicted values.
In addition, the gradient of the model curve depicted in Fig. 18b corresponds to the value of  as determined by the model. As illustrated in Fig. 18c, it is evident that all three specimens demonstrate a lower
  in experiments than that predicted by the Voigt model. We speculate that the main factor that contributes to the error is: The simplified calculation of
  and
and  . The breakage characterization of the SP and MP is different. Particularly, a number of 40/70 mesh proppants remain unbroken in the MP, whereas almost all 40/70 mesh proppants in the SP are broken and crushed due to the closure stress. As a result, there is a discrepancy between the actual
  of the MP and the
  obtained from the simplified method.
Characterizations of pores in the proppant layer
The pore volume and its connectivity directly influence the permeability of the proppant layer. As shown in images provided in “The process of proppant breakage” section, proppant deformation and breakage result in the damaged pore structure. Given the considerable difficulty of directly determining the pore volume of the proppant layer, this paper adopts a simplified method (Fig. 19a), whereby proppants are simplified into columns with the same height equal to the current propped aperture, which allows the 2D pore area to be obtained from the image calculations, acquiring the pore volume  by multiplying by the current propped aperture to (Eq. 8).
 |
8 |
Fig. 19.

The simplification method to calculate pore volume  and its variation corresponding to
  .
.
where  is the pore volume under the current closure stress, mm3;
  is the area of the observation by the microscope, mm3;
  is the proppant projection area at the current closure stress, which can be obtained through image analyses, mm2;
  represents the maximum diameter of proppants, being the initial aperture as well, which can be obtained from 3D scanning results (Fig. 5), mm;
  can be obtained by the LVDT, mm.
It is important to acknowledge the limitations of this simplified method which underestimates the pore volume, consequently leading to a relatively large error for the MP. However, when the elevated closure stress causes the proppant to be broken, the morphology of the fragmented proppant changes accordingly, from spherical to columnar. Therefore, the error of the simplified method decreases under conditions of high closure stresses.
Figure 19b demonstrates evolutions of the pore volume with the closure stress loading. At the initial condition (0 MPa), #20/40(30%) has the largest  (243 mm3) while #40/70 has the smallest
  (147 mm3). Upon
  reaching 50 MPa, #20/40(30%) exhibits the maximum
  (26.33 mm3), followed by #20/40(50%) with 15.41 mm3, #20/40(70%) with 8.81 mm3, #40/70 with 7.76 mm3, and #20/40 with 7.56 mm3. In summary, the pore volume of the multi-size proppant layer is greater than that of the single-size interval proppant layer under 50 MPa.
Furthermore, the permeability of porous media is not only dominated by the pore volume, moreover, the effect of pore structure, connectivity, and distribution should not be disregarded. Figure 20 shows the binary images of each specimen at 50 MPa. We can find that discrete pore distributions and low pore connectivity are induced by uniform proppant breakage in the SP (Fig. 20a,e). In contrast, large-size interparticle pores (Fig. 19b) with comparatively high connectivity are maintained in the MP, and the pore connectivity is optimized in #20/40(50%) among them.
Fig. 20.

The binary images of each specimen at 50 MPa (White: proppants, black: pores): (a) #40/70 (b) #20/40(30%) (c) #20/40(50%) (d) #20/40(70%) (e) #20/40.
In the porous media, the main flow channels consist of interconnected pores that exhibit high connectivity, in contrast to isolated pores that exert minimal influence on the effective permeability44. The reduced connectivity of these pores can be attributed to the relatively uniform proppant breakage and the higher breakage degree. In comparison, the multi-size proppants display more non-uniform breakage. Consequently, the formation of large interparticle pores with a high degree of connectivity, which in turn forms effective flow pathways (Fig. 21).
Fig. 21.

Schematic diagram of flow channels in the multi-size proppant layer.
Discussions
In this part, we discuss the limitations of the visual method and the validity of the above results. In additional experiments, 40/70 mesh proppant, 20/40 mesh proppant, and mixed proppants in the same volume ratio, were placed on the smooth granite discs, and designated #Granite-40/70, #Granite-20/40, and #Granite-20/40(50%), respectively. The procedures and condition settings utilized in the extra experiments were identical to those employed in previous experiments, and the mechanical parameters of the granite at 100 °C shown in Table 3. The granite specimens were taken from outcrops in Shandong, China.
Table 3.
The mechanical properties (100℃) of the granite specimens.
| Mechanical property | Value |
|---|---|
| Density (g/cm3) | 2.63–2.89 |
| Elastic modulus (GPa) | 39–41 |
| Poisson’s ratio | 0.19–0.29 |
| Uniaxial compress strength (MPa) | 121–132 |
It was determined that #Granite-20/40 (50%) (Fig. 22c) and #Granite-20/40 (Fig. 22e) caused the brittle failure during the loading process, thereby rendering it impossible to exert closure stresses higher than 50 MPa. Conversely, only #Granite-40/70 was able to successfully complete the loading process, albeit with numerous induced fractures in the granite specimen (Fig. 22a). The application of higher closure stresses to brittle materials, such as granite, has been observed to result in the formation of stress concentrations within the proppant contact area, which, in turn, tends to cause brittle failure under no confining pressure conditions and experiment failure. Although the application of confining pressure has been demonstrated to enhance the strength of granite specimens45,46, it is challenging to achieve the necessary visualization requirements. Furthermore, the non-homogeneity of granite has a considerable effect on the experiment, which can lead to difficulties in replicating experimental results. Consequently, the utilization of specimens with proppant-steel contacts was deemed essential for the execution of the experiments.
Fig. 22.

The photos of tested granite specimens and proppants. #Granite-40/70: (a) and (b); #Granite-20/40(50%): (c) and (d); #Granite-20/40: (e) and (f).
The proppants on the surface of the granite specimens were observed after experiments. As illustrated in the Fig. 22, the proppant breakage occurs under the experimental conditions. Specifically, the 40/70 mesh proppant of the #Granite-40/70 exhibited the overall crushing (Fig. 22b), while the proppant on #Granite-20/40 demonstrating more severe breakage (Fig. 22f), resulting in the retention of only partial debris and no identifiable intact proppants were observed. Conversely, #Granite-20/40 (50%) exhibited the analogous phenomenon to #20/40(50%), where 20/40 mesh proppants are crushed, while the surrounding 40/70 mesh proppants remain relatively integrity (Fig. 22d). This result suggests that in multi-size proppants in contact with granite, the high closure stresses can induce the formation of composite structures. These structures assist in mitigating the breakage of 40/70 mesh proppant and potentially preserving highly permeable flow channels in areas of low breakage degree.
Furthermore, the effect of proppant embedment is examined in these experiments. By scanning the granite surface post-experiment and comparing the original morphology, it was determined that there were rarely embedment pits deeper than 0.1 mm. The two underlying reasons underpin the negligible proppant embedment. Firstly, the elastic modulus of the granite (39–41 GPa) is higher than that of the ceramic proppant (37.2 GPa). When the proppant contacts with the granite under closure stresses, the proppant exhibits a propensity to deform and fracture on its own rather than to embed itself in the granite. However, for rocks with high clay mineral contents, such as shales, mudstones, and sandstones, the proppants embed into the rocks firstly under high closure stresses. This indicates that the conclusions of this study are more applicable to deep hard-rock reservoirs than to soft-rock reservoirs. Secondly, the slight embedding of the proppant leads to the brittle failure of the specimens, indicating that the proppant is unable to continue embedding into the granite in the experiments.
Finally, the closure behavior of propped fractures for granite-proppant specimens is examined. As demonstrated in Fig. 23a, the variation propped aperture of granite-proppant with closure stress is characterized as nonlinear. In contrast to the steel-proppant specimens, the  of the granite-proppant specimens contains the deformation of the damaged granite specimen where microfractures in the granite are induced by stresses, resulting in a smaller stiffness than that of the steel-proppant specimens. Figure 23b demonstrates the nonlinear variation of the
  concerning the closure stress for the granite-proppant-placed specimen, in which the dashed line represents the fit result by logarithmic functions. However, it is noteworthy that there are two features that are consistent with the observed phenomenon in the steel-proppant specimens: (1) The
  of MP is positioned between that of the SP; (2) Prior to the specimen failures, the
  is increasing with the closure stress loading.
Fig. 23.

The variation of propped aperture and normal stiffness induced by closure stresses of granite specimens.
The findings of the additional experiments demonstrate that, in the case of hard rocks such as granite, there are significant breakages of both 20/40 mesh and 40/70 mesh ceramic proppants with low sand concentration under high closure stress conditions. Some results of the granite-proppant experiments are analogous to those of the steel-proppant experiments, wherein the breakage of multi-size proppant is non-uniform. However, in soft rock reservoirs, where the behavior of proppant-rock interaction is more complex, further research focusing on the proppant-rock interaction is anticipated to be investigated more comprehensively by enhancing the equipment and methods employed.
Conclusions
Since there is a paucity of research in the process of multi-size proppant breakage under deep-hard reservoir conditions, we designed a visualization experiment to investigate the real-time processes of proppant breakage and proppant layer deformation under high temperature (100 °C) and high closure stress (0–50 MPa) conditions. The following conclusions offer insights into the multi-size proppant placement optimization in EGS:
The breakage degree is defined and utilized to quantitatively compare the severity of proppant breakage across different placed patterns. At the closure stress of 50 MPa, the overall breakage degree of single-size range proppant placements is higher than that of multi-size proppant placements.
Significant non-uniform breakage has been observed in the specimens with multi-size proppant placement. Hence the multi-size proppant layer can be divided into two regions: high breakage degrees and low breakage degrees. Particularly, large interparticle pores with high connectivity form dominant flow pathways in the regions of low breakage degree, potentially maintaining permeability under high closure stresses. In contrast, the proppant breakage in the single-size range proppant placed specimens is more uniform, which induces comparatively discrete pore distributions and low pore connectivity.
The two-stage failure process has been clarified from the local scale in the regions. In Stage 1, closure stress concentration occurs in the contact area of the large proppant, leading to its fragments. In Stage 2, the fragments are crushed and deformed, contacting with adjacent the small proppants. This process ultimately forms the composite structure, which alleviates the stress concentration and overall subsequent proppant breakage, thereby ensuring the maintenance of both non-uniform breakage and local high-connectivity porous structure.
Proppant breakage is regarded as a pivotal factor, contributing to the nonlinear variation of proppant layer deformation with closure stresses. The stiffness of the multi-size proppant-placed specimens is intermediate between that of the two single-size range proppant-placed specimens.
The applicability of the conclusions is evidenced by comparing granite-proppant experiments with identical conditions. The non-uniform breakage characterization of multi-size proppant in the granite-proppant experiments has been observed, which is a satisfying match with the steel-proppant experiments. However, in soft rock reservoirs, where the behavior of proppant-rock interaction is more complex, further research focusing on the interaction between proppant and rock is anticipated to be investigated more comprehensively by enhancing the equipment and methods employed.
Acknowledgements
The authors wish to acknowledge the support of the National Science Fund for Distinguished Young Scholars (51925405) and the National Natural Science Foundation of China (52434001, 52104050, 52274013).
Author contributions
B. D.: Writing-original draft, Conceptualization, Data curation, Formal analysis and Visualization. G. Z.: Supervision, Resources, writing-review and editing. R. J.: Investigation. J. Z.: Data curation. D. Z.: Resources, Methodology.
Data availability
The datasets used and/or analyzed during the current study available from the corresponding author upon reasonable request.
Declarations
Competing interests
The authors declare no competing interests.
Footnotes
Publisher’s note
Springer Nature remains neutral with regard to jurisdictional claims in published maps and institutional affiliations.
References
- 1.Zhang, K. et al. A review of reservoir damage during hydraulic fracturing of deep and ultra-deep reservoirs. Pet. Sci.21, 384–409. 10.1016/j.petsci.2024.01.001 (2024). [Google Scholar]
- 2.Evangeline, S. I. & Darwin, S. The role of carbon dioxide in enhancing geothermal energy: A review of current developments and future potential. Renew. Sustain. Energy Rev.214, 115525. 10.1016/j.rser.2025.115525 (2025). [Google Scholar]
- 3.Shu, B. et al. Overview and outlook of thermal processes in geothermal energy extraction. Appl. Therm. Eng.272, 126329. 10.1016/j.applthermaleng.2025.126329 (2025). [Google Scholar]
- 4.Lu, S. M. A global review of enhanced geothermal system (EGS). Renew. Sustain. Energy Rev.81, 2902–2921. 10.1016/j.rser.2017.06.097 (2018). [Google Scholar]
- 5.Al Balushi, F., Zhang, Q. & Taleghani, A. D. On the impact of proppants shape, size distribution, and friction on adaptive fracture conductivity in EGS. Geoenergy Sci. Eng.241, 213115. 10.1016/j.geoen.2024.213115 (2024). [Google Scholar]
- 6.Dong, X. et al. Effect of proppant on seepage and heat transfer characteristics in fractured granite of hot dry rock geothermal systems. Energy Sci. Eng.13(2), 847–861. 10.1002/ese3.2042 (2025). [Google Scholar]
- 7.Kc, B. et al. Evaluation of sintered bauxite proppant for binary enhanced geothermal systems. Geomech. Geophys. Geo-Energy Geo-Resour.10(1), 21. 10.1007/s40948-023-00719-9 (2024). [Google Scholar]
- 8.Porlles, J. W., Tomomewo, O. S., Afari, S. A., et al. An experimental study of the effect of long-term time-dependent proppant behavior under HP-HT reservoir conditions. In SPE Annual Technical Conference and Exhibition, D021S016R003 (SPE, 2023). 10.2118/215120-MS.
- 9.Al Balushi, F., Zhang, Q. & Dahi Taleghani, A. Autonomous fracture conductivity using expandable proppants in enhanced geothermal systems. SPE J.28(05), 2660–2674. 10.2118/215823-PA (2023). [Google Scholar]
- 10.Tomac, I. & Sauter, M. A review on challenges in the assessment of geomechanical rock performance for deep geothermal reservoir development. Renew. Sustain. Energy Rev.82, 3972–3980. 10.1016/j.rser.2017.10.077 (2018). [Google Scholar]
- 11.Qin, Q. et al. Experimental and simulation study on deep reservoir fracturing technology: A review and future perspectives. Geoenergy Sci. Eng.242, 213209. 10.1016/j.geoen.2024.213209 (2024). [Google Scholar]
- 12.Bandara, K. M. A. S., Ranjith, P. G. & Rathnaweera, T. D. Improved understanding of proppant embedment behavior under reservoir conditions: A review study. Powder Technol.352, 170–192. 10.1016/j.powtec.2019.04.056 (2019). [Google Scholar]
- 13.Lee, D. S. & Yasuhara, H. An evaluation of the effects of fracture diagenesis on hydraulic fracturing treatment. Geosyst. Eng.16(2), 113–118. 10.1080/12269328.2013.780721 (2013). [Google Scholar]
- 14.Luo, Z. et al. Modeling of pressure dissolution, proppant embedment, and the impact on long-term conductivity of propped fractures. J. Petrol. Sci. Eng.186, 106693. 10.1016/j.petrol.2019.106693 (2020). [Google Scholar]
- 15.Zhu, D. et al. Feasibility analysis on the pilot test of acid fracturing for carbonate reservoirs in Halfaya Oilfield, Iraq. Energy Sci. Eng.7(3), 721–729. 10.1002/ese3.316 (2019). [Google Scholar]
- 16.Zhu, J. et al. Experimental study on flow heterogeneity of shale bedding fractures based on full-diameter cores. Pet. Explor. Dev.50(5), 1187–1195. 10.1016/S1876-3804(23)60345-6 (2023). [Google Scholar]
- 17.Man, S. & Wong, R.C.-K. Compression and crushing behavior of ceramic proppants and sand under high stresses. J. Petrol. Sci. Eng.158, 268–283. 10.1016/j.petrol.2017.08.053 (2017). [Google Scholar]
- 18.Bandara, K. M. A. S., Ranjith, P. G. & Rathnaweera, T. D. Laboratory-scale study on proppant behaviour in unconventional oil and gas reservoir formations. J. Nat. Gas Sci. Eng.78, 103329. 10.1016/j.jngse.2020.103329 (2020). [Google Scholar]
- 19.Bandara, K. M. A. S., Ranjith, P. G. & Rathnaweera, T. D. Proppant crushing mechanisms under reservoir conditions: Insights into long-term integrity of unconventional energy production. Nat. Resour. Res.28(3), 1139–1161. 10.1007/s11053-018-9433-1 (2018). [Google Scholar]
- 20.Altuhafi, F. N., Baudet, B. A. & Coop, M. R. Plastic deformation effect on contact behaviour in granular materials. Granul. Matter26, 34. 10.1007/s10035-024-01400-8 (2024). [Google Scholar]
- 21.Li, H. et al. A new constitutive model for calculating the loading-path dependent proppant deformation and damage analysis of fracture conductivity. J. Nat. Gas Sci. Eng.46, 365–374. 10.1016/j.jngse.2017.07.027 (2017). [Google Scholar]
- 22.Anaya, R. et al. Individual diametral compression behavior of a ceramic proppant. Ceram. Int.48(22), 32357–32365. 10.1016/j.ceramint.2022.07.156 (2022). [Google Scholar]
- 23.Tang, Y., Ranjith, P. G. & Perera, M. S. A. Major factors influencing proppant behaviour and proppant-associated damage mechanisms during hydraulic fracturing. Acta Geotech.13(4), 757–780. 10.1007/s11440-017-0588-1 (2018). [Google Scholar]
- 24.Sanchez, D. et al. Experimental characterization of time-dependent mechanical behaviours of frac sand at high compressive stresses and implication on long-term proppant conductivity. Geomech. Geophys. Geo-energy Geo-resour.8, 85. 10.1007/s40948-022-00445-8 (2022). [Google Scholar]
- 25.Zheng, W., Silva, S. C. & Tannant, D. D. Crushing characteristics of four different proppants and implications for fracture conductivity. J. Nat. Gas Sci. Eng.53, 125–138. 10.1016/j.jngse.2018.02.027 (2018). [Google Scholar]
- 26.Fan, F. et al. Hydrophobic epoxy resin coated proppants with ultra-high self-suspension ability and enhanced liquid conductivity. Pet. Sci.18(5), 1753–1759. 10.1016/j.petsci.2021.08.012 (2021). [Google Scholar]
- 27.Ding, J. et al. Acoustic velocity and permeability of acidized and propped fractures in shale. Geophysics87(2), MR13–MR24. 10.1190/geo2020-0586.1 (2021). [Google Scholar]
- 28.Bandara, K. M. A. S., Ranjith, P. G. & Kumari, W. G. P. A coupled X-ray imaging and experimental permeability study of propped hydraulically induced fractures. Rock Mech. Rock Eng.55(5), 2581–2596. 10.1007/s00603-021-02406-1 (2021). [Google Scholar]
- 29.Zhang, T. et al. Breakage behavior of silica sands during high-pressure triaxial loading using X-ray microtomography. Acta Geotech.18(9), 5195–5211. 10.1007/s11440-023-01912-7 (2023). [Google Scholar]
- 30.Ahamed, M. A. A. et al. Investigating the proppant damage mechanisms expected in a propped coal fracture and its effect on fracture flow. J. Petrol. Sci. Eng.198, 108170. 10.1016/j.petrol.2020.108170 (2021). [Google Scholar]
- 31.Miskimins, J. L. & Prasad, H. C. Fracturing fluid effects on Young’s modulus and embedment in the Niobrara Formation. In SPE Hydraulic Fracturing Technology Conference. Society of Petroleum Engineers (2014). 10.2118/168620-MS.
- 32.Reinicke, A. et al. Hydraulic fracturing stimulation techniques and formation damage mechanisms—Implications from laboratory testing of tight sandstone–proppant systems. Geochemistry70(1), 107–117. 10.1016/j.chemer.2010.05.001 (2010). [Google Scholar]
- 33.Cao, H. et al. The characterization of incline-induced flow conductivity in shale’s proppant-packed crack: Lab-scale study. Fuel357, 129675. 10.1016/j.fuel.2023.129675 (2024). [Google Scholar]
- 34.Wang, J. et al. The influence of proppant breakage, embedding, and particle migration on fracture conductivity. J. Petrol. Sci. Eng.193, 107385. 10.1016/j.petrol.2020.107385 (2020). [Google Scholar]
- 35.Xiao, H. et al. Experimental study on proppant diversion transportation and multi-size proppant distribution in complex fracture networks. J. Petrol. Sci. Eng.196, 107800. 10.1016/j.petrol.2020.107800 (2021). [Google Scholar]
- 36.Hu, X. et al. Effect of proppant addition schedule on the proppant distribution in a straight fracture for slickwater treatment. J. Petrol. Sci. Eng.167, 110–119. 10.1016/j.petrol.2018.03.089 (2018). [Google Scholar]
- 37.Zhang, B. et al. On the correlation between proppant addition strategy and distribution. Gas Sci. Eng.117, 205060. 10.1016/j.jgsce.2023.205060 (2023). [Google Scholar]
- 38.Sun, W. et al. Propagation of interfered hydraulic fractures by alternated radial-circumferential extensions and its impact on proppant distribution. Int. J. Rock Mech. Min. Sci.181, 105838. 10.1016/j.ijrmms.2024.105838 (2024). [Google Scholar]
- 39.Wang, X., Saha, S. & Ghaednia, H. A review of elastic–plastic contact mechanics. Appl. Mech. Rev.69(6), 1–30. 10.1115/1.4038187 (2017). [Google Scholar]
- 40.Sheshde, E. A., Cheshomi, A. & Gharechelou, S. Estimation of mode I static fracture toughness of carbonate rock using small rock fragments. J. Petrol. Sci. Eng.218, 110980. 10.1016/j.petrol.2022.110980 (2022). [Google Scholar]
- 41.Crosson, R. S. & Lin, J.-W. Voigt and reuss prediction of anisotropic elasticity of dunite. J. Geophys. Res.76(2), 570–578. 10.1029/JB076i002p00570 (1971). [Google Scholar]
- 42.Pothana, P., Garcia, F. E. & Ling, K. Effective elastic properties and micro-mechanical damage evolution of composite granular rocks: Insights from particulate discrete element modelling. Rock Mech. Rock Eng.57(8), 6567–6611. 10.1007/s00603-024-03863-2 (2024). [Google Scholar]
- 43.Ren, M., Zhao, G. & Zhou, Y. Elastic stress transfer model and homogenized constitutive equation for the multi-phase geomaterials. Eng. Geol.306, 106631. 10.1016/j.enggeo.2022.106631 (2022). [Google Scholar]
- 44.Nishiyama, N. & Yokoyama, T. Permeability of porous media: Role of the critical pore size. J. Geophys. Res. Solid Earth122(9), 6955–6971. 10.1002/2017JB014332 (2017). [Google Scholar]
- 45.Wu, X. et al. Influence of confining pressure-dependent Young’s modulus on the convergence of underground excavation. Tunn. Undergr. Space Technol.83, 135–144. 10.1016/j.tust.2018.09.034 (2019). [Google Scholar]
- 46.Xie, H. et al. Experimental study on rock mechanical behavior retaining the in situ geological conditions at different depths. Int. J. Rock Mech. Min. Sci.138, 104548. 10.1016/j.ijrmms.2020.104548 (2021). [Google Scholar]
Associated Data
This section collects any data citations, data availability statements, or supplementary materials included in this article.
Data Availability Statement
The datasets used and/or analyzed during the current study available from the corresponding author upon reasonable request.