

Abstract
Nonlinear dynamic response analysis of pile foundations is essential in seismic regions, where soil–pile–structure interaction governs safety and serviceability. Ethiopia’s location along the African and Arabian tectonic plates exposes its infrastructure to high seismic risk, demanding rigorous foundation evaluation. This study investigates the pile foundations of Bridge B-40, part of the Awash–Kombolcha–Hara Gebeya railway project in the seismically active Afar Triangle (PGA = 0.3 g). Using PLAXIS 3D, with the Hardening Soil model at small strains and the Hoek–Brown model for rock, site-specific geotechnical and seismic data were incorporated to simulate static and dynamic conditions. Static analysis showed negligible settlement (0.55 mm), with stresses far below capacity. Free-field site response and free-vibration analyses established natural frequencies and captured seismic amplification effects. Under dynamic loading, ground accelerations varied between 24 and 136 cm/s2, and pile head displacement reached 91.24 mm, within structural limits. However, the maximum immediate settlement of 95.81 mm exceeded Eurocode serviceability criteria, signaling performance concerns despite adequate stability. Differential settlements between pile caps remained low (3.5–4.95 mm), and vertical stresses did not approach failure. These findings highlight the importance of nonlinear soil behavior in pile foundation design.
Supplementary Information
The online version contains supplementary material available at 10.1038/s41598-025-23445-6.
Keywords: Nonlinear dynamic analysis, Pile foundation, Seismic response, Finite element analysis
Subject terms: Geodynamics, Engineering, Civil engineering
Introduction
Over the past several years, Ethiopia has been hit by earthquakes due to its location on major tectonic plates, specifically the African and Arabian plates. In recent decades, Ethiopia has been striving for holistic development, strongly emphasising infrastructure construction as a foundation for this growth. Unfortunately, many of these large-scale infrastructure projects are situated in or near some of the country’s most seismically active regions, where the occurrence of earthquakes are common1,2. As built environments and human activities expand in these areas, the probabilistic risk of seismic damage and loss of life increases3.
Pile foundations in seismically active areas have focused on understanding the dynamic interactions between piles, soil, and adjacent structures. Numerical modelling techniques, such as 3D finite element analysis, have been used to evaluate pile behavior under dynamic loads, considering factors like excitation frequency, soil properties, and pile geometry4. Studies have also examined the dynamic interaction between multiple foundations on stratified soil, emphasizing the importance of layer depth, soil damping, and foundation spacing5,6.
Recent studies have highlighted the importance of considering both inertial and kinematic effects in the seismic design of pile foundations. Chiou et al.7 proposed a pseudo-static approach that combines inertial and kinematic loadings, while Garala and Madabhushi8 conducted centrifuge experiments to investigate their individual effects on pile behavior. The phase relationship between these loads aligned with conventional force-displacement patterns in damped oscillators. Chiou et al.9 developed a combined dynamic analysis model, verified through centrifuge testing, which demonstrated the significant influence of ground movement on structural acceleration and pile bending responses. Chimdesa et al.6 emphasized the need to consider stiffness degradation in soil-pile interaction analyses during earthquakes. Collectively underscore the complex interplay between inertial and kinematic effects, soil-pile-structure interaction, and ground motion characteristics in determining the seismic response of pile foundations10–12.
This study presents 3D dynamic analysis using PLAXIS3D to evaluate the seismic response of pile foundations for a bridge in the Awash-Kombolcha-Haragebeya railway project, located in Ethiopia’s seismically active Afar Triangle (PGA = 0.3 g). By integrating site-specific geotechnical and seismic data with advanced HS-small and Hoek-Brown models, the analysis captures realistic soil-structure interaction, damping behavior, and layered soil effects. The pile foundations are subjected to both static vertical load and dynamic ground acceleration to simulate actual field conditions.
Location and local geology
The study examines Bridge B-40 (336 m long) on the Awash-Kombolcha-Hara Gebeya railway (km 254 + 727 to 255 + 063), which spans a river in the seismically active highlands of Ethiopia. The Awash–Kombolcha–Hara Gebeya railway traverses varied volcanic deposits (Tas) from the Paleogene to the Quaternary periods12–14.
The foundation of Bridge B-40 consists of thick alluvium (Qal-A: comprising clay, silt, and sand) overlain by riverbed deposits (Qal-R: consisting of granular soils with clay layers). Site geology is shown in Fig. 1a, b.
Fig. 1.

Geological profile (a) geological map and (b) cross-section of bridge B-40.
Methods
A geotechnical investigation was conducted at the project site, comprising nine boreholes that corresponded with proposed pile foundation locations, excluding borehole 10. Geophysical surveys supplemented subsurface characterization, particularly for the shallow foundation between boreholes 01 and 03, which rests on a competent basaltic layer. Field testing, including SPT and Shelby tube sampling, as well as laboratory analysis of borehole samples, was performed to evaluate the ground conditions.
Standard penetration testing (SPT), pressure meter tests, and geophysical survey
SPT were conducted at 1.5 m intervals. N-values were corrected for overburden pressure, dilatancy (for saturated fine-grained cohesionless soils with N > 15), and energy transfer efficiency. Overburden correction was applied primarily to cohesionless soils.
The SPT N-value in sandy soils is affected by overburden pressure. Gibbs and Holtz15 introduced a method to normalize  -values to a standard overburden pressure (Eq. 1).
 |
1 |
Peck et al.16 proposed a relationship to predict  as a function of adequate overburden pressure,
 (Eq. 2).
 |
2 |
Terzaghi and Peck17 noted that dilatancy can lead to overestimated penetration resistance in saturated fine-grained soils with N-values greater than 15. To compensate for this, a reduction in the measured N-value is suggested (Eq. 3).
 |
3 |
Note that, when  and N″ is the final corrected SPT value used in the design.
Various correlations have been developed to utilize the energy-corrected SPT count (N60), which accounts for energy transfer efficiency during the SPT process (Eq. 4).
 |
4 |
Where  is the energy correction factor.
Equation 5 measured N blow counts may additionally be adjusted to an adequate overburden pressure of 100 kPa, which produces the 16.
16.
 |
5 |
In addition to correcting for overburden pressure, SPT values must be adjusted for the water table in the case of fine sand or silt located below the groundwater table (Eq. 6).
 |
6 |
The weighted average SPT-N values and shear wave velocities within the defined depth can be computed as follows: Eq. 718.
 |
7 |
Where 
 |
.
SPT N-values were corrected for borehole diameter (CB = 1.0 for 89 mm), sampler type (CS = 1.0), and energy efficiency (CE = 0.9 for automatic trip hammer) based on soil classification. Pressure-meter tests were performed at selected depths in cohesive layers within boreholes 04, 05, 07, 08, and 10. Four seismic refraction surveys, each with a 96 m spread and 4.5 Hz geophones at 2 m intervals, used an 18-kg hammer as the energy source. Average shear wave velocities (Vs,30) were computed per Eq. 8. This parameter represents the travel time of shear waves from 30 m depth to the surface. The average shear wave velocity to any depth z can be calculated using a depth-weighted approach, as shown in Eq. 919.
 |
8 |
 |
9 |
Where z is the depth, the average shear wave velocity is calculated.
Laboratory tests
Laboratory tests on selected samples included grain size distribution, Atterberg limits, natural water content, unconfined compression, and unconsolidated undrained tests. The results are used to derive material parameters for numerical analysis, as detailed in the next section.
Input material properties
The HS-small model was adopted in PLAXIS due to its proven effectiveness in capturing far-field seismic response, while the Hoek-Brown model was employed for modelling rock behaviour. Seismic loading was applied under undrained conditions using effective stress parameters. The modulus reduction and damping behaviour in the HS-small model were defined based on the formulations of Hardin and Drnevich20 and Vucetic and Dobry21, corresponding to a plasticity index of 50%. An interface strength reduction factor, (Rinter) of 0.7, was assigned to account for the reduced shear strength and stiffness at the soil-structure interface, as recommended by PLAXIS for soft clay conditions. Model parameters are summarized in Table 1 and further detailed in the Supplementary Information.
Table 1.
Basalt rock parameters for the Hoek-Brown model.
| Parameter | Symbol | Unit | Magnitude |
|---|---|---|---|
| Stiffness parameters | |||
| The rock mass Young’s modulus |

|
kPa | 79.93E3 |
| Poisson’s ratio | ν | – | 0.28 |
| Mohr Coulomb fit | |||
| Cohesion | c | kPa | 196 |
| Friction angle | φ | ° | 29.19 |
| Hoek-Brown parameters | |||
| Uni-axial compressive strength of intact rock |

|
kPa | 5E3 |
| Intact rock parameter |

|
– | 25 |
| Geological strength Index | GSI | – | 20 |
| Disturbance factor | D | – | 0 |
| Hoek-Brown criteria | |||
| Rock mass parameter |

|
– | 1.436 |
| Rock mass parameter | s | – | 1.3179E-4 |
| Rock mass parameter | a | – | 0.544 |
| Rock mass parameters | |||
| Rock mass tensile strength |

|
kPa | -0.4803 |
| Rock mass uni-axial compressive strength |

|
kPa | 0.04E3 |
| Rock quality designation | RQD | % | 27.30 |
| Other parameters | |||
| Dilatancy angle |

|
° | 9.77 |
| Undrained behavior | – | – | Standard |
Damping parameters
The HS-small model captures hysteretic behavior but may underpredict damping at low strains. To enhance dynamic response accuracy, Rayleigh damping was applied to represent viscous damping. Coefficients were determined using the method of Rahman and Gupta22, with target frequencies set to the soil average natural frequency and a higher frequency to avoid overdamping. Dynamic loading used the El Centro earthquake (2.5 Hz, 5% damping) to emphasize low-frequency energy.
Seismicity of the study area
A peak ground acceleration (PGA) of 0.3 g was adopted based on regional seismicity and ICOLD guidelines23,24, aligning with values used in similar studies (e.g., Tendaho dam). El Centro earthquake ground motion was scaled using a correction factor to match the target PGA. The adjusted time history is presented in Fig. 2.
Fig. 2.

Modified time history based on El Centro data.
Model geometry
To minimize boundary effects, site conditions were modeled using nine boreholes with varying soil layers in a 5,600 m2 (400 m × 14 m) rectangular domain. The gorge-shaped soil profile extends to − 80 m, with borehole elevations connected linearly in PLAXIS 3D (Fig. 3). Bedrock underlies the central span, while other foundations rest on varying soil types. Pile caps and piles were modeled at depths based on the bridge design.
Fig. 3.

Geometry model using PLAXIS 3D V.20 (https://www.bentley.com/software/plaxis-3d/).
Simulation of abutments
The bridge includes two abutment types: an 8.6 m hollow abutment on piles (abutment type 1) and a 14.5 m abutment at Borehole 09 (abutment type 2), both modeled as size elements (Table 2). For the hollow abutment, internal cavities were included in the volume element to represent its mass and stiffness distribution realistically. Material properties corresponding to reinforced concrete were assigned, and soil-structure interaction was modeled using an interface strength reduction factor (Rinter = 0.7). This accurately captures the reduced shear strength at the interface. The foundation system comprises a shallow footing and eight pile foundations connected to steel piers via concrete pedestals. Foundations were modeled as volume elements, and piles as embedded beams, with pre-calculated axial skin and base resistance.
Table 2.
Material properties used for the simulation of abutment 1 and abutment 2.
| Parameters | Symbol | Abutment 1 | Abutment 2 |
|---|---|---|---|
| Material model | Model | Linear Elastic | Linear Elastic |
| Drainage type | Type | Non-porous | Non-porous |
| Unit weight |

|
24 | 24 |
| Young’s modulus |

|
3E7 | 3E7 |
| Poisson’s ratio |

|
0.15 | 0.15 |
| Lateral earth pressure coefficient |

|
0.50 | 0.50 |
| Rayleigh parameters | |||
| α | – | 0.2320 | 0.2320 |
| β | – | 8E-3 | 8E-3 |
Where α-represent the mass-proportional damping coefficient and β represents the stiffness-proportional damping coefficient.
Static loads
To evaluate the bridge serviceability, components such as waterproofing and ballast are applied as surface loads (see Fig. 4a). Sleepers are modeled using beam elements spaced 0.60 m apart along the x-direction. Simplifications are incorporated to streamline the analysis, and the major load components are detailed in Table 3.
Fig. 4.

Soil model with structural and loading components (a) and Meshing (b) using PLAXIS 3D V.20 (https://www.bentley.com/software/plaxis-3d/).
Table 3.
Static load on the bridge deck from sleeper provision.
| Parameter | Symbol | Steel beam | Unit |
|---|---|---|---|
| Material type | Type | Elastic | – |
| Young’s modulus | E | 210E6 | kN/m2 |
| Volumetric weight | γ | 78.50 | kN/m3 |
| Cross-sectional area | A | 0.0396 | m2 |
| Length | L | 2.40 | m |
| Moment of Inertia |

|
0.11E−3 | m4 |

|
0.16E−3 | m4 |
Dynamic analysis and mesh generation
The PLAXIS 3D model employs 15-node triangular elements. Appropriating loading and boundary conditions were applied after defining soil and structural geometry and assigning material properties (Fig. 4a). Based on a minimum shear wave velocity of 263 m/s and a 5 Hz input frequency, a target element size of 19.56 m was calculated. A fine mesh with an average size of 6.122 m (element size factor 0.67) was used to ensure accurate wave propagation (Fig. 4b). The critical time step was determined from the element size and material stiffness. For seismic shear wave loading, Newmark parameters C₁ = 1 and C₂ = 0.25 were applied. The El Centro earthquake acceleration history was used at the bedrock as prescribed displacement. Boundary conditions included static fixities, viscous dampers, free-field elements, and a compliant base.
Results and discussion
Static analysis
The 3D static analysis of the railway bridge pile foundation considers load distribution among piles and the influence of layered soils along the boreholes. Piles 02, 03, 04, and 05 (arranged in a 2 × 1 group) encounter loads greatest at 55.12 to 30.85 kN per pile. At the same time, the axial forces on the other piles are much lower, ranging from 13.59 to 6.75 kN.
The foundation piles are supported by a layer of soil consisting of firm to very stiff silty clay/clayey silt (N = 10–43), dense to very dense sandy gravel (N = 18–36), and basalt bedrock. The resistance to tipping (end-bearing) and friction (skin friction) in the layer of soil allows the foundation to handle the maximum Vertical stress effectively. This vertical stress comprises the effective stress from soil self-weight and the induced stress resulting from pile load effects, as shown in Fig. 5.
Fig. 5.

Effective vertical stress with depth below pile caps.
The results calculated for settlement values are acceptable and keep the bridge stable. Based on Eurocode EN 1997-1 (2004), sandy soil structures can allow for a total settlement of 50 mm, and clayey soil can have up to 75 mm. Since elastic settlement constitutes only a minor portion of the total settlement, the evaluated elastic displacements (Fig. 6a and b) remain within these permissible limits.
Fig. 6.

Ground settlement (a) and maximum displacement (b).
Free field analysis
A free-field ground response analysis is a prerequisite for analyzing pile foundation seismic response. This analysis quantifies soil behavior under seismic excitation, including shear wave propagation, site amplification, and maximum ground displacement. Additionally, it assesses soil stiffness and strength degradation due to pore water pressure.
The site amplification factor is calculated as (Eq. 10):
 |
10 |
Where amax (0, t) is peak surface acceleration and amax(H, t) is peak acceleration at the bedrock level.
Three-dimensional analysis
A nonlinear model, utilizing the HS small-strain model available in PLAXIS 3D, was selected to investigate how stress is redistributed within the soil during an earthquake. The analysis examined three main points: bedrock, pile head, and the ground surface. All the boreholes are represented with the accelerogram records at three levels, as shown in Fig. 7a–c.
Fig. 7.
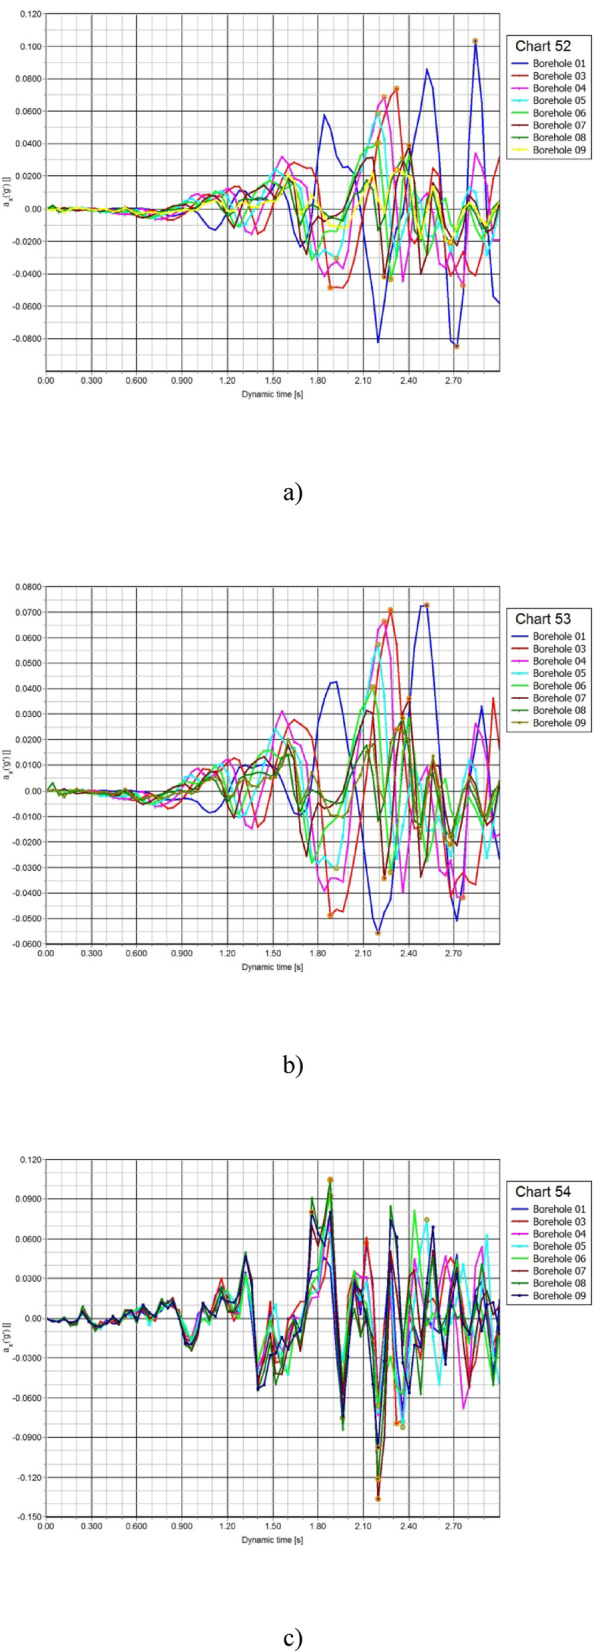
Free-field acceleration at ground surface (a), pile head (b), and bedrock (c).
As seismic waves propagate from the bedrock through the soil layers, they attenuate or amplify, influencing ground acceleration and shaking. The thickness and density of these layers play a vital role in structural response, with wave amplitude diminishing due to attenuation effects as distance from the seismic source increases. The reaction of basalt at Z = -80 m in all boreholes shows a similar wave pattern. However, maximum ground acceleration varies between 72.55 and 136.44 (Fig. 7a). In contrast, ground acceleration at the pile head level and ground surface differ across boreholes due to material arrangement and density variations, with maximum values ranging from 23.96 to 103.22 (Fig. 7b).
The soil layers above the bedrock are mainly dense silty clay and sandy gravel, which improve damping (Fig. 7c). Moreover, the deep seismic wave source (Z = -80 m) and the attenuation properties of these materials help reduce peak ground acceleration, minimizing extremely localized shaking. However, pile 01 shows an amplification factor of 1.37, while all remaining piles have factors below 1.
Peak surface accelerations influence bridge structures, but the frequency content of seismic waves is equally critical in assessing their response. Different boreholes exhibit varying frequencies and peak accelerations at the pile head level and ground surface, as shown in Fig. 8a, b. Boreholes 03 and 09 have a frequency of 1.32 Hz, with peak accelerations ranging from 67.33 to 121.24 × 10⁻³m/s2. Boreholes 04, 05, and 06 follow with 1.65 Hz, experiencing peak accelerations between 64.28 and 115.72 × 10⁻³m/s2. Pile 01, at 1.97 Hz, records the highest acceleration, ranging from 85.95 to 135.87 × 10⁻³m/s2. Boreholes 07 and 08, with 3.95 Hz, show peak accelerations ranging from 78.83 to 92.63 × 10⁻³m/s2.
Fig. 8.

Power spectra at ground surface (a) and pile cap locations (b).
Response spectrum analysis, particularly Peak Spectral Acceleration (PSA) at 5% damping, provides critical insights into maximum structural response, with variations across bridge supports influencing seismic behavior. PSA spectra at the ground surface and pile head levels, with key values detailed in Fig. 9a, b. Peak acceleration periods indicate when Single-Degree-of-Freedom (SDOF) systems resonate with earthquake vibrations, amplifying motion and increasing structural stress. These natural periods depend on stiffness and damping ratios, which define a structure resistance to deformation and energy dissipation.
Fig. 9.
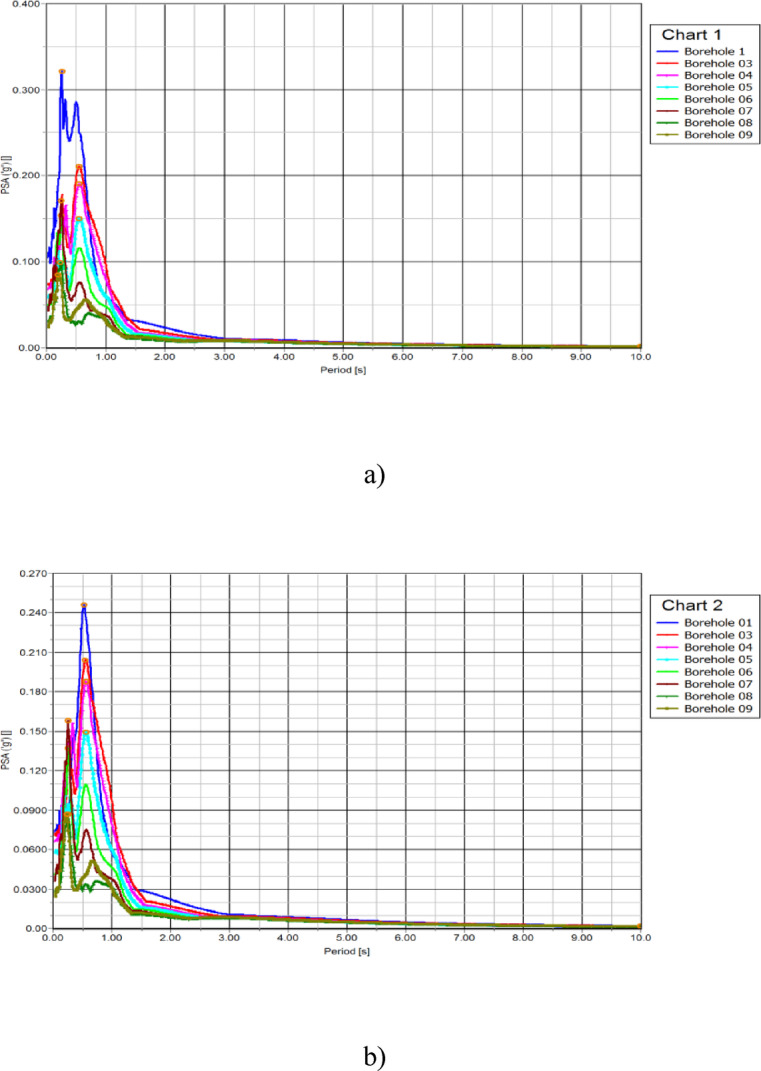
PSA response spectrum at borehole surface (a) and pile head levels (b).
The analysis of PSA across boreholes shows variations in seismic response. Borehole 01 has the highest PSA, with 321.38 × 10⁻³ g at the surface and 245.85 × 10⁻³ g at the pile head. Boreholes 03, 04, and 05, with periods 0.55–0.56 s, show progressively lower PSA values. Boreholes 06 and 07 (0.25 s) exhibit moderate seismic response, while Borehole 08 (0.24 s) has the lowest PSA. Borehole 09 (0.20 s) records minimal seismic impact.
PSA borehole response and maximum lateral displacement are interconnected in seismic analysis. Higher PSA values often correlate with greater ground displacement, as stronger shaking leads to increased movement of soil and structures (Fig. 10). Borehole data support assessing variations in local site conditions, stiffness, and wave attenuation, influencing PSA and displacement behaviour. Additionally, the frequency-dependent nature of PSA determines how different soil layers and structural components react to seismic forces, affecting overall stability. Understanding these relationships is essential for mitigating seismic risks.
Fig. 10.

Lateral displacement at ground surface and pile head levels.
Free vibration analysis
A free vibration analysis was performed to determine the structure’s natural frequency. A unit load of 1 kN/m was applied to the top-left corner of Abutment 01 for 3 s, after which the structure was allowed to vibrate freely. As an N-degree-of-freedom (N-DOF) system, the structure exhibits N natural frequencies, each corresponding to a unique mode shape. For seismic analysis, emphasis is placed on the dominant natural frequencies that most significantly influence the dynamic response of the bridge. These frequencies are identified by evaluating lateral accelerations at critical structural locations, including the bridge deck, pile cap, and pile tips. The resulting dynamic behavior is illustrated in Fig. 11a–c.
Fig. 11.

Free vibration frequencies of the bridge at (a) deck, (b) pile caps, and (c) pile tips.
Seismic response analysis
After determining natural frequencies, complete dynamic time-history analysis was conducted by applying the input ground motion, inducing structural deformation due to seismic loading. Structural responses, including acceleration and displacement, were monitored for each borehole location. Two pile head and tip nodes were observed for each borehole location, with time-acceleration histories presented in Fig. 12a and b.
Fig. 12.

Time-acceleration curves at (a) pile head and (b) pile tip.
Soil–structure interaction significantly modifies foundation response relative to free-field motion, leading to amplification and de-amplification. Amplification arises from inertial effects and structural rocking, while de-amplification occurs due to kinematic factors: rigid-body motion of stiff foundations, depth-dependent motion filtering in embedded systems, and high-frequency scattering at foundation edges25,26.
For Borehole 01, peak accelerations of 0.26 g at the pile cap and 0.01 g at the pile tip occur at 14.6 s and 15 s, respectively, a 20-fold amplification at the cap, corresponding to a force of 2.52 m/s2. This illustrates the upward reduction in seismic force, contributing to improved foundation performance. High-damping soils further mitigate lateral loads on pile caps. The interplay of superstructure inertia and soil kinematics governs lateral pile displacement, a critical factor for seismic safety.
Pile head deflection varies based on their attachment to the pile cap, fixed-head or free-head, with most having undetermined fixity. This study treats piles as fixed heads, integrated into pile caps, and simulated using fixed connections. Fixed-head piles fail by translation, free-head by rotation. Pile length also influences deflection mechanisms. Lateral displacement contours and deflections at the pile head and tip levels are shown in Fig. 13a–c. The deflection of piles around the periphery and center of the pile cap varies slightly, with differences in lateral displacements being less than 1 mm. These minor deviations for pile cap 01 are shown in Fig. 14.
Fig. 13.

Lateral displacement of the model (a), time-displacement curves at the pile head (b) and pile tip (c).
Fig. 14.

Deflection variation of piles at center and periphery (pile cap 01).
The maximum horizontal displacements at the pile head, middle pile, and pile tip at 9.00s are 91.24 mm, 98.58 mm, and 93.29 mm, respectively, all below the permissible lateral deflection limit of 2.54 cm27. Excessive and differential settlements of piles should be assessed to avoid superstructure failure and ensure serviceability. The vertical displacement contour is shown in Fig. 15a, with the maximum immediate settlement of the pile cap being 95.81 mm at 11.80s.
Fig. 15.

Vertical displacement (a) and Cartesian effective vertical stress (b).
The maximum settlement of 95.81 mm exceeds the recommended limits for sandy and clayey soils (50 mm and 75 mm, respectively, per EN 1997-128. According to IEC29 guidelines, this settlement should not surpass 2% D (where D is the pile diameter). For piles with 1.00 m and 1.20 m diameters, permissible settlements are 20 mm and 24 mm, respectively. Settlements under the other seven pile caps are lower.
The settlements of piles under pile caps exceed the requirements, indicating excessive settlement. Differential settlement impacts stability and functionality. Observations show 3.51 mm differential settlement between the edges of pile cap 01, 4.42 mm between pile cap 01 and its adjacent cap, and 4.95 mm between extreme abutment piles. Pile load capacity is crucial for structural stability, deriving from end bearing and skin resistance to support vertical stresses below pile tips. The vertical stress contours are shown in Fig. 15b.
The induced vertical loads are lower than the pile load capacities. The stresses at the bearing level are also below the pile end bearing capacities. Thus, the piles can sustain stresses from superstructural and earthquake loads by mobilizing some of their bearing capacities (see Fig. 16a). In seismically active areas, pile foundations must withstand lateral loading from large displacements due to strong earthquakes. The ultimate lateral resistance of piles is computed analytically and shown in Fig. 16b.
Fig. 16.

Pile load capacity versus applied stress (a) and ultimate lateral resistance (b).
Conclusion
Based on the numerical simulation carried out on the pile foundation of the railway bridge structure resting on a layered soil system, the following conclusions are drawn:
The pile foundation demonstrated safe load distribution under static conditions, with minimal elastic settlements (0.55 mm) and stresses well below soil bearing capacities.
Despite variable ground accelerations (24–136 cm/s2), lateral displacements (≤ 93 mm) and structural frequencies (1.3–4 Hz) remained within permissible limits, ensuring seismic resilience.
Piles around the periphery and center of the pile cap have deflections that differ by less than 1 mm. Following seismic loadings, the maximum lateral deflection at the pile head is 91.24 mm, within permissible limits.
The maximum immediate settlement of the pile cap is 95.81 mm at 11.80s, exceeding the recommended permissible total settlement. Some settlements may rebound after ground shaking, but this still significantly impacts the serviceability and safety of the structures.
The maximum differential settlement between the extreme abutment piles is 4.95 mm. Differential settlements of 3.51 mm and 4.42 mm are noted between the edges of the pile caps and the adjacent pile caps. Stresses at the foundation level are below the bearing capacities, allowing the piles to sustain vertical stresses from earthquake loading without bearing capacity failure.
This study considers one-directional horizontal seismic loading; future work may explore complete 3D wave propagation and interference effects. As the structure is newly constructed, only short-term settlements are analyzed, with long-term consolidation to be addressed in future studies. Observed settlement patterns, where pile heads settle more than tips, suggest potential buckling in long piles, an aspect for further investigation.
Supplementary Information
Below is the link to the electronic supplementary material.
Author contributions
All the authors contributed to the conception and design of the study. T.G: Data curation, software, validation, methodology, investigation, writing-original draft, writing-review, and editing. E.A: Administration, conceptualization, supervision, methodology analysis, investigation, formal analysis, writing – original draft, writing–review, and editing. N.Z.J: Software, methodology analysis, Formal analysis, writing–review and editing. S.M.A: Administration, conceptualization, supervision, methodology analysis, investigation, formal analysis, writing – original draft, writing–review, and editing.L.P: Formal analysis, Writing–review and editing. C.S: Formal analysis, Writing–review and editing. H.M: Formal analysis, Writing–review and editing. The authors have read and approved the final manuscript.
Data availability
The data used to support the findings of this study are included in this article.
Declarations
Competing interests
The authors declare no competing interests.
Footnotes
Publisher’s note
Springer Nature remains neutral with regard to jurisdictional claims in published maps and institutional affiliations.
References
- 1.Kinde, S., Engeda, S., Kebede, A. A. & Tessema, E. A. Technical notes: notes and proposed guidelines on updated seismic codes in Ethiopia - Implication for large-scale infrastructures. Zede J.28, 91–110 (2011). [Google Scholar]
- 2.Ayele, A., Woldearegay, K. & Meten, M. A review on the multi-criteria seismic hazard analysis of Ethiopia: with implications of infrastructural development. Geoenvironmental Disasters. 8, 9. 10.1186/s40677-020-00175-7 (2021). [Google Scholar]
- 3.Lamessa, G., Mammo, T. & K.Raghuvanshi, T. Homogenized earthquake catalog and b-value mapping for Ethiopia and its adjoining regions. Geoenvironmental Disasters. 6, 1–24 (2019). [Google Scholar]
- 4.Khalil, M. A. M., Hassan, A. M. & Elmamlouk, H. H. Dynamic behavior of pile foundations under vertical and lateral vibrations: review of existing codes and manuals. HBRC J.16, 39–58 (2020). [Google Scholar]
- 5.Kuo, K. K. A. & Hunt, H. E. M. Dynamic models of piled foundations. Appl. Mech. Rev.65, 31003 (2013). [Google Scholar]
- 6.Chimdesa, F. F. et al. Numerical analysis of pile group, piled raft, and footing using finite element software PLAXIS 2D and GEO5. Sci. Rep.13, 15875. 10.1038/s41598-023-42783-x (2023). [DOI] [PMC free article] [PubMed] [Google Scholar]
- 7.Chiou, J. S., Fu, Y. & Lee, Y-W. Pseudostatic analysis for seismic responses of extended piles considering inertial and kinematic effects. Eng. Struct. (2021).
- 8.Garala, T. K. & Madabhushi, G. S. P. Influence of phase difference between kinematic and inertial loads on seismic behaviour of pile foundations in layered soils. Can. Geotech. J. (2020).
- 9.Chiou, J. S., Hung, W. Y., Lee, Y. & Young, Z-H. Combined dynamic structure-pile-soil interaction analysis considering inertial and kinematic effects. Comput. Geotech.125, 103671 (2020). [Google Scholar]
- 10.Woldearegay, K. Review of the occurrences and influencing factors of landslides in the highlands of ethiopia: with implications for infrastructural development. 5, 3–31 (2013).
- 11.Spall, H. Earthquake history of Ethiopia and the Horn of Africa. Bull. Seismol. Soc. Am.71, 573–574. 10.1785/BSSA0710020573 (1981). [Google Scholar]
- 12.Assefa, E. et al. Discussion on the analysis, prevention and mitigation measures of slope instability problems: A case of Ethiopian railways. Electron. J. Geotech. Eng.21, 4101–4119 (2016). [Google Scholar]
- 13. Merkezi, Y. Awash-Kombolcha-Hara Gebeya Railway Project Alignment Geotechnical Report KM: 254 + 727 – 255 + 063 (2016).
- 14.Ethiopian Railways Corporation. (The National Railway Network of Ethiopia, 2011).
- 15.Gibbs, H. J. & Holtz, V. G. Research on determining the density of sands by spoon penetration testing. In Proc. 4th Int. Conf. Soil Mech. Found. Engg. London, 35 (1957).
- 16.Ralph, B., Peck, W. E. & Hanson, T. H. T. Foundation Engineering 2nd ed (Wiley Online Library, 1974).
- 17.Terzaghi, K., Ralph, B. & Peck, G. M. Soil Mechanics in Engineering Practice, 3rd ed. (Wiley Online Library, 1996).
- 18.Anbazhagan, P., Uday, A., Moustafa, S. S. R. & Al-Arifi, N. S. Correlation of densities with shear wave velocities and SPT N values. J. Geophys. Eng.13, 320–341 (2016). [Google Scholar]
- 19.Aung, A. M. W. & Leong, E. C. Application of weighted average velocity (WAVe) method to determine Vs,30. Soils Found.55, 548–558. 10.1016/j.sandf.2015.04.007 (2015). [Google Scholar]
- 20.Hardin, B. O. & Drnevich, V. P. Shear modulus and damping in soils: design equations and curves. J. Soil. Mech. Found. Div.98, 667–692. 10.1061/JSFEAQ.0001760 (1972). [Google Scholar]
- 21.Vucetic, M. & Dobry, R. Effect of soil plasticity on cyclic response. J. Geotech. Eng.117, 89–107. 10.1061/(ASCE)0733-9410(1991)117 (1991). [Google Scholar]
- 22.Rahman, M. H. & Gupta, C. Computation of Rayleigh damping coefficient of a rectangular submerged floating tunnel (SFT). SN Appl. Sci.2, 936. 10.1007/s42452-020-2629-z (2020). [Google Scholar]
- 23.Haile, H. S. Earthquake Induced Liquefaction Analysis of Tendaho earth-fill Dam Vol. 27 (Hadush Seged and Messele Haile Department of Civil Engineering, 2010).
- 24.Berhe, T. & Wu, W. Seismic performance analysis of Tendaho Earth fill dam, Ethiopia. 11, 2176 (2009).
- 25.Chopra, A. K. Dynamics of Structures: Theory and Applications to Earthquake Engineering (1995).
- 26.Stewart, J. Variations between foundation-level and free-field earthquake ground motions. Earthq. Spectra. 1610.1193/1.1586124 (2000).
- 27.Ghazavi, M., Mahmoodi, E. & El Naggar, H. Load–deflection analysis of laterally loaded piles in unsaturated soils. Acta Geotech.18, 2217–2238. 10.1007/s11440-022-01647-w (2023). [Google Scholar]
- 28.Eurocode-7. Eurocode 7: Geotechnical design- Part 1: General rules (2011).
- 29.IEC. Preliminary Pile Design for Loading Test (2009).
Associated Data
This section collects any data citations, data availability statements, or supplementary materials included in this article.
Supplementary Materials
Data Availability Statement
The data used to support the findings of this study are included in this article.