

Abstract
Background
To improve the precision of molecular diagnosis by means of a comprehensive bidirectional phenotypic and genotypic reanalysis in cases of unresolved monogenic diabetes previously investigated using a targeted next-generation sequencing (tNGS) panel.
Methods
Molecular and clinical data from 128 unresolved cases referred between 2011 and 2019 were analyzed. These included 92 cases of suspected maturity-onset diabetes of the young (MODY), 12 of neonatal diabetes, 16 of familial partial lipodystrophy (FPLD), 7 of mitochondrial diabetes, and 1 of Wolfram syndrome. All cases were initially investigated using a tNGS panel consisting of 51 nuclear genes and the complete mitochondrial genome.
Results
This extensive reanalysis process increases molecular diagnosis from 9 to 22%. Phenotypic reevaluation, entailing in-depth phenotyping, is instrumental in excluding 62 atypical cases (48.4%). Genotypic reanalysis identifies 5 previously overlooked molecular defects: two mutations in regulatory regions (one in the HNF1A promoter and another in the PTF1A enhancer); one in the MTTK mitochondrial gene; one in the MFN2 gene; and one in the GCK gene.
Conclusions
Our findings indicate that a combined approach of genotypic and, mainly, phenotypic reanalysis is an effective strategy for improving the accuracy of molecular diagnosis in individuals with suspected monogenic diabetes.
Subject terms: Diabetes, Genetic counselling, Diagnostic markers, Genetic testing, Next-generation sequencing
Plain language summary
Some people develop diabetes early in life due to inherited genetic conditions. However, identifying the exact cause can be difficult, and many people remain without a diagnosis after initial testing. In this study, researchers revisited the medical and genetic data of 128 individuals who were previously suspected to have a genetic form of diabetes but remained undiagnosed. By combining updated genetic tools with detailed clinical review, they were able to provide new diagnoses for some and rule out inherited diabetes in others. Because knowledge in genetics evolves rapidly, this study highlights the importance of reanalyzing past test results over time. Doing so can lead to more accurate diagnoses and better care for individuals and families affected by early-onset diabetes.
Franco et al. perform a combined phenotypic and genotypic reanalysis of unresolved 128 monogenic diabetes cases. Their approach increases diagnostic yield and highlights the key role of deep phenotyping in previously overlooked cases, and provides a diagnosis for suspected cases.
Introduction
Monogenic diabetes consists of a diverse array of phenotypes fundamentally characterized by hyperglycemia resulting from a single pathogenic genetic alteration1. Depending on the specific molecular defect, diabetes mellitus (DM) in these patients may develop due to impaired insulin production, issues with insulin signaling, or adiposopathy. The phenotypic spectrum ranges from non-syndromic phenotypes with insulin deficiency at birth (neonatal DM) or in early infancy/adulthood (maturity-onset diabetes of the young–MODY), to individuals with extreme insulin resistance due to adipose tissue disease (familial partial lipodystrophy–FPLD), and individuals with syndromic phenotypes, such as Wolfram syndrome and mitochondrial DM2,3. Collectively, these represent ~1–2% of all DM cases4.
Despite the critical role of accurate molecular diagnostics in enabling appropriate clinical management, genetic counseling, and early diagnosis of at-risk family members, a significant percentage of individuals clinically suspected of having monogenic diabetes still lack an established molecular etiology. Data on the proportion of unresolved cases are more substantial for MODY and neonatal DM, varying at around 50–80%1 and 20–37%5, respectively. Data from a monogenic DM cohort in Brazil have shown a similar proportion of unresolved cases even following multiple molecular investigations6–9.
In 2019, with the advances achieved in genetic research, the American College of Medical Genetics and Genomics (ACMG)10 recommended periodic reanalysis of genomic data as an effective means of improving diagnosis in individuals with suspected genetic diseases. Recognizing that phenotypes may change over time and that the understanding of the phenotypic spectrum of a condition may expand, this recommendation emphasizes the importance of incorporating a refined phenotypic assessment11 to clarify the potential genetic conditions of these patients.
The objective of the present study was to improve the rate of molecular diagnosis in a cohort of individuals suspected of having monogenic diabetes who still had no established molecular diagnosis following initial studies using next-generation sequencing panels (NGS). Consequently, a comprehensive bidirectional phenotypic and genotypic reanalysis was conducted to better understand the limitations of the initial approach, aiming to identify previously overlooked molecular variants and to refine phenotypic classifications by excluding atypical or inadequately classified cases.
In this reanalysis, we revisit 128 unresolved cases and observe an additional diagnostic yield ranging from 9 to 22%. This improvement is mainly driven by the identification of previously overlooked regulatory and mitochondrial variants, along with the recognition of atypical phenotypes. These results highlight the diagnostic value of combining genotypic and phenotypic reanalysis, particularly in complex conditions, such as monogenic diabetes.
Methods
Study design and population
This study focused on 128 individuals whose genetic diagnoses remained inconclusive after previous molecular investigations (Fig. 1). These cases were drawn from an original cohort of 325 individuals referred for genetic testing due to clinical suspicion of monogenic diabetes. Prior investigations conducted by our group6–9 had established a molecular diagnosis in 157 of these cases (98 by Sanger/MLPA (Multiple ligation probe amplification) and 59 by tNGS), corresponding to an initial overall positivity rate of 48.3% (157/325)—a high proportion of unresolved cases that prompted the initiation of the present reanalysis.
Fig. 1. Schematic flowchart for the selection of unresolved cases included in the reanalysis.

This flowchart illustrates the diagnostic trajectory of the original cohort of 325 individuals referred for molecular investigation, culminating in the selection of 128 unresolved cases included in the present reanalysis. The positivity rates shown refer exclusively to this subset and represent the final diagnostic yield at the stage immediately prior to reanalysis (i.e., tNGS results), calculated as the number of individuals with a confirmed molecular diagnosis divided by the total number of initially suspected cases in each phenotype group. DM: Diabetes Mellitus; MODY: Maturity-Onset Diabetes of the Young; FPLD: Familial Partial Lipodystrophy; *tNGS: Targeted Next-Generation Sequencing; MLPA: Multiplex Ligation-Dependent Probe Amplification. *Sanger sequencing performed on the GCK, HNF1A, KCNJ11 Genes. **MLPA Investigation of the HNF1B Gene. ***40 Individuals (5 suspected for GCK-MODY and 35 suspected for non GCK-MODY) were not selected for reanalysis because, as of 2019, their molecular studies and interpretations were incomplete
The current cohort was derived from the final stage of the previous molecular workup, in which 227 individuals underwent targeted next-generation sequencing (tNGS), resulting in 59 diagnoses and 168 unresolved cases. Molecular diagnostic yield from this preceding tNGS investigative stage were: 16.67% (6/36) for GCK-MODY, 13.35% (16/118) for non-GCK-MODY, 68.42% (26/38) for neonatal DM, 27.27% (6/22) for FPLD, 83.33% (5/6) for Wolfram syndrome, and 0% (0/7) for mitochondrial DM. These values served as the comparative baseline for evaluating the impact of the phenotypic and genotypic reanalysis conducted in the present study.
From the total of 168 unsolved cases, 40 were excluded because their molecular data were still under interpretation when this reanalysis was initiated (2019). The present study, therefore, focused on the remaining 128 cases, which constituted the analytical base for this investigation; most of these did not present any pathogenic or likely pathogenic variants, with only 5 harboring a variant of uncertain significance (VUS). These 128 unresolved cases were clinically categorized as follows: 25 suspected GCK-MODY, 67 non-GCK-MODY, 16 FPLD, 12 neonatal DM, 7 mitochondrial DM, and 1 Wolfram syndrome.
Phenotypic criteria
The previous research projects conducted by this same group selected the various phenotypes of monogenic diabetes according to the following criteria:
1) Individuals with suspected MODY: hyperglycemia diagnosed before 35 years of age in at least one family member; negative islet antibodies and detectable C-peptide levels 3 years after diagnosis of hyperglycemia; 2) Individuals with suspected neonatal DM: hyperglycemia before 6 months of life or hyperglycemia at 6–12 months of age with negative islet antibodies; 3) Individuals with suspected FPLD: loss of subcutaneous tissue as a mandatory criterion, typically occurring during or after puberty, affecting the extremities and/or gluteal region, sparing or leading to fat accumulation in the face, neck, or intra-abdominal region which may be associated with metabolic comorbidities (insulin-resistant DM, acanthosis nigricans, polycystic ovarian syndrome [PCOS], hypertriglyceridemia, and hepatic steatosis); 4) Individuals with suspected Wolfram syndrome: hyperglycemia with negative islet antibodies and bilateral optical atrophy that may be associated with other comorbidities (sensorineural deafness and diabetes insipidus); 5) Individuals with suspected mitochondrial DM: hyperglycemia associated with neurosensory deafness and/or ophthalmoplegia.
Molecular criteria
All 128 individuals had been previously evaluated from a molecular point of view using a tNGS panel composed of 51 nuclear genes (Supplementary Fig. 1) related to monogenic diabetes and the complete mitochondrial genome. Specifically, regarding all genes classically most associated with MODY, the complete intronic region and the upstream regions at 1000 base pairs were covered. These sequencing data were obtained between 2015 and 2020, during which nine tNGS assays were performed, with each individual being sequenced only once. All genetic material was extracted from peripheral blood.
Phenotypic reanalysis and prioritization
The present study consisted of a reanalysis of the initial data from the entire cohort with the addition of new clinical data from the 5-year follow-up. Whenever possible/available, this comprehensive phenotyping process was extended to the probands’ relatives to increase understanding of the profile of diabetes in these families. The newly acquired information was obtained from several sources: 1) electronic medical records; 2) clinical follow-up data through contact with patients and their referring physicians; 3) recall for new medical appointments for those patients who had been lost to follow-up; 4) requests for additional laboratory and imaging tests relevant to the case. Therefore, we aimed to conduct an expanded phenotypic analysis by integrating additional clinical, familial, and laboratory data, enhancing the understanding of patient characteristics, although not all data points were uniformly available across the cohort.
This clinical and laboratory information was used to categorize individuals into typical and atypical cases for each subtype of monogenic DM. For MODY, individuals were considered typical when diagnosed with hyperglycemia before 30 years of age7 and when presenting with a score >60%12 on the MODY Probability Calculator13. Individuals with neonatal DM were considered typical when hyperglycemia occurred in the first six months of life2,3,6. Individuals with suspected FPLD were classified as typical when lower limb fat was less than 25%14,15 according to dual-energy X-ray absorptiometry (DXA). Individuals suspected of Wolfram syndrome and mitochondrial DM, due to their syndromic phenotype, were all considered typical.
Genotypic reanalysis and prioritization
All the steps involved in bioinformatics, including genomic mapping, variant calling and annotation of the sequence data, were repeated using updated versions of the software previously used, as already described in detail8. The variants identified were submitted to a new variant filtering workflow, as shown in Fig. 2. Nuclear variant filtering (Fig. 2a) and pathogenicity interpretation were performed according to the pathogenicity criteria established by the ClinGen Monogenic Diabetes Expert Panel16, the ACMG, and the Association for Molecular Pathology17. In the case of the mitochondrial genome (Fig. 2b), the search for variants was conducted in the publicly available MITOMAP database18, and variant pathogenicity was interpreted by adapting the ACMG rules for mitochondrial variants19, aided by the in-silico prediction tools MitoTIP20 and MITOMASTER21.
Fig. 2. Variant filtering workflow.

a Nuclear variants b Mitochondrial variants. VCF variant calling format, MAF minor allele frequency, DM diabetes mellitus
The primary objectives of molecular reanalysis were to identify new variant/gene associations and to search for molecular defects possibly overlooked in previous analyses, including: 1) Deep intronic regions; 2) Synonymous variants; 3) Regulatory regions; 4) Copy number variations (CNVs); and 5) The entire mitochondrial genome. Furthermore, the pathogenicity of the five VUS identified in earlier stages of the investigation was updated. Nuclear and mitochondrial CNVs were investigated using CONTRA22 and eKLIPse23, respectively.
Combination of phenotypic and genotypic reanalysis for increased molecular positivity
In the present study, molecular positivity was defined as the ratio of individuals with an identified molecular defect (numerator) to those clinically suspected of the monogenic disease (denominator). Reanalysis of phenotypes reduced the denominator, while reanalysis of genotypes increased the numerator. The overall increase in molecular positivity resulting from this dual reanalysis was calculated and presented as the absolute difference between the previous molecular positivity and the post-reanalysis molecular positivity.
Ethics
The study protocol was approved by the Research Ethics Committee of the University of São Paulo (Comitê de Ética em Pesquisa da Universidade de São Paulo), São Paulo, Brazil, under reference number 70637. All relevant ethical regulations were followed. Participants and/or their legal guardians provided written informed consent.
Statistics and reproducibility
This study analyzed retrospective clinical and molecular data from a cohort of 128 unrelated individuals with suspected monogenic diabetes. No experimental procedures or technical replicates were performed. All statistical analyses were conducted using the R software. Student’s t test was used to compare parametric data, and the Wilcoxon signed-rank test was used in cases of nonparametric data. Exact P-values are reported, and values <0.05 were considered statistically significant24. No statistics were derived from n < 3.
Reporting summary
Further information on research design is available in the Nature Portfolio Reporting Summary linked to this article.
Results
The comprehensive reanalysis integrating both genotypic and phenotypic data substantially enhanced the diagnostic yield of the cohort (Fig. 3A) by uncovering five previously undetected molecular defects and by appropriately excluding atypical cases (n = 62), cases with limited clinical information, and those with diabetes remission during follow-up (n = 12). This approach significantly enhanced diagnostic accuracy for monogenic diabetes, increasing the positivity rate by ~9–22%, depending on the clinical phenotype. This incremental diagnostic yield was calculated as the difference between positivity rates achieved by reanalysis and those from the pre-reanalysis tNGS step (Fig. 3B). In the subgroup of individuals suspected of GCK-MODY, diagnosis increased by 16.67%, from 16.66% (6/36) to 33.33% (7/21), due to the identification of one new molecular defect and the phenotypic reclassification of 15 individuals as no longer consistent with a clinical suspicion of GCK-MODY: 7 were deemed atypical, 1 had insufficient clinical data, and 7 had transient hyperglycemia that resolved over time. For non GCK-MODY, diagnosis increased by 9.93%, from 13.35% (16/118) to 23.28% (17/73), due to the identification of one new molecular defect and the phenotypic reclassification of 45 individuals as no longer consistent with a clinical suspicion of non-GCK-MODY: 42 were deemed atypical, 2 had insufficient clinical data and 1 had transient hyperglycemia that resolved over time. For FPLD, diagnosis increased by 22.73%, from 27.27% (6/22) to 50% (8/16), due to the identification of two new molecular defects and the phenotypic reclassification of 6 individuals as no longer consistent with a clinical suspicion of FPLD, all of whom exhibited more than 25% fat in the lower limbs measured by DXA; and for neonatal DM, diagnosis increased by 21.58%, from 68.42% (26/38) to 90% (27/30), due to the identification of one new molecular defect and the phenotypic reclassification of 8 individuals as no longer consistent with a clinical suspicion of neonatal DM: 7 were deemed atypical and 1 had insufficient clinical data. No increase in positivity was observed in individuals in whom Wolfram syndrome was suspected or in those with a typical mitochondrial DM phenotype. In summary, these improvements resulted from obtaining better characterization of individuals in atypical cases (48.4% of the cohort) and the identification of 5 new molecular defects in the cohort classified as typical (Fig. 3A, B).
Fig. 3. Summary of diagnostic outcomes and subgroup-specific impact of phenotypic and genotypic reanalysis.
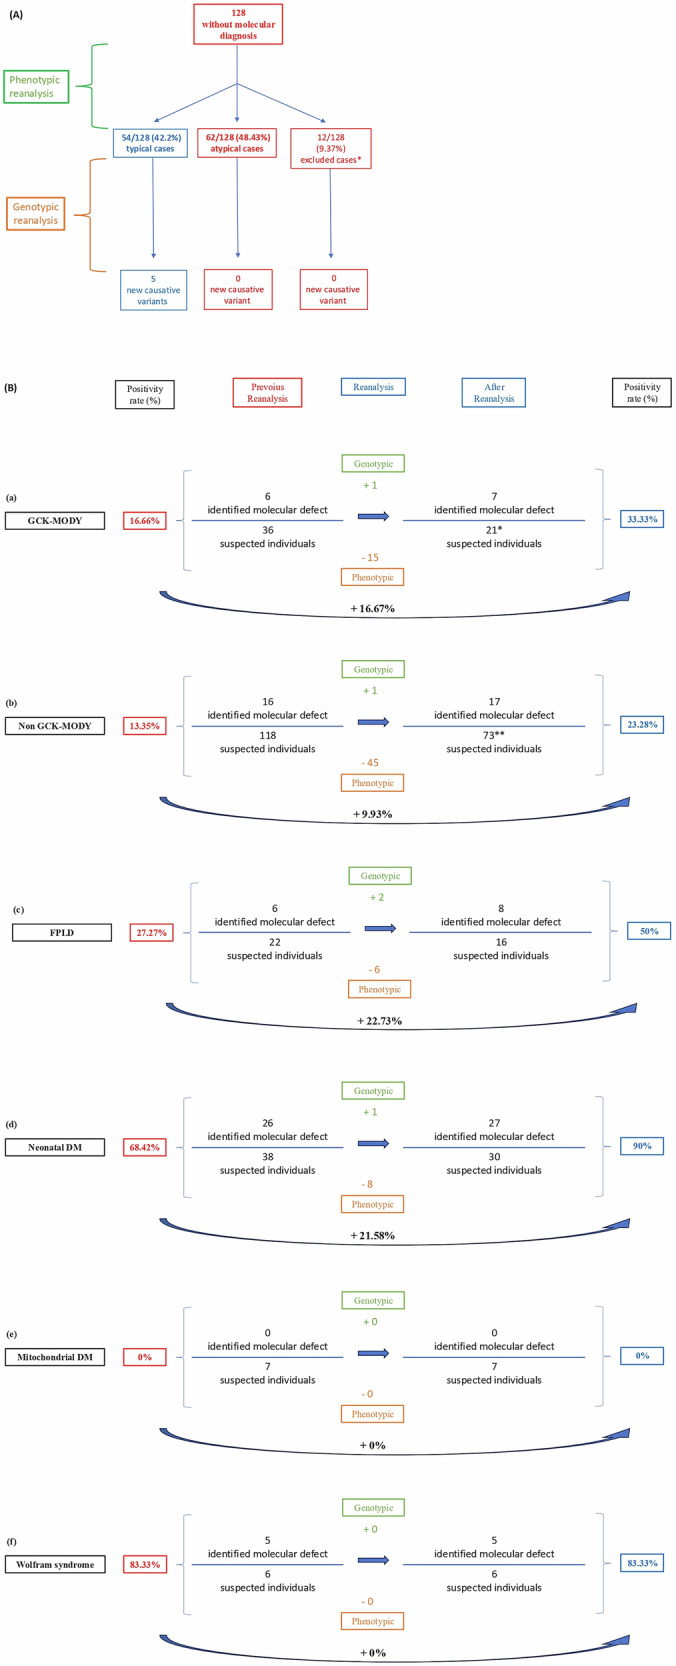
Schematic flowchart of the summary of results obtained through combined phenotypic and genotypic reanalysis. *12 excluded cases: 8 individuals with transient hyperglycemia resolved (seven from the GCK-MODY subgroup and one from the non-GCK MODY subgroup) and 4 individuals with insufficient clinical data (one from the neonatal diabetes group, one from the GCK-MODY group, and two from the non-GCK MODY group). Schematic flowchart summarizing the impact of combined phenotypic and genotypic reanalysis across four diagnostic subgroups: GCK-MODY (a) non-GCK-MODY (b) FPLD (c) neonatal diabetes (d) Mitochondrial DM (e), and Wolfram syndrome (f). For each subgroup, the fig. displays changes in the number of individuals with identified molecular defects and total suspected cases before and after reanalysis, as well as the resulting increase in diagnostic yield. Green boxes represent newly identified molecular defects via genotypic reanalysis; orange boxes indicate individuals excluded based on phenotypic reassessment. Blue arrows reflect diagnostic progression, and the final positivity rates are shown in blue on the right. The total of 227 individuals—matching the entire original cohort investigated by tNGS, as shown in Fig. 1—corresponds to the sum of those included in the positivity analysis after reanalysis (21 GCK, 73 non-GCK, 16 FPLD, 30 neonatal DM, 7 mitochondrial DM, and 6 Wolfram) and those excluded after phenotypic reassessment (15 GCK, 45 non-GCK, 6 FPLD, and 8 neonatal DM). * The denominator used for the final positivity rate of the entire GCK-MODY cohort (n = 21) includes 10 individuals with a typical GCK phenotype, 6 who had previously tested positive by tNGS, and 5 who could not be reanalyzed in 2019 due to unavailable molecular data. These 5 were retained in the denominator to avoid artificially inflating the reanalysis yield. ** The denominator used for the final positivity rate of the entire non-GCK cohort (n = 73) includes 22 individuals with a typical non-GCK phenotype, 16 who had previously tested positive by tNGS, and 35 who could not be reanalyzed in 2019 due to unavailable molecular data. These 35 were retained in the denominator to avoid artificially inflating the reanalysis yield. MODY: Maturity-Onset Diabetes of the Young; DM diabetes mellitus, FPLD familial partial lipodystrophy.
From a phenotypic perspective, in the subgroup in which GCK-MODY was suspected (Table 1), 41.2% of cases (7/17) were atypical. They differed from typical cases in that mild hyperglycemia was diagnosed at an older age (P < 0.001) and because there were fewer metabolic comorbidities in family members (P < 0.05). In the non-GCK-MODY subgroup (Tables 2), 65.6% (42/64) of the cases were atypical. These individuals were also older at DM diagnosis (P < 0.01), had more symptoms of hyperglycemia (P < 0.05), had a lower MODY calculator score (P < 0.001), were more likely to be in use of insulin at diagnosis (P < 0.005), and their family members were more likely to have metabolic comorbidities (P < 0.05). Regarding neonatal DM (Supplementary Table 1), atypical individuals accounted for 58.33% (7/12) and no new striking phenotypic characteristics were identified that distinguished them from the typical cohort, other than DM onset after 6 months of age. Although all individuals suspected of having FPLD commonly had DM together with metabolic comorbidities (Supplementary Table 2), atypical individuals with FPLD (37.5%; 6/16) showed no phenotypic trait that would distinguish them from the typical cohort, except for a higher percentage (>25%) of fat mass in the lower limbs. The individuals suspected of mitochondrial DM (n = 7) and Wolfram syndrome (n = 1) are described in Supplementary Table 3.
Table 1.
Phenotypic description of individuals suspected of having GCK-MODY (n = 17)
| Characteristics | GCK-MODY (n = 17) | ||
|---|---|---|---|
| Typical (n = 10) | Atypical (n = 7) | P-value | |
| Age at clinical diagnosis (years) | 12.5 (7.5–18); n = 10 | 33 (31.5–34.5); n = 7 | 0.006 |
| Time between clinical and molecular diagnosis (years) | 12.5 (8–16.5); n = 10 | 8 (6.5–12.5); n = 7 | 0.93 |
| Glycated hemoglobin (mmol/mol) | 42 (36–43); n = 5 | 39 (38– 42); n = 6 | 0.94 |
| Glycated hemoglobin (%) | 6 (5.4–6.1); n = 5 | 5.7 (5.6–6.0); n = 6 | 0.94 |
| Fasting glucose (mg/dL) | 119 (101–122); n = 5 | 105 (90–110); n = 5 | 0.12 |
| Symptoms of hyperglycemiaa | 0 | 0 | NA |
| MODY calculator (%) | 75 (75–75); n = 10 | 75 (53.7–75); n = 7 | 0.03 |
| Body mass index | n = 9 | n = 7 | 0.48 |
| Underweight | 1 (11.1%) | 2 (28.6%) | |
| Normal weight | 7 (77.7%) | 5 (71.4%) | |
| Overweight | 0 | 0 | |
| Obese | 1 (11.2%) | 0 | |
| Time to insulin treatment | n = 10 | n = 7 | 1 |
| Not currently treated with insulin | 9/10 (90%) | 6/7 (85.7%) | |
| Immediately at diagnosis | 0/10 | 0/7 | |
| Within 6 months of diagnosis | 0/10 | 0/7 | |
| Over 6 months after diagnosis | 1/10 (10%) | 1/7 (14.3%) | |
| Islet antibodiesb | n = 6 | n = 6 | NA |
| Positive | 0/6 | 0/6 | |
| Negative | 6/6 (100%) | 6/6 (100%) | |
| Metabolic comorbiditiesc (at diagnosis of mild hyperglycemia or during clinical follow-up) | n = 10 | n = 7 | 1 |
| Yes | 3/10 (30%) | 2/7 (28.6%) | |
| No | 7/10 (70%) | 5/7 (71.4%) | |
| Time of mild hyperglycemia at the end of follow-up (years) | 15 (8–17); n = 9 | 8 (4.5–13); n = 7 | 0.18 |
| C-Peptide at the end of clinical follow-up (ng/dL) | 2.2 (1.5–2.8); n = 8 | 1.6 (1.4–2); n = 5 | 0.047 |
| Highest C-Peptide during clinical follow-up (ng/dL) | 2.2 (1.9–2.6); n = 4 | 2.3 (2.2–2.8); n = 3 | 0.69 |
| Lowest C-Peptide during clinical follow-up (ng/dL) | 1.1 (0.9–1.3); n = 4 | 1.5 (1.4–1.7); n = 3 | 0.29 |
| Glomerular filtration rate at the end of clinical follow-up (CKD-EPI) | 118 (106–122); n = 8 | 105 (100–109); n = 5 | 0.14 |
| Diagnosis of DM in the family | 9/10 (90%) | 7/7 (100%) | 1 |
| Metabolic comorbiditiesc in the family | n = 9 | n = 7 | 0.04 |
| Yes | 7/9 (77.8%) | 1/7 (14.3%) | |
| No | 2/9 (22.2%) | 6/7 (85.7%) | |
| Age at onset of DM in the family | n = 9 | n = 7 | 0.89 |
| Before 18 years old | 0 | 0 | |
| Between 18 and 30 years old | 0 | 1/7 (14.3%) | |
| After 30 years old | 9/9 (100%) | 6/7 (85.7%) | |
Data are expressed as medians (interquartile range), with n being based on the total number of individuals for whom information was available. Significant P-values are in bold.
NA not available, DM diabetes mellitus, CKD-EPI Chronic Kidney Disease Epidemiology Collaboration.
aSymptoms of hyperglycemia include one or more of the following: polyuria, polydipsia, polyphagia and weight loss.
bIslet antibody positivity is defined as antibody levels three times the upper limit of normal (for the laboratory test) and when at least three antibodies tested (anti-insulin, anti-glutamic acid decarboxylase, anti-protein phosphatase-like IA-2) were positive.
cMetabolic comorbidities include one or more of the following: hypertension, obesity, dyslipidemia, and hepatic steatosis.
Table 2.
Phenotypic description of individuals suspected of having non-GCK-MODY (n = 64)
| Characteristics | Non-GCK-MODY (n = 64) | ||
| Typical (n = 22) | Atypical (n = 42) | P-value | |
| Age at clinical diagnosis (years) | 18.5 (15.25–21.75); n = 22 | 23 (18.25–31); n = 42 | 0.005 |
| Time between clinical and molecular diagnosis (years) | 10.5 (6.5–29.75); n = 22 | 16.5 (8–22.75); n = 42 | 0.87 |
| Glycated hemoglobin (mmol/mol) | 68 (58–74); n = 7 | 77 (50–97); n = 9 | 0.40 |
| Glycated hemoglobin (%) | 8.4 (7.45–8.95); n = 7 | 9.15 (6.7–11); n = 9 | 0.40 |
| Fasting glucose (mg/dL) | 189 (131.5–250); n = 7 | 272 (195–385); n = 12 | 0.31 |
| Symptoms of hyperglycemiaa | 3/10 (30%) | 17/22 (77.3%) | 0.04 |
| MODY calculator (%) | 75 (75–75); n = 22 | 4.6 (2.075–15.1); n = 38 | <0.0001 |
| Body mass index | n = 19 | n = 37 | 0.69 |
| Underweight | 0 | 1 (2.7%) | |
| Normal weight | 11 (57.9%) | 24 (64.9%) | |
| Overweight | 7 (36.8%) | 9 (24.3%) | |
| Obese | 1 (5.3%) | 3 (8.1%) | |
| Time to insulin treatment | n = 21 | n = 42 | 0.001 |
| Not currently treated with insulin | 10 (47.6%) | 10 (23.8%) | |
| Immediately at diagnosis | 2 (9.6%) | 24 (57.2%) | |
| Within 6 months of diagnosis | 0 | 0 | |
| Over 6 months after diagnosis | 9 (42.8%) | 8 (19%) | |
| Islet antibodies** | n = 12 | n = 18 | NA |
| Positive | 0/12 | 0/18 | |
| Negative | 12/12 (100%) | 18/18 (94.4%) | |
| Metabolic comorbiditiesb (at diagnosis of DM or during clinical follow-up) | n = 21 | n = 42 | 1 |
| Yes | 14 (66.7%) | 27 (64.3%) | |
| No | 7 (33.3%) | 15 (35.7%) | |
| Time of DM at the end of follow-up (years) | 13.5 (6.7–31.2); n = 20 | 17 (8–24.7); n = 38 | 0.97 |
| C-Peptide at the end of clinical follow-up (ng/dL) | 2 (1.1–2.5); n = 19 | 1.4 (0.9–2.2); n = 34 | 0.79 |
| Highest C-Peptide during clinical follow-up (ng/dL) | 2.4 (1.9–3.1); n = 17 | 2.1 (1.4–2.); n = 29 | 0.22 |
| Lowest C-Peptide during clinical follow-up (ng/dL) | 1.6 (1.2–2.3); n = 17 | 1 (0.4–1.3); n = 29 | 0.05 |
| Glomerular filtration rate at the end of clinical follow-up (CKD-EPI) | 116 (97–121); n = 20 | 97 (85–114); n = 35 | 0.04 |
| Diagnosis of DM in the family | 18/20 (90%) | 36/39 (92.3%) | 1 |
| Metabolic comorbiditiesc in the family | n = 17 | n = 33 | 0.03 |
| Yes | 7 (41.2%) | 25 (75.5%) | |
| No | 10 (58.8%) | 8 (24.5%) | |
| Age at onset of DM in the family | n = 17 | n = 36 | 0.05 |
| Before 18 years old | 0 | 3 (8%) | |
| Between 18 and 30 years old | 9 (53%) | 8 (22%) | |
| After 30 years old | 8 (47%) | 25 (70%) | |
Data are expressed as medians (interquartile range), with n being based on the total number of individuals for whom information was available. Significant P-values are in bold.
NA not available, DM diabetes mellitus, CKD-EPI Chronic Kidney Disease Epidemiology Collaboration.
aSymptoms of hyperglycemia include one or more of the following: polyuria, polydipsia, polyphagia and weight loss.
b Islet antibodies are considered positive when antibody levels are three times above the upper limit of normal (for the laboratory test) and at least three antibodies tested (anti-insulin, anti-glutamic acid decarboxylase, anti-protein phosphatase-like IA-2) were positive.
cMetabolic comorbidities include one or more of the following: hypertension, obesity, dyslipidemia, and hepatic steatosis.
The genotypic reanalysis flowchart successfully identified 10 new molecular defects and reclassified all five VUS identified in previous investigations. The new findings included five defects identified as potentially causing the phenotype due to their classification as pathogenic or likely pathogenic, all within the typical cohort of patients (identified as proband 1–5). The remaining five variants (identified as proband 6 to 10) were classified as VUS or likely benign and are summarized in Supplementary Table 4. All the previous five VUS had their pathogenicity classification downgraded to benign (4/5) or likely benign (1/5). This downgrade was mostly due to their high frequency in the population, as shown in local databases (AbraOM), while in three cases, it was also due to the support of segregation studies without informative meiosis.
Molecular findings
Homozygous variant in the enhancer region of PTF1A Chr10:23508363A>G in neonatal DM
Proband 1, a 6-year-old male child of a consanguineous marriage between first cousins, was diagnosed with DM (fasting glucose 340 mg/dL and HbA1c 8.0%) in the first month of life during investigations for low birthweight (1330 g). Islet antibodies (anti-GAD and anti-insulin) measured at that time were non-reactive. At 5 months, he was small (Z-score of −3 standard deviations (SD) for height/age), and underweight (Z-score of –2.5 SD for BMI/age). He was also diagnosed with exocrine pancreatic insufficiency and an atrophic, slender pancreas that was difficult to visualize on computed tomography of the abdomen. Throughout this period, he underwent insulin therapy and pancreatic enzyme replacement therapy. Genotypic reanalysis, prioritizing regions outside the coding area, in this case an intergenic region located 25 kb downstream of PTF1A, identified a probably pathogenic homozygous variant Chr10:23508363A>G. From a familial point of view, the parents are healthy, without hyperglycemia; however, a segregation study showed the variant in heterozygosity in both father and mother (Supplementary Fig. 2).
Heterozygous variant in promoter region of HNF1A c.-285 C>T in non-GCK-MODY
Proband 2, a 36-year-old female with a BMI of 21 kg/m2, was diagnosed with DM at 24 years of age during a routine check-up. She began treatment with oral antidiabetics (a combination of metformin, vildagliptin and dapagliflozin), but glycemic control was poor. At 26 years old, the treatment was switched to glibenclamide 5 mg twice daily and metformin 500 mg once daily, which led to frequent episodes of hypoglycemia. At 30 years of age, with a clinical suspicion of sulfonylurea-sensitive MODY, she achieved good glycemic control (fasting glucose 125 mg/dL; HbA1c 6.0%, and C-peptide 2.1 ng/mL) with no episodes of hypoglycemia using half a tablet of glibenclamide 2.5 mg twice daily. Family history revealed that her father, mother, and brother had been diagnosed with prediabetes and metabolic comorbidities, such as overweight/obesity, dyslipidemia and hypertension (Supplementary Fig. 3). Genotypic reanalysis, prioritizing variants in non-coding regions, in this case the upstream region of HNF1A, identified a heterozygous, likely pathogenic variant HNF1A (NM_000545.6):c.-285C>T. Familial segregation analysis identified this variant as de novo (Supplementary Fig. 3).
Heteroplasmic mitochondrial variant in MTTK m.8344A>G in a patient with FPLD
Proband 3, a 38-year-old female, reported abnormal fat distribution between the ages of 10 and 15, with the presence of a buffalo hump and filling of the supraclavicular fossa25. At 18, she showed signs of insulin resistance (facial hirsutism, irregular menstrual cycles and androgenic alopecia). At 25, she was diagnosed with papillary thyroid carcinoma, and at 28, despite having a normal BMI, she was diagnosed with DM, PCOS and depression. Subsequently, she developed dyslipidemia and hypertension and was treated with basal-bolus insulin therapy (1.2 IU/kg/day), pioglitazone, metformin, atorvastatin and bezafibrate. A DXA body composition assessment confirmed a predominance of truncal fat deposition (fat mass ratio of 2.15) with minimal lower limb fat (lower limb fat percentage 16.6%), leading to a clinical suspicion of FPLD. This patient has non-consanguineous parents but a history of DM on the maternal side of the family (her mother and three maternal uncles); however, no detailed information on similar fat distribution patterns is available. Genotypic reanalysis, focusing on variants in the complete mitochondrial genome, identified a likely pathogenic mitochondrial variant in 83% heteroplasmy m/8344A>G/tRNA (Lys). Family members were unavailable for segregation analysis. Following this molecular diagnosis, the patient was referred for multidisciplinary evaluation and screening for other clinical comorbidities characteristic of mitochondrial diseases. Subsequently, the following conditions were identified: bilateral cervical multiple lipomatosis, moderate sensorineural hearing loss, proximal myopathy, fatigue, intellectual impairment, sensory ataxia, and a muscle biopsy consistent with mitochondrial disease.
Heterozygous missense variant in GCK c.127C>A in a patient with GCK-MODY
Proband 4, a 32-year-old male, was diagnosed with mild hyperglycemia at 11 years of age during routine examinations. He was asymptomatic at the time. He was initially treated with insulin therapy for 3 months, which was then switched to metformin, ultimately discontinued at age 24. The patient experienced mild and stable fasting hyperglycemia throughout this period, consistent with GCK-MODY. Non-reactive islet antibodies (Anti-GAD, Anti-IA2, and anti-insulin) were measured 20 years after the diagnosis of hyperglycemia. At the current age of 32 years, he is receiving no pharmacological treatment for hyperglycemia, and glycemic control is good (fasting glucose 121 mg/dL; HbA1c 6.1%; C-peptide 3.65 ng/mL). From a familial perspective (Supplementary Fig. 4), the proband’s 53-year-old mother has had altered fasting glucose levels indicative of prediabetes (fasting glucose 110 mg/dL) since the age of 34. Her body composition is normal, and she has not required pharmacological treatment for hyperglycemia up to the present time. His father, aged 59, does not have hyperglycemia. The likely pathogenic variant in GCK (NM_000162.5):c.127C>A (p.Arg43Ser) was identified in another study using trio exome sequencing. In that instance, the variant was found in the mother, but was absent in the father and the proband. The current reanalysis involved collecting a new sample (peripheral blood) and new Sanger sequencing encompassing the four samples (the previous sample from Proband 4 (Supplementary Fig. 5a), the new sample from Proband 4 (Supplementary Fig. 5b), the sample from the father (Supplementary Fig. 5c), and the sample from the mother (Supplementary Fig. 5d). The variant was then identified again in the mother and in the new sample from Proband 4 (Supplementary Fig. 5a), leading to the hypothesis of an accidental sample switch of the index case or failure in its identification.
Homozygous missense variant in MFN2 c. 2119C>T
Proband 5, a 58-year-old female, was diagnosed at 38 years of age with loss of fat in the lower limbs and central fat accumulation (face, neck and abdomen), along with pseudo-muscular hypertrophy. At that time, in the context of overweight, she presented with dyslipidemia due to hypertriglyceridemia (maximum value of 300 mg/dL), mild hepatic steatosis, DM treated with NPH insulin (1.2 IU/kg/day) combined with metformin and DPP-4 inhibitors, hypertension, lipomatosis, and peripheral diabetic polyneuropathy. A DXA body composition study showed 26.6% total fat, 16.2% lower limb fat, and a fat mass ratio of 1.68. There was no family history of similar fat loss patterns or metabolic diseases. Proband 5 underwent another molecular study using a gene panel related to lipodystrophy, which identified a likely pathogenic homozygous missense variant in MFN2 (NM_014874.4): c.2119C>T (p.Arg707Trp).
Discussion
Most reanalysis studies26–28 focus on increasing molecular positivity through the discovery of new and existing genes/variants. While they acknowledge the relevance of phenotypic reanalysis, the primary aim is to allow new phenotypic information to be added during follow-up. The present study is innovative from a phenotypic perspective because follow-up information was used not only to improve the accuracy of diagnosis based on the clinical presentation in typical individuals but also to rule out atypical cases of monogenic diabetes. Furthermore, a probable new molecular cause for FPLD was identified in the mitochondrial MTTK gene, and a new variant was found in the promoter region of the HNF1A gene associated with MODY. As described in the results and discussed below, the greatest impact of phenotypic reanalysis was in increasing molecular positivity and in changing the final clinical management of the cohort.
The results presented here highlight the increase in diagnostic accuracy achieved following a broad phenotype/genotype reanalysis process in the final cohort of 116 individuals suspected of having various subtypes of phenotype involved in monogenic DM (MODY, neonatal DM, FPLD, Wolfram syndrome, and mitochondrial DM). The combination of these two procedures resulted in a 9–26% increase in the number of individuals with an identified cause for their clinical condition. This increase was attributable either to new molecular findings or to improved understanding of their phenotype. These findings are in line with a recent review28 of 27 reanalysis studies involving whole exome sequencing and whole genome sequencing, in which overall gains in diagnostic yield were around 15%. Reanalysis studies with targeted panels are scarcer, and the increase in diagnosis is smaller. Two studies involving reanalysis of panels containing genes related to neurodevelopmental disorders27 and hearing loss29 reported diagnostic increase potentials of around 7% and 5%, respectively. To the best of our knowledge, only one previous study has reanalyzed molecular data from individuals with monogenic diabetes, including those with MODY, neonatal DM and congenital hyperinsulinism, using a small targeted panel of 5 genes sequenced only in the exon and promoter regions30. By adding to existing information on the frequency of the variant in the population and adding new references over a 4-year review period, this study increased diagnostic capacity (new individuals harboring pathogenic or likely pathogenic variants) by around 10%. None of the papers cited here performed molecular reanalysis that prioritized the complete mitochondrial genome or regulatory regions as possible causes of the phenotype; therefore, these constitute the most important strongpoints of the present study.
In the cohort of individuals suspected of having GCK-MODY, molecular positivity increased by 16.67% (from 16.66% to 33.33%) due to both new molecular findings and phenotypic reclassification. The separation of typical and atypical phenotypes enabled significant clinical heterogeneity to be identified. The statistically significant difference in age at DM diagnosis is notable, with a median age of 12.5 years in the typical group compared to 33 years in atypical individuals (P = 0.006). Originally, MODY was considered a phenotype that should be suspected in individuals diagnosed with hyperglycemia before 25 years of age31,32. However, increased understanding of this phenotype, which extended the screening age to <30 years, was considered a possible means of improving identification of these individuals33. The most recent diabetes guidelines2,3 do not mention the age criterion for screening individuals with suspected MODY. They emphasize a strong family history of DM in addition to the absence of striking characteristics related to type 1 and type 2 DM as the crucial factors. Nevertheless, the fact that age at diagnosis differed greatly (>20 years) between the two groups of individuals identified at reanalysis leads us to believe that these atypical individuals may be at an increased risk of developing type 2 DM. Therefore, a more detailed phenotyping of this group could provide a more accurate explanation for their hyperglycemia. This should include comprehensive body composition analysis through anthropometric measurements or whole-body densitometry, which are strongly associated with the development of hyperglycemia34, as well as calculation of the polygenic risk score for type 2 DM35. Additionally, it is important to mention that, both from the point of view of age at diagnosis and glycemic profile, these atypical individuals bear little resemblance to the previously reported cohort of 190 individuals (probands and their relatives) with GCK-MODY7. From a molecular standpoint, the new finding of a missense variant p.Arg43Ser in GCK just perpetuates the existing knowledge that missense variants are the main causes of this phenotype7. On the other hand, the mechanism by which this variant was identified highlights the possibility of an individual not receiving a positive molecular diagnosis due to human error during the DNA library preparation process. This cause has not been addressed as a possibility in the literature to date28, despite already being recognized in the literature on laboratory medicine36.
The molecular positivity of the cohort of individuals with suspected non-GCK-MODY increased by 9.93% (from 13.35% to 23.28%) due to both new molecular findings and phenotypic reclassification. As with the cohort of individuals suspected of having GCK-MODY, phenotypic reanalysis successfully identified two clinically quite distinct groups within those suspected of non-GCK-MODY. Atypical individuals in this group generally required insulin therapy to achieve glycemic control, as a higher proportion were diagnosed with diabetes during symptomatic hyperglycemia (polyuria, polydipsia, polyphagia or weight loss). This combination of factors was the main reason why atypical individuals obtained lower scores on the MODY calculator tool, as rapid progression to insulinopenia is not characteristic of the most common MODY subtypes1,7. Additionally, because atypical individuals are more likely to have a family history of metabolic comorbidities, it is plausible that they may represent individuals with young-onset type 2 DM. This increasingly common scenario is typically characterized by earlier pancreatic failure37 and its polygenic inheritance pattern is evidenced by a family history involving cases of DM with associated metabolic comorbidities. As in atypical individuals for GCK-MODY, a deeper phenotypic study of their body composition34 and a polygenic risk study for type 2 DM35 can contribute to improving understanding of the etiology of hyperglycemia. Genotypic reanalysis also contributed to improving diagnostic accuracy in individuals suspected of having non-GCK-MODY. A new molecular finding was identified in a regulatory region located in the promoter of the HNF1A gene, the heterozygous point variant c.-285C>T. This variant was identified in Proband 2, who had a typical history of sulfonylurea-sensitive MODY. This patient has maintained good glycemic control for 14 years with half a tablet of glibenclamide 2.5 mg per day. According to a review38, the promoter region of HNF1A spans 300 base pairs before the transcription initiation codon. The variant in Proband 2 is located at the binding site of HNF4A39 where in functional studies nearby variants (c.-283A>C) have been shown to decrease basal transcription levels of HNF1A40.
In the cohort of individuals suspected of having neonatal DM, molecular positivity increased by 21.58% (from 68.42% to 90%) due to both new molecular findings and phenotypic reclassification. Phenotypically, separating individuals based on whether the onset of hyperglycemia occurred before or after 6 months of age failed to identify any other significant clinical characteristics. It is worth reflecting that the established age at diagnosis for suspicion of monogenic etiology has changed as knowledge increases. The age limit for considering a non-autoimmune monogenic cause of neonatal DM shifted from the first 30–45 days of life41 to 3 months, then to 6 months42, 9 months43, and currently back to 6 months3. This variation over time demonstrates how the progress of science renders phenotypic definition a dynamic process, reinforcing the role of periodic reanalysis. This study also highlights the increased findings of molecular positivity in individuals with hyperglycemia before 6 months of age6. As in the cohort of individuals suspected of having non-GCK-MODY, the new molecular finding occurred in a regulatory region. The identified point variant in homozygosity in an enhancer region of PTF1A (Chr10:23508363A>G) occurred in an individual with hyperglycemia from the first month of life, associated with pancreatic atrophy and consanguineous parents. Initially, pathogenic variants in this gene were associated with syndromic neonatal DM (DM, cerebellar atrophy and pancreatic atrophy)44. It was only more recently that Weedon et al.45 evaluated six individuals from three consanguineous families with isolated pancreatic atrophy, with results showing variants located in a distal region (~25 kb) from PTF1A. Following functional tests and segregation studies, that same group determined that it was an enhancer region of PTF1A.
In the cohort of individuals suspected of having FPLD, molecular positivity increased by 22.73% (from 27.27% to 50%) due to both new molecular findings and phenotypic reclassification. Despite the cohort being divided into typical and atypical individuals according to fat distribution in the lower limbs (<25% or >25%, respectively), the clinical manifestation of diabetes was similar in both groups, characterized by common comorbidities related to insulin resistance, such as hepatic steatosis, PCOS, acanthosis, dyslipidemia and/or hypertension. This probably occurs because, among the various phenotypes of monogenic DM, the phenotype of FPLD is the one in which metabolic comorbidities can be most influenced by the environment or even confused with patients with type 2 DM who present a lipodystrophy-like pattern of fat distribution46. Objective assessment of lower limb fat loss is crucial when lipodystrophies of monogenic etiology are suspected. The challenge lies in determining the best assessment method. Among the various commonly used methods for body composition analysis, DXA has shown the most promising results46. Vasandani et al.14 suggest that the DXA-derived lower limb fat percentage has the best specificity (0.995) and sensitivity (1.0) compared to other anthropometric measurements. That same study established that in female individuals, a lower limb fat value of <25% associated with metabolic comorbidities is suggestive of FPLD. From a molecular viewpoint, the identification of two variants affecting mitochondrial function, either directly through the mitochondrial variant m.8344A>G (Proband 3) or indirectly through the homozygous nuclear variant c.2119C>T in the MFN2 gene (Proband 5), highlighted the importance of considering mitochondrial dysfunction as a cause of FPLD-like phenotype. From the pathophysiological point of view, this seems plausible, as adequate mitochondrial function is essential not only for insulin production by beta cells47 but also for the proper functioning of insulin signaling in its receptors48, and for maintaining healthy adipose tissue49.
Even after extensive prior molecular investigation and the current reanalysis, depending on the phenotype, for a significant percentage of individuals suspected of having monogenic DM, molecular etiology remains undefined (Supplementary Table 5).
There are some limitations associated with the current study that could be seen as opportunities for future research focused on separating typical and atypical phenotypes. Those considered typical are an interesting target for intensifying efforts to identify new molecular defects, given little attention in the literature on monogenic DM up to now. Studying the transcript through whole transcriptomic sequencing may represent a good opportunity to identify molecular defects in regulatory regions or in non-canonical splicing sites (deep intron) that alter the primary transcript and subsequent gene expression. In addition, the study of CNVs using other methods, such as array comparative genomic hybridization (Array CGH) and/or multiplex ligation-dependent probe amplification (MLPA), may also be interesting. For individuals suspected of having mitochondrial DM, the search for the primary variant m.3243A>G in urine samples appears promising. Conversely, a more in-depth phenotyping analysis of atypical individuals may reveal novel insights into common forms of diabetes, such as types 1 and 2 DM. With regards to individuals with atypical neonatal DM diagnosed with hyperglycemia at 6–12 months of age, studies of polygenic type 1 DM risk scores50 and the identification of novel autoantibodies against pancreatic islet cells may bring new insights into the pathophysiology of type 1 DM. However, it is important that these autoantibodies are measured as soon as hyperglycemia is diagnosed to increase the likelihood of their positivity. The delay in testing in this cohort6, with a mean time of 8.03 years between neonatal DM diagnosis and autoantibody testing, may have contributed to false-negative results. Furthermore, a better understanding of the fat distribution pattern through body composition analysis, associated with polygenic risk studies for type 2 DM35 in atypical individuals for MODY and FPLD, could represent an interesting approach to improve understanding of a phenotype as common and diverse as type 2 DM. It is also important to highlight that reanalysis studies—including the present one—require a predefined cutoff point for inclusion. In our study, this reference point was established in 2019. As a result, 40 individuals whose molecular data were still under evaluation at that time were not included in the reanalysis. This may have influenced the diagnostic yield reported here, potentially leading to either an underestimation or overestimation of the final molecular positivity rates.
The present study, conducted through a bidirectional information exchange between phenotype and genotype reanalysis, improved the overall accuracy of molecular diagnosis of the different phenotypes of monogenic DM by ~9–22%. This increase was attributable both to new molecular findings not previously identified and, most importantly, to the improved capacity to exclude cases that were not typical of a monogenic disease. This fact underscores the importance of revisiting the phenotype in any reanalysis study aimed at improving the diagnostic performance of a molecular test. This is particularly important in reanalysis studies involving phenotypes, such as diabetes, with a high prevalence in the population and significant environmental effects. Furthermore, rare forms of its expression (monogenic DM) can be easily mistaken for the more common forms (Type 1 and Type 2 DM). Based on the mechanisms by which the new molecular findings were identified, this work underscores the significance of improved understanding of regulatory regions (promoters and enhancers) as potential causes of monogenic DM, as well as the importance of comprehensive studies in the mitochondrial genome.
Supplementary information
Acknowledgements
The authors are grateful for the trust and collaboration of all the participants in the study and to the referring doctors around the country. Our particular thanks go to Professors Berenice Bilharinho de Mendonça and Ana Claudia Latronico, who supported this study and the establishment of the Monogenic Diabetes Group. The São Paulo Research Foundation (FAPESP) supported this study under grant numbers 2017/14703–4, 2013/19920–2, and 2017/15365–5. The funding agency had no role in study design, data collection, analysis, interpretation, or writing of the manuscript.
Author contributions
P.C.F. and M.G.T. contributed substantially to the conception and design of the study. A.C.S.J., A.D.C.R., L.S.S. and L.G.G. participated in the acquisition, analysis, and interpretation of the data. P.C.F. contributed to the drafting of the article, and A.A.L.J. and M.G.T. revised the manuscript critically for important intellectual content. All authors approved the final version to be published and agree to be held accountable for all aspects of the work.
Peer review
Peer review information
Communications Medicine thanks Mustafa Tosur and the other anonymous reviewer(s) for their contribution to the peer review of this work. Peer review reports are available.
Data availability
The sequencing data generated and analyzed in this study, comprising samples from 128 individuals, have been deposited in the NCBI Sequence Read Archive (SRA) under the BioProject accession number PRJNA1283933. The data are available in FASTQ format and can be accessed at: https://www.ncbi.nlm.nih.gov/bioproject/1283933. Additional metadata and BioSample accessions (SAMN49706387–SAMN49706396) are linked within the BioProject record. Further information is available from the corresponding author upon reasonable request.
Competing interests
The authors declare no competing interests.
Footnotes
Publisher’s note Springer Nature remains neutral with regard to jurisdictional claims in published maps and institutional affiliations.
Supplementary information
The online version contains supplementary material available at 10.1038/s43856-025-01031-1.
References
- 1.Bonnefond, A. et al. Monogenic diabetes. Nat. Rev. Dis. Prim.9, 1–16 (2023). [DOI] [PubMed] [Google Scholar]
- 2.ElSayed, N. A. et al. Classification and diagnosis of diabetes: standards of care in diabetes-2023. Diab. Care46, S19–S40 (2023). [DOI] [PMC free article] [PubMed] [Google Scholar]
- 3.Greeley, S. A. W. et al. ISPAD clinical practice consensus guidelines 2022: the diagnosis and management of monogenic diabetes in children and adolescents. Pediatr. Diab.23, 1188–1211 (2022). [DOI] [PMC free article] [PubMed] [Google Scholar]
- 4.Vaxillaire, M., Froguel, P. & Bonnefond, A. How recent advances in genomics improve precision diagnosis and personalized care of maturity-onset diabetes of the young. Curr. Diab. Rep.19, 79 (2019). [DOI] [PubMed] [Google Scholar]
- 5.Lemelman, M. B., Letourneau, L. & Greeley, S. A. W. Neonatal diabetes mellitus. An update on diagnosis and management. Clin. Perinatol.45, 41–59 (2018). [DOI] [PMC free article] [PubMed] [Google Scholar]
- 6.Costa-Riquetto, A. D. et al. Genetic and clinical features of neonatal and early-onset diabetes mellitus in a tertiary center cohort in Brazil. Clin. Genet.103, 434–447 (2023). [DOI] [PubMed] [Google Scholar]
- 7.Campos, P. et al. Clinical and genetic characterization and long-term evaluation of individuals with maturity-onset diabetes of the young (MODY): the journey towards appropriate treatment. Diab. Res. Clin. Prac. 187, 109875 (2022) [DOI] [PubMed]
- 8.de Santana, L. S. et al. Targeted sequencing identifies novel variants in common and rare MODY genes. Mol. Genet. Genom. Med.7, e962 (2019). [DOI] [PMC free article] [PubMed] [Google Scholar]
- 9.Santana, L. S. et al. Clinical application of ACMG-AMP guidelines in HNF1A and GCK variants in a cohort of MODY families. Clin. Genet.92, 388–396 (2017). [DOI] [PubMed] [Google Scholar]
- 10.Deignan, J. L. et al. Points to consider in the reevaluation and reanalysis of genomic test results: a statement of the American College of Medical Genetics and Genomics (ACMG). Genet. Med.21, 1267–1270 (2019). [DOI] [PMC free article] [PubMed] [Google Scholar]
- 11.Robinson, P. N. Deep phenotyping for precision medicine. Hum. Mutat.33, 777–780 (2012). [DOI] [PubMed] [Google Scholar]
- 12.Santomauro, A. C. et al. The performance of the MODY calculator in a non-Caucasian, mixed-race population diagnosed with diabetes mellitus before 35 years of age. Diabetol. Metab. Syndr.15, 15 (2023). [DOI] [PMC free article] [PubMed] [Google Scholar]
- 13.Shields, B. M. et al. The development and validation of a clinical prediction model to determine the probability of MODY in patients with young-onset diabetes. Diabetologia55, 1265–1272 (2012). [DOI] [PMC free article] [PubMed] [Google Scholar]
- 14.Vasandani, C. et al. Diagnostic value of anthropometric measurements for familial partial lipodystrophy, Dunnigan variety. J. Clin. Endocrinol. Metab.105, 2132–2141 (2020). [DOI] [PMC free article] [PubMed] [Google Scholar]
- 15.Mosbah, H. et al. Dunnigan lipodystrophy syndrome: French national diagnosis and care protocol (PNDS; Protocole National de Diagnostic et de Soins). Orphanet J. Rare Dis.17, 170 (2022). [DOI] [PMC free article] [PubMed] [Google Scholar]
- 16.Zhang, H. et al. TIP. Adaption of the ACMG/AMP variant interpretation guidelines for GCK, HNF1A, HNF4A-MODY: recommendations from the ClinGen monogenic diabetes expert panel (MDEP) for variant curation. Diabetes69, 1453 (2020)
- 17.Richards, S. et al. Standards and guidelines for the interpretation of sequence variants: a joint consensus recommendation of the American College of Medical Genetics and Genomics and the Association for Molecular Pathology. Genet. Med.17, 405–423 (2015). [DOI] [PMC free article] [PubMed] [Google Scholar]
- 18.Brandon, M. C. et al. MITOMAP: a human mitochondrial genome database–2004 update. Nucleic Acids Res.33, D611–D613 (2005). [DOI] [PMC free article] [PubMed] [Google Scholar]
- 19.McCormick, E. M. et al. Specifications of the ACMG/AMP standards and guidelines for mitochondrial DNA variant interpretation. Hum. Mutat.41, 2028–2057 (2020). [DOI] [PMC free article] [PubMed] [Google Scholar]
- 20.Sonney, S. et al. Predicting the pathogenicity of novel variants in mitochondrial tRNA with MitoTIP. PLOS Comput. Biol.13, e1005867 (2017). [DOI] [PMC free article] [PubMed] [Google Scholar]
- 21.Brandon, M. C. et al. MITOMASTER: a bioinformatics tool for the analysis of mitochondrial DNA sequences. Hum. Mutat.30, 1–6 (2009). [DOI] [PMC free article] [PubMed] [Google Scholar]
- 22.Li, J. et al. CONTRA: copy number analysis for targeted resequencing. Bioinformatics28, 1307–1313 (2012). [DOI] [PMC free article] [PubMed] [Google Scholar]
- 23.Goudenège, D. et al. eKLIPse: a sensitive tool for the detection and quantification of mitochondrial DNA deletions from next-generation sequencing data. Genet. Med.21, 1407–1416 (2019). [DOI] [PubMed] [Google Scholar]
- 24.R Core Team RF for SC. R: a language and environment for statistical computing https://cran.r-project.org/ (2015).
- 25.Franco, P. C. et al. Phenotypic and molecular reanalysis of a cohort of patients with monogenic diabetes reveals a case of partial lipodystrophy due to the A8344G mutation in the mitochondrial DNA. Arch. Endocrinol. Metab.68, e230084 (2024). [DOI] [PMC free article] [PubMed]
- 26.Robertson, A. J. et al. Re-analysis of genomic data: an overview of the mechanisms and complexities of clinical adoption. Genet. Med.24, 798–810 (2022). [DOI] [PubMed] [Google Scholar]
- 27.Won, D. et al. Reanalysis of genomic sequencing results in a clinical laboratory: advantages and limitations. Front. Neurol.11, 612 (2020). [DOI] [PMC free article] [PubMed] [Google Scholar]
- 28.Tan, N. B. et al. Evaluating systematic reanalysis of clinical genomic data in rare disease from single-center experience and literature review. Mol. Genet. Genomic Med.8, 1–19 (2020). [DOI] [PMC free article] [PubMed] [Google Scholar]
- 29.Sun, Y. et al. Increased diagnostic yield by reanalysis of data from a hearing loss gene panel. BMC Med. Genom.12, 76 (2019). [DOI] [PMC free article] [PubMed] [Google Scholar]
- 30.Bennett, J. T. et al. Molecular genetic testing of patients with monogenic diabetes and hyperinsulinism. Mol. Genet. Metab.114, 451–458 (2015). [DOI] [PMC free article] [PubMed] [Google Scholar]
- 31.Fajans, S. S., Bell, G. I. & Polonsky, K. S. Molecular mechanisms and clinical pathophysiology of maturity-onset diabetes of the young. N. Engl. J. Med.345, 971–980 (2001). [DOI] [PubMed] [Google Scholar]
- 32.Fajans, S. S. & Bell, G. I. MODY: history, genetics, pathophysiology, and clinical decision making. Diab. Care34, 1878–1884 (2011). [DOI] [PMC free article] [PubMed] [Google Scholar]
- 33.Thanabalasingham, G. et al. Systematic assessment of etiology in adults with a clinical diagnosis of young-onset type 2 diabetes is a successful strategy for identifying maturity-onset diabetes of the young. Diab. Care35, 1206–1212 (2012). [DOI] [PMC free article] [PubMed] [Google Scholar]
- 34.Han, T. S., Feskens, E. J., Lean, M. E. & Seidell, J. C. Associations of body composition with type 2 diabetes mellitus. Diabet Med.15, 129–135 (1998). [DOI] [PubMed] [Google Scholar]
- 35.Vassy, J. L. et al. Polygenic type 2 diabetes prediction at the limit of common variant detection. Diabetes63, 2172–2182 (2014). [DOI] [PMC free article] [PubMed] [Google Scholar]
- 36.Robasky, K., Lewis, N. E. & Church, G. M. The role of replicates for error mitigation in next-generation sequencing. Nat. Rev. Genet.15, 56–62 (2014). [DOI] [PMC free article] [PubMed] [Google Scholar]
- 37.Lascar, N. et al. Type 2 diabetes in adolescents and young adults. Lancet Diab. Endocrinol.6, 69–80 (2018). [DOI] [PubMed] [Google Scholar]
- 38.Colclough, K., Bellanne-Chantelot, C., Saint-Martin, C., Flanagan, S. E. & Ellard, S. Mutations in the genes encoding the transcription factors hepatocyte nuclear factor 1 alpha and 4 alpha in maturity-onset diabetes of the young and hyperinsulinemic hypoglycemia. Hum. Mutat.34, 669–685 (2013). [DOI] [PubMed] [Google Scholar]
- 39.Tian, J. M. & Schibler, U. Tissue-specific expression of the gene encoding hepatocyte nuclear factor 1 may involve hepatocyte nuclear factor 4. Genes Dev.5, 2225–2234 (1991). [DOI] [PubMed] [Google Scholar]
- 40.Godart, F. et al. Identification of seven novel nucleotide variants in the hepatocyte nuclear factor-1alpha (TCF1) promoter region in MODY patients. Hum. Mutat.15, 173–180 (2000). [DOI] [PubMed] [Google Scholar]
- 41.Iafusco, D. et al. Permanent diabetes mellitus in the first year of life. Diabetologia45, 798–804 (2002). [DOI] [PubMed] [Google Scholar]
- 42.Massa, O. et al. KCNJ11 activating mutations in Italian patients with permanent neonatal diabetes. Hum. Mutat.25, 22–27 (2005). [DOI] [PubMed] [Google Scholar]
- 43.Rubio-Cabezas, O., Flanagan, S. E., Damhuis, A., Hattersley, A. T. & Ellard, S. KATP channel mutations in infants with permanent diabetes diagnosed after 6 months of life. Pediatr. Diab.13, 322–325 (2012). [DOI] [PubMed] [Google Scholar]
- 44.Sellick, G. S. et al. Mutations in PTF1A cause pancreatic and cerebellar agenesis. Nat. Genet.36, 1301–1305 (2004). [DOI] [PubMed] [Google Scholar]
- 45.Weedon, M. N. et al. Recessive mutations in a distal PTF1A enhancer cause isolated pancreatic agenesis. Nat. Genet.46, 61–64 (2014). [DOI] [PMC free article] [PubMed] [Google Scholar]
- 46.Patni, N. & Garg, A. Lipodystrophy for the diabetologist-what to look for. Curr. Diab. Rep.22, 461–470 (2022). [DOI] [PMC free article] [PubMed] [Google Scholar]
- 47.Ng, Y. S., Lim, A. Z., Panagiotou, G., Turnbull, D. M. & Walker, M. Endocrine manifestations and new developments in mitochondrial disease. Endocr. Rev.43, 583–609 (2022). [DOI] [PMC free article] [PubMed] [Google Scholar]
- 48.Takano, C., Ogawa, E. & Hayakawa, S. Insulin resistance in mitochondrial diabetes. Biomolecules13, 1–12 (2023). [DOI] [PMC free article] [PubMed] [Google Scholar]
- 49.Kobayashi, M., Nezu, Y., Tagawa, R. & Higami, Y. Mitochondrial unfolded protein responses in white adipose tissue: lipoatrophy, whole-body metabolism and lifespan. Int. J. Mol. Sci.22, 2854 (2021). [DOI] [PMC free article] [PubMed] [Google Scholar]
- 50.Patel, K. A. et al. Type 1 diabetes genetic risk score: a novel tool to discriminate monogenic and type 1 diabetes. Diabetes65, 2094–2099 (2016). [DOI] [PMC free article] [PubMed] [Google Scholar]
Associated Data
This section collects any data citations, data availability statements, or supplementary materials included in this article.
Supplementary Materials
Data Availability Statement
The sequencing data generated and analyzed in this study, comprising samples from 128 individuals, have been deposited in the NCBI Sequence Read Archive (SRA) under the BioProject accession number PRJNA1283933. The data are available in FASTQ format and can be accessed at: https://www.ncbi.nlm.nih.gov/bioproject/1283933. Additional metadata and BioSample accessions (SAMN49706387–SAMN49706396) are linked within the BioProject record. Further information is available from the corresponding author upon reasonable request.