

Abstract
Background
The visual attention provides an objective perspective on how a stimulus take attention. In dentistry, one of the important facial determinants in esthetic perception is the mandibular asymmetry. The study aimed to evaluate the eye movements of the orthodontists and non-professionals on the images with different severity of mandibular asymmetry using eye tracking technology.
Methods
The eye movements of 26 orthodontists and 30 non-professionals were captured. Thirty images were visually evaluated for the presence of mandibular asymmetry by two orthodontists. 2 mm, 4 mm, 6 mm, and 8 mm chin deviation were simulated on the images and the images without asymmetry were considered as control group. A total of 50 photographs from 10 individuals were included in the study. Participants’ eye movements were recorded using an Eyelink 1000 plus eye-tracking device (Sr-Research, Canada). Repeated Measures Analysis of Variance (ANOVA) was used for statistical comparisons.
Results
The number of fixations on the lower lip-chin area in either the right or left direction did not show a statistically significant difference. (F(1,000;59,000) = 2.133, p > 0.05, ). Time to first fixation was faster to the lower lip-chin area in 8 mm asymmetry condition compared to 2 mm (F(1,2) = 31.423, p < 0.05, ηp2 = 0.940). Orthodontists made less fixations before the lower lip-chin area in 8 mm condition compared to 2 mm (F(1,2) = 20.758, p < 0.05, ηp2 = 0.912).
Conclusions
While the direction of mandibular asymmetry did not affect voluntary attention, an increase in asymmetry, regardless of profession, attracted more attention to the lower lip-chin area. While the 8 mm asymmetry caught the involuntary attention of orthodontists, the same did not occur in non-professionals.
Keywords: Mandibular asymmetry, Eye tracking technology, Visual attention
Introduction
The morphological features of the face are a significant factor influencing social interaction. One of the primary objectives of orthodontic treatment is to overcome the psychological and social challenges posed by the morphological characteristics of the face by providing a balanced facial appearance. One of the key determinants of human attractiveness is a symmetrical face. Facial symmetry refers to the harmony in size, shape, and position of reference points on both sides of the mid-sagittal plane [1, 2].
Studies indicate that minimal asymmetry in the mandibular area are common and mild mandibular asymmetry is considered normal during the growth phase [3, 4]. Abnormal growth rate, tumors, trauma, condylar hyperplasia, hemimandibular hypertrophy, hemimandibular elongation, coronoid hyperplasia, bruxism, temporomandibular joint disorders, muscle dysfunction, and occlusal disorders are the reasons for mandibular asymmetry [3–6]. While directly impacting facial appearance, it can also lead to various functional problems such as chewing disorders, temporomandibular joint dysfunction, and gastrointestinal system problems [1].
There are several methods used in the diagnose of mandibular asymmetry in the literature. Clinically evident asymmetries can be diagnosed directly by clinical examination but frontal facial 2D photographs are also used for diagnosis [4]. Recently, 3D images took place in the diagnosis and quantitative evaluation of mandibular asymmetry. One of the important steps of orthodontic treatment planning is to determine the existence of the asymmetry and identify its severity in millimeters. However, assessing the process of visual perception of mandibular asymmetry is one of the essential components of the decision process that may reflect the social background and a patient’s need for treatment. This information may assist the orthodontist in deciding how to treat to anomaly to what extent in mild to moderate anomalies.
The visual perception of mandibular asymmetry by individuals in social life is important in terms of influencing how patients perceive this anomaly. Besides, it has a significance in influencing patients’ expectations from orthodontic treatment in this regard. Therefore, improved communication between clinicians and the patients can enhance the likelihood of the patient satisfaction with the treatment.
Recently, evaluating the visual perception of different stimuli on the face has gained importance, leading to eye-tracking studies. Eye tracking is a method that measures the position, movement, and focal points of the eye with millisecond-level precision. In assessing the face, it identifies the sequence of eye movements from one point to another and determines fixation points. Thus, visual perception can be evaluated objectively [7]. There are several studies analyzed the eye movements of individuals on faces with severe class III malocclusion [8], CLP [9, 10], orthodontic appliances [11], smile esthetics [12]. In a study by Dindaroğlu et al. [13] in which the attention was analyzed in two categories as initial and sustained reported that orthodontists exhibited more fixation on the upper lip compared to laypersons in cleft lip and palate patients. Additionally, in a study by Naini et al. [14] focusing on intentional attention, it was observed that changes in chin projection up to 4 mm in the sagittal plane did not create awareness among orthodontists or laypersons. Similarly, a 3-degree menton deviation was found unnoticed by laypersons. Wolanski et al. [15] assessed if there was a difference in visual attention between the right and left side of the mandibular asymmetry using eye tracking method.
The visual data can guide the multidisciplinary team about to what extent the anomaly is recognized so it can guide the clinician in treatment planning, quantifying patient understanding their expectations, and determining an acceptable aesthetic outcome, thereby enhancing patient satisfaction [16, 17]. The aim of this study is to evaluate the eye movements of orthodontists and non-professionals using eye-tracking technology on faces with varying degrees of mandibular asymmetry and to demonstrate the impact of mandibular asymmetry on the visual perception hierarchy of these two groups. The hypotheses of the study were: (1) Mandibular asymmetry is visually perceived differently by both orthodontists and lay participants; (2) The severity of mandibular asymmetry alters the visual attention hierarchy of the participants.
Materials and methods
The ethical approval for this study was obtained from the Ege University Medical Research Ethics Committee (21-6.1T/19), and written informed consent was obtained from each participant (Decision no: E-99166796-050.06.04207328, 21-6.1T/19).
Participants
An a priori power analysis was conducted using G*Power 3.1.9.2 (Franz Faul, Universität Kiel, Germany) to determine the required sample size. Accordingly, for a design involving 2 groups (orthodontists and non-professional group) and 6 independent variables (facial regions) applying a mixed design repeated measures analysis of variance with a within-between interaction focus, it was observed that a total of 44 participants (noncentrality parameter λ = 15.68, critical F = 3.34, numerator df = 1.65, denominator df = 69.30) would be sufficient with an effect size of f = 0.3 and a statistical power of 95%, and α = 0.05.
Participants whose eye movements were analyzed met the following inclusion criteria: (1) no self-reported visual impairment (e.g., strabismus, pupil defect); (2) no use of contact lenses or eyeglasses during the task; (3) no diagnosis of attention-related or neurological disorders; (4) no congenital or acquired eyelid/ocular abnormalities. Female participants were asked to attend the session without eye makeup or accessories such as false eyelashes, as these may interfere with calibration or tracking accuracy.
Exclusion criteria were as follows: (1) voluntary withdrawal from the task, (2) failure to fixate on presented stimuli, (3) conscious gaze diversion away from the stimuli, (4) unsuccessful calibration or unusable eye-tracking data, and (5) post-experimental refusal to permit use of recorded data.
The eye movements of 26 orthodontists (13 females, mean age: 27.8 ± 2.6 years; 13 males, mean age: 28.1 ± 2.3 years) and 30 non-professionals (18 females, mean age: 35.36 ± 2.7 years; 12 males, mean age: 39.18 ± 2 years) were recorded.
Materials
Images of individuals with skeletal class I and normodivergant vertical growth pattern and without clinically evident mandibular asymmetry were used as stimuli. The individuals who did not have noticeable scars on face, discoloration, or undergo surgical operations in the facial area were included and individuals with beard, mustache, cold sores, or severe acne, accessories like tattoos or piercings on their facial region that could alter eye movements or influence evaluations were not included.
Sagittal and vertical facial skeletal relationships of the individuals whose images were used evaluated using cephalometric radiographs, while transversal anomalies were determined by examining intraoral and extraoral images. Five angular and one linear parameters were measured to determine the sagittal and vertical relationships. For sagittal evaluation, SNA: 82° (± 3.5°), SNB: 80° (± 3°), and ANB: 2° (± 2.4°) were measured and the norm values were determined while for vertical evaluation, SNGoGn: 32° (± 5°) and FMA: 26° (± 5°) were taken into accout. Additionally, the ratio of lower anterior facial height (LAFH) to total anterior facial height (TAFH) was measured, and individuals with values between 53% and 57% were selected. Thirty individuals meeting the aforementioned selection criteria were chosen. Photographs of these individuals were taken with a Canon EOS 750D camera from a distance of 80 cm in a natural head position.
Thirty images were visually evaluated for the presence of mandibular asymmetry by two orthodontists, one with 12 years and the other with 3 years of experience. When the two orthodontists expressed different opinions regarding the presence of mandibular asymmetry in the frontal images, they were excluded from the study. Subsequently, the study continued with the remaining 20 images where both orthodontists reached a consensus.
Before the experiment the attractiveness score of 20 images was rated by 20 non-professional individuals (10 males, mean age 39.2 ± 2.3 years; 10 females, mean age 33.8 ± 2.1 years) on a 10-point Visual Analog Scale (VAS) ranging from 0 (lowest) to 10 (highest attractiveness). Consequently, images of 5 males with an average age of 24.5 ± 1.5 years and an average attractiveness score of 7.6 ± 1, and 5 females with an average age of 24.5 ± 1.5 years and an average attractiveness score of 7.1 ± 1.1, were included in the study. The purpose of selecting individuals with similar and the aforementioned attractiveness scores was to eliminate the impact of extremely attractive or unattractive facial appearances on the data and to control the influence of attractiveness-related variations on the study data (background attractiveness).
The images were prepared in black and white to minimize gender interaction and to eliminate the impact of color differences on the lips and face on attention. Additionally, sections such as hair, ears, and neck were cropped.
Mandibular asymmetry, based on the line passing through the bridge of the nose, nasal tip, philtrum, and chin tip, was created using Adobe Photoshop software (Adobe Systems, San Jose California). Masseter muscle asymmetry was simulated in the vertical dimension of the face, ensuring no change in size. In five individuals, the mandible was simulated with right-sided asymmetry of 2 mm, 4 mm, 6 mm, and 8 mm, while in another five individuals, left-sided asymmetry of 2 mm, 4 mm, 6 mm, and 8 mm was created. The facial contour was adjusted in the same software for the new position. A total of five images were obtained from one person, consisting of one image without asymmetry serving as a reference and four images with simulated mandibular asymmetry.
Consequently, a total of 50 photographs from 10 individuals were included in the study. Additionally, to prevent conscious focus towards the area related to the main stimulus, five different individuals with identical attractiveness scores were included in the experiment by creating 2 mm of nasal asymmetry and eye asymmetry in their photographs. The data from nasal and eye asymmetry photographs were not included in the analysis.
Experimental procedure
Participants’ eye movements were recorded using an Eyelink 1000 plus eye-tracking device (Sr-Research, Canada), connected to a desktop computer in a dedicated room within the Psychology Department of the Faculty of Letters at Ege University. Participants were instructed to evaluate the attractiveness of the image by pressing one of the three buttons: 1 for not attractive at all, 2 for moderately attractive, and 3 for very attractive while being informed that their eye movements would be monitored. This was used as a filler task to prevent boredom or bias, and the attractiveness evaluations provided by the participants were not taken into account in the analysis.
During the experiment, participants were instructed to keep their heads steady using a chin and forehead rest, positioned at a distance of 60 cm from the monitor. Prior to the experiment, a 9-point calibration procedure was implemented to ensure calibration between the participants’ eyes and the eye-tracking device. Participants were asked to follow a black dot displayed on the monitor during calibration. Subsequently, a validation process was carried out for both eyes after calibration. This procedure measured error rates, and if an error exceeding 1.5 degrees was detected in either eye, the calibration process was repeated.
The Eyelink 1000 plus eye-tracking device recorded eye movements at a sampling rate of 1000 Hz on a 24-inch screen with a resolution of 1280 × 1024 and a refresh rate of 144 Hz. Eye movements were recorded separately for each eye, and data obtained from the dominant eye were used for statistical analysis. Stimulus presentation was conducted using the Experiment Builder (EyeLink®, SR Research Ltd., Canada) package program connected to the Eyelink 1000 plus eye-tracking device. The images were randomized and displayed randomly for maximum 3 s each or until button press. For the first eye contact not to occur randomly on the images, a fixation cross was presented between consecutive images for 1.5-second.
Statistical analysis
Data were analyzed using the Data Viewer (EyeLink®, SR Research Ltd., Canada) package program and IBM SPSS (version 25). In the Data Viewer program, a default minimum fixation duration of 100 ms (0.1 s) was used as a criterion. Participants’ eye movements were analyzed by dividing the face into six regions of interest: eyes, nose, right cheek, left cheek, upper lip, and lower lip-chin (Fig. 1). An area of interest (AOI) is a predefined, spatially bounded region of the stimulus that is designed for focused analysis of gaze behavior.
Fig. 1.
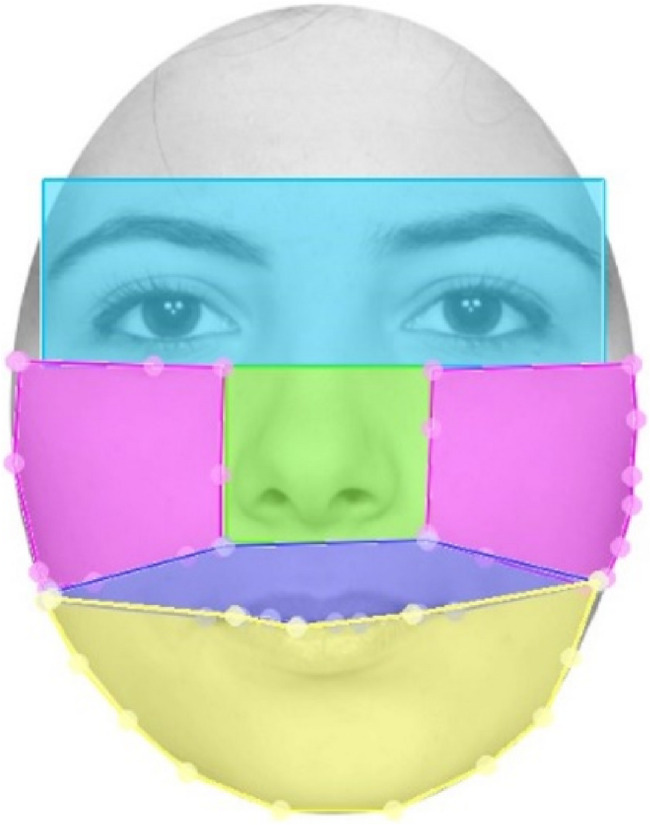
Four morphological areas on the face were determined as areas of interest (AOIs) for further analysis. Eyes (Blue); Right and left cheeks (Pink); Nose (Green) Upper lip (Purple); Lower lip-Chin (Yellow)
The data analysis did not include other facial areas (Fig. 2). Visual attention was examined using 2 involuntary and 2 voluntary attention parameters: Time to first fixation (in milliseconds) measured how long it took before a test participant fixated on an active AOI for the first time. The fixation before parameter measured the number of times the participant fixated on the media before fixating on an area for the first time. The fixation count (given as percentage divided by the total trial duration) measured the number of times the participant fixated on an area. Fixation duration (given as percentage divided by the total trial duration) was calculated by dividing total fixation duration by the total number of fixations on that AOI (Fig. 2).
Fig. 2.

An eye movement of a participant looking at the face without asymmetry (Left) and with 8 mm mandibular asymmetry (Right). Each blue circles indicate the fixation and the numbers are the time that the participant looked. The blue line represents the scan path of the eye and small steps on the blue path indicate saccades
The statistical analysis was conducted using Repeated Measures Analysis of Variance (ANOVA) for Mixed Designs in SPSS version 25 (IBM Corp, Armonk, New York).
The distribution of the data was examined using Skewness and Kurtosis values, and outlier analysis was applied due to non-normality. For each variable, Z-scores were calculated to determine whether they fell within 3 standard deviations and normal distribution is assessed prior to data analysis. Additionally, in cases where the assumption of sphericity was violated, Greenhouse-Geisser correction was applied. The effect of mandibular asymmetry on attention, considering its presence on either the right or left side, was examined using a Mixed Design Repeated Measures Analysis of Variance (ANOVA): Asymmetry direction 2 (right and left) x profession 2 (orthodontist and non-professional) x areas of interest 6 (lower lip-chin, eyes, nose, right cheek, left cheek, upper lip) x degree of asymmetry 4 (2 mm, 4 mm, 6 mm, 8 mm). Effect sizes were reported using the partial eta squared (ηp²). Based on the directional hypotheses, planned contrasts were employed to compare attention patterns between orthodontists and non-professionals across specific facial regions, thereby enhancing the precision of our statistical inferences. For assessing intra-observer reliability, the eye movements of randomly selected 20 individuals were recorded and analyzed again after one month. The Intra-Class Correlation Coefficient (ICC) was calculated for intra-observer reliability. The significance level of p < 0.05 was considered statistically significant.
Results
Intra and inter-observer reliability values ranged between 0.652 and 0.903. The highest value was found in fixation duration parameter on the lower-lip chin area and the lowest was in fixation count parameter on the cheeks area.
The number of fixations on the lower lip-chin area in either the right or left direction did not show a statistically significant difference in both groups (F(1,000; 59,000) = 2.133, p > 0.05).
The descriptive statistics of the time to first fixation parameter is shown in Table 1.
Table 1.
The descriptive statistics of time to first fixation parameter as involutary attention
| Area of Interest | Amount of Asymmetry | Mean | Standard Error | 95% Confidence Interval | |
|---|---|---|---|---|---|
| Lower Bound | Upper Bound | ||||
| Chin | 0 mm | 2.248 | 213 | 1.331 | 3.164 |
| 2 mm | 2.422 | 166 | 1.708 | 3.136 | |
| 4 mm | 2.189 | 363 | 625 | 3.753 | |
| 6 mm | 2.358 | 352 | 843 | 3.873 | |
| 8 mm | 2.064 | 225 | 1.094 | 3.034 | |
| Eye | 0 mm | 1.687 | 112 | 1.205 | 2.170 |
| 2 mm | 1.591 | 177 | 828 | 2.354 | |
| 4 mm | 1.904 | 272 | 732 | 3.077 | |
| 6 mm | 1.586 | 206 | 702 | 2.470 | |
| 8 mm | 1.830 | 120 | 1.313 | 2.347 | |
| Nose | 0 mm | 2.311 | 278 | 1.116 | 3.507 |
| 2 mm | 2.091 | 122 | 1.566 | 2.616 | |
| 4 mm | 2.358 | 54 | 2.124 | 2.592 | |
| 6 mm | 1.937 | 147 | 1.304 | 2.570 | |
| 8 mm | 2.302 | 334 | 867 | 3.738 | |
| Right Cheek | 0 mm | 2.684 | 274 | 1.504 | 3.863 |
| 2 mm | 2.540 | 290 | 1.292 | 3.789 | |
| 4 mm | 2.236 | 386 | 574 | 3.897 | |
| 6 mm | 3.264 | 126 | 2.721 | 3.808 | |
| 8 mm | 1.610 | 281 | 402 | 2.818 | |
| Left Cheek | 0 mm | 2.184 | 267 | 1.035 | 3.334 |
| 2 mm | 2.099 | 401 | 375 | 3.824 | |
| 4 mm | 2.343 | 356 | 810 | 3.876 | |
| 6 mm | 2.725 | 670 | −158 | 5.609 | |
| 8 mm | 2.728 | 616 | 78 | 5.379 | |
| Upper Lip | 0 mm | 2.443 | 363 | 883 | 4.003 |
| 2 mm | 2.374 | 137 | 1.784 | 2.965 | |
| 4 mm | 2.367 | 125 | 1.828 | 2.905 | |
| 6 mm | 2.304 | 447 | 379 | 4.228 | |
| 8 mm | 1.969 | 204 | 1.092 | 2.846 | |
There was no statistically significant difference between groups in time to first fixation parameter on areas of interest (F(1,802;3,604) = 1.466, p > 0.05). When specifically examining the time to first fixation on the lower lip-chin area, there was no statistically significant difference in professional group (F(1,803;3,607) = 1.670, p > 0.05, ηp² = 0.455). However, there was a statistically significant difference between 2 mm and 8 mm asymmetry (F(1,2) = 31.423, p < 0.05, ηp² = 0.940). Accordingly, time to first fixation on the lower lip-chin area in 8 mm asymmetry (M = 2064.5 ms, SD = 225.4) was significantly shorter than 2 mm asymmetry (M = 2421.8 ms, SD = 165.8) (Table 2).
Table 2.
The pairwise comparisons of time to first fixation parameter between asymmetry groups in lower lip-chin AOI
| Amount of asymmetry | Mean Difference | Standard. Error | p | 95% Confidence Interval for Difference | ||
|---|---|---|---|---|---|---|
| Lower | Upper | |||||
| 0 mm | 2 mm | −174,345 | 165,690 | 1.000 | −2.509 | 2.160 |
| 4 mm | 58,813 | 174,355 | 1.000 | −2.398 | 2.515 | |
| 6 mm | −110,612 | 267,172 | 1.000 | −3.875 | 3.654 | |
| 8 mm | 183,460 | 161,732 | 1.000 | −2.095 | 2.462 | |
| 2 mm | 4 mm | 233,159 | 239,074 | 1.000 | −3.135 | 3.601 |
| 6 mm | 63,733 | 186,261 | 1.000 | −2.561 | 2.688 | |
| 8 mm | 357,806 | 63,829 | 0.304 | −541 | 1.257 | |
| 4 mm | 6 mm | −169,425 | 191,707 | 1.000 | −2.870 | 2.532 |
| 8 mm | 124,647 | 185,477 | 1.000 | −2.489 | 2.738 | |
| 6 mm | 8 mm | 294,072 | 130,118 | 1.000 | −1.539 | 2.127 |
Time to first fixation parameter measured the latency from the stimulus onset until the participant first fixated on a particular AOI, providing an index of the initial attentional salience or perceptual prominence of that region
A significant difference between orthodontist and non-professional participants was observed among 2 mm to 8 mm asymmetry images in lower lip-chin area (F (1,2) = 20.758, p < 0.05, ηp² = 0.912). Fixation before parameter on the lower lip-chin area in the 8 mm asymmetry images for orthodontist group was significantly less than that in the 2 mm asymmetry images compared to non-professional participants. (F(5, 290) = 75.599, p < 0.001, ηp² = 0.566) (Fig. 3).
Fig. 3.
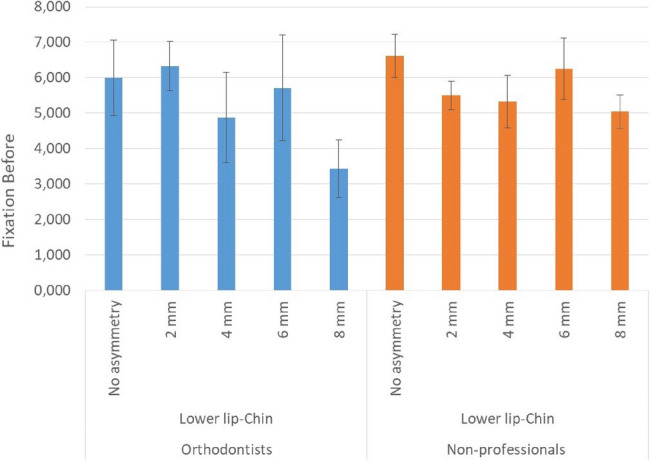
Bar plots with error bars showing mean and standard deviation of fixation before parameter for the lower lip-chin AOI. Fixation before parameter represents the number of fixations made elsewhere on the stimulus before the first fixation on the AOI, serving as an indicator of the attention-grabbing capability of that region
An increase in fixation counts was observed in both groups with an increase in the severity of the asymmetry in the lower lip-chin area. Statistically significant differences were observed between no asymmetry and 8 mm asymmetry F(1,58) = 9.279, p < 0.005, ηp² = 0.138; between 2 mm and 8 mm asymmetries: F(1,58) = 6.376, p < 0.05, ηp² = 0.099; and between 6 mm and 8 mm asymmetries: F(1,58) = 6.345, p < 0.05, ηp² = 0.099). The difference between participant groups was not significant (p > 0.05) (Table 3).
Table 3.
Pairwise comparisons of fixation count parameter between asymmetry groups in lower lip-chin AOI
| Amount of asymmetry | Mean Difference | Standard. Error | p | 95% Confidence Interval for Difference | ||
|---|---|---|---|---|---|---|
| Lower | Upper | |||||
| 0 mm | 2 mm | 0.001 | 0.001 | 1.000 | −0.002 | 0.004 |
| 4 mm | −0.001 | 0.001 | 1.000 | −0.003 | 0.002 | |
| 6 mm | 0.003 | 0.001 | 0.079 | 0.0001 | 0.006 | |
| 8 mm | 0.0001 | 0.001 | 1.000 | −0.002 | 0.003 | |
| 2 mm | 4 mm | −0.002 | 0.001 | 0.777 | −0.004 | 0.001 |
| 6 mm | 0.002 | 0.001 | 0.677 | −0.001 | 0.005 | |
| 8 mm | −0.001 | 0.001 | 1.000 | −0.003 | 0.002 | |
| 4 mm | 6 mm | 0.003 | 0.001 | 0.004 | 0.001 | 0.006 |
| 8 mm | 0.001 | 0.001 | 1.000 | −0.002 | 0.004 | |
| 6 mm | 8 mm | −0.003 | 0.001 | 0.027 | −0.05 | 0.0001 |
Fixation Count refers to the number of fixations made on a particular AOI, calculated as a percentage of all fixations recorded during the trial. It indicates how much visual attention the region received relative to the total viewing period
The fixation durations varied across different areas of interest for the participants (F(5,205) = 68.398, p < 0.001, ηp² = 0.625). Participants primarily fixated on the eyes (Mean = 0.457 ms., SD = 0.034), followed by the nose (Mean = 0.196 ms., SD = 0.022), upper lip (Mean = 0.137ms., SD = 0.013), and the lower lip-chin area (Mean = 0.092ms., SD = 0.016). Statistically significant difference in fixation duration was observed between the 2 mm, 4 mm, and 6 mm asymmetry images compared to the images with 8 mm asymmetry on the lower lip-chin area (p < 0.05). Participants fixated longer on the lower lip- chin area in the images with 8 mm asymmetry (Mean = 0.111 ms., SD = 0.019) compared to the images with 2 mm, 4 mm, and 6 mm asymmetry images (Mean = 0.092 ms., SD = 0.016). There was no difference in fixation durations between participant groups.
Regardless of their group, participants increased their fixation duration on the lower lip-chin area as the asymmetry increased. In images without asymmetry, with 2 mm, 4 mm, and 6 mm asymmetry, participants first focused on the eye area (Mean = 1719.81 ms., SD = 177.50), then on the nose area (Mean = 2199.98 ms., SD = 186.97), and subsequently on the lower lip-chin area (Mean = 2256.04 ms., SD = 263.96). However, in images with 8 mm asymmetry, to the sequence was; the eyes (Mean = 1829.95, SD = 120.11), the lower lip-chin area (Mean = 2064.05, SD = 225.41), and the nose area (Mean = 2302.42, SD = 333.57) (p < 0.05) (Tables 4 and 5). When considering the parameter of fixation duration, norm hierarchy did not change in asymmetry groups (p > 0.05).
Table 4.
The descriptive statistics of fixation duration parameter as voluntary attention in lower lip-chin AOI
| Area of interest | Amount of Asymmetry | Mean | Standard Error | 95% Confidence Interval | |
|---|---|---|---|---|---|
| Lower | Upper | ||||
| Chin | 0 mm | 0.081 | 0.014 | 0.054 | 0.109 |
| 2 mm | 0.085 | 0.016 | 0.054 | 0.117 | |
| 4 mm | 0.091 | 0.017 | 0.057 | 0.124 | |
| 6 mm | 0.092 | 0.016 | 0.059 | 0.125 | |
| 8 mm | 0.111 | 0.019 | 0.072 | 0.149 | |
| Eye | 0 mm | 0.467 | 0.034 | 0.399 | 0.536 |
| 2 mm | 0.457 | 0.034 | 0.388 | 0.526 | |
| 4 mm | 0.468 | 0.034 | 0.399 | 0.537 | |
| 6 mm | 0.453 | 0.034 | 0.383 | 0.522 | |
| 8 mm | 0.442 | 0.036 | 0.370 | 0.514 | |
| Nose | 0 mm | 0.187 | 0.019 | 0.148 | 0.226 |
| 2 mm | 0.207 | 0.024 | 0.159 | 0.255 | |
| 4 mm | 0.195 | 0.023 | 0.148 | 0.242 | |
| 6 mm | 0.198 | 0.025 | 0.148 | 0.248 | |
| 8 mm | 0.192 | 0.021 | 0.150 | 0.234 | |
| Right cheek | 0 mm | 0.014 | 0.003 | 0.008 | 0.020 |
| 2 mm | 0.012 | 0.004 | 0.004 | 0.020 | |
| 4 mm | 0.012 | 0.003 | 0.006 | 0.019 | |
| 6 mm | 0.012 | 0.003 | 0.006 | 0.017 | |
| 8 mm | 0.014 | 0.003 | 0.007 | 0.021 | |
| Left cheek | 0 mm | 0.011 | 0.002 | 0.007 | 0.015 |
| 2 mm | 0.009 | 0.001 | 0.006 | 0.011 | |
| 4 mm | 0.006 | 0.001 | 0.003 | 0.009 | |
| 6 mm | 0.007 | 0.001 | 0.005 | 0.010 | |
| 8 mm | 0.007 | 0.001 | 0.004 | 0.009 | |
| Upper lip | 0 mm | 0.142 | 0.015 | 0.111 | 0.173 |
| 2 mm | 0.130 | 0.012 | 0.105 | 0.155 | |
| 4 mm | 0.139 | 0.015 | 0.109 | 0.168 | |
| 6 mm | 0.133 | 0.014 | 0.105 | 0.162 | |
| 8 mm | 0.142 | 0.014 | 0.113 | 0.171 | |
Table 5.
The pairwise comparions of fixation duration parameter between asymmetry groups in lower lip-chin AOI
| Amount of asymmetry | Mean Difference | Standard Error | p | 95% Confidence Interval | ||
|---|---|---|---|---|---|---|
| Lower | Upper | |||||
| 0 mm | 2 mm | −0.004 | 0.007 | 1.000 | −0.025 | 0.017 |
| 4 mm | −0.009 | 0.007 | 1.000 | −0.030 | 0.011 | |
| 6 mm | −0.011 | 0.009 | 1.000 | −0.037 | 0.015 | |
| 8 mm | −0.029 | 0.010 | 0.064 | −0.060 | 0.001 | |
| 2 mm | 4 mm | −0.005 | 0.008 | 1.000 | −0.029 | 0.018 |
| 6 mm | −0.007 | 0.009 | 1.000 | −0.033 | 0.019 | |
| 8 mm | −0.026 | 0.010 | 0.112 | −0.054 | 0.003 | |
| 4 mm | 6 mm | −0.002 | 0.009 | 1.000 | −0.027 | 0.024 |
| 8 mm | −0.020 | 0.009 | 0.270 | −0.046 | 0.006 | |
| 6 mm | 8 mm | − 0.0019 | 0.006 | 0.030 | −0.036 | −0.001 |
Fixation Duration refers to the total time the gaze remained on a particular AOI, calculated as a percentage of the total trial duration. It indicates how long the participant visually focused on that region relative to the entire viewing period
Discussion
In this study, the eye movements of two different participant groups were examined using eye tracking technology to objectively investigate the impact of mandibular asymmetry on visual attention. Less than 8 mm mandibular asymmetry did not significantly affect visual attention, but fixations occurred more rapidly in the 8 mm asymmetry images. As expected orthodontists focused faster on the lower jaw area by making fewer fixations before in the presence of 8 mm mandibular asymmetry compared to the non-orthodontic group. Regardless of mandibular asymmetry, the eye region was found to be the longest observed facial area for both groups. Up to 8 mm of asymmetry, the visual hierarchy within the facial area was observed as eyes, nose, and lower lip-jaw. However, in the 8 mm mandibular asymmetry images, the visual hierarchy changed to eyes, lower lip-jaw, and nose respectively. This study provides clinically relevant and objectively measurable insights into how mandibular asymmetries are perceived by both orthodontists and laypersons in a social context. Analyzing eye movement patterns using an eye-tracking device, we were able to identify specific visual attention patterns and areas of interest on faces with mandibular asymmetry in both groups. These findings provide valuable insights into the perceptual thresholds and diagnostic attention of orthodontists, as well as the attentional sensitivity of non-professionals. Such data can support clinical decision-making regarding the necessity and extent of treatment for facial asymmetries, enhance patient communication by anticipating concerns, and support the development of more patient-centered treatment planning in orthodontics. They can guide orthodontists in determining the limits of treatment or alternative approaches in cases involving mandibular asymmetry. To our knowledge, no research objectively measured visual attention to mandibular asymmetry.
In this study, although aesthetics and attractiveness were not evaluated, dental aesthetics are directly related to facial and mandibular symmetry. Shaw and colleagues have shown that facial attractiveness and symmetry are important in social success, indicating that individuals with better facial aesthetics are perceived as more successful and socially adept in society [18, 19]. In a study conducted by Faure et al. [20] individuals with ideal symmetry in the facial region were perceived as better, more intelligent, and more educated within the community.
Eye tracking is a technology used to detect, monitor, and analyze a participant’s eye movements. It was used in various fields such as medicine, advertising, psychology, and computer engineering [19]. As compared to commonly used subjective methods like the Visual Analog Scale and Likert Scale, eye tracking provides objective data [21]. Moreover, eye tracking allows for the examination of attention in two distinct categories: involuntary (initial) and voluntary (sustained) attention [22]. Involuntary attention can be defined as a spontaneous response to a region or object. Voluntary attention is analyzed to evaluate the participant’s voluntary focus on a stimulus, providing a quantitative measure [23].
There were differences in the perception of visual attention on facial areas among professional groups. Naini et al. [14] compared visual attention on the images with menton deviation between orthodontic patients, orthodontists, and non-professional groups it was demonstrated that orthodontists were more sensitive in perceiving asymmetry compared to other groups. Huisinga-Fischer et al. [24] found that surgeons and orthodontists were more sensitive in perceiving asymmetry. The present study examined mandibular asymmetry in terms of visual perception using an eye-tracking device. No difference was observed between orthodontists and non-professionals. In previous studies, more subjective methods were used and the effect of asymmetry on visual attention was evaluated by showing images to participants and asking them to score the asymmetry using the visual analog scale or Likert scale. In this study, visual attention was evaluated by recording eye movements without participants having prior knowledge of the study’s subject matter.
Wolanski et al. [15] mentioned that the right-sided asymmetry in female models took more visual attention compared to the left-sided asymmetry in male models. However, in this study, the direction of asymmetry was not the only variable creating perceptual differences. Considering the possibility that gender differences might also affect perception, in our study, the genders of individuals in the images with asymmetry were equally represented. In our study, no visual perceptual difference was found between asymmetry in the right and left directions in both participant groups. This result indicates that the direction of asymmetry will not affect treatment decisions and that participants have similar perceptions in both directions.
There was no significant difference between the amounts of asymmetry among professional groups regarding the time taken to focus on areas of interest. Similarly, when comparing professional groups in terms of the time taken for the first fixation specifically on the lower lip-chin area no significant difference was observed. This result indicates that an individual’s profession did not have an impact on the initial attentional perception concerning different degrees of asymmetry.
The parameter of fixation before represents an involuntary attentional parameter and provides information about the attention-catching ability of the area of interest. 8 mm mandibular asymmetry attracted attention more rapidly from orthodontists compared to the non-professional group, compared to 2 mm mandibular asymmetry. This might be interpreted as orthodontists are more sensitive to occlusal anomalies, asymmetries, and anomalies related to the lower jaw region, leading them to focus more swiftly on the mandible in cases of anomalies compared to the non-professional group. There was no such difference found between professional groups concerning the parameter of time to the first fixation. This indicates that before focusing on the area of interest, orthodontists made fewer but longer fixations, indicating a general focus on the facial examination. This could be interpreted as them evaluating the points they focus on for their profession with longer and more detailed observations.
Regarding the voluntary attention parameters; fixation duration and fixation count, participants exhibited variations in fixation count and duration in different areas of interest. In comparison between non-asymmetry and 8 mm mandibular asymmetry images, participants demonstrated a higher fixation duration and count in the lower lip-jaw area in images with 8 mm mandibular asymmetry. Regardless of their professional groups, participants showed an increase in fixation duration and count in the lower lip-jaw area as the asymmetry severity increased. That means the ongoing attention shown by the participants based on asymmetry severity is not influenced by their professional backgrounds. Participants from different professions exhibited more voluntary attention to images with 8 mm asymmetry compared to other asymmetry groups. There was no difference between orthodontist and non-professional groups. Mandibular asymmetry as a stimulus initially attract attention in a similar manner between groups. Although mandibular asymmetry initially affects visual attention differently, the sustained attention was similar between groups in the ongoing process.
In studies conducted using eye-tracking technology, it was observed that the most prominent area was the eyes, followed by the nose and mouth region. However, this hierarchy of perception might change, in relation to the strength of the stimulus impact on perception. This variable could be anything on the face deviating from the normal morphology, color, texture, etc. for the face and of course the asymmetry. For instance, changes in dental attractiveness or facial aesthetics influence the order of attracting attention to different areas [13]. In individuals with compromised dental aesthetics, the mouth area attracted more visual attention compared to the eyes [12]. However, in photographs of individuals in a rest position where dental aesthetics are not apparent, the visual perception hierarchy did not change. The images obtained in our study are frontal rest position images where the teeth were not visible. In this study, the sole factor that could create differences in visual attention was the mandibular asymmetries created in the mandible. The normal hierarchy remains unchanged with mandibular asymmetries up to 8 mm. However, in images with 8 mm asymmetry, attention to the jaw area surpassed the nose region. Nevertheless, in all cases, including 8 mm asymmetry, the area that received the most attention was the eye region.
Although gender balance was maintained in participant recruitment, the present study was not powered to test gender differences statistically. Exploratory models including gender revealed no significant main or interaction effects. Given that recent high-powered studies using validated face matching tasks have similarly found no reliable gender effects [25, 26], we interpret the role of gender in face perception to be minimal in this context.
In the literature, the reliability of the method has been assessed using various reliability tests. However, some studies have advised against evaluating reliability due to the potential memory effect associated with repeated redisplat of the images and the specific nature of the study, which could lead to misleading conclusions. The main point of debate centers on whether reliability analyses are compatible with the nature of the experiment. Questions arise regarding the appropriate timing of such analyses, the required sample size, and methodological feasibility. To date, no evidence-based research has clearly defined the aforementioned conditions. Conducting them concurrently with the main experiment may significantly prolong the session, potentially compromising the accuracy of the primary data. On the other hand, performing them at a later stage may adversely affect the data due to memory effect. In the present study, the eye movements of the participants were re-analyzed one month after the experiment, and ICC values were reported. The highest value was observed in fixation duration on the lower-lip/chin area, likely due to the perceptual salience of this region. In contrast, lower ICC values in the cheek area may be explained by its limited visual informativeness and reduced fixation density, consistent with prior findings on face scanning patterns [27, 28]. Nevertheless, we recommend that readers interpret reliability results with caution and in the light of previous studies that questioned the appropriateness of reliability assessment in similar contexts.
The present study is subject to several limitations. Firstly, the orthodontist participants included were selected from a specific age range and level of clinical experience, which may limit the representativeness of the sample. A similar constraint applies to the non-professional participants. The inclusion of individuals from a broader spectrum of age groups and varying levels of expertise would enhance the generalizability of the findings. Another limitation pertains to the predetermined ranges and the upper and lower severity thresholds set for the anomaly evaluated in the study. Although efforts were made to minimize participant awareness of the study’s aim—such as attractiveness ratings and visual cues like nasal or ocular asymmetries—the extended duration of the experiment might risk the objectivity and reliability of the data. Consequently, the anomalies were presented within a clinically defined range and restricted to specific severity levels to ensure consistency and control within the experimental framework. Although the sample size was determined through a priori power analysis and deemed statistically adequate, future studies can be conducted including a broader range of participants in terms of age, cultural background, socioeconomic status, experience level to assess how these factors influence the visual perception of mandibular asymmetries. Incorporating dynamic facial expressions or video stimuli rather than static images may better reflect real-world social interactions, allowing for a more ecologically valid assessment of how asymmetries are perceived in everyday life.
Conclusion
The hypotheses of the study were partially accepted. While the direction of mandibular asymmetry did not affect voluntary attention, an increase in asymmetry, regardless of profession, attracted more involuntary attention to the lower lip-chin area. Orthodontists fixated faster on the lower jaw area by making fewer fixations before in 8 mm mandibular asymmetry images compared to the non-professional group. There was no difference in fixation count and duration between professional groups. In all asymmetry conditions, the eye region received most visual attention, but only in the parameter of involuntary attention, a shift towards the lower lip area is observed after the eyes in images with 8 mm asymmetry.
Authors’ contributions
E.S., F.D., B.D., S.A.-Conceptualization; F.D., B.D., S.A.- methodology; B.D. -software ; E.S., B.D.-data acquistation; F.D., B.D., S.A.-data analysis; E.S., F.D., B.D., S.A.-investigation; E.S., F.D-writing— original draft preparation; E.S., F.D., B.D., S.A. - writing—review and editing.
Funding
None.
Data availability
The data supporting this study’s findings are available from the corresponding author upon reasonable request.
Declarations
Ethics approval and consent to participate
The ethical approval for this study was obtained from the Ege University Medical Research Ethics Committee (21-6.1T/19), and written informed consent was obtained from each participant (Decision no: E-99166796-050.06.04207328, 21-6.1T/19).
Consent for publication
Written informed consent was obtained from all participants who participated to the study.
Competing interests
The authors declare no competing interests.
Footnotes
Publisher’s Note
Springer Nature remains neutral with regard to jurisdictional claims in published maps and institutional affiliations.
References
- 1.Sezgin OS, Celenk P, Arici S. Mandibular asymmetry in different occlusion patterns. Angle Orthod. 2007;77:803–7. [DOI] [PubMed] [Google Scholar]
- 2.Peck S, Peck L, Kataja M. Skeletal asymmetry in esthetically pleasing faces. Angle Orthod. 1991;61:43–8. [DOI] [PubMed] [Google Scholar]
- 3.Almasan OC, Baciut M, Hedesiu M, Bran S, Almasan H, Baciut G. Posteroanterior cephalometric changes in subjects with temporomandibular joint disorders. Dentomaxillofac Radiol. 2013;42: 20120039. [DOI] [PMC free article] [PubMed] [Google Scholar]
- 4.Ramirez-Yanez GO, Stewart A, Franken E, Campos K. Prevalence of mandibular asymmetries in growing patients. Eur J Orthod. 2011;33:236–42. [DOI] [PubMed] [Google Scholar]
- 5.Kawakami M, Yamamoto K, Inoue M, Kawakami T, Fujimoto M, Kirita T. Morphological differences in the temporomandibular joints in asymmetrical prognathism patients. Orthod Craniofac Res. 2006;9:71–6. [DOI] [PubMed] [Google Scholar]
- 6.Jamilian A, Showkatbakhsh R. Non-surgical treatment of mandibular deviation: a case report. Aust Orthod J. 2010;26:201–5. [PubMed] [Google Scholar]
- 7.Beiser FC. Diotima’s children: German aesthetic rationalism from Leibniz to Lessing. New York: Oxford University Press; 2011. [Google Scholar]
- 8.Meyer-Marcotty P, Alpers GW, Gerdes ABM, Stellzig-Eisenhauer A. How others perceive orthognathic patients: an eye-tracking study. World J Orthod. 2010;11:153–9. [PubMed] [Google Scholar]
- 9.Meyer-Marcotty P, Gerdes AB, Reuther T, Stellzig-Eisenhauer A, Alpers GW. Persons with cleft lip and palate are looked at differently. J Dent Res. 2010;89:400–4. [DOI] [PubMed] [Google Scholar]
- 10.Meyer-Marcotty P, Gerdes AB, Stellzig-Eisenhauer A, Alpers GW. Visual face perception of adults with unilateral cleft lip and palate in comparison to controls–an eye-tracking study. Cleft Palate Craniofac J. 2011;48:210–6. [DOI] [PubMed] [Google Scholar]
- 11.Thai JK, Araujo E, McCray J, Schneider PP, Kim KB. Esthetic perception of clear aligner therapy attachments using eye-tracking technology. Am J Orthod Dentofacial Orthop. 2020;158:400–9. [DOI] [PubMed] [Google Scholar]
- 12.Richards MR, Fields HW Jr., Beck FM, Firestone AR, Walther DB, Rosenstiel S, et al. Contribution of malocclusion and female facial attractiveness to smile esthetics evaluated by eye tracking. Am J Orthod Dentofacial Orthop. 2015;147:472–82. [DOI] [PubMed] [Google Scholar]
- 13.Dindaroğlu F, Doğan S, Amado S. Doğan visual perception of faces with unilateral and bilateral cleft lip and palate: an eye-tracking study. Orthod Craniofac Res. 2017;20:44–54. [DOI] [PubMed] [Google Scholar]
- 14.Naini FB, Garagiola U, Wertheim D. Analysing chin prominence in relation to the lower lip: the lower lip-chin prominence angle. J Craniomaxillofac Surg. 2019;47(8):1310–6. [DOI] [PubMed] [Google Scholar]
- 15.Wolanski RB, Gasparello GG, Miyoshi CS, Guimaraes LK, Saga AY, Tanaka OM. Evaluation of the perception of smile esthetics, in frontal view, with Mandibuklar laterognatism, through the ey-tracking technique. J Orthod Sci. 2020;9:7. [DOI] [PMC free article] [PubMed] [Google Scholar]
- 16.DeBruine LM, Jones BC, Unger L, Little AC, Feinberg DR. Dissociating averageness and attractiveness: attractive faces are not always average. J Exp Psychol Hum Percept Perform. 2007;33:1420–30. [DOI] [PubMed] [Google Scholar]
- 17.De Carvalho Barbosa PB, Santos PL, De Carli JP, Luiz de Freitas PH, Pithon MM, Paranhos LR. Aesthetic facial perception and need for intervention in laterognathism in women of different ethnicities. J Craniomaxillofac Surg. 2017;45:1600–6. [DOI] [PubMed] [Google Scholar]
- 18.Shaw WC. The influence of children’s dentofacial appearance on their social attractiveness as judged by peers and lay persons. Am J Orthod. 1981;79:399–415. [DOI] [PubMed] [Google Scholar]
- 19.Shaw WC, Rees G, Dawe M, Charles CR. The influence of dentofacial appearance on the social attractiveness of young adults. Am J Orthod. 1985;87:21–6. [DOI] [PubMed] [Google Scholar]
- 20.Faure JC, Rieffe C, Maltha JC. The influence of different facial components on facial aesthetics. Eur J Orthod. 2002;24:1–7. [DOI] [PubMed] [Google Scholar]
- 21.Corbetta M, Akbudak E, Conturo TE, Snyder AZ, Ollinger JM, Drury HA, et al. A common network of functional areas for attention and eye movements. Neuron. 1998;21:761–73. [DOI] [PubMed] [Google Scholar]
- 22.Näätänen R, Gaillard AW, Mäntysalo S. Brain potential correlates of voluntary and involuntary attention. Prog Brain Res. 1980;54:343–48. [DOI] [PubMed] [Google Scholar]
- 23.Wetzel N. Development of control of attention from different perspec- tives. Front Psychol. 2014;5: 1000. [DOI] [PMC free article] [PubMed] [Google Scholar]
- 24.Huısınga-Fıscher CE, Souren JP, Vd Werken F, Prahl-Andersen B, Van Gınkel F. Perception of symmetry in the face. J Craniofac Surg. 2004;15:128–34. [DOI] [PubMed] [Google Scholar]
- 25.White D, Guilbert D, Varela VP, Jenkins R, Burton AM. GFMT2: a psychometric measure of face matching ability. Behav Res Methods. 2022;54:252–60. [DOI] [PubMed] [Google Scholar]
- 26.Fysh MC, Bindemann M. The Kent face matching test. Br J Psychol. 2018;109:219–31. [DOI] [PubMed] [Google Scholar]
- 27.Fu G, Hu CS, Wang Q, Quinn PC, Lee K. Adults scan own-and other-race faces differently. PLoS One. 2012;7:e37688. [DOI] [PMC free article] [PubMed] [Google Scholar]
- 28.Ma J, Zhang R, Li Y. Age weakens the other-race effect among Han subjects in recognizing own-and other-ethnicity faces. Behav Sci (Basel). 2023;13: 675. [DOI] [PMC free article] [PubMed] [Google Scholar]
Associated Data
This section collects any data citations, data availability statements, or supplementary materials included in this article.
Data Availability Statement
The data supporting this study’s findings are available from the corresponding author upon reasonable request.