

ABSTRACT
This study was designed to characterize the effects of dietary inclusion of condensed tannin (CT) at 2% (wt/wt) dry matter on the goat plasma metabolome and oxidative stress. Barley (BA) and corn (CN) were separately used as starch sources for the control rations, and rations supplemented with CT were BACT and CNCT, respectively. The rations were tested using eight Japanese Shiba × Saanen goats in a replicated 4 × 4 Latin square arrangement (28 days for each period). Plasma was obtained on the last day of each period, and ultra‐high‐performance liquid chromatography–tandem mass spectrometer analysis was performed. Metabolites of BACT/BA and CNCT/CN were mostly associated with primary bile acid biosynthesis and amino acid metabolism and showed strong relationships with lipid metabolism. Moreover, 2% CT supplementation significantly decreased oxidative stress, and the effect was more evident in BACT/BA than in CNCT/CN. Furthermore, correlation analysis between differential metabolites and oxidative stress revealed that plasma reactive molecules were negatively correlated with metabolites belonging to primary bile acid biosynthesis. The present study provides a better understanding of the relationship between plasma metabolome and oxidative stress and supports a shift in concern about using CT as a strategy to enhance ruminant health and production performance.
Keywords: condensed tannin, corn and barley, metabolomics, oxidative stress, ruminant
1. Introduction
The presence of plant polyphenols, such as condensed tannin (CT) in the ruminant diet, has been suggested as beneficial because antibloat, antipathogenic, and antioxidative outcomes were widely observed (Huang et al. 2018; Frutos et al. 2020). Among the CT origins, quebracho is the most studied cultivar thus far. Quebracho CT is widely applied to manufacturing products and is utilized in livestock farming, especially in South and Latin America (Landau et al. 2000). Generally, CT exerts its functional effects by combining with molecules such as nutrients and some oxidative stimuli (e.g., SO2 and NO−; Arts et al. 2002; Riedl and Hagerman 2001) and interfering with specific microbial strains to induce alterations in their metabolites (Buccioni et al. 2015; Frutos et al. 2020). Although such characteristics may lead to an antinutritional effect that hinders the digestion and absorption of nutrients, previous studies demonstrated that if added in the range of 2%–3% of dietary dry matter (DM), the nondegradable nature and poorly absorbable trait of CT in the animal gastrointestinal tract can guarantee its safe and extensive on‐farm application (Patra and Saxena 2011; Henke et al. 2017), especially when compared with hydrolysable tannin, which is water‐soluble and toxic (Silanikove et al. 2001).
Although hardly detected in the plasma (Huang et al. 2018), CT beneficially affects the host (particularly its antioxidative capacity). For instance, CT supplementation at 52.8 g/kg in the grazing ewe diet decreased oxidative stress by reducing the concentration of the plasma lipid oxidation product malonaldehyde (MDA; Buccioni et al. 2017), and a linear increase in superoxide dismutase (SOD) in lamb muscle after dietary inclusion of CT at 0, 20, 30, and 40 mg/kg body weight per day was reported (Mu et al. 2020). Considering that plasma metabolites serve as a pool of biomarkers for diagnosing antioxidative capacity (Andrisic et al. 2018; Dong et al. 2011), elucidating the variations in plasma metabolites may aid in understanding CT mechanisms on host health. However, to our knowledge, a comprehensive overview regarding dietary CT inclusion on goat plasma metabolome variation using ultra‐high‐performance liquid chromatography–tandem mass spectrometer (UPLC‐MS) analysis, and explanation of the correlation between the plasma metabolome and the antioxidant status is limited.
Recently, Frutos et al. (2020) suggested that CT impact on host nutrient metabolism was dependent on dietary components. In practical farming, ruminants consume a large amount of energy substrate to support production needs, and barley and corn, which differ in terms of starch and protein content, are the two major energy substrates widely used in ruminant feed (Nikkhah 2012). Barley is superior in protein content and contains a higher rapidly degradable starch ratio compared with corn and thus has a higher rate (up to 24 h of complete disappearance) and extent of rumen degradation. Conversely, corn has a low protein content but a high ratio of slowly degradable starch, tends to have a slower rate (up to 48 h of complete disappearance), and reduced extent of rumen degradation (Nikkhah 2012; Tian, Liu, and Yayota 2024). Knowing that the differences in degradation can influence the acidity of the rumen and further affect the antioxidative capacity of plasma (Dai et al. 2025). The aforementioned discrepancies encouraged us to hypothesize that dietary CT inclusion would enhance plasma oxidative status by interfering with the plasma metabolome. Furthermore, we anticipated that these effects would vary depending on dietary grains, primarily due to differences in CT affinity with starch and protein in the gastrointestinal tract (Haddad and Nasr 2007). This variation in affinity may result in differences between the metabolites absorbed into the plasma. We aimed to clarify the networks between the plasma metabolome and the oxidative status using goats as the animal model.
2. Materials and Methods
This study was conducted with the consent of the Committee for Animal Research and Welfare of Gifu University (approval ID: #2021‐175). The experimental procedures were conducted following the Guidelines for Proper Conduct of Animal Experiments (Science Council of Japan, 2006) and the Guidelines of Animal Research and Welfare of Gifu University (2008).
2.1. Animals and Experimental Design
Eight castrated, healthy male Japanese Shiba × Saanen goats with similar average body weight (34.4 ± 2.1 kg) and body condition and the same age (2 years old) were allocated in a replicated 4 × 4 Latin square design tested for four diets: barley‐based diet (BA), barley diet plus 2% (wt/wt) CT (BACT), corn‐based diet (CN), and corn diet plus 2% (wt/wt) CT (CNCT). Diets were formulated to have similar energy and protein levels (Table S1) that met the maintenance requirements according to the Nutritional Requirements of Small Ruminants (NRC 2007). Each square lasted 28 days, and goats were maintained individually in metabolic pens (0.8 × 1.2 m) throughout the trial; however, the results of two goats were excluded from the analysis due to getting out of condition in the third period. The CT was purchased from Unitán, Argentina (product model: MGM‐EX) as powder extracted from Quebracho Colorado tree and characterized as having a typical composition of ≥75% CT (other components including catechin, epicatechin, gallocatechin and epigallocatechin were <15%). Goats were fasted for 10 h before blood sampling on day 28. Then, blood was collected from the jugular vein using 10‐mL vacuum tubes containing EDTA (Venoject II: Terumo Co. Ltd., Tokyo, Japan), centrifuged at 3000 rpm and 4 °C for 15 min to obtain plasma, and snap‐frozen at −80 °C. On the day of analysis, plasma samples were thawed on ice and vortexed for 30 s.
2.2. Plasma Biochemical Analysis
For biochemical indices related to energy substrates (glucose, triglyceride, and total cholesterol), including protein metabolism (total protein, urea nitrogen, and ammonia) and liver function (alanine aminotransferase, ALT; aspartate aminotransferase, AST), 10 μL of plasma was spread on the multilayered analytical film specific for each chemical and tested using the colorimetric method on the DRI‐CHEM clinical chemistry system (4000 V, Fujifilm, Tokyo, Japan).
2.3. Oxidative Stress Analysis
Reactive molecules, including malondialdehyde (MDA; Solarbio Science & Technology, Beijing, China), nonesterified fatty acids (NEFA; LabAssay, FUJIFILM‐Wako, Osaka, Japan), and nitric oxide (NO−; Solarbio), were selected as oxidative indicators. Concentrations of superoxide dismutase (SOD; Solarbio), reduced glutathione (GSH; Solarbio), total reducing capacity (TRP, capacity of plasma to reduce divalent copper into cuprous ions; Institute for the Control of Aging, Shizuoka, Japan), and total antioxidant capacity (T‐AOC; Solarbio) were used to reflect antioxidant conditions. Indices were measured using the spectrophotometric method, and procedures during the measurement strictly followed the manufacturer's instructions.
2.4. Metabolomic Analysis
Prior to metabolome analysis, 300 μL of plasma from each goat was diluted in 1190 μL of methanol, and 10 μL of myricetin (1 mg/mL diluted in methanol) was added as the internal standard. Quality control (QC) was established by drawing 200 μL from each diluted plasma for balancing and normalization of the MS result. Samples and QCs were vortexed for 3 min and chilled at −20 °C for 30 min. Then, the samples were centrifuged at 16,000 rpm and 4 °C for 15 min, and the supernatant was recovered for LC‐MS analysis. The untargeted metabolome analyses were performed on an ultra‐high‐performance liquid chromatography–tandem quadrupole time‐of‐flight mass spectrometer (UPLC‐QTOF‐MS, Xevo QToF, Waters, Milford, MA) equipped with a C18 analytical column (ACQUITY UPLC BEH C18; 2.1 mm × 100 mm; Waters). The mobile phases consisted of 0.1% formic acid (A, diluted in UPLC grade ddH2O) and acetonitrile (B). The phase flow rate was 0.4 mL/min, and the sample injection volume was 5.0 μL. The elution gradient was as follows: 0 min, 95% A; 3 min, 80% A; 9–13 min, 5% A; 13.10 min, 95% A; and held at 95% until 16 min. Electrospray ionization was operated in positive and negative modes. The mass spectrometer was operated in MS/MS mode set as follows: capillary voltage, 2.5 kV; in‐source collision‐induced dissociation, 30 V; desolvation temperature, 500 °C; and source temperature, 150 °C. MS1 and MS2 data were acquired in MSE mode at 50–1000 m/z in 0.5 s per scan. The low and high collision energies were set at 6 V and ramped from 15 to 45 V, respectively, for both positive and negative ionization.
2.5. Metabolomic Data Processing and Multivariate Statistical Analysis
Raw data from the MS were converted into .abf format using AnalysisBaseFile Converter (Reifycs Inc., Tokyo, Japan) and processed in MS‐DIAL (Ver. 4.9; Tsugawa et al. 2015). The retention time shift, mass accuracy, and relative standard deviation of peak areas were set at 0.3 min, 5 mDa, and 30%, respectively. Ions detected were matched with the in‐house database of MS‐DIAL (Ver. August 21, 2022), and metabolites with a total score higher than 700 were considered identified metabolites. Subsequently, the results from MS‐DIAL were transformed into .csv format, fed to MetaboAnalyst (Ver. 5.0; https://www.metaboanalyst.ca/; Pang et al. 2022), and then normalized using an internal standard and log transformation. Normalized data were employed in the SIMCA software package (Ver. 17; MKS Data Analytics Solutions, Umeå, Sweden) for unsupervised principal component analysis (PCA), supervised orthogonal partial least‐squares discriminant analysis (OPLS‐DA), and permutation test of OPLS‐DA results. To refine these results, a volcano plot in MetaboAnalyst was generated for a metabolite overview between the control and the CT supplementation groups. Subsequently, a first principal component of variable importance in the projection (VIP), Student's t‐test, and log2‐fold change (log2FC) were calculated. Metabolites with VIP values >1 and P values <0.05 were recognized as distinct between the control and the CT supplementation groups. Finally, recognized metabolites were analyzed using Pathway Analysis embedded in MetaboAnalyst, and validation of the affected pathways was based on the Bovine Metabolome Database (BMDB), Human Metabolome Database (HMDB), and Kyoto Encyclopedia of Genes and Genomes (KEGG).
2.6. Correlations Between Plasma Metabolites and Redox Indices
To explore the effects of CT on the compositional correlation between different metabolites (VIP > 1 and p < 0.05) and redox indices (p < 0.05), Pearson's correlation coefficient was performed using the pheatmap and psych packages in R software (R core team, v4.0.4; source code detailed in Table S1). Correlation with p < 0.05 was defined as significant.
2.7. Statistical Analysis
It is essential to ascertain whether there are discernible metabolomic variances between goats that consume a barley‐based diet and those that consume a corn‐based diet, as the discrepancies may influence the disparity in plasma oxidative stress. Therefore, we compared the barley‐based diet with the barley diet plus 2% (wt/wt) CT (BA vs. BACT) and the corn‐based diet with the corn diet plus 2% (wt/wt) CT (CN vs. CNCT). Data including blood biochemicals and oxidative stress indices were analyzed according to a randomized complete block design using SPSS software (v20.0, IBM, Armonk, NY, United States) according to the following model:
where Y ij represents the dependent variable, μ represents the overall mean, τ i represents the fixed effect of dietary treatment, β j represents the random effect of goats held within a square, and ε ij represents the residual error. The results are presented as the mean ± standard error of the mean (SEM). Differences in the mean values were compared by t‐test. A P value lower than 0.05 was considered significant.
3. Results
3.1. Animal Performance
Goats used in the present experiment consumed all feed offered regardless of treatment (p > 0.05; Table S2) due to restricted feeding and showed little variation in body weight after the experiment (p > 0.05).
3.2. Plasma Biochemicals
In the present study, the plasma cholesterol concentration was higher in BACT than in BA (p < 0.01; Table 1) and was higher in CNCT than in CN (p = 0.02). The content of urea nitrogen was higher in BACT than in BA (p < 0.01). The effect of CT supplementation on triglyceride levels varied depending on the basal diet, with a lower level in BACT compared to BA (p < 0.01) but a higher level in CNCT compared to CN (p < 0.01). Other indices, including glucose, total protein, albumin, ALT, and AST, were similar between the treatments (p > 0.05).
TABLE 1.
Effects of different diets on plasma biochemicals in goats.
| Treatment | Treatment | |||||||
|---|---|---|---|---|---|---|---|---|
| Items1 | BA | BACT | SEM | p | CN | CNCT | SEM | p |
| Energy substrate | ||||||||
| Glucose (mg/dL) | 73.50 | 75.67 | 1.31 | 0.44 | 75.50 | 76.17 | 2.16 | 0.89 |
| Triglyceride (mg/dL) | 32.33 | 17.50 | 2.68 | <0.01 | 17.00 | 36.50 | 3.43 | <0.01 |
| Cholesterol (mg/dL) | 49.83 | 82.50 | 5.24 | <0.01 | 58.67 | 66.67 | 1.86 | 0.02 |
| Protein metabolism | ||||||||
| Total protein (g/dL) | 7.23 | 6.95 | 0.15 | 0.18 | 7.08 | 6.70 | 0.13 | 0.14 |
| Albumin (g/dL) | 3.85 | 3.96 | 0.05 | 0.23 | 3.98 | 3.95 | 0.07 | 0.82 |
| PUN (mg/dL) | 6.05 | 4.07 | 0.34 | <0.01 | 8.42 | 8.52 | 0.24 | 0.85 |
| Liver function | ||||||||
| ALT (IU/L) | 19.83 | 21.67 | 0.83 | 0.29 | 20.67 | 21.00 | 0.78 | 0.84 |
| AST (IU/L) | 58.00 | 62.33 | 1.78 | 0.24 | 61.33 | 65.50 | 2.55 | 0.44 |
Abbreviations: BA, barley‐based diet; BACT, barley‐based diet +2% condensed tannin; CN, corn‐based diet; CNCT, corn‐based diet +2% condensed tannin; PUN, plasma urea nitrogen; ALT, alanine aminotransferase; AST, aspartate aminotransferase.
3.3. Multivariate and Pathway Variations
A total of 1217 and 393 MS peaks were identified in positive and negative ionization for the plasma, respectively. Through comparing the structural similarities with the MS‐DIAL database, these valid peaks corresponded to 130 (positive) and 87 (negative) metabolites (Table S3). The PCA and OPLS‐DA score plots of all samples were inside the 95% Hotelling T‐squared ellipse (Figure 1). As seen in the figure, there was an obvious PCA plot separation between CNCT and CN from negative ionization. However, the PCA plots of CNCT/CN from positive ionization and BACT/BA from both positive and negative ionization only showed partial separations. There were distinct separations between the control and the CT‐supplemented groups in the OPLS‐DA plots regardless of the MS mode. The R 2 Y intercepts of all permutation tests were higher than 0.3, and Q 2 was close to 1, indicating that the OPLS‐DA models had good interpretability and predictability. As visualized in the volcano plot for positive ionization, five metabolites were different in BACT/BA, and 14 metabolites were different in CNCT/CN (Figure 2A, B); for negative ionization, 10 metabolites were observed distinct in BACT/BA, and 63 distinct metabolites were observed in CNCT/CN (Figure 2C, D).
FIGURE 1.

Metabolite profiles of goats fed different diets. A and D, and G and J were principal component analysis (PCA) for barley‐based diet (BA) vs. barley‐based diet plus 2% of dietary condensed tannin (BACT) and corn‐based diet (CN) vs. corn‐based diet plus 2% of dietary condensed tannin (CNCT), respectively. B and E, H and K were orthogonal partial least‐squares discriminant analysis (OPLS‐DA) for BA vs. BACT and CN vs. CNCT, respectively. C and F, and I and L are permutation analyses for BA vs. BACT and CN vs. CNCT, respectively. A, G, B, H, C, and I were derived from positive ionization, and D, J, E, K, F, and L were derived from negative ionization.
FIGURE 2.
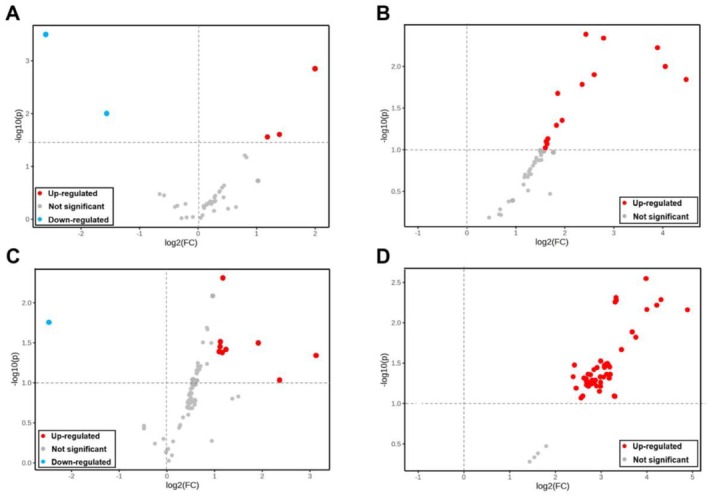
Volcano plots of plasma metabolites. A and C were generated from positive and negative MS ionization, respectively, from goats fed a barley‐based diet vs. a barley‐based diet plus 2% dietary condensed tannin. C and D were generated from positive and negative MS ionization, respectively, from goats fed a corn‐based diet vs. a corn‐based diet plus 2% dietary condensed tannin. X axes represent P values of data after −log10 normalization. The Y‐axes represent the fold change of −log2‐normalized data.
After further filtration, the major differential metabolites in BACT/BA and CNCT/CN (VIP > 1, p < 0.05) are shown in Table 2. Compared with BA, BACT had a higher concentration of cholic acid (log2FC = 1.16), which is a major primary bile acid produced in the liver, and glycochenodeoxychololic acid (log2FC = 3.14), which is an acyl glycine belonging to the secondary bile acid. However, the other acyl glycine phenylacetylglycine (log2FC = −2.59) derived from phospholipid metabolism showed lower concentrations after CT inclusion. Goats fed the corn‐based diet supplemented with CT showed a total increase in plasma metabolites compared with goats fed the unsupplemented corn‐based diet. The altered metabolites included amino acids such as tyrosine (log2FC = 3.12), tryptophan (log2FC = 3.08), and phenylalanine (log2FC = 3.06); components belonging to phospholipids such as choline (log2FC = 2.77) and phosphocholine (log2FC = 2.84); primary and secondary bile acids such as cholic acid (log2FC = 3.68), taurocholic acid (log2FC = 3.33), and glycocholate (log2FC = 3.89); endogenous lysophospholipids such as lysophosphatidylcholine (LPC) (16:0/18:1, 9Z; log2FC = 2.43), LPC 18:1 (log2FC = 2.90), LPC 18:3 (log2FC = 2.72), and LPC 13:0 (log2FC = 3.15); and acyl glycine such as hippuric acid (log2FC = 3.76).
TABLE 2.
Plasma metabolites in goats fed different diets.
| Metabolites1 | VIP | log2FC | p | Metabolites | VIP | log2FC | p |
|---|---|---|---|---|---|---|---|
| BACT/BA | Continued (CNCT/CN) | ||||||
| Positive | Deoxycholate | 1.28 | 4.89 | 0.007 | |||
| Phenylacetylglycine | 2.42 | −2.59 | <0.001 | Cholic acid | 1.19 | 3.68 | 0.013 |
| Benzyl alcohol | 2.00 | −1.56 | 0.010 | Hippuric acid | 1.16 | 3.76 | 0.015 |
| 3‐Dehydrocholic acid | 2.19 | 2.00 | 0.001 | Malonic acid | 1.11 | 3.45 | 0.021 |
| Deoxycholic acid | 1.81 | 1.18 | 0.028 | Acetylcarnitine | 1.07 | 2.99 | 0.029 |
| Negative | LPC 13:0 | 1.05 | 3.15 | 0.032 | |||
| Thymol | 1.44 | −2.48 | 0.018 | Indole‐3‐carboxyaldehyde | 1.05 | 3.10 | 0.033 |
| Proline betaine | 1.61 | 1.18 | 0.005 | LPC (16:0/18:1; 9Z) | 1.03 | 2.43 | 0.033 |
| 3‐Oxo‐4‐cholenoic acid | 1.30 | 1.13 | 0.036 | Pipecolic acid | 1.05 | 3.17 | 0.034 |
| Deoxycholate | 1.28 | 1.23 | 0.038 | Tyrosine | 1.04 | 3.12 | 0.034 |
| Cholic acid | 1.27 | 1.16 | 0.041 | p‐Octopamine | 1.04 | 3.08 | 0.034 |
| Hydroxychenodeoxycholate | 1.27 | 1.09 | 0.041 | 2‐Hydroxycinnamic acid | 1.04 | 3.07 | 0.034 |
| Glycochenodeoxychololic acid | 1.25 | 3.14 | 0.046 | 1,5‐Naphthalenediamine | 1.04 | 3.09 | 0.035 |
| CNCT/CN | Propionylcarnitine | 1.04 | 3.19 | 0.035 | |||
| Positive | Tryptophan | 1.04 | 3.08 | 0.035 | |||
| Deoxycholic acid | 1.55 | 2.79 | 0.005 | LPC 18:1 (9Z) | 1.04 | 2.90 | 0.036 |
| Glycocholate | 1.51 | 3.89 | 0.006 | Phosphocholine | 1.03 | 2.84 | 0.038 |
| Glycoursodeoxycholic acid | 1.45 | 4.05 | 0.010 | LPC 18:3 | 1.01 | 2.72 | 0.043 |
| Xanthosine | 1.36 | 4.47 | 0.015 | Isovaleric acid | 1.01 | 3.19 | 0.044 |
| Taurodeoxycholic acid | 1.38 | 2.35 | 0.016 | Choline | 1.00 | 2.77 | 0.044 |
| Negative | Phenylalanine | 1.00 | 3.06 | 0.047 | |||
| Taurocholic acid | 1.28 | 3.33 | 0.005 | Phenylethanolamine | 1.00 | 2.99 | 0.047 |
| Proline betaine | 1.24 | 4.00 | 0.007 | Hexylamine | 0.98 | 2.63 | 0.048 |
Abbreviations: BA, barley‐based diet; BACT, barley‐based diet +2% condensed tannin; CN, corn‐based diet; CNCT, corn‐based diet +2% condensed tannin; LPC, lysophosphatidylcholine.
After mapping all the different metabolites to the KEGG database, we observed that the barley‐based diet supplemented with CT had a remarkable impact on primary bile acid biosynthesis (Figure 3A). The corn‐based diet with CT significantly impacted not only primary bile acid biosynthesis but also phenylalanine metabolism, glycerophospholipid metabolism, and phenylalanine, tyrosine, and tryptophan biosynthesis (Figure 3B).
FIGURE 3.

Plots of metabolic pathway analysis. A and B were condensed tannin supplemented groups compared with the nonsupplemented ones of barley‐based diets and corn‐based diets, respectively. Dots represent metabolic pathways. Darker dots indicate more significant changes in metabolites in the related pathway, whereas dot size indicates the pathway impact score.
3.4. Oxidative Stress Indices
For reactive molecules (Figure 4), MDA and NEFA concentrations decreased through CT inclusion in the BACT group compared to the BA group (p < 0.05); however, such alternation was not significant in NO− (p > 0.05). Little perturbation of reactive molecules was seen in CNCT/CN after CT inclusion (p > 0.05). For antioxidant conditions (Figure 5), SOD, TRC, and T‐AOC contents increased in both BACT and CNCT compared with BA and CN, respectively (p < 0.05). Nevertheless, there was little variation in GSH after CT supplementation in either BACT/BA or CNCT/CN (p > 0.05).
FIGURE 4.

Concentration of plasma reactive molecules, including malondialdehyde (MDA, A), nonesterified fatty acid (NEFA, B), and nitric oxide (NO−, C), in goats fed different diets. BA, barley‐based diet; BACT, barley‐based diet +2% condensed tannin; CN, corn‐based diet; CNCT, corn‐based diet +2% condensed tannin. One asterisk represents p < 0.05, and two asterisks represent p < 0.01.
FIGURE 5.
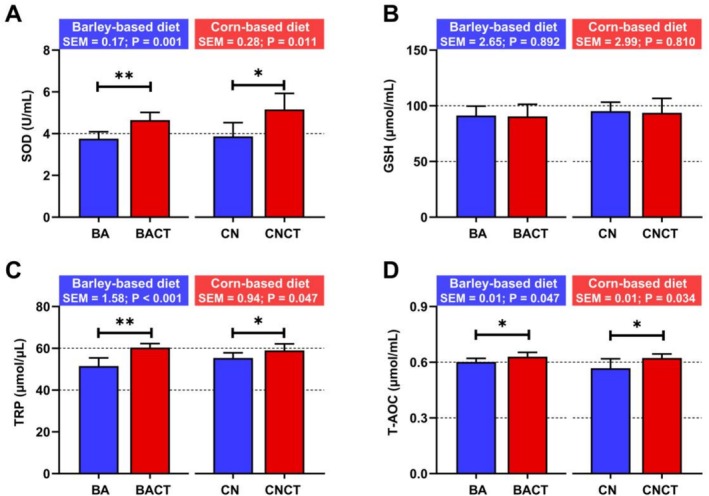
Concentration of plasma oxidative status indices, including superoxide dismutase (SOD, A), glutathione (GSH, B), total reducing power (TRP, μmol of divalent copper equivalent/L, C) and total antioxidant capacity (T‐AOC, D), of goats fed different diets. BA, barley‐based diet; BACT, barley‐based diet +2% condensed tannin; CN, corn‐based diet; CNCT, corn‐based diet +2% condensed tannin. One asterisk represents P < 0.05, and two asterisks represent P < 0.01.
3.5. Correlations Between Differential Metabolites and Oxidative Stress
As shown in Figure 6A, in goats fed barley‐based diets, MDA was negatively correlated with deoxycholate, cholic acid, deoxycholic acid, glycochenodeoxycholic acid, and 3‐oxo‐4‐cholenoic acid (r < 0.71, p < 0.05), and NEFA was negatively correlated with 3‐oxo‐4‐cholenoic acid (r = −0.59, p < 0.05). In contrast, TRP and SOD were positively correlated with hydroxychenodeoxycholate, deoxycholate, cholic acid, deoxycholic acid, 3‐oxo‐4‐cholenoic acid, and glycochenodeoxycholic acid (r > 0.59, p < 0.05), and T‐AOC was positively correlated with hydroxychenodeoxycholate, deoxycholate, cholic acid, deoxycholic acid, 3‐oxo‐4‐cholenoic acid, and proline betaine (r > 0.69, p < 0.05). Moreover, goats fed corn‐based diets displayed fewer significant correlations between metabolites and redox indices on the heatmap (Figure 6B), in which SOD was positively correlated with LPC (16:0/18:1; 9Z), LPC 18:3, and hexylamine (r > 0.59, p < 0.05), and T‐AOC was positively correlated with LPC (16:0/18:1; 9Z; r > 0.59, p < 0.05).
FIGURE 6.
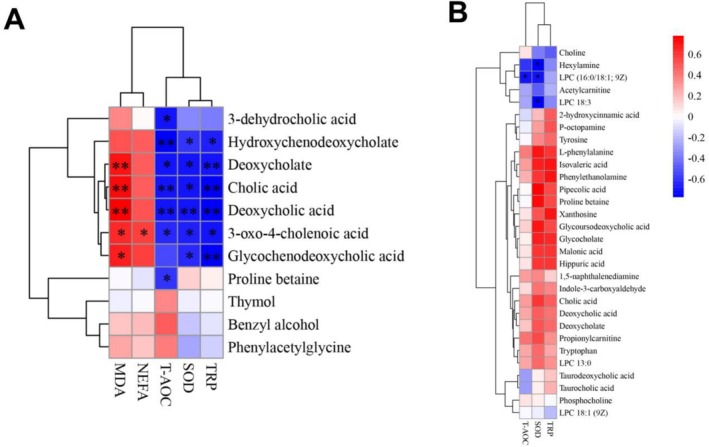
Correlation heatmaps of plasma differential metabolites and redox indices for goats fed barley‐based diets (A) and corn‐based diets (B). Positive and negative correlations are shown in red and blue, respectively, and darker colors represent higher absolute correlation values. Significance was defined using asterisks (one asterisk represents p < 0.05, and two asterisks represent p < 0.01).
4. Discussion
Progress to date indicates that CT cannot only interfere with dietary protein but also selectively suppresses proliferation of rumen bacterial strains to manipulate lipid and fatty acid synthesis (Frutos et al. 2020). Intriguingly, the biochemical responses from the two diets were not identical, although both displayed alternations in energy substrates. In partial agreement with Costa et al. (2021), who reported an indirect increase in plasma cholesterol after supplementing 20 g/kg of Acacia mearnsii CT into lamb diet following the increased digestibility of non‐fiber carbohydrates, we also observed an elevation in plasma total cholesterol in both diets after CT inclusion. However, such alterations failed to appear in the triglyceride and urea nitrogen levels. Peripheral lipids (such as cholesterol and triglycerides) in ruminants are synthesized using acetate or glucose as precursors, both of which are largely produced during the gastrointestinal fermentation of grains (Tian, Liu, and Yayota 2024). As observed in our previous study, dietary CT suppressed rumen fermentation (Tian, Aldian, et al. 2024). Therefore, the increase in total cholesterol could be attributed to the promotion of grain utilization in the intestine under the dietary CT effect. However, the significant decrease in plasma urea nitrogen due to the CT effect in the barley‐based diet was likely due to the higher protein content and faster digestion rate of barley, which permitted CT to effectively bind with dietary proteins in the rumen, inhibiting their degradation by rumen microbes. As a result, NH3‐N production in the rumen decreased, which may consequently lead to a reduction in blood urea levels. This was similarly indicated by Min et al. (2003), who reported that CT can suppress the intestinal absorption of amino acids. In contrast, the higher triglyceride levels observed in the corn‐based diet and the lower levels in the barley‐based diet following CT addition could be attributed to the slower digestion rate of corn compared to barley in the gastrointestinal tract (Nikkhah 2012). Such differences in digestion rate facilitated lipid absorption from the corn‐based diet, but they suppressed lipid absorption from the barley‐based diet. Although it seems that CT indiscriminately binds with nutrient components, the unaffected plasma biochemicals (e.g., total protein and glucose) suggested that the host nutrient metabolism or health condition were unlikely compromised. An array of studies have indicated that dietary inclusion of CT at an appropriate ratio (2%–3% of dietary DM) can be beneficial (Patra and Saxena 2011; Henke et al. 2017). Therefore, the absence of a CT effect on glucose, total protein, albumin, or liver function indicated by ALT and AST in the present study inferred that goats did not have health problems from CT inclusion.
In accordance with Silanikove et al. (2001), there were no CT or CT metabolites existing in the plasma metabolites of all groups, indicating the nondegradable trait of CT in the ruminant gastrointestinal tract. Goats fed a barley‐based diet showed limited disturbance in the plasma metabolome after CT induction. Among the different metabolites, BACT supplementation upregulated cholic acid and glycochenodeoxycholic acid levels, both of which are involved in primary bile acid biosynthesis. Secreted by hepatocyte metabolism of cholesterol, primary bile acid mainly acts as digestive juice for expediting gut lipid assimilation (Hofmann 1999). Intensification of primary bile acid biosynthesis in the plasma suggests that the lipid content in the intestine might accumulate after CT inclusion. Similarly, it is worth mentioning that study supplementation of persimmon CT in the mice diet observed increased bile acid secretion in the feces (Nishida et al. 2021). Because bile acids help the transportation of intestinal lipid molecules to enterocytes to facilitate the assimilation, the recovery of fecal bile acid in that study is indicative of promoted lipid utilization/metabolism, which concords with our speculation that CT in the intestine can promote lipid accumulation and utilization. Therefore, it was reasonable that the plasma total cholesterol was enhanced in BACT‐fed goats compared to BA‐fed goats, which was the reason for CT‐promoted intestinal lipid utilization. Furthermore, enhanced primary bile acid biosynthesis also supported the conclusion that CT beneficially affects fatty acid synthesis (Frutos et al. 2020).
Another function of primary bile acids is to serve as excretions that aid excess stimuli elimination from the intestinal lumen, preventing them from causing oxidative damage to the host (Jia et al. 2018). Such a conclusion was observed in other studies using different animals. According to Cao et al. (2021), a linear increase in T‐AOC was observed from day 29 to 42 of their trial when a series of increasing bile acids were supplemented to weaned pigs. In addition, Yin et al. (2021) noticed that dietary inclusion of bile acid at 200 mg/kg successfully alleviated heat stress–induced oxidative damage by enhancing glutathione peroxidase levels in broiler chicken plasma. In agreement with these findings, the increased SOD, TRC, and T‐AOC contents in the present study also indicated an enhanced antioxidant capacity of BACT‐fed goats compared with BA‐fed goats. Moreover, Pearson's analysis revealed that glycochenodeoxycholic acid positively correlated with SOD and TRP and negatively correlated with the lipid peroxidation product MDA. In fact, glycochenodeoxycholic acid participates in bile acid metabolism and has relatively high hepatic toxicity. However, its antioxidant capacity in the human body was also noticed (Vaz et al. 2010). Recently, a study reported that the absence of this chemical in human plasma directly indicates cholestasis (Li et al. 2020). Thus, CT decreased oxidative stress in goats fed a barley‐based diet, likely by balancing lipogenesis and lipolysis. Of note, the phenylacetylglycine level decreased in the BACT group compared with the BA group. A previous study indicated that phenylacetylglycine was an abnormal metabolite originating from phospholipidosis (Delaney et al. 2004), and reduction of this metabolite also offered the possibility that CT downregulated oxidative stress not only by enhancing bile acid content but also by attenuating the byproduct produced during lipid metabolism.
In contrast to BACT/BA, CNCT/CN exhibited significant variations in the plasma metabolome. Along with primary bile acid biosynthesis, CT inclusion also reinforced glycerophospholipid metabolism and amino acid biosynthesis and metabolism in CNCT compared with CN. Reportedly, the acidic environment in the rumen that occurs when ruminants ingest a large amount of easily fermentable substrates can facilitate CT binding with dietary components, thereby reducing protein digestion in the rumen (Huang et al. 2018; Vasta et al. 2019). Afterward, the higher pH in the intestine promotes CT complex dissociation (McSweeney et al. 2001). The enriched phenylalanine metabolism might reflect the enhancement of intestinal protein utilization by CT, which was consistent with the report from Barry and McNabb (1999). Notably, phenylalanine and tyrosine are key amino acids involved in lipid metabolism (Flydal and Martinez 2013). Simultaneous elevation of these two amino acids thus corresponded to the increased total cholesterol concentration in the plasma.
Strong correlations were observed between antioxidant indices and lysophosphatidylcholine (LPC), and the appearance of LPC in the blood indicated signs of enhanced lipid metabolism. However, data related to LPC in animals are restricted, and the function of LPC in the blood remains controversial. Matsumoto et al. (2007) defined LPC as an inflammatory factor due to its effect on atherosclerosis in humans and mice. Conversely, Yan et al. (2004) reported an antipathogenic consequence after treating mice with LPC both in vitro and in vivo. Because the goats in the present trial showed no evidence of excess lipid peroxidation (little change observed in MDA between CNCT and CN) or imbalanced lipid mobilization (similar NEFA between CNCT and CN; Bernabucci et al. 2005) and decreased oxidative stress (enhanced SOD, TRP, and T‐AOC in CNCT to CN), the latter suggestion of the beneficial function of LPC on the host was hence strongly supported in our study.
To our knowledge, the present study was the first to demonstrate the variations in plasma metabolome and oxidative stress under CT intervention in different grain‐based diets. Indeed, the response from the two diets was distinct. Soldado et al. (2021) suggested that the imparity in host response after CT intervention in diets could be ascribed to multiple linkages involved in the integrated and synergistic cooperation between CT, diet, and host. One valid factor, as mentioned above, was the disparity in digestive tract passage rate between corn and barley, which can induce different timing for CT to exert its function. Moreover, the different CT affinities with dietary components (high affinity with fiber but low affinity with starch; Seifried et al. 2017) should also be accounted for. Finally, due to the rapid ruminal digestion, a barley‐based diet could impose a drastic drop in the gastrointestinal pH, thereby burdening the host absorption and distribution system compared to a corn‐based diet (Jenkins et al. 2003), which can be observed from the different MDA and NEFA levels in the BACT/BA than that in the CNCT/CN. Thus, the decrease of oxidative stress after CT supplementation in barley‐based diet‐fed goats can be seen more as ‘remediation’ rather than ‘manipulation’ in the corn‐based diet.
Dietary CT inclusion decreased goat plasma oxidative stress. There exists a strong correlation between antioxidative capacity and plasma lipid metabolism, and the effect was dependent on dietary basal grain. In summary, CT modified plasma primary bile acid biosynthesis in goats that consumed a barley‐based diet. Meanwhile, CT supplementation in goats fed a corn‐based diet modified plasma metabolites from both primary bile acid biosynthesis and phenylalanine metabolism, which were important pathways related to lipid metabolism. Therefore, the results from the present study may contribute to a better understanding of the relationship between lipid metabolism and oxidative stress and support a shift in concern about using CT as a strategy to enhance ruminant health and production performance.
Conflicts of Interest
The authors declare no conflicts of interest for this article.
Supporting information
Table S1 Ingredients (g/kg as fed) and chemical compositions (g/kg of dry matter) of the basal diets.
Table S2 Effect of different treatments on feed intake and body weight of goats.
Table S3 List of identified metabolites in the plasma.
Acknowledgments
This work was funded by The United Graduate School of Agricultural Science of Gifu University and partially supported by a scholarship from Chinese Scholarship Council (Grant No. 202006990023) awarded to K.E. Tian. The authors thank Prof. Takashima Shigeo at Life Science Research Centre, Gifu University, for his kind assistance during experimental analysis.
Tian, K. E. , He S., Aldian D., Sossou A. P. G., and Yayota M.. 2025. “Variations in Plasma Metabolome Shed Light on the Associations Between Lipid Metabolism and Oxidative Stress in Goats Supplemented With Condensed Tannin.” Animal Science Journal 96, no. 1: e70126. 10.1111/asj.70126.
Funding: This work was supported by The United Graduate School of Agricultural Science of Gifu University (1216101004) and Chinese Scholarship Council (202006990023).
K.E. Tian and Siman He contributed equally to this work.
References
- Andrisic, L. , Dudzik D., Barbas C., Milkovic L., Grune T., and Zarkovic N.. 2018. “Short Overview on Metabolomics Approach to Study Pathophysiology of Oxidative Stress in Cancer.” Redox Biology 14: 47–58. 10.1016/j.redox.2017.08.009. [DOI] [PMC free article] [PubMed] [Google Scholar]
- Arts, M. , Haenen G., Wilms L., et al. 2002. “Interactions Between Flavonoids and Proteins: Effect on the Total Antioxidant Capacity.” Journal of Agricultural and Food Chemistry 50: 1184–1187. 10.1021/jf010855a. [DOI] [PubMed] [Google Scholar]
- Barry, T. N. , and McNabb W. C.. 1999. “The Implications of Condensed Tannins on the Nutritive Value of Temperate Forages Fed to Ruminants.” British Journal of Nutrition 81: 263–272. 10.1017/S0007114599000501. [DOI] [PubMed] [Google Scholar]
- Bernabucci, U. , Ronchi B., Lacetera N., and Nardone A.. 2005. “Influence of Body Condition Score on Relationships Between Metabolic Status and Oxidative Stress in Periparturient Dairy Cows.” Journal of Dairy Science 88: 2017–2026. 10.3168/jds.S0022-0302(05)72878-2. [DOI] [PubMed] [Google Scholar]
- Buccioni, A. , Pauselli M., Minieri S., et al. 2017. “Chestnut or Quebracho Tannins in the Diet of Grazing Ewes Supplemented With Soybean Oil: Effects on Animal Performances, Blood Parameters and Fatty Acid Composition of Plasma and Milk Lipids.” Small Ruminant Research 153: 23–30. 10.1016/j.smallrumres.2017.05.006. [DOI] [Google Scholar]
- Buccioni, A. , Pauselli M., Viti C., et al. 2015. “Milk Fatty Acid Composition, Rumen Microbial Population, and Animal Performances in Response to Diets Rich in Linoleic Acid Supplemented With Chestnut or Quebracho Tannins in Dairy Ewes.” Journal of Dairy Science 98: 1145–1156. 10.3168/jds.2014-8651. [DOI] [PubMed] [Google Scholar]
- Cao, A. , Lai W., Zhang W., et al. 2021. “Effects of Porcine Bile Acids on Growth Performance, Antioxidant Capacity, Blood Metabolites and Nutrient Digestibility of Weaned Pigs.” Animal Feed Science and Technology 276: 114931. 10.1016/j.anifeedsci.2021.114931. [DOI] [Google Scholar]
- Costa, E. I. S. , Ribiero C. V. D. M., Silva T. M., et al. 2021. “Intake, Nutrient Digestibility, Nitrogen Balance, Serum Metabolites and Growth Performance of Lambs Supplemented With Acacia mearnsii Condensed Tannin Extract.” Animal Feed Science and Technology 272: 114744. 10.1016/j.anifeedsci.2020.114744. [DOI] [Google Scholar]
- Dai, D. , Kong F., Wang S., et al. 2025. “Effects of Rumen‐Degradable Starch on Lactation Performance, Gastrointestinal Fermentation, and Plasma Metabolomic in Dairy Cows.” International Journal of Biological Macromolecules 299: 140017. 10.1016/j.ijbiomac.2025.140017. [DOI] [PubMed] [Google Scholar]
- Delaney, J. , Neville W. A., Swain A., Miles A., Leonard M. S., and Waterfield C. J.. 2004. “Phenylacetylglycine, a Putative Biomarker of Phospholipidosis: Its Origins and Relevance to Phospholipid Accumulation Using Amiodarone Treated Rats as a Model.” Biomarkers 9: 271–290. 10.1080/13547500400018570. [DOI] [PubMed] [Google Scholar]
- Dong, G. , Liu S., Wu Y., Lei C., Zhou J., and Zhang S.. 2011. “Diet‐Induced Bacterial Immunogens in the Gastrointestinal Tract of Dairy Cows: Impacts on Immunity and Metabolism.” Acta Veterinaria Scandinavica 53: 48. 10.1186/1751-0147-53-48. [DOI] [PMC free article] [PubMed] [Google Scholar]
- Flydal, M. , and Martinez A.. 2013. “Phenylalanine Hydroxylase: Function, Structure, and Regulation.” IUBMB Life 65: 341–349. 10.1002/iub.1150. [DOI] [PubMed] [Google Scholar]
- Frutos, P. , Hervás G., Natalello A., et al. 2020. “Ability of Tannins to Modulate Ruminal Lipid Metabolism and Milk and Meat Fatty Acid Profiles.” Animal Feed Science and Technology 269: 114623. 10.1016/j.anifeedsci.2020.114623. [DOI] [Google Scholar]
- Haddad, S. G. , and Nasr R. E.. 2007. “Partial Replacement of Barley Grain for Corn Grain: Associative Effects on Lambs' Growth Performance.” Small Ruminant Research 72: 92–95. 10.1016/j.smallrumres.2006.08.005. [DOI] [Google Scholar]
- Henke, A. , Westreicher K. E., Molkentin J., et al. 2017. “Effect of Dietary Quebracho Tannin Extract on Milk Fatty Acid Composition in Cows.” Journal of Dairy Science 100: 6229–6238. 10.3168/jds.2016-12149. [DOI] [PubMed] [Google Scholar]
- Hofmann, A. F. 1999. “Bile Acids: The Good, the Bad, and the Ugly.” Physiology 14: 24–29. 10.1152/physiologyonline.1999.14.1.24. [DOI] [PubMed] [Google Scholar]
- Huang, Q. , Liu X., Zhao G., Hu T., and Wang Y.. 2018. “Potential and Challenges of Tannins as an Alternative to in‐Feed Antibiotics for Farm Animal Production.” Animal Nutrition 4: 137–150. 10.1016/j.aninu.2017.09.004. [DOI] [PMC free article] [PubMed] [Google Scholar]
- Jenkins, T. C. , Fellner V., and McGuffey R. K.. 2003. “Monensin by Fat Interactions on Trans Fatty Acids in Cultures of Mixed Ruminal Microorganisms Grown in Continuous Fermentors Fed Corn or Barley.” Journal of Dairy Science 86: 324–330. 10.3168/jds.S0022-0302(03)73609-1. [DOI] [PubMed] [Google Scholar]
- Jia, W. , Xie G., and Jia W.. 2018. “Bile Acid‐Microbiota Crosstalk in Gastrointestinal Inflammation and Carcinogenesis.” Nature Reviews Gastroenterology & Hepatology 15: 111–128. 10.1038/nrgastro.2017.119. [DOI] [PMC free article] [PubMed] [Google Scholar]
- Landau, S. , Silanikove N., Nitsan Z., et al. 2000. “Short‐Term Changes in Eating Patterns Explain the Effects of Condensed Tannins on Feed Intake in Heifers.” Applied Animal Behaviour Science 69: 199–213. 10.1016/S0168-1591(00)00125-8. [DOI] [PubMed] [Google Scholar]
- Li, H. , Yu Q., Li T., et al. 2020. “Rumen Microbiome and Metabolome of Tibetan Sheep (Ovis aries) Reflect Animal Age and Nutritional Requirement.” Frontiers in Veterinary Science 7: 609. 10.3389/fvets.2020.00609. [DOI] [PMC free article] [PubMed] [Google Scholar]
- Matsumoto, T. , Kobayashi T., and Kamata K.. 2007. “Role of Lysophosphatidylcholine (LPC) in Atherosclerosis.” Current Medicinal Chemistry 14: 3209–3220. 10.2174/092986707782793899. [DOI] [PubMed] [Google Scholar]
- McSweeney, C. S. , Palmer B., McNeill D. M., and Krause D. O.. 2001. “Microbial Interactions With Tannins: Nutritional Consequences for Ruminants.” Animal Feed Science and Technology 91: 83–93. 10.1016/S0377-8401(01)00232-2. [DOI] [Google Scholar]
- Min, B. R. , Barry T. N., Attwood G. T., and McNabb W. C.. 2003. “The Effect of Condensed Tannins on the Nutrition and Health of Ruminants Fed Fresh Temperate Forages: A Review.” Animal Feed Science and Technology 106: 3–19. 10.1016/S0377-8401(03)00041-5. [DOI] [Google Scholar]
- Mu, C. , Yang W., Wang P., Zhao J., Hao X., and Zhang J.. 2020. “Effects of High‐Concentrate Diet Supplemented With Grape Seed Proanthocyanidins on Growth Performance, Liver Function, Meat Quality, and Antioxidant Activity in Finishing Lambs.” Animal Feed Science and Technology 266: 114518. 10.1016/j.anifeedsci.2020.114518. [DOI] [Google Scholar]
- National Research Council (NRC) . 2007. Nutrient Requirements of Small Ruminants: Sheep, Goats, Cervids, and New World Camelids. China Law Publishing House. [Google Scholar]
- Nikkhah, A. 2012. “Barley Grain for Ruminants: A Global Treasure or Tragedy.” Journal of Animal Science and Biotechnology 3: 22. 10.1186/2049-1891-3-22. [DOI] [PMC free article] [PubMed] [Google Scholar]
- Nishida, S. , Katsumi N., and Matsumoto K.. 2021. “Prevention of the Rise in Plasma Cholesterol and Glucose Levels by Kaki‐Tannin and Characterization of Its Bile Acid Binding Capacity.” Journal of the Science of Food and Agriculture 101: 2117–2124. 10.1002/jsfa.10834. [DOI] [PubMed] [Google Scholar]
- Pang, Z. , Zhou G., Ewald J., et al. 2022. “Using MetaboAnalyst 5.0 for LC‐HRMS Spectra Processing, Multi‐Omics Integration and Covariate Adjustment of Global Metabolomics Data.” Nature Protocols 17: 1735–1761. 10.1038/s41596-022-00710-w. [DOI] [PubMed] [Google Scholar]
- Patra, A. K. , and Saxena J.. 2011. “Exploitation of Dietary Tannins to Improve Rumen Metabolism and Ruminant Nutrition.” Journal of the Science of Food and Agriculture 91: 24–37. 10.1002/jsfa.4152. [DOI] [PubMed] [Google Scholar]
- Riedl, K. , and Hagerman E.. 2001. “Tannin–Protein Complexes as Radical Scavengers and Radical Skins.” Journal of Agricultural and Food Chemistry 49: 4917–4923. 10.1021/jf010683h. [DOI] [PubMed] [Google Scholar]
- Seifried, N. , Steingass H., Hoffmann N., and Rodehutscord M.. 2017. “In Situ Starch and Crude Protein Degradation in the Rumen and In Vitro Gas Production Kinetics of Wheat Genotypes.” Journal of Animal Physiology and Animal Nutrition 101: 779–790. 10.1111/jpn.12529. [DOI] [PubMed] [Google Scholar]
- Silanikove, N. , Perevolotsky A., and Provenza F. D.. 2001. “Use of Tannin‐Binding Chemicals to Assay for Tannins and Their Negative Postingestive Effects in Ruminants.” Animal Feed Science and Technology 91: 69–81. 10.1016/S0377-8401(01)00234-6. [DOI] [Google Scholar]
- Soldado, D. , Bessa R. J. B., and Jerónimo E.. 2021. “Condensed Tannins as Antioxidants in Ruminants—Effectiveness and Action Mechanisms to Improve Animal Antioxidant Status and Oxidative Stability of Products.” Animals 11: 3243. 10.3390/ani11113243. [DOI] [PMC free article] [PubMed] [Google Scholar]
- Tian, K. , Aldian D., Luo G., Sossou A., and Yayota M.. 2024. “Condensed Tannin‐Induced Variations in the Rumen Metabolome and the Correlation With Fermentation Characteristics in Goats.” Animal Science Journal 95: e13925. 10.1111/asj.13925. [DOI] [PubMed] [Google Scholar]
- Tian, K. , Liu J., and Yayota M.. 2024. “From Nutrients to Performance: Advances in Using Lactic Acid–Treated Cereals in Ruminant Feed.” Animal Feed Science and Technology 313: 116006. 10.1016/j.anifeedsci.2024.116006. [DOI] [Google Scholar]
- Tsugawa, H. , Cajka T., Kind T., et al. 2015. “MS‐DIAL: Data‐Independent MS/MS Deconvolution for Comprehensive Metabolome Analysis.” Nature Methods 12: 523–526. 10.1038/nmeth.3393. [DOI] [PMC free article] [PubMed] [Google Scholar]
- Vasta, V. , Daghio M., Cappucci A., et al. 2019. “Invited Review: Plant Polyphenols and Rumen Microbiota Responsible for Fatty Acid Biohydrogenation, Fiber Digestion, and Methane Emission: Experimental Evidence and Methodological Approaches.” Journal of Dairy Science 102: 3781–3804. 10.3168/jds.2018-14985. [DOI] [PubMed] [Google Scholar]
- Vaz, A. R. , Delgado‐Esteban M., Brito M. A., Bolaños J. P., Brites D., and Almeida A.. 2010. “Bilirubin Selectively Inhibits Cytochrome c Oxidase Activity and Induces Apoptosis in Immature Cortical Neurons: Assessment of the Protective Effects of Glycoursodeoxycholic Acid.” Journal of Neurochemistry 112: 56–65. 10.1111/j.1471-4159.2009.06429.x. [DOI] [PubMed] [Google Scholar]
- Yan, J. J. , Jung J. S., Lee J. E., et al. 2004. “Therapeutic Effects of Lysophosphatidylcholine in Experimental Sepsis.” Nature Medicine 10: 161–167. 10.1038/nm989. [DOI] [PubMed] [Google Scholar]
- Yin, C. , Xia B., Tang S., et al. 2021. “The Effect of Exogenous Bile Acids on Antioxidant Status and Gut Microbiota in Heat‐Stressed Broiler Chickens.” Frontiers in Nutrition 8: 747136. 10.3389/fnut.2021.747136. [DOI] [PMC free article] [PubMed] [Google Scholar]
Associated Data
This section collects any data citations, data availability statements, or supplementary materials included in this article.
Supplementary Materials
Table S1 Ingredients (g/kg as fed) and chemical compositions (g/kg of dry matter) of the basal diets.
Table S2 Effect of different treatments on feed intake and body weight of goats.
Table S3 List of identified metabolites in the plasma.