

Summary
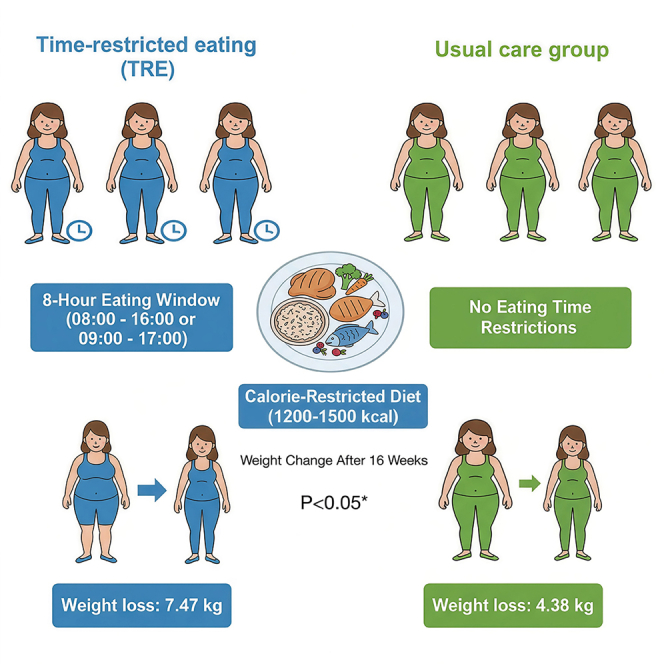
This study aims to assess the impact of 8-h time-restricted eating (TRE) combined with a calorie-restricted diet (CRD) on weight, insulin resistance (IR), and metabolic factors in overweight/obese women with polycystic ovary syndrome (PCOS). A total of 93 participants were randomly assigned to the TRE or the usual care group, both of whom were prescribed 1200–1500 kcal/day. The TRE group consumed all calories within an 8-h window, while the usual care group maintained their usual eating patterns. Assessments were administered at baseline, week 8, and week 16. At 16 weeks, both groups showed significant weight reductions from baseline: −7.47 kg in the TRE group and −4.38 kg in the usual care group (between-group difference −3.09 kg, p < 0.05). Significant reductions in HOMA-IR in both groups from baseline to week 8 or week 16. 8-h TRE combined with a CRD confers beneficial effects on weight loss, IR, and metabolic factors in obese women with PCOS.
Subject areas: Reproductive medicine, Clinical nutrition, Human metabolism
Graphical abstract
Highlights
-
•
A 16-week TRE combined with a CRD significantly reduced body weight in women with PCOS
-
•
16 weeks of 8-h TRE combined with a CRD achieved weight loss of 7.47 kg
-
•
8-h TRE combined with a CRD improves weight loss, IR, and metabolic factors in PCOS women
Reproductive medicine; Clinical nutrition; Human metabolism
Introduction
Polycystic ovary syndrome (PCOS) is a common endocrine disorder, affecting up to 21% of women of reproductive age worldwide. It is characterized by menstrual irregularity, insulin resistance (IR), obesity, glucolipid metabolism disorders, and cardiovascular diseases.1 The prevalence of overweight and obesity is significantly higher in women with PCOS compared with women without PCOS.2 Approximately 30–75% of patients with PCOS are overweight or obese, which exacerbates IR and hyperinsulinemia, and further increases the risk of endocrine and metabolic abnormalities.3,4,5 Given the high risk of overweight or obesity in women with PCOS, weight management should be considered a key component of treatment.
Evidence-based guidelines recommend lifestyle modifications - including a combination of diet, exercise, and behavioral changes - as first-line treatment in overweight or obese women with PCOS.6 Related studies have shown that lifestyle intervention can improve weight, menstrual cycle, IR, hyperandrogenism, and fertility in women with PCOS.7,8 Energy restriction is significant in reducing and maintaining weight and improving cardiometabolic risk factors in obese people.9,10 Intermittent fasting (IF), as a simple weight loss method, has gained popularity for several potential health benefits in recent years.11 A growing body of evidence suggests that this diet strategy can decrease body weight, insulin levels, and blood pressure and improve lipid profiles.12,13
Time-restricted eating (TRE), as a specific IF form, involves limiting food intake to a defined feeding window within 24 h, with the remaining hours constituting a fasting window.14 Studies in rodents have shown that TRE can induce weight loss, lower insulin levels, improve glucose and lipid metabolism, as well as chronic inflammation.15,16 However, the effect of TRE on human metabolic research remains inconsistent, which may be attributed to variations in study populations (e.g., individuals with normal weight, obesity, or prediabetes, and so forth), differences in eating time windows, and heterogeneity in intervention time. Previous research on TRE in women with PCOS has reported promising but preliminary results. For instance, a short-term trial by Li et al. demonstrated that the TRE protocol improved menstrual regularity, hyperandrogenemia, insulin resistance, and chronic inflammation in patients with PCOS17 However, conflicting evidence emerges from a randomized clinical trial by Talebi et al., which found that early time-restricted eating (eTRE) did not significantly enhance metabolic, menstrual, and gonadal outcomes compared to a control group.18 Such inconsistencies make it difficult to isolate the effects of TRE from other lifestyle confounders. To address these gaps, our randomized controlled trial includes both a TRE group and a standard diet control group to isolate TRE-specific effects. In addition to evaluating metabolic outcomes (e.g., insulin sensitivity and lipid profiles), the study also investigates reproductive outcomes such as sex hormone binding globulin (SHBG). Moreover, a 16-week intervention period was chosen to evaluate sustainability and longer-term efficacy. By providing rigorous evidence on TRE’s efficacy and safety in PCOS, our findings aim to clarify its potential role in clinical management. Therefore, our study aims to provide a more comprehensive evaluation of the TRE protocol on body weight, IR, and metabolic factors in obese or overweight women with PCOS.
Results
Participants
We screened 237 women with PCOS, of whom 93 were randomly assigned to either the TRE (n = 46) or usual care group (n = 47). A total of 76 participants (81.7%) completed the study (Figure 1). The dropout rates were comparable between groups: 17.4% (8/46) in the TRE group and 19.1% (9/47) in the usual care group. Baseline characteristics for both groups are summarized in Table 1. No significant differences were observed between the groups in terms of age, weight, BP, WC, body fat, BMI, lipid profile, fasting glucose, insulin, T, FSH, LH, liver function, or daily energy intake.
Figure 1.

Flowchart of trial participants
Table 1.
Baseline characteristics of participants
| Variable | Control (n = 47) | TRE (n = 46) |
|---|---|---|
| Age, years | 27.2 ± 5.6 | 26.1 ± 4.8 |
| Weight, kg | 78.2 ± 13.8 | 80.4 ± 11.5 |
| BMI, kg/m2 | 30.2 ± 4.1 | 30.7 ± 3.9 |
| WC, cm | 95.2 ± 10.6 | 96.7 ± 9.6 |
| Body fat percentage % | 40.2 ± 6.3 | 40.9 ± 5.2 |
| Fat mass, kg | 32.0 ± 10.3 | 33.1 ± 8.9 |
| SBP, mmHg | 122 ± 14 | 120 ± 11 |
| DBP, mmHg | 82 ± 13 | 81 ± 10 |
| TG, mmol/L | 1.3 (1.0–2.2) | 1.4 (1.1–1.9) |
| CHO, mmol/L | 5.3 ± 0.8 | 5.2 ± 0.9 |
| HDL-c, mmol/L | 1.2 ± 0.2 | 1.2 ± 0.2 |
| LDL-c, mmol/L | 2.9 ± 0.8 | 3.1 ± 0.9 |
| FBG, mmol/L | 5.1 ± 0.7 | 5.0 ± 0.5 |
| Fasting insulin, pmol/L | 136.1 (101.9–184.8) | 136.2 (105.5–166.6) |
| HOMA-IR | 4.4 (3.2–6.0) | 4.5 (3.0–6.0) |
| LH, IU/mL | 7.3 (5.8–11.3) | 6.5 (3.9–9.8) |
| FSH, IU/mL | 5.9 ± 1.5 | 5.7 ± 2.1 |
| T, ng/dL | 46.1 (32.5–57.1) | 46.5 (32.7–52.6) |
| SHBG, nmol/L | 24.0 (17.4–30.5) | 25.1(15.8–31.7) |
| FAI, % | 6.8 (3.9–10.5) | 7.4 (4.1–13.0) |
| F-G Score | 7.0 (4.0–9.0) | 6.5 (4.0–9.0) |
| ALT, mmol/L | 26.0 (17.0–42.0) | 26.5 (19.0–68.0) |
| AST, mmol/L | 21.0 (16.0–24.0) | 19.5 (17.0–31.0) |
| GGT, mmol/L | 24.0 (19.0–36.0) | 19.0 (17.0–37.0) |
Values are expressed as mean ± SD or median (interquartile range).
TRE, Time-restricted eating; BMI, Body mass index; WC, Waist circumference; SBP, Systolic blood pressure; DBP, Diastolic blood pressure; TG, Triglycerides; TC, Total cholesterol; HDL-c, high-density lipoprotein cholesterol; LDL-c, Low-density lipoprotein cholesterol; FBG, Fasting blood glucose; HOMA-IR, Homeostatic model assessment of insulin resistance; LH, Luteinizing hormone; FSH, Follicle-stimulating hormone; T, Testosterone; SHBG, Sex hormone binding globulin; FAI, Free androgen index; F-G score, Ferriman-Gallway score; ALT, Alanine aminotransferase; AST, Aspartate aminotransferase; GGT, Gamma-glutamyl transferase.
Change in primary outcomes
Among participants who completed the study, significant reductions in body weight and HOMA-IR were observed from baseline to week 16 in both groups. The mean change in body weight at week 16 was −7.47 kg ([95%CI: −8.96 to −5.97], p < 0.001) in the TRE group and −4.38 kg ([95%CI: −5.88 to 2.88], p < 0.001) in the usual care group. The between-group difference in weight change was statistically significant, with a mean difference of −3.09 kg ([95%CI: −5.20 to −0.97], p = 0.005) (Table 2). For HOMA-IR, the change from baseline to week 16 was −1.89 (95%CI: −2.42 to −1.37) in the TRE group (p < 0.001) and −1.21 (95%CI: −1.73 to −0.69) in the usual care group (p < 0.001), However, the between-group difference in HOMA-IR change was not statistically significant (Table 2; Figure 2).
Table 2.
Effects of TRE on Weight loss and HOMA-IR in patients with PCOS
| Variable | Changes from baseline (95% CIs) |
Difference between groups (95% CIs) | p value | |
|---|---|---|---|---|
| Control (n = 47) | TRE (n = 46) | |||
| Weight, kg | ||||
| Week 8 | −2.69 (−4.26 to −1.12)a | −5.85 (−7.34 to −4.37)a | −3.16 (−5.32 to −1.00) | 0.005 |
| Week 16 | −4.38 (−5.88 to −2.88)a | −7.47 (−8.96 to −5.97)a | −3.09 (−5.20 to −0.97) | 0.005 |
| HOMA-IR | ||||
| Week 8 | −1.47 (−2.05 to −0.90)a | −1.63 (−2.16 to −1.10)a | −0.16 (−0.94 to 0.62) | 0.686 |
| Week 16 | −1.21 (−1.73 to −0.69)a | −1.89 (−2.42 to −1.37)a | −0.68 (−1.42 to 0.06) | 0.071 |
Values are expressed as median (interquartile range).
TRE, Time-restricted eating; HOMA-IR, Homeostatic model assessment of insulin resistance.
p < 0.001 compared with baseline.
Figure 2.

The changes in body weight and HOMA-IR from baseline to Week 16 in patients with PCOS
(A) Change in body weight.
(B) Change in HOMA-IR.
Change in secondary outcomes
BMI, waist circumferences, WHR, and body composition
Changes in BMI, WC, WHR, and body composition are summarized in Table 3. The decrease in body weight accompanied significant reductions in BMI (−2.3 kg/m2 [95% CI: −2.8 to −1.7], p < 0.001; −1.0 kg/m2 [95% CI: −1.6 to −0.4], p < 0.001; respectively), and WC (−6.24 cm [95% CI: −7.9 to −4.6], p < 0.001; −2.9 cm [95% CI: −4.6 to −1.1], p < 0.05; respectively) at 8-week assessment in both groups. Compared with the usual care group, the TRE group showed significant decreases in BMI (−1.2 kg/m2 [95% CI: −2.0 to −0.4], p = 0.004) and WC (−3.4 cm [95% CI: −5.8 to −1.0], p = 0.006) at week 8. At week 16, the change in BMI was −2.9 kg/m2 (95% CI: −3.5 to −2.3, p < 0.001) in the TRE group and −1.7 kg/m2 (95% CI: −2.3 to −1.1, p < 0.001) in the usual care group, while the change from baseline in WC was −8.5 cm (95% CI: −10.2 to −6.9, p < 0.001) in the TRE group and −4.2 cm (95% CI: −5.8 to −2.6, p < 0.001) in the usual care group. The between-group differences both in BMI change and in WC change at week 16 were statistically significant, with a mean difference of −1.2 kg/m2 (95% CI: −2.0 to −0.4, p = 0.004) and −4.3 cm (95% CI: −6.7 to −2.0, p < 0.001), respectively. There were significant changes in WHR at both week 8 (p < 0.05) and week 16 (p < 0.001) in the TRE group, but only at week 16 (p < 0.05) in the usual care group. However, the difference in the change in WHR between the two groups was not statistically significant.
Table 3.
Effects of diets on weight loss and body composition in patients with PCOS
| Variable | Changes from baseline (95% CIs) |
Difference between groups (95% CIs) | p value | |
|---|---|---|---|---|
| Control (n = 47) | TRE (n = 46) | |||
| BMI, kg/m2 | ||||
| Week 8 | −1.0 (−1.6 to −0.4)a | −2.3 (−2.8 to −1.7)a | −1.2 (−2.0 to −0.4) | 0.004 |
| Week 16 | −1.7 (−2.3 to −1.1)a | −2.9 (−3.5 to −2.3)a | −1.2 (−2.0 to −0.4) | 0.004 |
| WC, cm | ||||
| Week 8 | −2.9 (−4.6 to −1.1) + | −6.24 (−7.9 to −4.6)a | −3.4 (−5.8 to −1.0) | 0.006 |
| Week 16 | −4.2 (−5.8 to −2.6)a | −8.5 (−10.2 to −6.9)a | −4.3 (−6.7 to −2.0) | <0.001 |
| WHR | ||||
| Week 8 | −0.01 (0.00 to −0.03) | −0.02 (−0.01 to −0.03) + | −0.01 (−0.03 to 0.01) | 0.401 |
| Week 16 | −0.01 (−0.00 to −0.03) + | −0.02 (−0.01 to −0.04)a | −0.01 (−0.03 to 0.01) | 0.232 |
| Body fat percent, % | ||||
| Week 16 | −2.9 (−4.2 to −1.6)a | −4.3 (−5.5 to −3.0)a | −1.4 (−3.1 to 0.4) | 0.128 |
| Fat mass, kg | ||||
| Week 16 | −3.8 (−5.4 to −2.2)a | −5.5 (−7.1 to −3.9)a | −1.7 (−4.0 to 0.5) | 0.130 |
| Skeletal muscle mass, kg | ||||
| Week 16 | −0.5 (−1.4 to 0.3) | −0.9 (−1.7 to −0.1) + | 0.3 (−1.5 to 0.8) | 0.559 |
TRE, Time-restricted eating; BMI, Body mass index; WC, Waist circumference; WHR, Waist-to-hip ratio.
p < 0.001 compared with baseline. +p < 0.05 compared with baseline.
We observed significant reductions in body fat percent (−4.3% [95% CI: −5.5 to −3.0] and −2.9% [95% CI: −4.2 to −1.6]; respectively, p < 0.001) and fat mass (−5.5 kg [95% CI: −7.1 to −3.9 ] and −3.8 kg [95% CI: −5.4 to −2.2]; respectively, p < 0.001) in TRE group and usual care group after 16 weeks of intervention, while the difference in the change between the two groups was not statistically significant. In the TRE group, the change from baseline to week 16 in skeletal muscle mass was −0.9 kg (95% CI: −1.7 to −0.1; p < 0.05). However, the changes in skeletal muscle mass from baseline to week 16 were not statistically significant in the usual care group. And the difference in the change between the two groups was not statistically significant (Table 3).
Blood pressure
The change from baseline to week 8 in SBP was statistically significant in the usual care group (4.5 mmHg [95% CI: 0.1 to 9.0], p < 0.05) but not in the TRE group (−0.0 mmHg [95% CI: −3.9 to 3.8], p > 0.05). We also observed that after 8 weeks of intervention, none of the DBP in the TRE usual care group was statistically significant. At week 16, there were no statistically significant changes in SBP and DBP in the TRE and usual care groups. Moreover, changes in SBP and DBP were also not significantly different between groups from baseline to week 8 or week 16 (Table 4).
Table 4.
Effects of diets on cardiovascular risk factors and sex hormones in patients with PCOS
| Variable | Changes from baseline (95% CIs) |
Difference between groups (95% CIs) | p value | |
|---|---|---|---|---|
| Control (n = 47) | TRE (n = 46) | |||
| SBP, mmHg | ||||
| Week 8 | 4.5 (0.1–9.0) + | −0.0 (−3.9 to 3.8) | −4.6 (−10.5 to 1.4) | 0.129 |
| Week 16 | −1.2 (−5.1 to 2.6) | −3.8 (−7.7 to 0.2) | −2.6 (−8.1 to 3.0) | 0.362 |
| DBP, mmHg | ||||
| Week 8 | 0.7 (−2.9 to 4.3) | −1.2 (−4.3 to 1.9) | −1.9 (−6.7 to 2.9) | 0.427 |
| Week 16 | −0.2 (−3.3 to 2.9) | −2.1 (−5.3 to 1.1) | −1.9 (−6.3 to 2.6) | 0.400 |
| ALT, mmol/L | ||||
| Week 8 | −3.5 (−9.6 to 2.7) | −12.3 (−18.1 to −6.5) ‡ | −8.8 (−17.4 to −0.3) | 0.043 |
| Week 16 | −10.2 (−16.1 to −4.2) + | −18.1 (−23.8 to −12.3) ‡ | −7.9 (−16.2 to 0.4) | 0.063 |
| AST, mmol/L | ||||
| Week 8 | −0.7 (−3.4 to 2.1) | −5.5 (−8.1 to −2.9) ‡ | −4.8 (−8.7 to −1.0) | 0.014 |
| Week 16 | −3.9 (−6.6 to −1.3) + | −7.6 (−10.2 to −5.0) ‡ | −3.6 (−7.4 to 0.1) | 0.054 |
| GGT, mmol/L | ||||
| Week 8 | −4.9 (−8.9 to −0.9) + | −10.7(-14.3 to −7.0) ‡ | −5.8 (−11.2 to −0.3) | 0.038 |
| Week 16 | −8.6 (−12.4 to −4.8) ‡ | −10.8 (−14.4 to −7.1) ‡ | −2.1 (−7.4 to 3.1) | 0.419 |
| TG, mmol/L | ||||
| Week 8 | −0.1 (−0.4 to 0.3) | −0.3 (−0.6 to −0.0) + | −0.2 (−0.7 to 0.2) | 0.255 |
| Week 16 | −0.3 (−0.6 to −0.0) + | −0.4 (−0.7 to −0.2) ‡ | −0.2 (−0.5 to 0.2) | 0.393 |
| CHO, mmol/L | ||||
| Week 8 | −0.5 (−0.9 to −0.1) + | −0.5 (−0.9 to −0.1) + | 0.0 (−0.5 to 0.5) | 0.991 |
| Week 16 | −0.4 (−0.7 to −0.1) + | −0.3 (−0.6 to −0.1) + | 0.1 (−0.3 to 0.4) | 0.736 |
| HDL-c, mmol/L | ||||
| Week 8 | −0.1 (−0.2 to −0.0) + | −0.0 (−0.1 to 0.0) | 0.1 (−0.0 to 0.2) | 0.198 |
| Week 16 | −0.0 (−0.1 to 0.0) | 0.0 (−0.0 to 0.1) | 0.1 (−0.0 to 0.2) | 0.163 |
| LDL-c, mmol/L | ||||
| Week 8 | −0.35 (−0.61 to −0.09) + | −0.30 (−0.52 to-0.09) + | −0.05(-0.39 to 0.29) | 0.788 |
| Week 16 | −0.16 (−0.35 to 0.03) | −0.11 (−0.29 to 0.07) | −0.05(-0.31 to 0.21) | 0.705 |
| FBG, mmol/L | ||||
| Week 8 | −0.2 (−0.4 to −0.0) + | −0.1 (−0.3 to 0.06) | 0.1 (−0.1 to 0.4) | 0.366 |
| Week 16 | −0.3 (−0.5 to −0.1) ‡ | −0.3 (−0.5 to −0.1) ‡ | −0.0 (−0.2 to 0.2) | 0.950 |
| T, ng/dL | ||||
| Week 16 | −9.2 (−13.9 to −4.6) ‡ | −10.5 (−15.1 to −5.9) ‡ | −1.3 (−7.8 to 5.3) | 0.594 |
| SHBG, mmol/L | ||||
| Week 16 | 8.25 (−0.12 to 16.61) | 15.21 (7.48–22.95) ‡ | −6.97 (−18.32 to 4.38) | 0.223 |
| FAI, % | ||||
| Week 16 | −3.7 (−5.2 to −2.1) ‡ | −3.1 (−4.5 to −1.7) ‡ | 0.6 (−1.5 to 2.7) | 0.591 |
| F-G score | ||||
| Week 16 | −0.4 (−1.4 to 0.5) | −0.5 (−1.5 to 0.4) | 0.1 (−1.2 to 1.4) | 0.883 |
TRE, Time-restricted eating; FBG, Fasting blood glucose; SBP, Systolic blood pressure; DBP, Diastolic blood pressure; TG, Triglycerides; CHO, Total cholesterol; HDL-c, High-density lipoprotein cholesterol; LDL-c, Low-density lipoprotein cholesterol; T, Testosterone; SHBG, Sex hormone binding globulin; FAI, Free androgen index; F-G score, Ferriman-Gallway score; ALT, Alanine aminotransferase; AST, Aspartate aminotransferase; GGT, Gamma-glutamyl transferase.
Liver function
Changes in liver function (ALT, AST, GGT) are summarized in Table 4. There were statistically significant changes in ALT, AST, and GGT from baseline to week 8 and week 16 in the TRE group (p < 0.001). The change from baseline to week 8 in GGT was −4.9 mmol/L ([95% CI: −8.9 to −0.9], p < 0.05], and no significant changes were observed in ALT and AST in the usual care group. By week 16, the usual care group showed significantly decreased in ALT (−10.2 mmol/L [95% CI: −16.1 to −4.2], p < 0.05), AST (−3.9 mmol/L [95% CI: −6.6 to −1.3], p < 0.05), and GGT (−8.6 mmol/L [95% CI: −12.4 to −4.8], p < 0.001). However, the changes in GGT, ALT, and AST were not significantly different between groups from baseline to week 8 and week 16.
Lipid profiles
As can be observed, lipid profiles (TG, HDL-c, TC, and LDL-c) tended to decrease in both groups from baseline to week 8 or week 16, with no difference between groups. We observed changes in TC (−0.5 mmol/L [95% CI: −0.9 to −0.1], p < 0.05; −0.5 mmol/L [95% CI:-0.9 to −0.1], p < 0.05; respectively) and LDL-c (−0.30 mmol/L [95% CI: −0.52 to −0.09] and −0.35 mmol/L [-0.61 to −0.09]; p < 0.05, respectively) from baseline to Week 8 in both the TRE and usual care groups. At 16 weeks, there were statistically significant changes in TG (−0.4 mmol/L [95% CI: −0.7 to −0.2] for TRE group; −0.3 mmol/L [95% CI: −0.6 to −0.0] for usual care group, respectively), TC (−0.3 mmol/L [95% CI: −0.6 to −0.1] for TRE group; −0.4 mmol/L [95% CI: −0.7 to −0.1] for usual care group, respectively) (p < 0.05) in both groups. There were no significant changes in HDL-c and LDL-c from baseline to week 16 in either group (Table 4).
Fasting blood glucose, sex hormone binding globulin, T, free androgen index, and Ferriman-Gallwey score
Changes in FBG, SHBG, FAI, and F-G score were reported in Table 4. We observed a decrease in FBG (−0.1 mmol/L [95% CI: −0.3 to 0.06]) in the in the usual care group at week 8. There were significant changes in FBG (−0.3 mmol/L [95% CI: −0.5 to −0.1]; −0.3 mmol/L [95% CI: −0.5 to −0.1], respectively), T (−10.5 ng/dL [95% CI: −15.1 to −5.9]; −9.2 ng/dL ([95% CI: −13.9 to −4.6], respectively), FAI (−3.1% [95% CI: −4.5 to −1.7]; −3.7% [95% CI: −5.2% to −2.1%, respectively) at week 16 in the both groups. In the TRE group, the change from baseline to week 16 in SHBG was significant (15.21 nmol/L [95% CI:7.48 to 22.95], p < 0.001). In the usual care group, the changes from baseline to week 16 in SHBG were not statistically significant. As for the F-G score, there was no statistically significant difference between the groups at week 16. In addition, the between-group difference from baseline to week 8 or week 16 in FBG, SHBG, FAI, and F-G score between the TRE group and the usual care group was not statistically significant.
Energy intake and physical activity
Data on energy intake and physical activity are presented in Table 5. As for energy intake, total energy intake, and the percentage of energy intake from fat, carbohydrates, and protein did not differ significantly at baseline and week 16 between groups. There was no difference in compliance during the 16-week intervention period (p = 0.70), with participants reporting an average of 21.8 ± 6.1 days/month in the TRE group and 22.8 ± 6.9 days/month in the usual care group. There is no difference in physical activity between the two groups during the 16-week intervention period (p = 0.282).
Table 5.
Data on dietary intake and physical activity in participants with PCOS
| Variable | Control (n = 47) | TRE (n = 46) | p value |
|---|---|---|---|
| Baseline | |||
| Energy intake, kcal/day | 1838.6 ± 628.9 | 1843.6 ± 503.2 | 0.967 |
| Protein intake, g/day | 79.2 ± 27.1 | 75.9 ± 27.7 | 0.565 |
| Protein intake, % | 17.6 ± 4.1 | 16.4 ± 4.2 | 0.192 |
| Carbohydrate intake, g/day | 218.6 ± 95.6 | 219.0 ± 58.3 | 0.982 |
| Carbohydrate intake, % | 47.5 ± 9.7 | 48.1 ± 10.1 | 0.797 |
| Fat intake, g/day | 74.4 ± 30.2 | 78.4 ± 33.3 | 0.551 |
| Fat intake, % | 36.2 ± 8.5 | 36.9 ± 8.6 | 0.684 |
| Week 16 | |||
| Energy intake at, kcal/day | 1173.0 ± 216.1 | 1163.9 ± 251.3 | 0.852 |
| Protein intake, g/day | 61.5 ± 19.1 | 64.6 ± 19.3 | 0.440 |
| Protein intake, % | 21.2 ± 6.3 | 22.6 ± 6.3 | 0.287 |
| Carbohydrate intake, g/day | 136.5 ± 54.8 | 132.5 ± 49.1 | 0.710 |
| Carbohydrate intake, % | 46.5 ± 15.4 | 45.8 ± 14.0 | 0.817 |
| Fat intake, g/day | 54.4 ± 44.8 | 50.8 ± 34.1 | 0.657 |
| Fat intake, % | 40.6 ± 27.8 | 38.2 ± 19.9 | 0.638 |
| Adherence, adherent days/month | 22.8 ± 6.9 | 21.8 ± 6.1 | 0.700 |
| Physical activity, MET-min/week | 840.0 (337.5–1365.0) | 562.5 (175.0–1260.0) | 0.282 |
Values are expressed as mean ± SD or median (interquartile range).
Adverse events
No serious adverse events or safety findings were reported. A small number of adverse events were identified as possibly related to the study intervention, including alopecia (reported by 2 participants in the TRE group) and constipation (reported by 4 participants in the TRE group and 1 participant in the usual care group).
Discussion
The present study demonstrated that a 16-week TRE (8-h feeding window) combined with a calorie-restricted diet was capable of significantly reducing body weight and HOMA-IR in women with PCOS. By the end of the intervention, both the TRE and usual care groups achieved statistically significant weight loss of 7.47 kg and 4.38 kg, respectively. Meanwhile, we observed significant reductions in BMI, WC, and improvements in T and HOMA-IR. These findings are consistent with previous research. Specifically, Li et al.17 reported that TRE resulted in significant changes in body weight, BMI, SHBG, and HOMA-IR in women with PCOS. In our study, TRE combined with a calorie-restricted diet had a greater reduction in body weight, BMI, and WC from baseline to week 8 and week 16 compared with the usual care group. However, no statistically significant differences were observed between groups for WHR, body fat percent, fat mass, HOMA-IR, FBG, TG, T, SHBG, FAI, AST, ALT, and GGT compared with the usual care intervention. A possible explanation is that both groups had similar calorie deficits.
It is well-known that women with PCOS are closely associated with obesity, which in turn is linked to a higher incidence of endocrine and metabolic abnormalities such as IR and glucolipid metabolism disorders.5,19 As reported, weight loss of 5%–10% is associated with meaningful improvements in cardiometabolic risk factors, androgen, menstrual function, and fertility.20 Current guidelines recommend lifestyle modification, including dietary and exercise interventions, as the first-line treatment for overweight or obese women with PCOS, with a particular emphasis on dietary management.21 Although no universally accepted dietary regimen has been established for women with PCOS, most approaches have focused on caloric restriction and nutritional quality adjustment. A recent meta-analysis evaluated low-carbohydrate diets, the Dietary Approaches to Stop Hypertension (DASH) diet, calorie-restricted diets,22 low-fat diet, Mediterranean diet and found that calorie-restricted diet may be the most effective dietary pattern for weight loss in women with PCOS.23
Unlike the dietary approaches described above, TRE is a dietary strategy in which food is consumed over a certain time interval.24 Although TRE has received much attention in recent years, limited evidence is available regarding the impact of dietary strategy on women with PCOS.17 Previous studies have shown that adherence to an 8–10 h TRE intervention over several weeks in overweight or obese adults significantly reduces body weight.25,26,27 In patients with metabolic syndrome, a 10-h TRE has been shown to reduce body weight and WC while improving body composition and lipid metabolism.28 Consistent with our results, multiple studies support TRE’s metabolic benefits, though outcomes vary by protocol and population. For instance, studies have shown that TRE alone can reduce body weight by approximately 1.3 kg, enhance SHBG levels, and significantly improve insulin sensitivity (as measured by HOMA-IR) in PCOS within a 5-week intervention period.17 In a retrospective study by Feyzioglu BS et al.,29 significant improvements were observed in multiple metabolic parameters among women with PCOS following a 6-week 8-h TRE intervention. Specifically, the study reported favorable changes in the glucose and lipid levels. The present study provides an in-depth investigation of the effects of an 8-h window TRE combined with a calorie-restricted diet protocol for 16 weeks in obese women with PCOS. Our data are consistent with previous studies, in which TRE showed significant beneficial effects on obesity, glucose tolerance, insulin sensitivity, and lipid metabolism.14,25,28 Moreover, the present study also indicated that TRE combined with a calorie-restricted diet was more effective in improving the level of body weight, IR, T, liver function, lipid profile, and body fat indices compared with a calorie-restricted diet in women with PCOS. In line with our results, Li C et al. reported that TRE may decrease T and thus ameliorate hyperandrogenemia in overweight patients with PCOS.17 Therefore, an 8-h TRE may be a good therapeutic strategy for treating endocrine and metabolic abnormalities in patients with PCOS. Although dietary recalls served as our assessment method, this approach is intrinsically limited by recall bias, and TRE could have less energy intake. These methodological limitations are particularly evident in the underreporting of energy-dense foods that might have been more pronounced in the TRE cohort. We acknowledge this limitation and recommend that future studies incorporate more objective measures to validate energy intake.
Considering that the total energy and macronutrient composition were comparable between groups, the mechanism of greater change in the TRE group may be explained by the different temporal meal distribution. A possible explanation that TRE may improve body composition is attributed to the reinforcement of metabolic circadian rhythms.30,31,32 Yasumoto et al. reported that the incorrect feeding pattern would cause peripheral clock desynchronization and induce obesity and metabolic disorders in mice.33 IF regimens can positively affect metabolism by activating key regulators of metabolism and nutrient homeostasis to influence circadian rhythms.34 Adiponectin and leptin levels are controlled by the molecular circadian rhythm of adipocytes.35 TRE appears to induce an increase in adiponectin, which may contribute to weight loss by stimulating PGC-1α expression and mitochondrial biogenesis via the AMPK kinase and acting on the brain to increase energy expenditure.14,36 TRE affects the hypothalamo-hypophysial-gonadal axis and T concentration probably through a decrease in leptin-mediated effects. And IF protocols can also inhibit the interstitial cells responsible for testosterone production.37,38 Furthermore, there are also circadian variations in intestinal lipogenesis, and misalignment of feeding rhythmicity can lead to obesity and abnormal lipid metabolism.39 In addition, TRE prolonged fasting improves glucose regulation by shifting energy utilization from glucose to fatty acids and ketone bodies.40,41
Few adverse events were reported and resolved during this intervention. Two subjects experienced alopecia, which resolved with multivitamin supplementation. Five subjects experienced constipation, which resolved after increasing dietary fiber intake. The dropout rate in the TRE group was similar to that in the usual care group, suggesting that TRE is a feasible and acceptable dietary pattern for overweight/obese PCOS women.
Limitations of the study
Several limitations of the present study should be taken into account. First, the present study was of a short time frame (16 weeks) and small sample size, and our results need to be replicated in larger trials to address the long-term effect of the intervention. Secondly, the results might not be generalizable to a broader cohort of women with PCOS due to strict inclusion criteria. Thirdly, the energy and nutrient composition assessment of the diet was based on dietary recall. It is well known that individuals with higher BMI are more likely to underreport food intake.42 Furthermore, another limitation of the study is that it did not compare the effects of TRE without calorie restriction on body weight, IR, T, and other parameters. Future studies comparing the effect of TRE combined with CR, TRE alone, and CR alone should be performed. Besides, our cohort included both females; therefore, we are unable to rule out the potential for sex-based influences. Lastly, this study lacked a true control group, which limits direct comparisons of intervention effects. Future studies should incorporate matched control groups to strengthen causal inferences.
Resource availability
Lead contact
Further information and requests for resources should be directed to and will be fulfilled by the lead contact, Changqin Liu (liuchangqin@xmu.edu.cn).
Materials availability
This study did not generate new unique reagents.
Data and code availability
-
•
The complete original data reported in this study cannot be deposited in a public repository because these data are confidential medical records. To request access, contact Changqin Liu (liuchangqin@xmu.edu.cn).
-
•
This article does not report original code.
-
•
Any additional information required to reanalyze the data reported in this article is available from the lead contact upon request.
Acknowledgments
The authors would like to thank the participants of the study. This research was funded by Noncommunicable Chronic Diseases-National Science and Technology Major Project (No. 2023ZD0508300), the Investigator-initiated clinical research program of the First Affiliated Hospital of Xiamen University (No. XMFHIIT-2023SL058), the Natural Science Foundation of Fujian Province (No. 2020J011242), the High quality development Funds of The First Affiliated Hospital of Xiamen University (NO. YN81870611), the Xiamen Health Quality Development Science and Technology Program (NO. 2024GZL-CX10), and the Xiamen Medical and Health Guidance Project (NO. 3502Z20224ZD1027).
Author contributions
S.Z., Y.C., and X.Z. contributed to the investigation, software development, validation, and the writing of the original draft. D.M. was responsible for data curation, formal analysis, investigation, and statistical analysis. X.Y. supervised the project and contributed to validation and writing. J.Z. assisted with data curation, validation, and writing. C.L. managed project administration, resources, and supervision, and also reviewed and edited the article. All authors read and approved the final version of the article prior to its submission.
Declaration of interests
The authors declare no competing interests.
STAR★Methods
Key resources table
| REAGENT or RESOURCE | SOURCE | IDENTIFIER |
|---|---|---|
| Deposited data | ||
| The data for all participants from the First Affiliated Hospital of Xiamen University | This study | N/A |
| Software and algorithms | ||
| SAS statistical software, version 9.4 | SAS Institute Inc. | https://www.sas.com/zh_cn/home.html |
| Openart platform | OpenArt (United States) | https://openart.ai/ |
Experimental model and study participant details
Study design
The study was a randomized, open-label, controlled clinical trial designed to investigate the effects of TRE on endocrine and metabolic parameters in obese or overweight women with PCOS. The study protocol was approved by the Ethics Committee of the First Affiliated Hospital of Xiamen Medical University (Ethical Approval Number: KYH2018-017), and written informed consent was obtained from all participants.
Method details
Sample size
Assuming an anticipated dropout rate of 20%, we estimated that enrolling 92 participants (46 per group) would provide over 80% statistical power to detect a between-group difference of 3.2 ± 5.0 kg in body weight change, based on preliminary data, at a two-tailed significance level of α = 0.05.
Study population
A total of 237 women with PCOS, aged from 17 to 40 years, were screened at the Department of Endocrinology and Diabetes, the First Affiliated Hospital of Xiamen University (Xiamen, China) between November 2018 and September 2020. Women with PCOS who were aged ≥18 years and BMI ≥24 kg/m2 were eligible for inclusion. The diagnosis of PCOS is based on Rotterdam criteria, which require the presence of at least two out of the following three features: clinical and/or biochemical hyperandrogenism, chronic oligo-anovulation, and polycystic ovarian morphology.43 Exclusion criteria were any female: (1) being treated with weight loss medications, antipsychotic drugs or other medications in the last 6 months, (2) with acute or chronic diseases of the liver, kidney, heart, or thyroid, (3) whose weight fluctuated more than 5% in recent 3 months, (4) wished to become pregnant, (5) with malignant tumors, Cushing’s syndrome, hypothyroidism, acromegaly, hypothalamic obesity and (6) who are unwilling or unable to give informed consent. Participants who became pregnant during the study period were also excluded.
Intervention programs
Following an initial screening visit, a total of 93 eligible participants were randomly allocated to the TRE and usual care groups using a computer-based randomization assignment. The well-trained nutritionist collected and provided dietary instructions to all participants, who were advised to follow a diet of 1200–1500 kcal/day. Participants in the TRE group were instructed to consume all meals within an 8-h window (either 8 a.m. to 4 p.m. or 9 a.m. to 5 p.m.), whereas those in the usual care group maintained their usual eating patterns. Health education was provided equally to both groups, covering topics such as the adverse effects of PCOS and obesity, exercise, health education, and sleep patterns. All participants received a 16-week lifestyle intervention and completed questionnaires and assessments at both 8 weeks and 16 weeks. Full details of the study protocol are available on ClinicalTrials.gov, registration number NCT03792282.
Anthropometric and laboratory measurements
The sociodemographic information included age, marital status, occupation, medical history and drug use, smoking, and alcohol consumption etc. All anthropometric measurements were conducted by trained healthcare professionals following a standardized protocol. Height, weight, waist circumferences (WC) and hip circumferences (HC) were measured using a calibrated scale after removing shoes and heavy clothes. BMI was calculated as weight (kg)/(height [m2]) fat mass (kg) and fat percentage (%) were determined by bioelectrical impedance analysis (Tanita BC-420MA; Tanita, Tokyo, Japan). Seated blood pressure (BP) was measured by Omron electronic sphygmomanometer (OMRON Healthcare). All the above tests and measurements were repeated at the week 8 and week 16 visits.
All blood samples were collected the morning following an overnight fast of at least 12 h. Blood was drawn at baseline, week 8, and week 16 visit for liver function (gamma-glutamyl transferase (GGT), alanine aminotransferase (ALT), aspartate aminotransferase (AST), fasting lipid profile total cholesterol (TC), low-density lipoprotein cholesterol (LDL-c), high-density lipoprotein cholesterol (HDL-c), and triglycerides (TG), fasting blood glucose (FBG), insulin, testosterone (T), SHBG, luteinizing hormone (LH) and follicle-stimulating hormone (FSH). An oral glucose tolerance test (OGTT) using 75 g of glucose was performed at baseline and the week 16 visit for all participants. All biochemical measurements were tested in the central laboratory of the First Affiliated Hospital, Xiamen University. Homeostasis Model Assessment of Insulin Resistance (HOMA-IR) was calculated using the following formulation: (fasting insulin (μIU/mL) × fasting glucose (mmol/L))/22.5.44 The free androgen index (FAI) was calculated as T (in nmol/L)/SHBG (in nmol/L).45
The degree of hirsutism in participants with PCOS was assessed using the Ferriman-Gallwey (F-G) scoring system. The F-G score is the gold standard for hirsutism evaluation and is widely used in clinical practice worldwide. It evaluates nine androgen-sensitive body areas, with each area scored from 0 to 4. The scores are summed to yield a total score, which is used to classify hirsutism as mild, moderate, or severe. Essentially, it serves as a Hormonal Hirsutism Score.
Study outcomes
The primary outcomes of this study were to test whether the TRE was more effective than the usual care group in reducing weight and HOMA-IR at 16 weeks post-intervention.
Secondary outcomes included changes in WC, BMI, T, BP, liver function (GGT, ALT, AST), lipid profile (TG, HDL-c, LDL-c, and TC), WHR, FBG, SHBG, FAI, and F-G score, fat mass, fat percentage, skeletal muscle mass, physical activity, dietary intake, and adverse events. All outcome indices were measured at baseline, week 8, and week 16 follow-up visits.
Daily dietary intake was assessed by a trained nutritionist using a 24-h dietary recall method over three consecutive days at baseline, week 8, and week 16. The nutritionist conducted face-to-face interviews with participants to collect detailed information on food consumption, including type, quantity, and location of meals, and further calculated nutrient intake.
Quantification and statistical analysis
All statistical analyses were performed using SAS statistical software, version 9.4 (SAS Institute Inc.). A two-sided p < 0.05 was considered statistically significant. Data were analyzed according to participants’ randomization assignment (intent-to-treat). Continuous variables were expressed as means ± Standard Deviation (SD) or medians with Interquartile Ranges (IQR). Between-group differences at baseline were analyzed by General Linear Models (GLM) for continuous variables and the chi-squared test for categorical variables. Treatment effects and differences over time were analyzed using the PROC MIXED procedure in SAS, with an autoregressive covariance structure to account for correlations inherent in repeated measurements.
Additional resources
Clinical trial registry number: NCT03792282.
Published: September 27, 2025
Footnotes
Supplemental information can be found online at https://doi.org/10.1016/j.isci.2025.113654.
Contributor Information
Jiayu Zhang, Email: zhangjiayu0631@126.com.
Changqin Liu, Email: liuchangqin@xmu.edu.cn.
Supplemental information
References
- 1.Kazemi M., McBreairty L.E., Chizen D.R., Pierson R.A., Chilibeck P.D., Zello G.A. A Comparison of a Pulse-Based Diet and the Therapeutic Lifestyle Changes Diet in Combination with Exercise and Health Counselling on the Cardio-Metabolic Risk Profile in Women with Polycystic Ovary Syndrome: A Randomized Controlled Trial. Nutrients. 2018;10:1387. doi: 10.3390/nu10101387. [DOI] [PMC free article] [PubMed] [Google Scholar]
- 2.Lim S.S., Davies M.J., Norman R.J., Moran L.J. Overweight, obesity and central obesity in women with polycystic ovary syndrome: a systematic review and meta-analysis. Hum. Reprod. Update. 2012;18:618–637. doi: 10.1093/humupd/dms030. [DOI] [PubMed] [Google Scholar]
- 3.Toscani M.K., Mario F.M., Radavelli-Bagatini S., Spritzer P.M. Insulin resistance is not strictly associated with energy intake or dietary macronutrient composition in women with polycystic ovary syndrome. Nutr. Res. 2011;31:97–103. doi: 10.1016/j.nutres.2011.01.009. [DOI] [PubMed] [Google Scholar]
- 4.Cussons A.J., Stuckey B.G.A., Watts G.F. Cardiovascular disease in the polycystic ovary syndrome: new insights and perspectives. Atherosclerosis. 2006;185:227–239. doi: 10.1016/j.atherosclerosis.2005.10.007. [DOI] [PubMed] [Google Scholar]
- 5.Randeva H.S., Tan B.K., Weickert M.O., Lois K., Nestler J.E., Sattar N., Lehnert H. Cardiometabolic aspects of the polycystic ovary syndrome. Endocr. Rev. 2012;33:812–841. doi: 10.1210/er.2012-1003. [DOI] [PMC free article] [PubMed] [Google Scholar]
- 6.Van der Kooy K., van Hout H., Marwijk H., Marten H., Stehouwer C., Beekman A. Depression and the risk for cardiovascular diseases: systematic review and meta analysis. Int. J. Geriatr. Psychiatry. 2007;22:613–626. doi: 10.1002/gps.1723. [DOI] [PubMed] [Google Scholar]
- 7.Moran L.J., Hutchison S.K., Norman R.J., Teede H.J. Lifestyle changes in women with polycystic ovary syndrome. Cochrane Database Syst. Rev. 2011;2:CD007506. doi: 10.1002/14651858.CD007506.pub2. [DOI] [PubMed] [Google Scholar]
- 8.Moran L.J., Noakes M., Clifton P.M., Tomlinson L., Galletly C., Norman R.J. Dietary composition in restoring reproductive and metabolic physiology in overweight women with polycystic ovary syndrome. J. Clin. Endocrinol. Metab. 2003;88:812–819. doi: 10.1210/jc.2002-020815. [DOI] [PubMed] [Google Scholar]
- 9.American College of Cardiology/American Heart Association Task Force on Practice Guidelines Obesity Expert Panel 2013 for the management of overweight and obesity in adults: a report of the American College of Cardiology/American Heart Association Task Force on Practice Guidelines and the Obesity Society published by the Obesity Society and American College of Cardiology/American Heart Association Task Force on Practice Guidelines. Based on a systematic review from the The Obesity Expert Panel, 2013. (2014) Obesity. 2014;22:S5–S39. doi: 10.1002/oby.20821. [DOI] [PubMed] [Google Scholar]
- 10.Pérez-Martínez P., Mikhailidis D.P., Athyros V.G., Bullo M., Couture P., Covas M.I., de Koning L., Delgado-Lista J., Díaz-López A., Drevon C.A., et al. Lifestyle recommendations for the prevention and management of metabolic syndrome: an international panel recommendation. Nutr. Rev. 2017;75:307–326. doi: 10.1093/nutrit/nux014. [DOI] [PMC free article] [PubMed] [Google Scholar]
- 11.Tinsley G.M., La Bounty P.M. Effects of intermittent fasting on body composition and clinical health markers in humans. Nutr. Rev. 2015;73:661–674. doi: 10.1093/nutrit/nuv041. [DOI] [PubMed] [Google Scholar]
- 12.Mattson M.P., Longo V.D., Harvie M. Impact of intermittent fasting on health and disease processes. Ageing Res. Rev. 2017;39:46–58. doi: 10.1016/j.arr.2016.10.005. [DOI] [PMC free article] [PubMed] [Google Scholar]
- 13.Patterson R.E., Sears D.D. Metabolic Effects of Intermittent Fasting. Annu. Rev. Nutr. 2017;37:371–393. doi: 10.1146/annurev-nutr-071816-064634. [DOI] [PubMed] [Google Scholar]
- 14.Moro T., Tinsley G., Bianco A., Marcolin G., Pacelli Q.F., Battaglia G., Palma A., Gentil P., Neri M., Paoli A. Effects of eight weeks of time-restricted feeding (16/8) on basal metabolism, maximal strength, body composition, inflammation, and cardiovascular risk factors in resistance-trained males. J. Transl. Med. 2016;14:290. doi: 10.1186/s12967-016-1044-0. [DOI] [PMC free article] [PubMed] [Google Scholar]
- 15.Chung H., Chou W., Sears D.D., Patterson R.E., Webster N.J.G., Ellies L.G. Time-restricted feeding improves insulin resistance and hepatic steatosis in a mouse model of postmenopausal obesity. Metabolism. 2016;65:1743–1754. doi: 10.1016/j.metabol.2016.09.006. [DOI] [PMC free article] [PubMed] [Google Scholar]
- 16.Hatori M., Vollmers C., Zarrinpar A., DiTacchio L., Bushong E.A., Gill S., Leblanc M., Chaix A., Joens M., Fitzpatrick J.A.J., et al. Time-restricted feeding without reducing caloric intake prevents metabolic diseases in mice fed a high-fat diet. Cell Metab. 2012;15:848–860. doi: 10.1016/j.cmet.2012.04.019. [DOI] [PMC free article] [PubMed] [Google Scholar]
- 17.Li C., Xing C., Zhang J., Zhao H., Shi W., He B. Eight-hour time-restricted feeding improves endocrine and metabolic profiles in women with anovulatory polycystic ovary syndrome. J. Transl. Med. 2021;19:148. doi: 10.1186/s12967-021-02817-2. [DOI] [PMC free article] [PubMed] [Google Scholar]
- 18.Talebi S., Shab-Bidar S., Moini A., Mohammadi H., Djafarian K. The effects of time-restricted eating alone or in combination with probiotic supplementation in comparison with a calorie-restricted diet on endocrine and metabolic profiles in women with polycystic ovary syndrome: A randomized clinical trial. Diabetes Obes. Metab. 2024;26:4468–4479. doi: 10.1111/dom.15801. [DOI] [PubMed] [Google Scholar]
- 19.Azziz R., Carmina E., Chen Z., Dunaif A., Laven J.S.E., Legro R.S., Lizneva D., Natterson-Horowtiz B., Teede H.J., Yildiz B.O. Polycystic ovary syndrome. Nat. Rev. Dis. Primers. 2016;2 doi: 10.1038/nrdp.2016.57. [DOI] [PubMed] [Google Scholar]
- 20.Moran L.J., Pasquali R., Teede H.J., Hoeger K.M., Norman R.J. Treatment of obesity in polycystic ovary syndrome: a position statement of the Androgen Excess and Polycystic Ovary Syndrome Society. Fertil. Steril. 2009;92:1966–1982. doi: 10.1016/j.fertnstert.2008.09.018. [DOI] [PubMed] [Google Scholar]
- 21.Teede H.J., Misso M.L., Costello M.F., Dokras A., Laven J., Moran L., Piltonen T., Norman R.J., International PCOS Network Recommendations from the international evidence-based guideline for the assessment and management of polycystic ovary syndrome. Hum. Reprod. 2018;33:1602–1618. doi: 10.1093/humrep/dey256. [DOI] [PMC free article] [PubMed] [Google Scholar]
- 22.Burton J.O., Gray L.J., Webb D.R., Davies M.J., Khunti K., Crasto W., Carr S.J., Brunskill N.J. Association of anthropometric obesity measures with chronic kidney disease risk in a non-diabetic patient population. Nephrol. Dial. Transplant. 2012;27:1860–1866. doi: 10.1093/ndt/gfr574. [DOI] [PubMed] [Google Scholar]
- 23.Shang Y., Zhou H., Hu M., Feng H. Effect of Diet on Insulin Resistance in Polycystic Ovary Syndrome. J. Clin. Endocrinol. Metab. 2020;105 doi: 10.1210/clinem/dgaa425. [DOI] [PubMed] [Google Scholar]
- 24.Panda S. Circadian physiology of metabolism. Science. 2016;354:1008–1015. doi: 10.1126/science.aah4967. [DOI] [PMC free article] [PubMed] [Google Scholar]
- 25.Gabel K., Hoddy K.K., Haggerty N., Song J., Kroeger C.M., Trepanowski J.F., Panda S., Varady K.A. Effects of 8-hour time restricted feeding on body weight and metabolic disease risk factors in obese adults: A pilot study. Nutr. Healthy Aging. 2018;4:345–353. doi: 10.3233/NHA-170036. [DOI] [PMC free article] [PubMed] [Google Scholar]
- 26.Gabel K., Hoddy K.K., Varady K.A. Safety of 8-h time restricted feeding in adults with obesity. Appl Physiol Nutr Metab. 2019;44:107–109. doi: 10.1139/apnm-2018-0389. [DOI] [PubMed] [Google Scholar]
- 27.Hutchison A.T., Regmi P., Manoogian E.N.C., Fleischer J.G., Wittert G.A., Panda S., Heilbronn L.K. Time-Restricted Feeding Improves Glucose Tolerance in Men at Risk for Type 2 Diabetes: A Randomized Crossover Trial. Obesity. 2019;27:724–732. doi: 10.1002/oby.22449. [DOI] [PubMed] [Google Scholar]
- 28.Wilkinson M.J., Manoogian E.N.C., Zadourian A., Lo H., Fakhouri S., Shoghi A., Wang X., Fleischer J.G., Navlakha S., Panda S., Taub P.R. Ten-Hour Time-Restricted Eating Reduces Weight, Blood Pressure, and Atherogenic Lipids in Patients with Metabolic Syndrome. Cell Metab. 2020;31:92–104.e5. doi: 10.1016/j.cmet.2019.11.004. [DOI] [PMC free article] [PubMed] [Google Scholar]
- 29.Feyzioglu B.S., Güven C.M., Avul Z. Eight-Hour Time-Restricted Feeding: A Strong Candidate Diet Protocol for First-Line Therapy in Polycystic Ovary Syndrome. Nutrients. 2023;15:2260. doi: 10.3390/nu15102260. [DOI] [PMC free article] [PubMed] [Google Scholar]
- 30.Longo V.D., Panda S. Fasting, Circadian Rhythms, and Time-Restricted Feeding in Healthy Lifespan. Cell Metab. 2016;23:1048–1059. doi: 10.1016/j.cmet.2016.06.001. [DOI] [PMC free article] [PubMed] [Google Scholar]
- 31.Chaix A., Manoogian E.N.C., Melkani G.C., Panda S. Time-Restricted Eating to Prevent and Manage Chronic Metabolic Diseases. Annu. Rev. Nutr. 2019;39:291–315. doi: 10.1146/annurev-nutr-082018-124320. [DOI] [PMC free article] [PubMed] [Google Scholar]
- 32.Zarrinpar A., Chaix A., Panda S. Daily Eating Patterns and Their Impact on Health and Disease. Trends Endocrinol. Metab. 2016;27:69–83. doi: 10.1016/j.tem.2015.11.007. [DOI] [PMC free article] [PubMed] [Google Scholar]
- 33.Yasumoto Y., Hashimoto C., Nakao R., Yamazaki H., Hiroyama H., Nemoto T., Yamamoto S., Sakurai M., Oike H., Wada N., et al. Short-term feeding at the wrong time is sufficient to desynchronize peripheral clocks and induce obesity with hyperphagia, physical inactivity and metabolic disorders in mice. Metabolism. 2016;65:714–727. doi: 10.1016/j.metabol.2016.02.003. [DOI] [PubMed] [Google Scholar]
- 34.Vollmers C., Gill S., DiTacchio L., Pulivarthy S.R., Le H.D., Panda S. Time of feeding and the intrinsic circadian clock drive rhythms in hepatic gene expression. Proc. Natl. Acad. Sci. USA. 2009;106:21453–21458. doi: 10.1073/pnas.0909591106. [DOI] [PMC free article] [PubMed] [Google Scholar]
- 35.Shostak A., Meyer-Kovac J., Oster H. Circadian regulation of lipid mobilization in white adipose tissues. Diabetes. 2013;62:2195–2203. doi: 10.2337/db12-1449. [DOI] [PMC free article] [PubMed] [Google Scholar]
- 36.Gulcelik N.E., Halil M., Ariogul S., Usman A. Adipocytokines and aging: adiponectin and leptin. Minerva Endocrinol. 2013;38:203–210. [PubMed] [Google Scholar]
- 37.Vitale K., Getzin A. Nutrition and Supplement Update for the Endurance Athlete: Review and Recommendations. Nutrients. 2019;11:1289. doi: 10.3390/nu11061289. [DOI] [PMC free article] [PubMed] [Google Scholar]
- 38.Röjdmark S. Influence of short-term fasting on the pituitary-testicular axis in normal men. Horm. Res. 1987;25:140–146. doi: 10.1159/000180645. [DOI] [PubMed] [Google Scholar]
- 39.Turek F.W., Joshu C., Kohsaka A., Lin E., Ivanova G., McDearmon E., Laposky A., Losee-Olson S., Easton A., Jensen D.R., et al. Obesity and metabolic syndrome in circadian Clock mutant mice. Science. 2005;308:1043–1045. doi: 10.1126/science.1108750. [DOI] [PMC free article] [PubMed] [Google Scholar]
- 40.Saad R. Effects of Intermittent Fasting on Health, Aging, and Disease. N. Engl. J. Med. 2020;382:1773. doi: 10.1056/NEJMc2001176. [DOI] [PubMed] [Google Scholar]
- 41.Stockman M.C., Thomas D., Burke J., Apovian C.M. Intermittent Fasting: Is the Wait Worth the Weight? Curr. Obes. Rep. 2018;7:172–185. doi: 10.1007/s13679-018-0308-9. [DOI] [PMC free article] [PubMed] [Google Scholar]
- 42.Gemming L., Jiang Y., Swinburn B., Utter J., Mhurchu C.N. Under-reporting remains a key limitation of self-reported dietary intake: an analysis of the 2008/09 New Zealand Adult Nutrition Survey. Eur. J. Clin. Nutr. 2014;68:259–264. doi: 10.1038/ejcn.2013.242. [DOI] [PubMed] [Google Scholar]
- 43.ESHRE, The Rotterdam, and ASRM-Sponsored PCOS Consensus Workshop Group Revised 2003 consensus on diagnostic criteria and long-term health risks related to polycystic ovary syndrome. Fertil. Steril. 2004;81:19–25. doi: 10.1016/j.fertnstert.2003.10.004. [DOI] [PubMed] [Google Scholar]
- 44.Ascaso J.F., Pardo S., Real J.T., Lorente R.I., Priego A., Carmena R. Diagnosing insulin resistance by simple quantitative methods in subjects with normal glucose metabolism. Diabetes Care. 2003;26:3320–3325. doi: 10.2337/diacare.26.12.3320. [DOI] [PubMed] [Google Scholar]
- 45.Diamond M.P., Legro R.S., Coutifaris C., Alvero R., Robinson R.D., Casson P.A., Christman G.M., Huang H., Hansen K.R., Baker V., et al. Sexual function in infertile women with polycystic ovary syndrome and unexplained infertility. Am. J. Obstet. Gynecol. 2017;217:191.e1–191.e19. doi: 10.1016/j.ajog.2017.04.034. [DOI] [PMC free article] [PubMed] [Google Scholar]
Associated Data
This section collects any data citations, data availability statements, or supplementary materials included in this article.
Supplementary Materials
Data Availability Statement
-
•
The complete original data reported in this study cannot be deposited in a public repository because these data are confidential medical records. To request access, contact Changqin Liu (liuchangqin@xmu.edu.cn).
-
•
This article does not report original code.
-
•
Any additional information required to reanalyze the data reported in this article is available from the lead contact upon request.