

Abstract
Acute myeloid leukemia (AML) exhibits pronounced heterogeneity, necessitating deep molecular characterization for precision therapy. Lactate metabolism and histone lactylation, influencing tumor biology via epigenetic regulation and immune microenvironment remodeling, represent an emerging focus. This study combines single-cell RNA sequencing (scRNA-seq) and bulk RNA sequencing (bulk RNA-seq) data to investigate the prognostic value of lactate/lactylation-associated genes (LL-genes, defined as genes involved in lactate metabolism and histone lactylation regulation) in AML. Specifically, Seurat was utilized for scRNA-seq clustering with cell annotation/validation via the TISCH2 database. Gene Set Variation Analysis (GSVA) assessed lactate/lactylation pathway activity. In bulk RNA-seq, ConsensusClusterPlus enabled molecular subtyping, while ten machine learning algorithms constructed a prognostic model. scRNA-seq revealed specific LL-gene overexpression in malignant progenitors, concomitant with elevated lactate metabolism-lactylation activity (LML-CAS; Lactate Metabolism-Lactylation Modification Combined Activity Score), enhanced metabolic-inflammatory synergy, and immunosuppression (increased Tregs/M2 macrophages). Molecular subtyping identified two clusters (A/B) exhibiting divergent survival outcomes (Cluster A: poorer prognosis). An optimized 7-gene prognostic model demonstrated high accuracy, predicting reduced chemotherapy response among high-risk patients. Transcriptomic profiling indicated lactylation-associated immunosuppression (e.g., downregulated CXCL9/10-CXCR3 axis, enrichment of T cell exhaustion markers) and heightened in silico-predicted sensitivity to BCL-2/FGFR inhibitors (ABT-737/AZD4547) in high-risk patients. qRT-PCR confirmed RNA-level dysregulation of key LL-genes (IFI16, THOC2, HIST1H2BD, ARPP19), aligning with bioinformatic predictions. Western blot analysis further validated aberrant protein expression of IFI16 and THOC2 in AML specimens, reinforcing their dysregulation. Collectively, integrated analyses uncovered lactate/lactylation-associated heterogeneity in AML. Our machine learning-based prognostic model predicts survival, therapeutic response, and drug sensitivity, suggesting a potential strategy for precision therapeutics in AML.
Supplementary Information
The online version contains supplementary material available at 10.1186/s12885-025-14938-8.
Keywords: Acute myeloid leukemia, Lactate metabolism, Lactylation, Prognostic model, Tumor microenvironment, Machine learning
Introduction
Acute myeloid leukemia (AML) is an aggressive hematologic malignancy characterized by clonal expansion of myeloid progenitors, with an annual incidence of 3–4 cases per 100,000 and < 30% five-year survival rate [1, 2]. Despite advances with FLT3/IDH inhibitors, relapse and chemoresistance persist due to molecular heterogeneity and metabolic plasticity [3, 4]. Emerging evidence highlights histone lactylation—a lactate-derived post-translational modification—as a novel regulatory mechanism in cancer biology [5, 6]. However, its functional significance in AML pathogenesis requires systematic investigation.
The lactylation process involves enzymatic transfer of lactyl groups to lysine residues via acyltransferases (e.g., TIP60), which is primarily regulated by lactate dehydrogenase A (LDHA) [7, 8]. In solid tumors, this modification serves as a molecular bridge connecting oncogenic metabolic adaptation with epigenetic reprogramming [9, 10]. For instance, gastric cancer studies demonstrate that AARS1 utilizes lactate and ATP to translate metabolic signals into epigenetic instructions through self-reinforcing loops, while lactylation-modified tumor microenvironment (TME) components promote malignancy via immunosuppression [11]. Similarly, hepatocellular carcinoma research reveals that lactylation drives metabolic reprogramming by modifying key enzymes to optimize the tricarboxylic acid (TCA) cycle and nucleotide biosynthesis, concurrently mediating TME remodeling and epigenetic regulation [12]. These findings establish lactylation as a critical molecular interface integrating metabolic signaling, epigenetic modulation, and immune surveillance in cancer progression.
Notably, while dysregulated lactate metabolism constitutes a hallmark of AML metabolic reprogramming [13], the biological significance of lactylation in leukemia remains poorly understood. AML cells exhibit remarkable metabolic plasticity through enhanced glycolysis, oxidative phosphorylation, and amino acid/lipid metabolism, facilitating their adaptation to bone marrow niches and therapeutic resistance. Leukemia stem cells (LSCs) display metabolic heterogeneity, with aberrant lactate accumulation acidifying the microenvironment to disrupt hematopoietic homeostasis. Recent studies suggest lactate-mediated epigenetic crosstalk—particularly histone lactylation—contributes to immune evasion mechanisms [14, 15]. STAT5-driven lactate accumulation has been shown to induce genome-wide histone hyper-lactylation, reshaping the epigenetic landscape to foster immunosuppressive microenvironments [16]. Critical knowledge gaps persist regarding: (1) the causal role of lactylation in AML leukemogenesis, (2) its immunomodulatory effects on TME reprogramming, and (3) therapeutic interactions with immune checkpoint inhibitors [17]. Furthermore, current clinical prognostic systems lack integration of lactate metabolism and lactylation-related genes (LL-genes, i.e., genes associated with lactate metabolic processes and lactylation modifications), highlighting the need for comprehensive molecular characterization.
To address these gaps, we present a multi-omics investigation integrating single-cell and bulk RNA sequencing data with machine learning approaches. This study systematically deciphers lactylation-driven regulatory networks and their functional associations with immunotherapy resistance and targeted drug sensitivity. Our findings provide novel insights into lactylation-mediated molecular mechanisms in AML and establish a predictive framework for developing personalized therapeutic strategies.
Methods
Data acquisition
Single-cell RNA sequencing (scRNA-seq) data were obtained from the GSE116256 dataset in the Tumor Immune Single-cell Hub 2 (TISCH2) database (http://tisch.compbio.cn/home/), containing 30,659 cells from 16 AML patients with detection of 19,288 genes. Bulk RNA sequencing datasets GSE37642_GPL96 (422 AML bone marrow samples) and GSE12417_GPL96 (163 AML bone marrow samples) were downloaded from the Gene Expression Omnibus (GEO) database (https://www.ncbi.nlm.nih.gov/geo/). Batch effects between GPL96-platform datasets were corrected using ComBat (sva v3.52.0), with results shown in Supplementary Figure S1. After merging these datasets, we obtained a combined dataset comprising 12,539 genes across 585 samples, of which 580 samples contained survival data for subsequent analysis.
Lactate metabolism-related genes were acquired from the MSigDB database (https://www.gsea-msigdb.org/gsea/msigdb) using two gene sets: “GOBP_LACTATE_METABOLIC_PROCESS” and “GOBP_LACTATE_TRANSMEMBRANE_TRANSPORT”. Lactylation-related genes (LL-genes) were curated from published literature [18–20], resulting in a final compilation of 359 genes (Supplementary Table 1).
Single-cell data quality control and cell type annotation
The raw gene expression matrix was processed using Seurat (v4.4.0) for quality control. This involved filtering out genes detected in fewer than 3 cells and cells with UMI counts below 200; cells expressing between 200 and 6,000 genes were retained, while those exhibiting mitochondrial gene content exceeding 10% were excluded. The filtered matrix was normalized based on library size. Subsequently, the top 2,000 highly variable genes (HVGs) were identified using the FindVariableFeatures function. PCA was then applied to these HVGs, utilizing the first 15 principal components (PCs). Cell clusters were identified via the FindClusters function (resolution = 0.5). UMAP was employed for dimensionality reduction and visualization. Finally, cell types were annotated by integrating information from the TISCH2 database and established cell type-specific marker genes.
Single-cell data analysis
Cell type-specific marker genes were identified using the COSG package (v0.9.0), with the top three markers per cell type visualized in heatmaps. Differentially expressed genes (DEGs) were identified for each cell type using the FindAllMarkers function in Seurat, and the top five DEGs were similarly visualized. To functionally characterize cell clusters within lactate-relevant biology, activity scores for 50 Hallmark pathways (MSigDB) were calculated using the GSVA package (v1.46.0) and visualized via heatmaps. Subsequently, the Lactate Metabolism-Lactylation Modification Combined Activity Score (LML-CAS) was computed using GSVA. Cells were stratified into high- and low-LML-CAS groups based on the median score. Further analyses encompassed assessing LML-CAS distribution, the proportions of cells in each LML-CAS group, and cell type composition differences between groups. Additionally, Hallmark pathway activity scores were calculated specifically for the high- and low-LML-CAS groups.
Consensus cluster analysis of LL-genes
Thirty-four LL-genes significantly associated with prognosis (p < 0.01) were identified from the merged bulk RNA-seq data using univariate Cox regression analysis. Consensus clustering was then performed using the ConsensusClusterPlus package (v1.68.0), which delineated two optimal molecular subtypes. Subsequent functional analyses comprised: correlation network construction, Kaplan–Meier survival analysis, differential gene expression analysis, and GSVA applied to pathway databases including Biocarta, Hallmark, KEGG, Reactome, and Wikipathways.
Development and validation of a prognostic machine learning model
A prognostic model was developed employing ten machine learning algorithms: Random Survival Forest (RSF), LASSO, Gradient Boosting Machine (GBM), Survival-SVM, SuperPC, ridge regression, plsRcox, CoxBoost, Stepwise Cox, and Elastic Net (Enet). Among these, RSF, LASSO, CoxBoost, and Stepwise Cox were specifically utilized for dimensionality reduction and variable selection. The GSE37642 dataset constituted the training cohort, while external datasets were employed for validation. Model selection was guided by overall performance, as evaluated by the concordance index (C-index). Additionally, RSF was applied to estimate the error rate and rank variable importance. Using the calculated risk scores, patients were stratified into distinct risk groups to facilitate Kaplan–Meier survival analysis. Time-dependent receiver operating characteristic (ROC) curves and corresponding area under the curve (AUC) values were computed for 1-, 3-, and 5-year survival predictions.
Model interpretability
SHAP (SHapley Additive exPlanations; Lundberg & Lee, 2017) is a model-agnostic framework rooted in Shapley values [21] that quantifies the contribution of individual features to model predictions, thereby facilitating interpretable analyses at both global and local levels. To apply SHAP to survival models (e.g., Cox proportional hazards models, Random Survival Forests [RSFs]), we employed the survex package (v1.2.0). This package generates time-dependent feature contribution profiles, which dynamically characterize the influence of features on predicted risk over time. This approach directly addresses key challenges in survival analysis, namely censored data and time-dependent effects. Furthermore, survex provides a standardized interface that enables comparative assessment of model transparency across different algorithms, enhancing the trustworthiness and interpretability of our prognostic models in a medical context.
Enrichment analysis of risk groups
Gene set enrichment analysis (GSEA) was performed using the clusterProfiler package (v4.6.2) to analyze GO biological processes (BP) and KEGG pathways via the gseGO (ontology = “BP”) and gseKEGG functions, respectively. Parameter settings were consistent for both analyses: nPerm = 1000, minGSize = 10, maxGSize = 1000. Reactome pathway enrichment was subsequently conducted with the gsePathway function from ReactomePA (v1.42.0), maintaining identical parameters (nPerm = 1000, minGSSize = 10, maxGSSize = 1000). Significantly enriched gene sets (p-value < 0.05) were visualized in ridge plots with wrapped y-axis labels to prevent overlap.
Analysis of immune microenvironment and immunotherapy response
Immune cell infiltration profiles were quantified using the IOBR package (v0.99.8) [22] by integrating eight established algorithms: MCPcounter, EPIC, xCell, CIBERSORT, IPS, quanTIseq, ESTIMATE, and TIMER. The resulting profiles were visualized as hierarchically clustered heatmaps. Subsequently, correlations between risk scores and the abundance of immune cells, chemokine expression, and chemokine receptor expression were assessed. Finally, TIDE scores, immunotherapy response distributions, and exclusion scores were computed using the publicly accessible TIDE platform (http://tide.dfci.harvard.edu/login/).
Drug sensitivity analysis
The half-maximal inhibitory concentration (IC50) of standard therapeutic agents for AML samples was predicted using the oncoPredict R package (v1.2). Drug sensitivity data were derived from the Genomics of Drug Sensitivity in Cancer (GDSC) database (https://www.cancerrxgene.org/).
Quantitative real-time PCR (qRT-PCR)
This study was approved by the Ethics Committee of the Third Affiliated Hospital of Wenzhou Medical University (No. YJ2025026). Bone marrow samples from 8 patients with AML and 8 healthy donors were processed to isolate mononuclear cells. Total RNA was reverse transcribed into cDNA, and expression levels of prognostic model genes were quantified in triple replicate via SYBR Green-based qRT-PCR (ABI Q6; Accurate Biology). Primer sequences are listed in Supplementary Table 2. Relative gene expression was normalized to GAPDH expression and calculated using the 2−ΔΔCT method. All participants provided informed consent.
Western blot analysis
Bone marrow samples underwent erythrocyte lysis (6:1 buffer-to-sample ratio). After centrifugation (800 ×g, 10 min), the pellet was lysed in RIPA buffer containing protease/phosphatase inhibitors. Protein concentration was quantified using the Omni-Easy™ BCA Protein Assay Kit (Epizyme Biotech, Cat# ZJ102). Equal protein amounts were denatured in loading buffer, resolved by SDS-PAGE, and transferred to PVDF membranes (wet transfer). Membranes were blocked with 5% non-fat dry milk in TBST (1 h, RT), then incubated with primary antibodies (Proteintech) overnight at 4 °C. Following TBST washes, membranes were incubated with HRP-conjugated secondary antibodies (2 h, RT), washed again, and developed using ECL substrate (Vazyme Biotech, Cat# E422-02). Signals were captured with a chemiluminescence imaging system. Band intensities were analyzed using ImageJ software.
Statistical analyses
Statistical analyses used R (v4.4.0). Spearman correlation assessed continuous variable relationships. Kaplan–Meier/log–rank tests evaluated survival differences. Group comparisons employed t-test/Wilcoxon (two groups) or ANOVA/Kruskal–Wallis (multiple groups). Univariate/multivariate Cox regression analyzed risk scores and clinical features for OS (HRs with 95% CIs). Benjamini–Hochberg controlled FDR (significance: P-value < 0.05).
Results
Single-cell profiling of lactylation-driven cellular heterogeneity in AML
Figure 1 outlines the study design workflow. Single-cell analysis of 30,659 AML cells (GSE116256) identified 12 UMAP clusters annotated as major immune/hematopoietic lineages, including B cells, CD4⁺/CD8⁺ T cells, erythroid progenitors, GMPs, HSCs, malignant cells, monocytes, NK cells, plasma cells, promonocytes, and proliferating T cells (Fig. 2A). COSG-defined marker genes (Fig. 2B; Supplementary Table 3, e.g., MS4A1 for B cells, CD14 for Monocyte) and differential expression revealed proliferative signatures in malignant cells (e.g., GUCY1A3) versus stemness markers in HSCs (e.g., MSI2, Fig. 2C). GSVA revealed distinct pathway activities across cell clusters, including enrichment of oxidative phosphorylation/DNA repair in HSCs and glycolysis/hypoxia pathways in malignant cells (Fig. 2D; Supplementary Table 4), suggesting potential links to lactate-driven metabolic reprogramming in leukemic clones.
Fig. 1.

Study design flowchart
Fig. 2.

Dimensionality reduction, clustering, and annotation of scRNA-seq data. A UMAP visualization of cell clustering across different cell types. B Heatmap showing the top 3 marker genes for each cell type. C Top 5 upregulated and downregulated differentially expressed genes (DEGs) for each cell type. x-axis: Gene names; y-axis: Log2 fold change of gene expression (positive values indicate upregulation, negative values indicate downregulation). D Heatmap displaying GSVA scores for 50 hallmark pathways across different cell types
LL-genes were elevated in promonocytes, progenitors (GMPs, EryPro), and Tprolif, but depressed in NK/plasma cells (Fig. 3A). High LML-CAS scores characterized malignant monocytes/progenitors versus low scores in mature T-cells/EryPro (Fig. 3B). Pronounced LML-CAS heterogeneity showed highest scores in promonocytes, progenitors, and Tprolif (Fig. 3C). High-score expansion correlated with malignant cell accumulation (Fig. 3D), a pattern mirrored by progressive progenitor and malignant monocyte enrichment in the high-LML-CAS group versus mature immune cell dominance in the low group (Fig. 3E), with UMAP-confirmed transcriptional divergence (Fig. 3F). This spatial segregation suggests that elevated lactylation activity may be associated with malignant clonal expansion and immune evasion.
Fig. 3.

Characterization of LL_genes in scRNA-seq data. A Expression levels of LL-genes across different cell types. B Cells stratified into high and low groups based on the Lactate Metabolism–Lactylation Modification Combined Activity Score (LML-CAS) and visualized by UMAP. C Boxplot showing the distribution of LML-CAS across various cell types. x-axis: Cell types; y-axis: LML-CAS. D Proportions of high- and low- LML-CAS cells and their distribution across samples. E Trends in cell type changes between high- and low- LML-CAS groups. F UMAP visualization of the distribution of high- and low- LML-CAS groups across different cell types
Pathway analysis demonstrated high LML-CAS enrichment in inflammatory/immune (IFN-γ, complement) and metabolic reprogramming pathways (KRAS, fatty acid metabolism), whereas low scores suppressed cell cycle regulation (E2F, G2/M) and oxidative phosphorylation (Fig. 4A). In the correlation analysis (Fig. 4B), LML-CAS exhibited cell-type-specific associations with key biological processes: Immune cells (B cells, CD4⁺T, CD8⁺T, NK cells) showed minimal associations with most pathways (blue, correlation < 0.25); Progenitor and malignant cells demonstrated strong positive correlations with metabolic/proliferative pathways (e.g., glycolysis, MYC targets; red, correlation > 0.75).This differential pattern may reflect distinct functional states: immune cells likely maintain basal metabolic homeostasis, while the tendency for metabolic reprogramming in leukemic populations may be linked to sustained proliferative demands.
Fig. 4.

Association between LML-CAS and hallmark pathway activities. A Heatmap showing hallmark pathway scores stratified by high and low LML-CAS levels. B Heatmap displaying the correlation between LML-CAS and hallmark pathway activities
Subtyping of AML based on LL-genes and analysis of functional and immune microenvironment characteristics
Integrated co-expression and Cox analysis identified a significant 34-gene prognostic module (p < 0.01; Fig. 5A; Supplementary Table 5, where HR > 1 indicated oncogenic potential [e.g., THOC2, HR = 1.426, P = 0.002] and HR < 1 suggested tumor-suppressive roles [e.g., ZYX, HR = 0.781, P = 7.58E−04]). Purple nodes (e.g., THOC2, IFI16) represented risk genes while green nodes (e.g., HIST1H2BD, ZYX) were protective, with node size inversely proportional to Cox P-values. Risk genes showed positive correlations (pink edges) suggesting coordinated oncogenic effects, while negative correlations (blue edges) between risk/protective genes indicated antagonistic regulation. ConsensusClusterPlus stratified patients into two stable subtypes (Cluster A/B; k = 2 optimal; Fig. 5B). Cluster A exhibited significantly shorter OS (HR = 1.72, 95% CI 1.42–2.09, p < 0.001; Fig. 5C) and differential expression of genes like TRIM28, ARPP19, and SF3B1 (Figs. 5D, E). The poor prognosis of Cluster A may arise from synergistic dysregulation of oncogenic LL-genes, driving metabolic imbalance and proliferation.
Fig. 5.

Functional exploration of LL-genes. A Network diagram of univariate Cox regression and correlation analyses for LL-genes. B Consensus clustering using 34 LL-genes identified K = 2 as optimal. C Kaplan–Meier survival analysis comparing the two subtypes. D Differential expression of key LL-genes between Cluster A and Cluster B. x-axis: Gene names; y-axis: Normalized gene expression level. Statistical significance: ns (not significant), * = p < 0.05, ** = p < 0.01, *** = p < 0.001. E Heatmap showing LL-genes expression across subtypes
GSVA revealed Cluster A enrichment in MYC targets and ribosomal biosynthesis versus Cluster B enrichment in inflammatory response, NK cytotoxicity, and oxidative stress (Figs. 6A–E; Supplementary Table 6, detailing pathway-level logFC, statistical significance, and effect sizes for all differentially active signatures).
Fig. 6.

Comparison of pathway enrichment across different subtypes. A Biocarta pathway enrichment results. B Hallmark pathway enrichment results. C KEGG pathway enrichment results. D Reactome pathway enrichment results. E Wikipathway enrichment results
PCA confirmed transcriptional divergence (Fig. 7A). Immune profiling showed Cluster A dominated by adaptive immunity (CD8⁺ T, Tregs) and antigen-presenting cells, while Cluster B exhibited myeloid enrichment (monocytes, M2 macrophages, MDSCs) indicating immunosuppression (Fig. 7B). IOBR analysis validated high T-cell infiltration in Cluster A versus myeloid accumulation in Cluster B (Fig. 7C). These findings suggest Cluster A represents a target for MYC/Treg co-targeting, while Cluster B may benefit from myeloid-directed immunotherapies.
Fig. 7.

Immune infiltration analysis across different subtypes. A PCA plot showing the distribution of samples across subtypes. B Differences in immune cell infiltration between Cluster A and Cluster B. x-axis: Immune cell types; y-axis: Immune Infiltration Score. Statistical significance: ns (not significant), * = p < 0.05, ** = p < 0.01, *** = p < 0.001. C Heatmap displaying immune cell infiltration across subtypes, analyzed using MCPcounter, EPIC, xCell, CIBERSORT, IPS, quanTIseq, ESTIMATE, and TIMER algorithms
Prognostic model construction and validation
Initial Cox regression identified LL-genes significantly associated with AML OS (Fig. 8A–C). Systematic evaluation of 81 algorithm combinations across 10 ML—with performance metrics (C-index, prediction error) quantified for three cohorts (merge, GSE37642, GSE12417) in Supplementary Table 7—identified the RSF model as optimal (Fig. 8D), achieving a mean cross-validation C-index of 0.755. The RSF model achieved low prediction error (< 0.44, Fig. 8E-Left) and identified IFI16 (importance score: 0.0226) and THOC2 (0.0198) as top contributors (Fig. 8E-Right). The low error rate and robust cross-validation performance support the model’s reliability for clinical risk stratification.
Fig. 8.

Development of a Risk Model Based on 7 LL-genes. A Forest plot of 7 LL-genes in GSE12417. B Forest plot of 7 LL-genes in GSE37642. C Forest plot of 7 LL-genes in the merged dataset. D The C-indexes of 81 machine-learning algorithm combinations in the three cohorts. E Error rate and variable importance ranking from the Random Survival Forest (RSF) model. Left panel: x-axis: Number of trees; y-axis: Error rate. Right panel: x-axis: Variable importance score; y-axis: Gene names
Multivariable Cox confirmed the risk score as an independent OS prognostic factor after adjusting for age and FAB subtype (HR = 1.031, 95%CI 1.027–1.034, p < 0.001; Fig. 9A, B). A multi-time-point nomogram integrating risk score, age, and FAB stage was developed (Fig. 9C). DCA showed the risk score provided greater clinical net benefit for 1-year prediction than other factors (Fig. 9D). Risk stratification revealed significant survival differences (high vs. low) in all cohorts (log-rank p < 0.05). Time-dependent ROC yielded AUCs: GSE37642 (1y:0.966, 3y:0.968, 5y:0.956); merged cohort (1y:0.897, 3y:0.907, 5y:0.921); GSE12417 (1y:0.766, 3y:0.778) (Fig. 9E–G).
Fig. 9.

Performance evaluation of model prognosis and construction of nomogram. A-B Forest plot of independent prognostic predictors identified by univariate A and multivariate B Cox regression analyses. C, D Prognostic Nomogram and Decision Curve Analysis (DCA) in GSE37642 dataset. E–G Survival and time-dependent ROC analyses of high-/low-risk groups across GSE37642, GSE12417, and Merge cohorts
Model interpretation and critical biomarker identification via SurvSHAP
SurvSHAP, an interpretable framework for time-dependent feature attribution in survival models, was implemented to deconstruct the RSF model and elucidate its prediction mechanisms. Global variable importance, quantified by mean absolute SHAP values, revealed relative feature contributions across cohorts (Fig. 10A). Time-dependent SHAP trajectory analysis delineated temporal dynamic impacts of prognostic features. Beeswarm plots ranked variables by descending median SHAP values, with point density distributions reflecting inter-sample heterogeneity (Fig. 10B). Elevated SHAP values correlated with increased OS impact, highlighting clinical utility.
Fig. 10.

Model interpretation based on SurvSHAP. A Time-dependent SurvSHAP (t) values for the 7 LL-genes. x-axis: Time (days); y-axis: Aggregated SurvSHAP (t) value (indicating feature contribution to survival prediction). B Ranking of the 7 lactate/lactylation-associated genes (LL-genes) based on their SHAP values. x-axis: Aggregated SurvSHAP (t) value; y-axis: Gene names
Enrichment analysis based on RSF model risk score
Correlation analysis linked risk scores to gene expression. The top 50 positively and negatively correlated genes (Pearson) were visualized in heatmaps (Fig. 11A, B). GSEA revealed significant enrichment in RNA processing, ribosome biogenesis, and translation (GO analysis), “Ribosome biogenesis in eukaryotes” (KEGG, FDR < 0.05), and Reactome pathways (“ribosomal large subunit assembly”, “antigen processing”)—with all enrichment metrics (ES, NES, P-values) tabulated in Supplementary Table 8. These multi-ontology GSEA findings collectively implicate potential links between aberrant ribosomal/translational activation, immune dysregulation, and high-risk status (Fig. 11C–E).
Fig. 11.

Enrichment Analysis of Risk Score A, B. Correlation analysis between the risk score and all genes, visualized by heatmaps showing the expression patterns of the top 50 positively correlated genes A, and the top 50 negatively correlated genes B. C GSEA_GO enrichment analysis. D GSEA_KEGG enrichment analysis. E GSEA_Reactome enrichment analysis
Analysis of immune microenvironment and immunotherapy response
Integrated analysis using multiple algorithms assessed the association between risk score and the tumor immune microenvironment. ESTIMATE analysis revealed significantly lower stromal and immune scores in high-risk patients (p < 0.001)—with risk score correlations to immune cell subsets (e.g., T cells, NK cells) and stromal features detailed in Supplementary Table 9—indicating reduced immune cell infiltration (Fig. 12A). Heatmap analysis showed downregulation of CXCL9, CXCL10, and CXCR3 in the high-risk group, where risk score-chemokine expression correlations (CCL/CCR family) are tabulated in Supplementary Table 10, suggesting impaired chemokine signaling for immune recruitment (Fig. 12B).
Fig. 12.

Immune Cell Infiltration and Cytokine-Receptor Profiling Stratified by Risk Groups A Immune Infiltration Landscape in high- versus low-risk groups. B Cytokine-Receptor Network Analysis in high- vs low-risk groups
TIDE predictions demonstrated significantly elevated TIDE scores and reduced immunotherapy response rates in high-risk patients (53% vs. 29%; p < 0.001), along with higher tumor immune exclusion scores (Fig. 13A–C)—with Supplementary Table 11 detailing patient-level correlations between risk groups, immunotherapy response, TIDE and immune signatures (Exclusion). Collectively, these results imply that lactylation-associated immunosuppression may contribute to immunotherapy resistance in high-risk AML.
Fig. 13.

Differences in Immunotherapy Response Between Risk Groups. A Differences in TIDE (Tumor Immune Dysfunction and Exclusion) scores between high- and low-risk groups. x-axis: Risk groups (high-risk/low-risk); y-axis: TIDE score. ***p < 0.001. B Distribution of immunotherapy response in high- versus low-risk groups. x-axis: Risk groups (high-risk/low-risk); y-axis: Proportion of patients. ‘True’ indicates predicted response, ‘False’ indicates predicted non-response. C Differences in immune exclusion scores between high- and low-risk groups. x-axis: Risk groups (high-risk/low-risk); y-axis: Exclusion score. *** p < 0.001
Drug sensitivity analysis
By predicting the IC50 values of patients with AML across distinct risk groups, we estimated therapeutic sensitivities to different drugs. Boxplots showing significant sensitivity differences in IC50 values of the top 12 drugs between high-risk and low-risk groups. x-axis: Risk groups (high/low); y-axis: Drug names and IC50 values (lower values indicate higher sensitivity). **p < 0.01, ***p < 0.001. (Figure S2) with Supplementary Table 12 detailing patient-level IC50 values and risk-group contrasts for these agents. High-risk patients showed markedly lower IC50s (p < 0.001) for drugs targeting apoptosis (ABT-737, Bcl-2 inhibitor), tyrosine kinases (AT13148/AKT, AZD4547/FGFR), and cell cycle (BI-2536/PLK1), alongside alkylating agents (carmustine) and multi-kinase inhibitors (dasatinib). The enhanced predicted sensitivity to these drugs aligns with the predominant targeting of apoptosis regulation (e.g., Bcl-2, AKT), tyrosine kinase signaling (FGFR), and cell cycle checkpoints (PLK1) by these compounds, suggesting that molecular vulnerabilities in high-risk AML may drive therapeutic responsiveness. These findings suggest potential links between combinatorial targeting of these pathways and therapeutic responsiveness in high-risk AML cohorts.
Validation of key LL-genes by qRT-PCR and western blotting
RSF feature importance and SurvSHAP analysis identified four key LL-genes (ARPP19, HIST1H2BD, THOC2, IFI16) for validation. qRT-PCR validation revealed that, compared with healthy donors, the expression levels of ARPP19 and HIST1H2BD in AML patients were significantly downregulated by 2.12-fold (p = 0.020) and 2.13-fold (p = 0.021), respectively, while the expression of THOC2 and IFI16 was upregulated by 2.30-fold (p = 0.015) and 2.37-fold (p = 0.010), respectively (Fig. 14A–D; Supplementary Table 13). This is consistent with the findings from the RSF model, which classified IFI16 and THOC2 as high-risk genes with the greatest contribution to model prediction (Fig. 8E), and their SHAP values exerted a positive contribution to survival prediction (Fig. 10B). Western blotting further validated increased protein expression of these two upregulated genes (THOC2 and IFI16), confirming concordance with the mRNA findings (Fig. 14E). The consistency between mRNA and protein levels for IFI16/THOC2 supports their potential role as lactylation-linked biomarkers in AML.
Fig. 14.
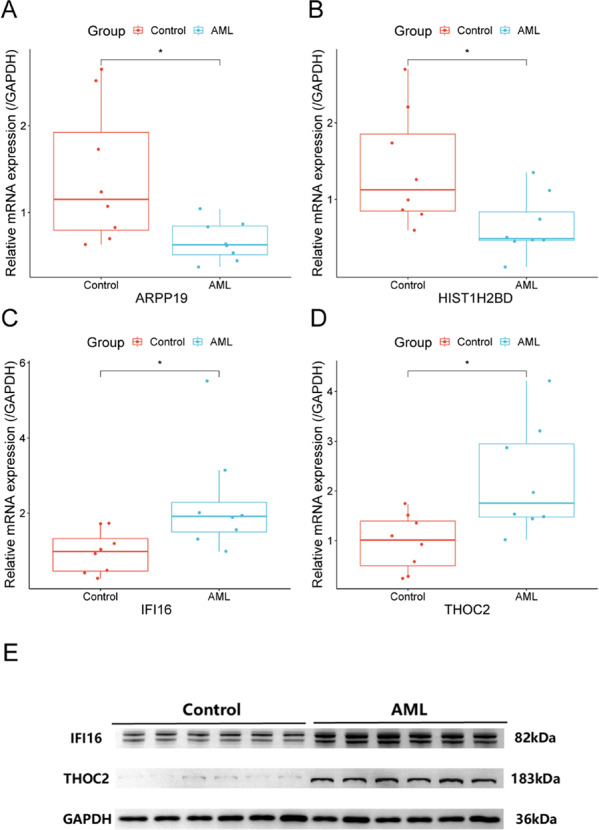
Validation of signature gene expression by RT-qPCR and Western blotting. A ARPP19 (cAMP-regulated phosphoprotein 19) mRNA expression analyzed by qRT-PCR. B HIST1H2BD (histone cluster 1 H2B family member D) mRNA expression analyzed by RT-qPCR. C IFI16 (interferon gamma-inducible protein 16) mRNA expression analyzed by RT-qPCR. D THOC2 (THO complex subunit 2) mRNA expression analyzed by RT-qPCR. x-axis: Groups (Control/AML); y-axis: Relative expression level (normalized to GAPDH, calculated by 2−ΔΔCT method). *p < 0.05.E Protein expression of IFI16 and THOC2 detected by Western blotting (GAPDH: loading control)
Discussion
Historically dismissed as a terminal glycolytic waste product, lactate is now redefined through lysine lactylation as a dual-function orchestrator in oncology, coordinating tumor metabolic reprogramming and epigenetic regulation to reshape the tumor microenvironment (TME) [23–25]. Examples include: H3K18 lactylation activating TTK/BUB1B kinase and establishing a self-reinforcing lactate-epigenetic circuit in pancreatic cancer [26]; H4K12 lactylation silencing SLFN5 to confer proliferative autonomy and chemoresistance in TNBC [27, 28]; H3K18 lactylation driving bevacizumab resistance via RUBCNL-dependent autophagy in colorectal cancer [29]; and lactylation synergizing macrophage polarization with HNRNPH1-mediated apoptotic suppression in lymphoma, where circulating levels serve as a prognostic biomarker [30]. Nevertheless, research on lactate metabolism and lactylation in AML remains limited, lacking both dynamic modification profiles and mechanistic insights into lactylation-mediated regulatory networks.
Through in-depth analyses of single-cell transcriptomic data, we delineated 13 major cellular subpopulations in AML, encompassing malignant clones, immune cell subsets, and hematopoietic progenitors. Notably, LML-CAS exhibited marked heterogeneity across these cellular subsets. GSVA revealed strong associations between LML-CAS and core metabolic pathways including oxidative phosphorylation, fatty acid metabolism, and mTOR signaling [31, 32], suggesting lactate-driven lactylation may contribute to AML metabolic reprogramming. Furthermore, LML-CAS peaked in proliferative cell compartments (including promonocytes, progenitors, and proliferative T-cells) while scores were significantly lower in NK cells and plasma cells; this distribution aligns with lactylation's known role in promoting malignant clonal expansion [33, 34]. Stratified analyses demonstrated enrichment of malignant progenitors and promonocytes in high-LML-CAS AML patients, whereas mature immune cells predominated in low-LML-CAS patients [35]. This spatial segregation suggests lactylation modifications are associated with AML pathogenesis by enhancing malignant clone proliferation and invasiveness. Longitudinal analysis revealed progressive expansion of high-LML-CAS promonocytes/progenitors alongside accumulation of low-LML-CAS immune effectors [33], suggesting lactylation's dual role in clonal dominance and immune evolution.
Using expression profiles of prognosis-associated lactate/lactylation-associated genes (LL-genes), we stratified AML patients into two distinct subtypes (Cluster A and Cluster B) with significant clinical and biological heterogeneity. Cluster A patients exhibited poorer outcomes, marked by MYC signaling hyperactivation and hyperactive ribosomal biosynthesis in leukemic cells, suggesting dysregulated metabolism and uncontrolled proliferation may drive disease progression. The coexistence of cytotoxic CD8+ T cells and immunosuppressive Tregs in Cluster A could contribute to immune imbalance, potentially exacerbating disease aggressiveness. Conversely, Cluster B showed enhanced inflammatory responses, MDSC/M2 macrophage infiltration, and microenvironment oxidative stress, hinting at links between immune evasion and metabolic stress. These findings highlight potential precision treatment insights, emphasizing concurrent targeting of tumor metabolic dysregulation and immune microenvironment imbalance.
This study presents the first systematic integration of lactate metabolism with histone lactylation modifications. Utilizing 76 combinatorial strategies from 10 machine learning algorithms, we identified seven pivotal hub genes (IFI16, THOC2, HIST1H1C, HIST1H2BD, ARPP19, GLO1, and SRP14) for prognostic modeling. SurvSHAP interpretability analysis delineated feature contributions, confirming the model's biological validity for AML risk stratification. Although these genes are well-studied in solid tumors, their coordinated functions and regulatory networks in AML remain poorly characterized.
IFI16, an interferon-inducible DNA sensor, enhances RIG-I-mediated IFN-I signaling to suppress viral replication [36]. In renal carcinoma, IFI16 overexpression promotes tumor progression via IL-6/PI3K/AKT activation and EMT [37]. In curcumin-treated AML, it triggers pyroptosis via caspase-1/GSDMD and correlates with drug sensitivity [38]. Its upregulation in our cohort supports context-dependent pathogenesis. THOC2, a THO complex component, regulates mRNA processing/export and genomic stability [39]. Pan-cancer studies show it promotes stemness and radioresistance in breast cancer [40], drives melanoma proliferation via cAMP suppression [41], and mediates glioblastoma chemoresistance through Bcl-x splicing [42]. Its elevation suggests oncogenic roles in AML. HIST1H2BD regulates chromatin architecture [43, 44]. Its downregulation in AML contrasts with cervical cancer where overexpression correlates with poor survival [45], indicating tissue-specific functions. ARPP19, a PP2A inhibitor linked to AML relapse [46], showed downregulation in our data, suggesting subtype-specific regulation requiring further validation.
Furthermore, integrated transcriptomic profiling revealed AML risk stratification mechanisms: high-risk patients exhibited aberrant activation of RNA processing and ribosome biogenesis pathways, suggesting coordinated dysregulation of lactylation-associated transcriptional programs and proliferative phenotypes. Immune profiling demonstrated signatures of impaired CXCL9/10-CXCR3 signaling, reduced immune infiltration and elevated TIDE scores, forming “cold tumor” phenotypes that may constrain immunotherapy response. Pharmacogenomic analysis identified selective sensitivity to apoptosis regulators and cell cycle inhibitors in high-risk groups, supporting exploration of targeted combination strategies. These findings transcriptomically inferred associations from metabolic-epigenetic dysregulation to microenvironment remodeling in AML heterogeneity.
While multi-dimensional validation confirms model advantages, limitations warrant acknowledgment. Long-term predictive reliability may be constrained by heterogeneous follow-up durations, retrospective design biases, and therapeutic variability, necessitating prospective validation. Experimental confirmation of immune cell spatial distribution (e.g., flow cytometry for T cell exhaustion, TCR clonality), and metabolic profiles—including lactylation levels inferred solely from transcriptomic signatures without direct modification measurement—is lacking, potentially compromising biological interpretability. Validation of the functional roles of lactylation-linked (LL) genes and the causal links between lactate remodeling and lactylation-mediated epigenetic regulation requires further mechanistic studies, such as gene knockdown/overexpression experiments, in addition to pharmacological/cellular validation. The predicted associations between the lactylation signature and drug sensitivities remain computational and await experimental validation in clinical or pre-clinical models. Although we validated key LL-genes (e.g., IFI16, THOC2) at the mRNA level via qRT-PCR and performed preliminary protein-level validation for IFI16 and THOC2 using Western blotting (WB) in a subset of samples, the sample size of the experimental cohort remains limited. Broader proteomic validation across the signature and in larger cohorts is still required to fully corroborate the findings.
Conclusion
This study suggests critical roles of lactate metabolism and lactylation in shaping AML heterogeneity and tumor microenvironment. The lactate/LL-gene-based prognostic model demonstrates cross-cohort predictive stability and reveals associations supporting exploration of personalized therapy through immunotherapy response and drug sensitivity correlations. Integrated analyses establish clinical relevance of LL-genes, uncovering novel lactate-lactylation crosstalk potentially linked to immunosuppression. Single-cell LML-CAS resolved spatial lactylation dynamics across malignant and stromal cells, suggesting metabolic-epigenetic interplay. These findings establish a multidimensional foundation for AML precision subtyping, targeted therapy, and prognostic tool development.
Supplementary Information
Below is the link to the electronic supplementary material.
Acknowledgements
We extend our sincere appreciation to the National Center for Biotechnology Information (NCBI) Gene Expression Omnibus (GEO) for providing openly accessible datasets critical to this study. Additionally, we acknowledge the contributions of the global R programming and bioinformatics communities, whose open-source tools and packages enabled the computational analyses central to our work.
Abbreviations
- AML
Acute myeloid leukemia
- AUC
Area under curve
- C-index
Concordance index
- DEGs
Differentially expressed genes
- GDSC
Genomics of drug sensitivity in cancer
- GO
Gene ontology
- GSEA
Gene set enrichment analysis
- GSVA
Gene set variation analysis
- IC50
Half-maximal inhibitory concentration
- KEGG
Kyoto encyclopedia of genes and genomes
- LL-genes
Lactate/lactylation-associated genes
- LML-CAS
Lactate Metabolism-Lactylation Modification Combined Activity Score
- OS
Overall survival
- PCA
Principal component analysis
- qRT-PCR
Quantitative real-time PCR
- ROC
Receiver operating characteristic
- RSF
Random survival forest
- scRNA-seq
Single-cell RNA sequencing
- SHAP
SHapley Additive exPlanations
- TIDE
Tumor immune dysfunction and exclusion
- TME
Tumor microenvironment
- UMAP
Uniform manifold approximation and projection
Author contributions
X.C. and A.F. conceived and designed the research, implemented core experiments, integrated data, and drafted the initial manuscript. H.G. performed experiments, conducted data validation, applied statistical methodologies, and co-wrote the results section. J.Z. contributed to data collection/analysis and assisted in manuscript revision. M.C. developed the research framework, provided theoretical guidance, supervised experimental quality and data analysis, performed final manuscript review, and ensured academic compliance. All authors critically reviewed the manuscript and approved the final version.
Funding
This study was supported by funding from the Zhejiang Provincial Medical and Health Science and Technology Program (No. 2025KY1524).
Data availability
The datasets analyzed in this study are available in TISCH2 (GSE116256; http://tisch.compbio.cn/home/), GEO (GSE37642, GSE12417; https://www.ncbi.nlm.nih.gov/geo/), and MSigDB (‘GOBP_LACTATE_METABOLIC_PROCESS’, ‘GOBP_LACTATE_TRANSMEMBRANE_TRANSPORT’; https://www.gsea-msigdb.org/gsea/msigdb). All relevant data are available from the corresponding author upon reasonable request.
Declarations
Ethics approval and consent to participate
The studies involving humans were approved by the Clinical Trial Ethics Committee of the Third Affiliated Hospital of Wenzhou Medical University (Ethical approval number: YJ2025026). This study complied with the Declaration of Helsinki; all participant data were kept confidential, and written informed consent was obtained.
Competing interests
The authors declare no competing interests.
Footnotes
Publisher’s note
Springer Nature remains neutral with regard to jurisdictional claims in published maps and institutional affiliations.
Xiaohe Chen and Aimei Feng have contributed equally to this work and share first authorship.
References
- 1.Venugopal S, Sekeres MA. Contemporary management of acute myeloid leukemia: a review. JAMA Oncol. 2024;10:1417–25. 10.1001/jamaoncol.2024.2662. [DOI] [PubMed] [Google Scholar]
- 2.DiNardo CD, Erba HP, Freeman SD, Wei AH. Acute myeloid leukaemia. Lancet. 2023;401:2073–86. 10.1016/S0140-6736(23)00108-3. [DOI] [PubMed] [Google Scholar]
- 3.Issa GC, DiNardo CD. Acute myeloid leukemia with IDH1 and IDH2 mutations: 2021 treatment algorithm. Blood Cancer J. 2021;11:107. 10.1038/s41408-021-00497-1. [DOI] [PMC free article] [PubMed] [Google Scholar]
- 4.Döhner H, Wei AH, Löwenberg B. Towards precision medicine for AML. Nat Rev Clin Oncol. 2021;18:577–90. 10.1038/s41571-021-00509-w. [DOI] [PubMed] [Google Scholar]
- 5.Zhang D, Tang Z, Huang H, et al. Metabolic regulation of gene expression by histone lactylation. Nature. 2019;574:575–80. 10.1038/s41586-019-1678-1. [DOI] [PMC free article] [PubMed] [Google Scholar]
- 6.Qu J, Li P, Sun Z. Histone lactylation regulates cancer progression by reshaping the tumor microenvironment. Front Immunol. 2023;14:1284344. 10.3389/fimmu.2023.1284344. [DOI] [PMC free article] [PubMed] [Google Scholar]
- 7.Sun W, Jia M, Feng Y, Cheng X. Lactate is a bridge linking glycolysis and autophagy through lactylation. Autophagy. 2023;19:3240–1. 10.1080/15548627.2023.2246356. [DOI] [PMC free article] [PubMed] [Google Scholar]
- 8.Jia M, Yue X, Sun W, et al. ULK1-mediated metabolic reprogramming regulates Vps34 lipid kinase activity by its lactylation. Sci Adv. 2023;9:eadg4993. 10.1126/sciadv.adg4993. [DOI] [PMC free article] [PubMed] [Google Scholar]
- 9.Xu X, Peng Q, Jiang X, et al. Metabolic reprogramming and epigenetic modifications in cancer: from the impacts and mechanisms to the treatment potential. Exp Mol Med. 2023;55:1357–70. 10.1038/s12276-023-01020-1. [DOI] [PMC free article] [PubMed] [Google Scholar]
- 10.Zhang Y, Peng Q, Zheng J, et al. The function and mechanism of lactate and lactylation in tumor metabolism and microenvironment. Genes Dis. 2022;10:2029–37. 10.1016/j.gendis.2022.10.006. [DOI] [PMC free article] [PubMed] [Google Scholar]
- 11.Ju J, Zhang H, Lin M, et al. The alanyl-tRNA synthetase AARS1 moonlights as a lactyltransferase to promote YAP signaling in gastric cancer. J Clin Invest. 2024;134:e174587. 10.1172/JCI174587. [DOI] [PMC free article] [PubMed] [Google Scholar]
- 12.Yang Z, Yan C, Ma J, et al. Lactylome analysis suggests lactylation-dependent mechanisms of metabolic adaptation in hepatocellular carcinoma. Nat Metab. 2023;5:61–79. 10.1038/s42255-022-00710-w. [DOI] [PubMed] [Google Scholar]
- 13.Liu D, Liu S, Ji Y, et al. Lactylation modulation identifies key biomarkers and therapeutic targets in KMT2A-rearranged AML. Sci Rep. 2025;15:1511. 10.1038/s41598-025-86136-2. [DOI] [PMC free article] [PubMed] [Google Scholar]
- 14.Kreitz J, Schönfeld C, Seibert M, et al. Metabolic plasticity of acute myeloid leukemia. Cells. 2019;8:805. 10.3390/cells8080805. [DOI] [PMC free article] [PubMed] [Google Scholar]
- 15.Zhang Y, Huang Y, Hong Y, et al. Lactate acid promotes PD-1+ Tregs accumulation in the bone marrow with high tumor burden of acute myeloid leukemia. Int Immunopharmacol. 2024;130:111765. 10.1016/j.intimp.2024.111765. [DOI] [PubMed] [Google Scholar]
- 16.Huang ZW, Zhang XN, Zhang L, et al. STAT5 promotes PD-L1 expression by facilitating histone lactylation to drive immunosuppression in acute myeloid leukemia. Signal Transduct Target Ther. 2023;8:391. 10.1038/s41392-023-01605-2. [DOI] [PMC free article] [PubMed] [Google Scholar]
- 17.Xiong J, He J, Zhu J, et al. Lactylation-driven METTL3-mediated RNA m6A modification promotes immunosuppression of tumor-infiltrating myeloid cells. Mol Cell. 2022;82:1660–77. 10.1016/j.molcel.2022.02.033. [DOI] [PubMed] [Google Scholar]
- 18.Cheng Z, Huang H, Li M, et al. Lactylation-related gene signature effectively predicts prognosis and treatment responsiveness in hepatocellular carcinoma. Pharmaceuticals. 2023;16:644. 10.3390/ph16050644. [DOI] [PMC free article] [PubMed] [Google Scholar]
- 19.Wan N, Wang N, Yu S, et al. Cyclic immonium ion of lactyllysine reveals widespread lactylation in the human proteome. Nat Methods. 2022;19:854–64. 10.1038/s41592-022-01523-1. [DOI] [PubMed] [Google Scholar]
- 20.Liu X, Zhang Y, Li W, Zhou X. Lactylation, an emerging hallmark of metabolic reprogramming: current progress and open challenges. Front Cell Dev Biol. 2022;10:972020. 10.3389/fcell.2022.972020. [DOI] [PMC free article] [PubMed] [Google Scholar]
- 21.Scott M, Su-In L. A unified approach to interpreting model predictions. Adv Neural Inf Process Syst. 2017;30:4765–74. [Google Scholar]
- 22.Zeng D, Fang Y, Qiu W, et al. Enhancing immuno-oncology investigations through multidimensional decoding of tumor microenvironment with IOBR 2.0. Cell Rep Methods. 2024;4:100910. 10.1016/j.crmeth.2024.100910. [DOI] [PMC free article] [PubMed] [Google Scholar]
- 23.Chen L, Huang L, Gu Y, et al. Lactate-lactylation hands between metabolic reprogramming and immunosuppression. Int J Mol Sci. 2022;23:11943. 10.3390/ijms231911943. [DOI] [PMC free article] [PubMed] [Google Scholar]
- 24.Chen AN, Luo Y, Yang YH, et al. Lactylation, a novel metabolic reprogramming code: current status and prospects. Front Immunol. 2021;12:688910. 10.3389/fimmu.2021.688910. [DOI] [PMC free article] [PubMed] [Google Scholar]
- 25.Wang T, Ye Z, Li Z, et al. Lactate-induced protein lactylation: a bridge between epigenetics and metabolic reprogramming in cancer. Cell Prolif. 2023;56:e13478. 10.1111/cpr.13478. [DOI] [PMC free article] [PubMed] [Google Scholar]
- 26.Li F, Si W, Xia L, et al. Positive feedback regulation between glycolysis and histone lactylation drives oncogenesis in pancreatic ductal adenocarcinoma. Mol Cancer. 2024;23:90. 10.1186/s12943-024-02008-9. [DOI] [PMC free article] [PubMed] [Google Scholar]
- 27.Li J, Chen Z, Jin M, et al. Histone H4K12 lactylation promotes malignancy progression in triple-negative breast cancer through SLFN5 downregulation. Cell Signal. 2024;124:111468. 10.1016/j.cellsig.2024.111468. [DOI] [PubMed] [Google Scholar]
- 28.Cui Z, Li Y, Lin Y, et al. Lactylproteome analysis indicates histone H4K12 lactylation as a novel biomarker in triple-negative breast cancer. Front Endocrinol. 2024;15:1328679. 10.3389/fendo.2024.1328679. [DOI] [PMC free article] [PubMed] [Google Scholar]
- 29.Li W, Zhou C, Yu L, et al. Tumor-derived lactate promotes resistance to bevacizumab treatment by facilitating autophagy enhancer protein RUBCNL expression through histone H3 lysine 18 lactylation (H3K18la) in colorectal cancer. Autophagy. 2024;20:114–30. 10.1080/15548627.2023.2249762. [DOI] [PMC free article] [PubMed] [Google Scholar]
- 30.Zhu M, Xiao Q, Cai X, et al. Predicting lymphoma prognosis using machine learning-based genes associated with lactylation. Transl Oncol. 2024;49:102102. 10.1016/j.tranon.2024.102102. [DOI] [PMC free article] [PubMed] [Google Scholar]
- 31.Wu H, Huang H, Zhao Y. Interplay between metabolic reprogramming and post-translational modifications: from glycolysis to lactylation. Front Immunol. 2023;14:1211221. 10.3389/fimmu.2023.1211221. [DOI] [PMC free article] [PubMed] [Google Scholar]
- 32.Chen J, Huang Z, Chen Y, et al. Lactate and lactylation in cancer. Signal Transduct Target Ther. 2025;10:38. 10.1038/s41392-024-02082-x. [DOI] [PMC free article] [PubMed] [Google Scholar]
- 33.Wang S, Huang T, Wu Q, et al. Lactate reprograms glioblastoma immunity through CBX3-regulated histone lactylation. J Clin Invest. 2024;134:e176851. 10.1172/JCI176851. [DOI] [PMC free article] [PubMed] [Google Scholar]
- 34.Wu Z, Wu H, Dai Y, et al. A pan-cancer multi-omics analysis of lactylation genes associated with tumor microenvironment and cancer development. Heliyon. 2024;10:e27465. 10.1016/j.heliyon.2024.e27465. [DOI] [PMC free article] [PubMed] [Google Scholar]
- 35.Lu X, Zhou Z, Qiu P, Xin T. Integrated single-cell and bulk RNA-sequencing data reveal molecular subtypes based on lactylation-related genes and prognosis and therapeutic response in glioma. Heliyon. 2024;10:e30726. 10.1016/j.heliyon.2024.e30726. [DOI] [PMC free article] [PubMed] [Google Scholar]
- 36.Jiang Z, Wei F, Zhang Y, et al. IFI16 directly senses viral RNA and enhances RIG-I transcription and activation to restrict influenza virus infection. Nat Microbiol. 2021;6:932–45. 10.1038/s41564-021-00907-x. [DOI] [PubMed] [Google Scholar]
- 37.Lu K, Zhao Y, Li Y, et al. IFI16 promotes the progression of clear cell renal cell carcinoma through the IL6/PI3K/AKT axis. J Transl Med. 2024;22:533. 10.1186/s12967-024-05354-w. [DOI] [PMC free article] [PubMed] [Google Scholar]
- 38.Zhou Y, Kong Y, Jiang M, et al. Curcumin activates NLRC4, AIM2, and IFI16 inflammasomes and induces pyroptosis by up-regulated ISG3 transcript factor in acute myeloid leukemia cell lines. Cancer Biol Ther. 2022;23:328–35. 10.1080/15384047.2022.2058862. [DOI] [PMC free article] [PubMed] [Google Scholar]
- 39.Bhattacharjee R, Jolly LA, Corbett MA, et al. Compromised transcription-mRNA export factor THOC2 causes R-loop accumulation, DNA damage and adverse neurodevelopment. Nat Commun. 2024;15:1210. 10.1038/s41467-024-45121-5. [DOI] [PMC free article] [PubMed] [Google Scholar]
- 40.Bai X, Ni J, Beretov J, et al. THOC2 and THOC5 regulate stemness and radioresistance in triple-negative breast cancer. Adv Sci. 2021;8:e2102658. 10.1002/advs.202102658. [DOI] [PMC free article] [PubMed] [Google Scholar]
- 41.Zhou X, Liu X, Zhang G, et al. Knockdown THOC2 suppresses the proliferation and invasion of melanoma. Bioengineered. 2019;10:635–45. 10.1080/21655979.2019.1685727. [DOI] [PMC free article] [PubMed] [Google Scholar]
- 42.Lee YJ, Jung JH, Chang DY, et al. THOC2 expression and its impact on 5-fluorouracil resistance in glioblastoma multiforme. Am J Cancer Res. 2023;13:2410–25. [PMC free article] [PubMed] [Google Scholar]
- 43.Hergeth SP, Schneider R. The H1 linker histones: multifunctional proteins beyond the nucleosomal core particle. EMBO Rep. 2015;16:1439–53. 10.15252/embr.201540749. [DOI] [PMC free article] [PubMed] [Google Scholar]
- 44.Bannister AJ, Kouzarides T. Regulation of chromatin by histone modifications. Cell Res. 2011;21:381–95. 10.1038/cr.2011.22. [DOI] [PMC free article] [PubMed] [Google Scholar]
- 45.Li X, Tian R, Gao H, et al. Identification of a histone family gene signature for predicting the prognosis of cervical cancer patients. Sci Rep. 2017;7:16495. 10.1038/s41598-017-16472-5. [DOI] [PMC free article] [PubMed] [Google Scholar]
- 46.Mäkelä E, Löyttyniemi E, Salmenniemi U, et al. Arpp19 promotes Myc and Cip2a expression and associates with patient relapse in acute myeloid leukemia. Cancers (Basel). 2019;11:1774. 10.3390/cancers11111774. [DOI] [PMC free article] [PubMed] [Google Scholar]
Associated Data
This section collects any data citations, data availability statements, or supplementary materials included in this article.
Supplementary Materials
Data Availability Statement
The datasets analyzed in this study are available in TISCH2 (GSE116256; http://tisch.compbio.cn/home/), GEO (GSE37642, GSE12417; https://www.ncbi.nlm.nih.gov/geo/), and MSigDB (‘GOBP_LACTATE_METABOLIC_PROCESS’, ‘GOBP_LACTATE_TRANSMEMBRANE_TRANSPORT’; https://www.gsea-msigdb.org/gsea/msigdb). All relevant data are available from the corresponding author upon reasonable request.