Abstract
Inositol and its phosphorylated derivatives play a major role in brain function, either as osmolytes, second messengers or regulators of vesicle endo- and exocytosis. Here we describe the identification and functional characterization of a novel H+-myo- inositol co-transporter, HMIT, expressed predominantly in the brain. HMIT cDNA encodes a 618 amino acid polypeptide with 12 predicted transmembrane domains. Functional expression of HMIT in Xenopus oocytes showed that transport activity was specific for myo-inositol and related stereoisomers with a Michaelis–Menten constant of ∼100 µM, and that transport activity was strongly stimulated by decreasing pH. Electrophysiological measurements revealed that transport was electrogenic with a maximal transport activity reached at pH 5.0. In rat brain membrane preparations, HMIT appeared as a 75–90 kDa protein that could be converted to a 67 kDa band upon enzymatic deglycosylation. Immunofluorescence microscopy analysis showed HMIT expression in glial cells and some neurons. These data provide the first characterization of a mammalian H+-coupled myo- inositol transporter. Predominant central expression of HMIT suggests that it has a key role in the control of myo-inositol brain metabolism.
Keywords: brain/metabolism/myo-inositol/transporter
Introduction
Myo-inositol is a crucial constituent of living cells and participates in several physiological functions. It is a major osmolyte and also serves as the precursor to phosphatidylinositol (PtdIns), the major inositol-containing phospholipid. Phosphorylation of the inositol hydroxyl groups at position 3, 4 or 5 results in a large number of different phospholipid species with specific functions. Phosphat idylinositol-4,5-bisphophate (PtdIns-4,5-P2) can be hydrolysed by phospholipase C to give rise to the second messengers inositol-1,4,5-triphosphate (IP3) and diacylglycerol. Activation of IP3 kinase by different signalling pathways (Cheatham and Kahn, 1995; Atwal et al., 2000; Kaplan and Miller, 2000) can produce PtdIns-3,4-P2 or PtdIns-3,4,5-P3. These are ligands for pleckstrin homology (PH) domain-containing proteins such as the protein kinases PDK1 or Akt/PKB (Irvine, 1998; Jost et al., 1998; Leevers et al., 1999), which are implicated in further propagating intracellular signals. Phosphorylation by phosphoinositide 3-kinase (PI3K) of PtdIns generates PtdIns-3-P, which is a ligand for FYVE domain-containing proteins (Leevers et al., 1999), such as EEA1, an endosomal protein implicated in early endosome fusion (Simonsen et al., 1998). Polyphosphoinositides may interact with the C2B domain of synaptotagmin, an interaction that leads to inhibition of synaptic vesicle exocytosis (Schiavo et al., 1995; Ohara-Imaizumi et al., 1997; Mehrotra et al., 2000). PtdIns, by interacting with AP2 adaptor proteins and the PH domain of the GTPase dynamin, participates in clathrin-coated pit-dependent endocytosis (Gaidarov et al., 1996; Rapoport et al., 1997). Genetic inactivation of synaptojanin 1, a polyphosphoinositide phosphatase present in clathrin-coated pits of neurons, prevents normal dissociation of the clathrin coat and leads to impaired synaptic vesicle re-endocytosis and to synaptic depression (Cremona et al., 1999).
Alterations in brain inositol levels are associated with diseases of the central nervous system. For instance, the neurological dysfunction characteristic of Down syndrome is correlated with an increase in brain inositol. This may be caused by the presence of three copies of the Na+-myo-inositol transporter gene, which is located on chromosome 21 (Shetty et al., 1995; Berry et al., 1999). On the other hand, effective treatment of bipolar disorders with lithium salt is hypothesized to result from interference with inositol metabolism. Indeed, both inositol monophosphate phosphatase and polyphosphoinositide 1-phosphate phosphatase are inhibited by Li+. This inhibition causes an impairment of inositol recycling following stimulation of the IP3 cycle by activated Gq protein-coupled receptors, thereby reducing the cellular availability of inositol for further signal transduction processes (Berridge et al., 1989; Williams and Harwood, 2000).
Cellular myo-inositol can originate from three sources: recycling of inositol phosphate second messengers, synthesis from glucose or uptake of extracellular inositol. Transport of myo-inositol across the cellular membrane requires the presence of a specific transporter. So far, a single mammalian inositol transporter has been identified. This is a Na+-coupled transporter, SMIT, which is expressed in the kidney cortex and medulla, and in the brain (Kwon et al., 1992). Its expression is increased by hypertonicity, through a mechanism controlled by the tonicity-sensitive transcription factor TonEBP (Miyakawa et al., 1999). Very high levels of expression can be obtained in different brain areas when plasma osmolality is increased. SMIT, therefore, appears to be primarily involved in a protective response to high tonicity.
Here we report on the structural and functional characterization of a novel mammalian inositol transporter. This was identified by screening databases for glucose transporter-related sequences. We demonstrate, however, that this new molecule does not transport glucose or related hexoses, but is a H+-myo-inositol symporter (HMIT). It is predominantly expressed in the brain and detected both in astrocytes and neurons. HMIT may be involved in specific aspects of brain inositol metabolism that play critical roles in intracellular signalling pathways and synaptic or other vesicle traffic.
Results
Structure of HMIT
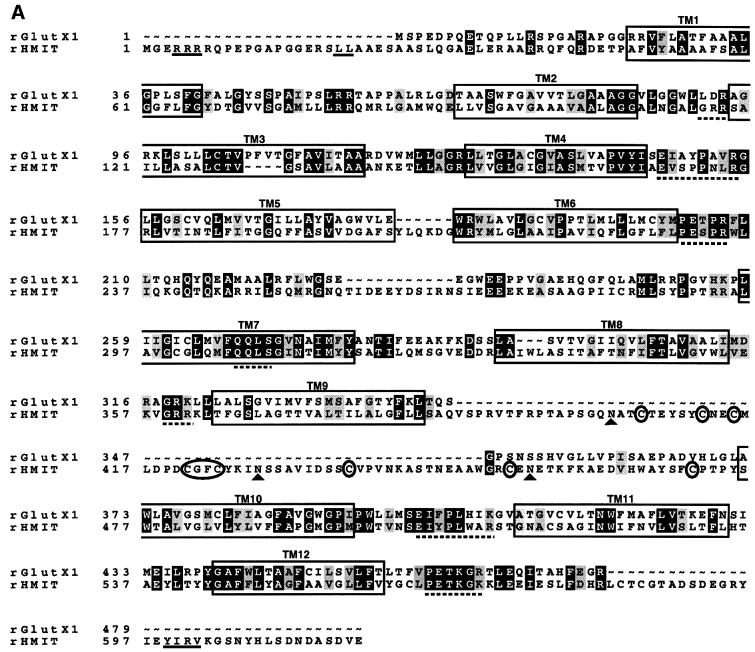
The public expressed sequence tag (EST) database was screened using the GlutX1 (or GLUT8) amino acid sequence (Ibberson et al., 2000). This led to the identification of several homologous sequences, among which was a new rat EST clone (DDBJ/EMBL/GenBank accession No. AI576033) isolated from a spleen cDNA library that we refer to as HMIT. A 300 bp fragment of this clone was amplified by RT–PCR from rat spleen total RNA and used to screen a northern blot of different tissue RNAs. The highest expression of the corresponding mRNA was found in brain and hypothalamus (see below). Full-length cDNAs were then isolated from rat hypothalamus and human frontal cortex cDNA libraries. The rat sequence is 618 amino acids long and the human sequence has 629 amino acids. These sequences are 90% identical and 93% homologous to each other (DDBJ/EMBL/GenBank accession Nos: rat HMIT, AJ315643; human HMIT, AJ315644). The rat HMIT sequence is 36% identical and 44% homologous to the rat GlutX1 (Figure 1A). It contains 12 predicted transmembrane domains (TM) with a long cytoplasmic loop between TM6 and TM7 (Figure 1B). Several motifs that have been shown to be important for glucose transport activity in the Glut family are conserved, and are highlighted in Figure 1A. Remark ably, the N-terminal region contains an endoplasmic reticulum (ER) retention signal (RRR) and a dileucine internalization signal. The C-terminal tail contains a tyrosine-based internalization motif, YIRV, of the consensus structure Yxxo (where x is any amino acid and o is a hydrophobic amino acid). An extracellular loop of 95 amino acids, which contains three N-glycosylation sites, is present between TM9 and TM10.
Fig. 1. HMIT sequence. (A) Alignment of rat GlutX1 and ratHMIT amino acids sequences using the pileup program (GCG). HMIT internalization motifs (LL and YIRV) and the ER retention motif (RRR) are underlined. The approximate positions of TM domain are marked with boxes. Highly conserved CGFC and cysteine residues in the extracellular loop between TM9 and TM10 are circled. Black shading indicates identical amino acids, grey shading indicates homologous amino acids, ∼, gaps; filled triangle, N-glycosylation sites. (B) Proposed secondary structure of HMIT. The model is based on a hydropathy index obtained by the Tmpred program. Internalization and ER retention motifs, sugar transporter signature GRR, conserved residues in the extracellular loop and putative N-glycosylation sites are highlighted. (C) Phylogenetic tree based on multiple alignments of HMIT with other sugar transporters. The alignments were performed with the pileup program (GCG) and the rectangular cladogram was built using the TreeView program. Proteins of unknown functions are given by their accession number.
Figure 1C shows a dendrogram of the sequence relatedness of HMIT and the closest transporter molecules. HMIT shows highest similarity with five non-mammalian proteins of unknown function. Three are from Caeno rhabditis elegans and two from Arabidopsis thaliana. These five proteins contain an extracellular loop between TM9 and TM10, which shows an average of 33% homology and 30% identity with HMIT’s loop. The loops of these six proteins all contain eight cysteines, a CGFC motif and 2–4 N-glycosylation sites. The dendrogram further shows that other closely related proteins include the bacterial H+-galactose and H+-xylose symport ers, H+-myo-inositol symporter of Leshmania donovani (MIT) and two yeast inositol transporters (ITR1 and ITR2).
Transport activity and surface expression of HMIT and mutants
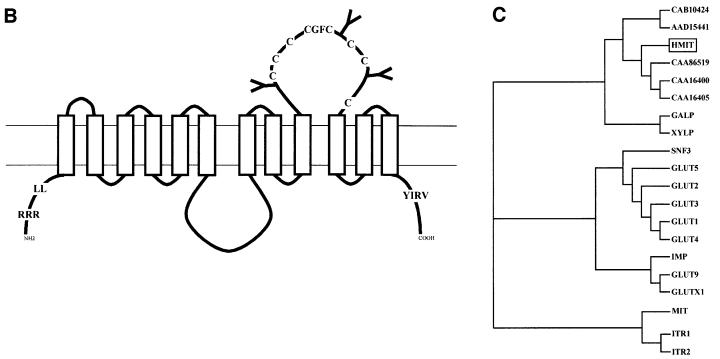
Transport activity was tested by heterologous expression in Xenopus oocytes of HMIT containing a flag epitope at its C-terminal end. The wild-type form of HMIT was not expressed at the cell surface of oocytes, as revealed by immunofluorescence microscopy (Figure 2A). Surface expression could, however, be obtained following mutation, either individually or in combination, of the two putative internalization motifs and the ER retention signal. Mutation of the ER retention signal (mutant 1: RRR4/6AAA) was not sufficient to induce cell surface expression. Mutation of the dileucine motif (mutant 2: LL22/23AA) or of the tyrosine-based motif (mutant 3: YIRV599/602AIRA) induced expression at the plasma membrane at a level similar to that of the double mutants (mut1 + 2) and (mut1 + 3) (Figure 2A). The third double mutants (mut2 + 3) showed stronger expression at the cell surface and the triple mutant (mut1 + 2 + 3) induced maximal plasma membrane expression. All mutants showed similar level of expression in the oocytes, as assessed by intracellular staining, which reflects proteins present in the ER and Golgi network. Similar results were obtained when the different mutants for HMIT were transiently expressed in HEK293T cells and analysed by immunofluorescence microscopy (data not shown).
Fig. 2. HMIT functional expression in Xenopus oocytes. (A) Immunofluorescence microscopic detection of HMIT expression in oocytes. Oocytes were injected with the RNA coding for different mutated forms of HMIT. Control oocytes were not injected. Insertion of a C-terminal flag sequence allowed immunofluorescence studies using anti-flag antibody. The different HMIT mutants are as follows: mut1, RRR4/7AAA; mut2, LL20/21AA; mut3, YIRV599/602AIRA or different combinations of these mutations. The upper images show expression at the cell surface; the lower images show staining over the oocyte interior and reflect proteins present in the ER and Golgi apparatus, and provide a control for the level of expression of each protein. (B) The same HMIT mutants were tested for the inositol uptake experiment at pH 5.0 or 7.0. Data are the mean ± SD of at least seven oocytes. Statistical significance was compared with non-injected oocytes: *p <0.02; **p <0.002.
Transport of hexoses by the oocytes injected with the various mutated forms of HMIT was tested first. As no transport activity could be detected and as HMIT presented sequence homology with inositol transporters, myo-inositol uptake was tested using a concentration of 100 µM at pH 7.0 (Figure 2B). Transport activity was closely correlated with the level of cell surface expression of HMIT. Oocytes injected with HMIT, mut1 or mut2 did not show any significant uptake activity. Uptake by the other mutants (mut3, mut1 + 2, mut1 + 3, mut2 + 3, mut1 + 2 + 3) was significant and was maximal for the triple mutant, which showed a 15-fold increase in transport activity over non-injected oocytes. Remarkably, transport activity was markedly increased by decreasing the pH of the extracellular medium from 7.0 to 5.0. Whereas HMIT- or mut1-injected oocytes still did not transport at the low pH, mutant 2 showed significant transport activity. All other mutants showed an ∼6-fold increase in uptake activity at pH 5.0 compared with pH 7.0. Maximal transport activity was produced by the triple mutant, which showed a 120-fold increase compared with non-injected oocytes. Transport activity was not altered by the insertion of the flag epitope at the C-terminal tail as the same activity was obtained in the presence or absence of this added sequence to the triple mutant. Finally, acidification-dependent myo-inositol uptake could also be demonstrated in HEK293T cells transiently expressing the triple mutant of HMIT.
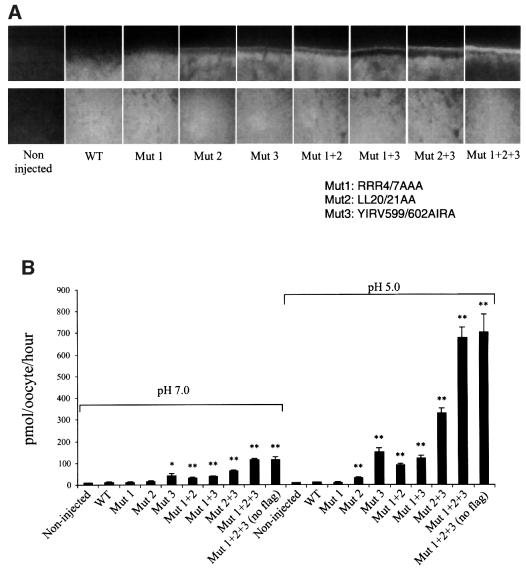
HMIT affinity for inositol was determined at different pH values using oocytes injected with the triple mutant. Kinetic studies revealed that uptake was linear during the first 45 min. For determination of the Michaelis–Menten (Km) constant, uptake experiments were performed with different concentrations of inositol and were stopped after 15 min of incubation. Analysis of the fitted curves indicated a Km for inositol of ∼100 µM, which was not dependent on the pH tested (Figure 3A); the Vmax, however, was strongly increased by decreasing the pH. Transport selectivity was then evaluated, at pH 5.0, by carrying out uptake experiments in the presence of an excess of tested substrates. Figure 3B shows that uptake of radioactive myo-inositol could be competed by a 300-fold excess of unlabelled myo-inositol. Partial competition was also obtained with an excess of scillo-, muco- and chiro-inositol, but not of allo-inositol. None of the hexoses tested (d-glucose, l-glucose, galactose, fructose, mannose, 2-deoxy-glucose, glucosamine or maltose) competed with myo-inositol transport. Transport could be inhibited ∼90% by phloretin, phlorizin or cytochalasin B; lithium chloride had no inhibitory effect.
Fig. 3. HMIT affinity and specificity for myo-inositol transport. (A) Concentration- and pH-dependence of myo-inositol uptake by oocytes injected with the triple mutant form of HMIT. Myo-inositol concentrations ranged from 25 µM to 5 mM. Data were fitted to the Michaelis–Menten equation. Each value is the mean ± SD of at least 10 oocytes. Km values for myo-inositol transport were ∼100 µM and were identical at the different pH values tested. (B) Effects of competitors and inhibitors on myo-inositol uptake in oocytes injected with the triple mutant form of HMIT. Results are expressed as a percentage of the specific myo-inositol uptake. Inositol stereoisomer concentrations were 100 µM. Competing sugars were added at a concentration of 30 mM, LiCl at 20 mM, phloretin at 300 µM, phlorizin at 5 mM and cytochalasin B at 250 µM. Each value represents the average for 6–10 oocytes.
Electrophysiology
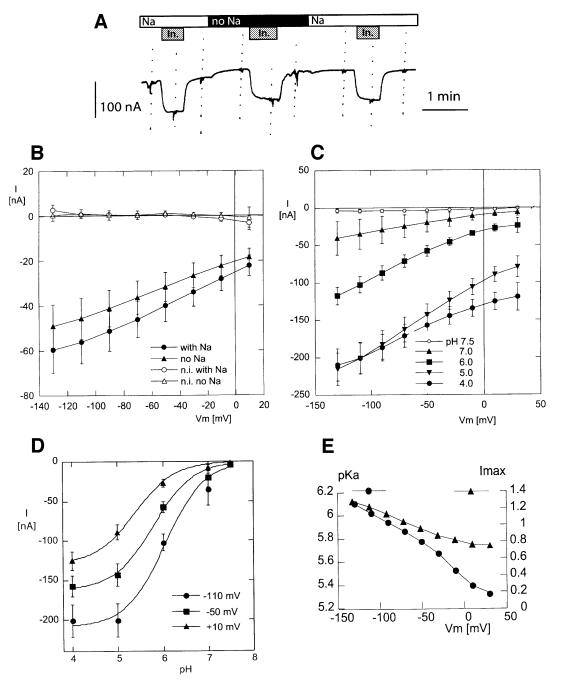
As shown in Figure 4A, application of 2 mM myo-inositol in a pH 5.0 solution induced an immediate and reversible inward current of ∼50 nA in an oocyte expressing the triple mutant form of HMIT, while it had no effect in a non-injected or water-injected oocyte.
Fig. 4. Electrophysiological analysis of HMIT transport activity. (A) Original current recording from a Xenopus oocyte expressing HMIT, at a holding potential of –50 mV, and in a pH 5.0 extracellular solution. Addition of 2 mM myo-inositol (In.) induced a reversible inward current in a Na+-containing or a nominally Na+-free solution (no Na). I–V curves were recorded before, during and after each exposure to myo-inositol. (B) I–V curves of the current induced by 2 mM myo-inositol, at pH 5.0, in non-injected oocytes (open symbols, n = 5) and in oocytes expressing HMIT (closed symbols, n = 18). Currents were recorded in Na+-containing solution (circles) and in nominally Na+-free solutions (triangles). In non-injected oocytes, myo-inositol had no significant effect on the holding current at any membrane potential. In oocytes expressing HMIT, an inward current was activated by myo-inositol; the amplitude of this current was slightly (∼15%) smaller in the nominal absence of Na+ that in the presence of 100 mM Na+. (C) I–V curves of the current induced by 2 mM myo-inositol, at pH ranging from 4.0 to 7.5 in oocytes expressing HMIT (n = 7). At all membrane potentials, the amplitude of the current induced by 2 mM myo-inositol increased from practically 0 at pH 7.5 to a maximum at pH 4.0. At high negative membrane potential, there was no increase between pH 5.0 and 4.0, indicating saturation. (D) Quantification of the pH dependence of inositol transport. The best fitting Imax and pKa were obtained by fitting the following equation to the inositol-induced current (Iin) at each potential, using the non-linear fit routine of the Kaleidagraph® program (Synergy Software, Reading, PA): Iin = Imax/10(pH – pKa). Examples of fits are presented for the –110, –50 and 10 mV membrane potentials. (E) The pKa and the Imax calculated for each membrane potential, from the mean current values at the five pH values tested. Both the maximal current and the apparent pKa were voltage sensitive (large maximal currents and lower pKa at negative potentials), with a steeper slope for pKa.
A number of small neutral organic molecules are imported into the cell by means of Na-coupled co-transport systems, such as the Na+–glucose co-transporter [the SGLT family (Hediger and Rhoads, 1994)] or the Na+–myo-inositol co-transporter (Kwon et al., 1992). We tested for a possible Na+ dependence of the current induced by myo-inositol in oocytes expressing the triple mutant form of HMIT by comparing the effect of 2 mM myo-inositol in the presence of and in the nominal absence of extracellular Na+ at pH 5.0. As shown in Figure 4B, no significant myo-inositol-induced current could be detected in non-injected oocytes, while large inward currents were induced in oocytes expressing the triple mutant form of HMIT both in the presence and absence of Na+. Even though the myo-inositol-induced currents were slightly smaller in the absence of extracellular Na+, the difference was small and showed a clearly different behaviour from the Na+–myo-inositol co-transporter (Kwon et al., 1992).
The current–voltage (I–V) relationship of the myo-inositol-induced current and its pH dependence are shown in Figure 4C. Hardly any myo-inositol-induced current could be detected at pH 7.5, while significant inward currents could be recorded at all lower pH values. There was an increase in current amplitude with lower pH at all potential, but saturation was reached with a pH lower than 5.0 at high negative membrane potential. Fitting the current data to a titration curve at each potential indicated that both the maximal current (Imax) and the apparent pKa were voltage dependent, as indicated in Figure 4D and E. The apparent pKa ranged from ∼6.1 at –130 mV to ∼5.3 at positive membrane potentials. The voltage dependence of the pKa indicated that the proton-binding site is located in the membrane electrical field. An electrical distance of 0.30 can be calculated from the voltage dependence (197 mV/pH unit).
Intracellular pH measurements
In order to verify that protons are co-transported with myo-inositol, we evaluated whether transport would lead to intracellular acidification. In the first series of experiments, oocytes expressing HMIT were exposed to a pH 5.5 solution in the presence or absence of 2 mM myo-inositol, and intracellular acidification was measured using pH-sensitive microelectrodes. Figure 5A shows a significant myo-inositol-dependent decrease in intracellular pH (pHi) from 7.57 to 7.37 in HMIT-expressing oocytes. No intracellular acidification could be measured in the same conditions in non-injected oocytes.
Fig. 5. Uptake of myo-inositol induces intracellular acidification. (A) Measurement of intracellular pH in oocytes injected (HMIT) or not (N.I.) with the mRNA for the triple mutant form of HMIT. Oocytes were exposed to a pH 5.5 solution with or without 2 mM myo-inositol prior to pHi measurements. Data are the mean ± SE of at least 11 oocytes. The difference in pHi between HMIT-injected oocytes in the presence and absence of myo-inositol is statistically significant with p <0.002. (B) Intracellular acidification of HEK293T cells expressing HMIT. Cells were exposed to different bath solutions at the indicated pH, and intracellular BCECF fluorescence was recorded. Perifusion of the cells with 2 mM myo-inositol for 2 min (box) induces their acidification. (C) pH dependence of myo-inositol-induced intracellular acidification. NT, non-transfected HEK293T cells; HMIT, HEK293T cells transiently transfected with the HMIT triple mutant.
In a second series of tests, acidification of HEK293T transiently transfected with the HMIT triple mutant cDNA was measured by recording the fluorescence of the pH-sensitive dye BCECF-AM [2′,7′-bis(carboxyethyl)-5,6-carboxyfluorescein]. Cells were incubated in solutions fixed at different pH and perfused with the same solution containing 2 mM myo-inositol. Significant acidification, as measured by the fluorescence excitation ratios, was obtained after application of inositol on transfected cells at all pH values tested and was inversely proportional to the pH of the bath solution (Figure 5B). As shown in Figure 5C, no acidification was observed for non-transfected cells whereas myo-inositol-dependent cellular acidification was dependent on a decrease in extracellular pH for cells expressing HMIT.
HMIT mRNA and protein analysis
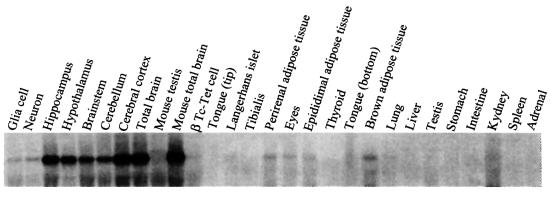
Analysis of HMIT mRNA expression in different rat tissues was performed by northern blot analysis. Figure 6 shows that the 4.5 kb HMIT transcript was expressed predominantly in the brain, with high expression found in cerebral cortex, hippocampus, hypothalamus, cerebellum and brainstem. HMIT was detected in RNA prepared from primary cultures of neuronal or glial cells. A low level of expression was detected in white, brown and epididymal adipose tissues, and in kidney.
Fig. 6. Tissue distribution of HMIT. Northern blot of total RNA from adult rat and mouse tissues. Ten micrograms of total RNA were loaded in each lane. Hybridization with a HMIT cDNA probe reveals a single 4.5 kb transcript, which was at highest abundance in different brain regions. All tissues are of rat origin, except for the mouse total brain lane and for βTc-Tet cells, which are of mouse origin.
HMIT expressed in reticulocyte lysates migrates as a 67 kDa protein, exactly at the calculated size of the protein. In the presence of microsomal membranes, the migration is shifted to an apparent size of 76 kDa, compatible with the addition of three N-linked oligosaccharide side chains. This size is the same as that of HMIT expressed in oocytes (Figure 7A). HMIT expressed transiently in HEK293 cells or in brain membranes was identified by western blot analysis using affinity-purified polyclonal rabbit and chicken antibodies raised against the C-terminal cytoplasmic end of the protein (Figure 7B). In membrane protein fractions of HEK293 cells, HMIT migrates as two bands, one centred on 83 kDa and one with an apparent mol. wt of 66–69 kDa. The upper band could be completely converted into the lower 66–69 kDa band upon peptide N-glycosidase F (PNGaseF) deglycosylation. In the brain membrane, only the high molecular weight band was observed, which could be converted into the fast migrating band upon PNGaseF treatment.
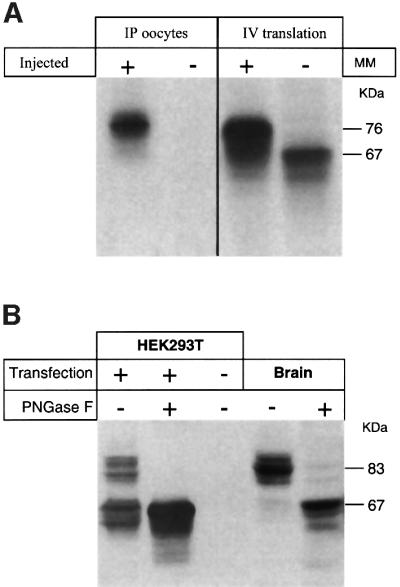
Fig. 7. Characterization of HMIT protein. (A) Left: immuno precipitation of HMIT expressed in oocytes using anti-Flag antibodies; (+) injected oocytes, (–) non-injected oocytes. Right: immunoprecipitation of HMIT synthesized from synthetic RNA in a rabbit reticulocyte lysate in the presence (+) or absence (–) of canine pancreas microsomal membranes. (B) Western blot analysis of HMIT present in membrane proteins from transiently transfected (+) or mock-transfected (–) HEK293T, or in membrane preparations from adultrat brain (Brain), using an anti-HMIT rabbit polyclonal antibody. Membrane proteins were subjected (+) or not (–) to PNGase F treatment prior to electrophoretic separation.
Immunolocalization of HMIT
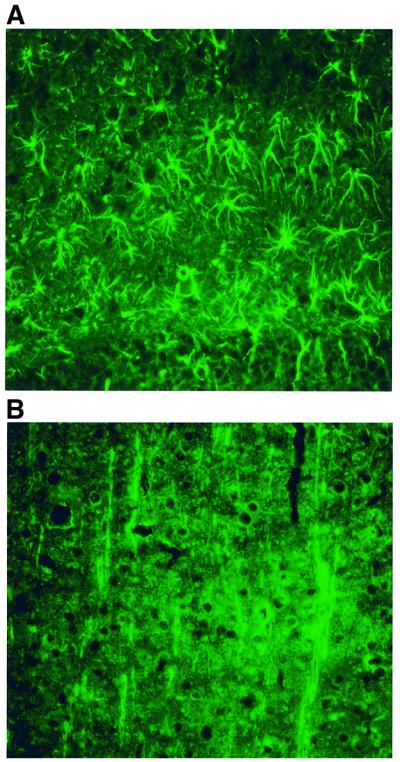
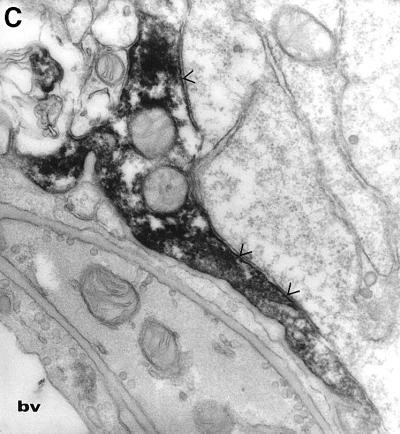
Immunofluorescence microscopy using affinity-purified antibodies was used to study HMIT brain localization. Figure 8A and B shows immunofluorescence microscopy localization of HMIT in astrocytes of the hippocampus and in neurons of the cortex. Subcellular localization of HMIT was finally assessed by immunoelectron microscopy. Expression of the co-transporter in an astrocytic glial endfoot is presented in Figure 8C, and shows staining present inside the cell and also with the plasma membrane.
Fig. 8. Immunolocalization of HMIT in the brain. (A) Immunostaining of astrocytes in the hippoccampus. (B) Immunodetection of HMIT in neurons of the cortex. (C) Immunoelectron microscopy detection of HMIT in an astrocytic endfoot near a blood vessel. Staining is both intracellular and associated with the plasma membrane (arrowheads). Magnification: 31 500×.
Discussion
Here we report the cloning and functional characterization of a novel HMIT. We show that this 12 TM domain transporter has unique structural characteristics and that it is mainly expressed in the brain, both in astrocytes and neurons. This suggests a participation in the control of several inositol-dependent mechanisms, including protection against osmotic shock, signalling pathways, vesicle endocytosis and exocytosis.
HMIT has the same membrane topology as the glucose transporters GLUT1-5 and GLUTX1, and motifs described to be important for glucose transport activity are conserved. These include the GRR/K and EX6R/K motifs, which are found duplicated in the GLUTs, the QLS motif of TM7 and the tryptophan residues 388 and 412 (position within the GLUT1 sequence), which are present in the cytochalasin B binding site. Despite the presence of these sequences, no glucose transport activity could be demonstrated. Because HMIT presented sequence homologies with inositol transporters found in other species, transport of this substrate was evaluated. A very efficient myo-inositol uptake activity could be measured, which was stimulated by acidic pH. This acid-dependent activation was a result of an increase in Vmax, with no change in the affinity for myo-inositol, which was ∼100 µM at all pH values tested. This value is near the myo-inositol extracellular space concentration, which is 200–400 µM in the brain and 60–80 µM in the blood (Sherman et al., 1968; Cicero and Sherman, 1973; Spector, 1976). Electro physiological studies and intracellular pH recordings showed that HMIT myo-inositol transport was electrogenic and coupled to proton. Affinity of the transporter for the proton was given by the pKa value, which is voltage dependent as it ranged from ∼6.1 at –130 mV to ∼5.3 at positive membrane potentials. The inward current was not reversed in an outward current even at positive potentials. Finally, HMIT transported myo-inositol and, to a lower extent, other inositol stereoisomers, as seen in competition uptake experiments. No competition could be detected with any of the hexoses tested, but transport could be inhibited by cytochalasin B and phloretin. HMIT is, thus, the first mammalian symporter that couples protons and myo-inositol.
One new structural feature of HMIT is the long extracellular loop between TM9 and TM10, which contains three N-glycosylation sites. Database screening with HMIT sequence shows that the closest relatives are proteins of unknown functions expressed by C.elegans or A.thaliana. These proteins and five other ESTs from plants also have this extracellular loop, which contains eight conserved cysteine residues, a CGFC motif and 2–4 N-glycosylation sites. This suggests that the structure of this loop may be important for transport activity or may have a role in recognition of a protein activity modulator.
HMIT contains several sequence signals involved in intracellular localization of membrane proteins. An ER retention signal, RRR, is present at position 4–6, a dileucine internalization motif at position 22–23 and a tyrosine-based endocytosis motif at position 610–613. We showed by immunofluorescence microscopy and transport activity that mutation of at least one of the two internalization motifs was necessary for surface expression; the C-terminal YIRV motif being apparently more effective in intracellular retention of HMIT than the dileucine motif, as judged by the uptake activity of the single mutated forms. Mutation of both internalization signals led to a greater surface expression and uptake activity as compared with the single mutants. Mutation of the ER retention signal by itself did not lead to surface expression, but in the context of mutation of the individual or both internalization signals, it led to an increase in surface expression and transport activity. As surface expression is increased by mutation of the internalization signals, this indicates that the ER retention signal is partly leaky and allows HMIT surface expression, but probably at a low rate. These mutational analyses of surface expression and transport activity, therefore, point to a complex regulation of HMIT surface expression. In particular, the existence of an ER retention signal similar to that described for the SUR1 and Kir6.2 subunits of the KATP channel (Zerangue et al., 1999), and which requires subunit heterodimerization for the complex to exit the ER, suggests that surface expression of HMIT may also be controlled by oligomerization with another auxiliary protein.
HMIT is expressed in a majority of astrocytes and some neurons. The physiological relevance of a H+-myo-inositol transporter is not established at the present time. Its restricted tissue and cellular distribution, however, argues in favour of specific functions related to myo-inositol metabolism in the brain. Even if pHi measurements in HEK293T expressing HMIT showed significant activity of the transporter at pH 7.4, the pH dependence of HMIT activity suggests that it may be activated by acidification of the extracellular milieu consequent to synaptic activity (Chesler and Kaila, 1992). Production, by glial cells, of lactate, which serves as an energy source for neurons, is also accompanied by extracellular acidification. Acid-sensitive ion channels, involved in nociception and taste detection, have been characterized (Bassilana et al., 1997; Waldmann et al., 1997; Babinski et al., 2000). These are also widely distributed in different brain regions, thereby indicating that local changes in pH, in particular acidification resulting from local brain activity, may act as a regulatory mechanism.
Until now, myo-inositol transport studies in mammalian cells have been focused on the sodium-dependent process involving SMIT. Although both HMIT and SMIT transport inositol, they do not share any amino acid sequence homology. Transporting myo-inositol from extracellular to intracellular compartments requires an active process, as the millimolar level of myo-inositol in most mammalian cells or tissues is 50- to 1000-fold higher than the micromolar concentrations in extracellular fluid (Sherman et al., 1968; Cicero and Sherman, 1973). The existence of two different symporters, depending on different cations, is surprising. It is interesting to note, however, that SMIT is progressively inhibited by decreasing pH values and that it is inactive at the acidic values (Matskevitch et al., 1998) where HMIT is maximally active. Initial data suggest that there is only partial co-localization of HMIT and SMIT in the brain. This, therefore, suggests that depending on the osmolarity and pH conditions, uptake of inositol will be differentially regulated in different cell types.
The present study characterizes a novel type of mammalian transporter, which couples H+ gradients to the co-transport of myo-inositol. This transporter is highly enriched in brain, mostly astrocytes and some neurons. Its intracellular and plasma membrane expression suggest a complex regulation of subcellular localization. Finally, identification of this pH-dependent transporter describes an additional mechanism controlling myo-inositol metabolism in the brain, and points to an important role of this transporter in physiological processes.
Materials and methods
Cloning of HMIT
The sequence of GlutX1 (AJ245935) was used to screen the EST database at NCBI using TBLASTN. Primers specific for EST AI576033 were used to amplify one part of the 5′ region corresponding to positions 303–600 of the HMIT cDNA by RT–PCR from rat spleen total RNA. The amplified cDNA was cloned using the TOPO cloning system (Invitrogen Corp.). To obtain the full-length cDNA of HMIT, a λZAP II (Stratagene) cDNA library from rat hypothalamus RNA was screened using the amplified (303–600) region as probe. Lifting of the phage colonies, radiolabelling of the probe and hybridization were performed using standard protocols. Human HMIT cDNA was obtained similarly, but using a λZAP II human cDNA library from frontal cortex (Stratagene).
HMIT mutants
The different mutations of HMIT (RRR4/7AAA, LL20/21AA, YIRV599/602AIRA) and the insertion of the Flag (DYKDDDDK) N-terminal were generated by PCR using modified 5′ and 3′ primers. The presence of the mutations and the Flag was verified by DNA sequencing. The resulting mutated forms were cloned in PSD5. Sequence analysis was carried out using programs from the Genetics Computer Group program suite and the Clustal_X program.
Microinjection and inositol uptake
Stage V–VI Xenopus oocytes were microinjected with 15–20 ng of capped RNA in a total volume of 50 nl of H2O, prepared from HMIT cDNA [wild type (WT) and different mutated forms] cloned into PSD5, as described (Geering et al., 1996). Transport measurements were performed 3 days after injection with groups of 8–12 oocytes incubated in the presence of 10 µCi of myo-[2-3H]inositol (NEN Life Science) and cold myo-inositol at a final concentration of 50 µM for 45 min at room temperature. For determination of the Michaelis–Menten constant, oocytes were incubated in the presence of the different 3H-myo-inositol concentrations (from 50 µM to 5 mM) for 15 min. Oocytes were then washed with MBS [85 mM NaCl, 1 mM KCl, 2.4 mM NaHCO3, 1 mM MgSO4, 0.33 mM Ca(NO3)2, 0.55 mM CaCl2, 4 mM HEPES] 1 mM HgCl2 at 4°C. Individual oocytes were then dissolved individually in 5% SDS and counted.
Immunoprecipitation
Injected oocytes were incubated in MBS containing 0.5 mCi/ml [35S]methionine (Hartmann Analytic) for 24 h at 19°C, and then subjected to a chase period of 48 h in the presence of 10 mM cold methionine. For membrane preparation, oocytes were first homogenized by pipeting using a Pasteur pipette and membranes were recovered by a two step centrifugation; protein content was determined by Lowry quantification as described (Geering et al., 1996). For immunoprecipitation of HMIT-flag under non-denaturating conditions, plasma membranes were diluted in a digitonin buffer [final concentration: 100 mM NaCl, 20 mM Tris, 2 mM EDTA, 0.2% digitonin, 2% bovine serum albumin (BSA), 2 mM phenylmethylsulfonyl fluoride (PMSF) pH 7.4] containing 10 µl of pre-immune serum in a total volume of 460 µl. Pansorbin [20 µl; 10% of cell suspension in phosphate-buffered saline (PBS) (Calbiochem)] was then added before shaking for 30 min at 4°C. Pansorbin was removed by brief centrifugation and the supernatant was incubated at 4°C for 12 h with monoclonal Flag antibody (clone M2; Sigma) at a final concentration of 5 µg/ml. Protein G–agarose (5 µl) was then added before shaking at 4°C for 1 h. Beads of protein G–agarose were recovered by brief centrifugation and resuspended in 70 µl of sample buffer. These products were separated by SDS–PAGE, and labelled proteins were detected by autoradiography.
Electrophysiology
Electrophysiological experiments were performed 2–3 days after cRNA injection. Oocytes expressing HMIT were studied under voltage-clamp conditions using the two-electrode voltage-clamp technique by means of a Dagan TEV voltage-clamp apparatus (Dagan Corp.), at room temperature (22–25°C), in the following solution (in mM): NaCl 80, KCl 1.0, MgCl2 0.82, CaCl2 0.41, N-methyl-d-glucamine (NMDG) HEPES 10.0 and MES 10.0. Na-free solutions were prepared by replacement of NaCl NMDG Cl. Solutions of various pH (7.5, 7.0, 6.0, 5.0, 4.0) were obtained by titration with HCl or NMDG base. The current signal was filtered at 20 Hz using the internal filter of the Dagan apparatus, and continuously recorded on a paper chart. I–V curves were obtained by a series of 500 ms voltage steps ranging from –130 to +30 mV, starting from a holding potential of –50 mV using pCLAMP (Axon Instruments). The Iin was calculated by subtracting the mean of the current values recorded in the absence of myo-inositol recorded before and after inositol application from the current recorded in the presence of 2 mM myo-inositol.
pHi measurements in Xenopus oocytes
pH-sensitive microelectrodes (with a resistance of 2–5 GΩ) were prepared as described (Wang and Horisberger, 1995). They were calibrated in HEPES-buffered pH 6.5 and 7.5 solutions immediately before and after each intracellular pH measurement. Intracellular pHi was calculated from the voltage read with the pH microelectrode minus the membrane voltage read from a conventional microelectrode filled with 3 M KCl. Intracellular pH was measured in oocytes injected with HMIT cRNA (or non-injected) after a 45–75 min exposure to a pH 5.5 solution similar to that used for the flux measurements with (or without) 2 mM myo-inositol.
Measurements of pHi on HEK293T cells
Experiments were carried out on the stage of an inverted epifluorescence microscope, as described previously (Chatton et al., 2000). Fluorescence excitation wavelengths were selected using a holographic monochromator (Polychrome II; Till Photonics) and fluorescence was detected using a 12-bit cooled CCD camera (Micromax; Princeton Instruments). Acquisition of images, as well as the time series, was computer controlled using the software Metafluor (Universal Imaging). The acquisition rate of ratio images was varied between 0.5 and 0.1 Hz. Once loaded with dye, cells were placed in a perfusion chamber designed for rapid exchange of perfusion solutions. Measurement of pHi has been described previously (Tokuyasu, 1978; Chatton et al., 1997). Briefly, pHi was measured in groups of ∼10–30 HEK293 cells on glass coverslips after loading the cells with the pH-sensitive fluorescent dye BCECF-AM (Teflabs). Cell loading was performed at room temperature for 10 min using 1.5 µM BCECF-AM in a HEPES-buffered balanced solution [160 mM NaCl, 5.4 mM KCl, 1.3 mM CaCl2, 0.8 mM MgSO4, 0.78 mM NaH2PO4, 20 mM HEPES, 5 mM glucose, bubbled with air (this saline was supplemented with 1% BSA albumin for dye loading)]. Fluorescence excitation was at 455 and 480 nm, with detection through a 535 nm bandwidth interference filter. Fluorescence excitation ratios (F480 nm/F455 nm) were computed for each image pixel and produced ratio images of cells that were proportional to pHi. In situ calibration was performed after each experiment using the nigericin technique (Thomas, 1984): cells were sequentially perfused with high-K+ calibration solutions at pH 6.6, 7.1, 7.4 and 7.9 supplemented with 5–8 µM nigericin while BCECF ratios were measured. A calibration curve was then generated to convert ratio values into pHi values for each group of cells under study.
Northern blotting
Total RNAs (10 µg) extracted (Chomczynski and Sacchi, 1987) from various mouse tissues were run on a 1% denaturing formaldehyde– agarose gel and blotted onto nylon membranes (Genescreen, NEN Life Science). Membranes were hybridized with random-primed 32P-labelled probes for HMIT.
HMIT antibodies
For preparation of the antibody against the C-terminal region of HMIT, a segment of the rat cDNA HMIT sequence encoding the C-terminal hydrophilic region (amino acids 577–618) was amplified by PCR and subcloned into the BamHI site of pGEX-4T-1 (Pharmacia Biotech) for generation of a HMIT gluthathione S-transferase fusion protein. This fusion protein was used for immunization of rabbits and chicken as described previously (Widmann et al., 1995). Affinity purification of the antibodies was performed on immobilized fusion proteins consisting of maltose-binding protein fused to the C-terminal region of HMIT used for immunization.
HMIT protein analysis
For the in vitro translation, capped RNA from HMIT WT (see above on microinjection and inositol uptake) was in vitro translated in rabbit reticulocyte lysate in the presence or absence of canine microsomal membranes (Promega) and [35S]methionine (NEN Life Science Products). Products were separated on 10% polyacrylamide gels and detected by autoradiography.
For the western blotting, membrane from transient transfected HEK293T cells with HMIT was prepared as described (Ibberson et al., 2000). Brain membranes were obtained by centrifugation of brain homogenate at 95 000 g for 60 min onto a 41% sucrose solution. The resulting interface was resuspend in homogenization buffer [10 mM Tris–HCl pH 7.5, 30 mM NaCl, 5 mM dithiothreitol (DTT), 5 mM PMSF, 10 µg/ml aprotinin] and centrifuged at 40 000 g for 30 min. The pellets were then resuspended in PBS, 1 mM PMSF and protein concentration was determined using BCA protein assay. Western blotting was performed using specific rabbit affinity-purified antibodies following a previously published procedure (Widmann et al., 1995; Ibberson et al., 2000). PNGase F (New England Biolab) digestions were performed according to the manufacturer’s protocol.
Immunofluorescence and immunoelectron microscopy
Rat tissues were perfusion fixed via the left ventricle with a paraformaldehyde–lysine–periodate (PLP) fixative as described (Brown et al., 1987). After 10 min perfusion, brain was excised and fixed overnight by immersion at 4°C in the same fixative, and then another 12 h in a PBS, 20% sucrose solution. The tissue was frozen in OCT medium (Miles) and cryostat sections of 8 µm thickness cut. Tissue sections were incubated for 10 min in PBS, 1% BSA, then for 1 h with the first antibody (affinity-purified anti-C-terminal peptide antibody, 7 µg/ml in PBS, 1% BSA). After incubation, the sections were washed three times for 5 min each with PBS, and then incubated for 45 min with a 1:100 dilution (in PBS, 1% BSA) of fluoresceinated goat anti-rabbit immunoglobulin antibody (Calbiochem) or CY3-conjugated goat anti-rabbit antibody (Jackson ImmunoResearch). The sections were finally washed three times for 5 min in PBS and mounted in 60% glycerol, 2% n-propyl gallate, 0.2 M Tris–HCl pH 8.0.
For the immunofluorescence analysis on oocytes, groups of 8–12 oocytes were fixed by simple immersion at 4°C in the PLP solution. The same procedure used for tissues was then performed, except for the antibody used. The first antibody was the monoclonal flag antibody (clone M2; Sigma) used at 1:500 dilution. The second antibody was the fluoresceinated goat anti-mouse antibody (Calbiochem).
For immunoelectron detection of HMIT, sagittal sections of 50 µm thickness were incubated first with 3% fetal calf serum (FCS), 0.05% Tween-20 in PBS to block non-specific binding, followed by incubations with the polyclonal anti-HMIT antibody and peroxidase-conjugated secondary antibody. The immunoreaction was developed with diaminobenzidine tetrahydrochloride and observed under a light microscope (Zagon et al., 1986). Pieces of selected brain areas, such as the hypothalamus, were cut out and post-fixed in a solution containing equal amounts of 2% (v/v) osmium in water and 3% potassium ferrocyanide in phosphate buffer for 30 min. After dehydration in alcohol and propylene oxide, pieces were embedded in Epon. Thin sections (70 nm thick) were cut with an ultramicrotome (Ultracut E; Reichert Jung) and placed on a copper grid. Sections were contrasted with lead citrate for 3 min and observed under a Zeiss EM 10C electron microscope.
Acknowledgments
Acknowledgements
We thank Dr B.C.Rossier for reading the manuscript, Dr Luc Pellerin for neuron and glial cell RNA preparation, Solange Kharoubi-Hess for technical assistance with electrophysiological studies, and Irène Riederer and Claudine Pfulg for expert help with immunoelectron microscopy. This work was supported by Swiss National Science Foundation grants 31-46958.96 to B.T. and 31-53725.98 to B.M.R.
References
- Atwal J.K., Bassie,B., Miller,F.D. and Kaplan,D.R. (2000) The TrkB-Shc site signals neuronal survival and local axon growth via MEK and PI3-kinase. Neuron, 27, 265–277. [DOI] [PubMed] [Google Scholar]
- Babinski K., Catarsi,S., Biagini,G. and Séguéla,P. (2000) Mammalian ASIC2a and ASIC3 subunits co-assemble into heterotrimeric proton-gated channels sensitive of Gd3+. J. Biol. Chem., 275, 28519–28525. [DOI] [PubMed] [Google Scholar]
- Bassilana F., Champpigny,G., Waldmann,R., de Wille,J.R., Heurteaux,C. and Lazdunski,M. (1997) The acid-sensitive ionic channel subunit ASIC and the mammalian degenerin MDEG form a heteromultimeric H+-gated Na+ channel with novel properties. J. Biol. Chem., 272, 28819–28822. [DOI] [PubMed] [Google Scholar]
- Berridge M.J., Downes,C.P. and Hanley,M.R. (1989) Neural and developmental actions of lithium: a unifying hypothesis. Cell, 59, 411–419. [DOI] [PubMed] [Google Scholar]
- Berry G.T., Wang,Z.J., Dreha,S.F., Finucane,B.M. and Zimmerman,R.A. (1999) In vivo brain myo-inositol levels in children with Down syndrome. J. Pediatr., 135, 94–97. [DOI] [PubMed] [Google Scholar]
- Brown D., Gluck,S. and Hartwig,J. (1987) Structure of the novel membrane-coating material in proton-secreting epithelial cells and identification as an H+-ATPase. J. Cell Biol., 105, 1637–1648. [DOI] [PMC free article] [PubMed] [Google Scholar]
- Chatton J.-Y., Liu,H. and Stucki,J.W. (1997) Modulation of hormone-induced calcium oscillations by intracellular pH in rat hepatocytes. Am. J. Physiol., 272, G954–G961. [DOI] [PubMed] [Google Scholar]
- Chatton J.-Y., Marquet,P. and Magistretti,P.J. (2000) A quantitative analysis of l-glutamate-regulated Na+ dynamics in mouse cortical astrocytes: implications for cellular bioenergetics. Eur. J. Neurosci., 12, 3843–3853. [DOI] [PubMed] [Google Scholar]
- Cheatham B. and Kahn,C.R. (1995) Insulin action and the insulin signaling network. Endocr. Rev., 16, 117–142. [DOI] [PubMed] [Google Scholar]
- Chesler M. and Kaila,K. (1992) Modulation of pH by neuronal activity. Trends Neurosci., 15, 396–402. [DOI] [PubMed] [Google Scholar]
- Chomczynski P. and Sacchi,N. (1987) Single-step method of RNA isolation by acid guanidinium thiocyanate–phenol–chloroform extraction. Anal. Biochem., 162, 156–159. [DOI] [PubMed] [Google Scholar]
- Cicero T.J. and Sherman,W.R. (1973) A sensitive and specific method for the measurement of monophosphoinositide at a microregional level in brain. Anal. Biochem., 54, 32–39. [DOI] [PubMed] [Google Scholar]
- Cremona O. et al. (1999) Essential role of phosphoinositide metabolism in synaptic vesicle recycling. Cell, 99, 179–188. [DOI] [PubMed] [Google Scholar]
- Gaidarov I., Chen,Q., Falck,J.R., Reddy,K.K. and Keen,J.H. (1996) A functional phosphatidylinositol 3,4,5-trisphosphate/phosphoinositide binding domain in the clathrin adaptor AP-2 γ subunit. J. Biol. Chem., 271, 20922–20929. [DOI] [PubMed] [Google Scholar]
- Geering K., Beggah,A., Good,P., Girardet,S., Roy,S., Schaer,D. and Jaunin,P. (1996) Oligomerization and maturation of Na, K-ATPase: functional interaction of the cytoplasmic NH2 terminus of the β subunit with the α subunit. J. Cell Biol., 133, 1193–1204. [DOI] [PMC free article] [PubMed] [Google Scholar]
- Hediger M.A. and Rhoads,D.B. (1994) Molecular physiology of sodium–glucose cotransporters. Physiol. Rev., 74, 993–1026. [DOI] [PubMed] [Google Scholar]
- Ibberson M., Uldry,M. and Thorens,B. (2000) GLUTX1, a novel mammalian glucose transporter expressed in the central nervous system and insulin-sensitive tissues. J. Biol. Chem., 275, 4607–4612. [DOI] [PubMed] [Google Scholar]
- Irvine R. (1998) Inositol phospholipids: translocation, translocation, translocation. Curr. Biol., 8, R557–R559. [DOI] [PubMed] [Google Scholar]
- Jost M., Simpson,F., Kavran,J.M., Lemmon,M.A. and Schmid,S.L. (1998) Phosphatidylinositol-4,5-bisphosphate is required for endocytic coated vesicle formation. Curr. Biol., 8, 1399–1402. [DOI] [PubMed] [Google Scholar]
- Kaplan D.R. and Miller,F.D. (2000) Neurotrophin signal transduction in the nervous system. Curr. Opin. Neurobiol., 10, 381–391. [DOI] [PubMed] [Google Scholar]
- Kwon H.M., Yamauchi,A., Uchida,S., Preston,A.S., Garcia-Perez,A., Burg,M.B. and Handler,J.S. (1992) Cloning of the cDNA for a Na+/myo-inositol cotransporter, a hypertonicity stress protein. J. Biol. Chem., 267, 6297–6301. [PubMed] [Google Scholar]
- Leevers S.J., Vanhaesebroeck,B. and Waterfield,M.D. (1999) Signalling through phosphoinositide 3-kinases: the lipids take centre stage. Curr. Opin. Cell Biol., 11, 219–225. [DOI] [PubMed] [Google Scholar]
- Matskevitch J., Wagner,C.A., Risler,T., Kwon,H.M., Handler,J.S., Waldegger,S., Busch,A.E. and Lang,F. (1998) Effect of extracellular pH on the myo-inositol transporter SMIT expressed in Xenopus oocytes. Pflugers Arch., 436, 854–857. [DOI] [PubMed] [Google Scholar]
- Mehrotra B., Myszka,D.G. and Prestwich,G.D. (2000) Binding kinetics and ligand specificity for the interactions of the C2B domain of synaptotagmin II with inositol polyphosphates and phosphoinositides. Biochemistry, 39, 9679–9686. [DOI] [PubMed] [Google Scholar]
- Miyakawa H., Woo,S.K., Dahl,S.C., Handler,J.S. and Kwon,H.M. (1999) Tonicity-responsive enhancer binding protein, a Rel-like protein that stimulates transcription in response to hypertonicity. Proc. Natl Acad. Sci. USA, 96, 2538–2542. [DOI] [PMC free article] [PubMed] [Google Scholar]
- Ohara-Imaizumi M., Fukuda,M., Niinobe,M., Misonou,H., Ikeda,K., Murakami,T., Kawasaki,M., Mikoshiba,K. and Kumakura,K. (1997) Distinct roles of C2A and C2B domains of synaptotagmin in the regulation of exocytosis in adrenal chromaffin cells. Proc. Natl Acad. Sci. USA, 94, 287–291. [DOI] [PMC free article] [PubMed] [Google Scholar]
- Rapoport I., Miyazaki,M., Boll,W., Duckworth,B., Cantley,L.C., Shoelson,S. and Kirchhausen,T. (1997) Regulatory interactions in the recognition of endocytic sorting signals by AP-2 complexes. EMBO J., 16, 2240–2250. [DOI] [PMC free article] [PubMed] [Google Scholar]
- Schiavo G., Gmachi,M.J.S., Stenbeck,G., Söllner,T.H. and Rothman,J.E. (1995) A possible docking and fusion particle for synaptic transmission. Nature, 378, 733–736. [DOI] [PubMed] [Google Scholar]
- Sherman W.R., Stewart,M.A., Kurien,M.M. and Goodwin,S.L. (1968) The measurement of myo-inositol, myo-inosose-2 and scyllo-inositol in mammalian tissues. Biochim. Biophys. Acta, 158, 197–205. [DOI] [PubMed] [Google Scholar]
- Shetty H.U., Schapiro,M.B., Holloway,H.W. and Rapoport,S.I. (1995) Polyol profiles in Down syndrome. Myo-inositol, specifically, is elevated in the cerebrospinal fluid. J. Clin. Invest., 95, 542–546. [DOI] [PMC free article] [PubMed] [Google Scholar]
- Simonsen A. et al. (1998) EEA 1 links PI(3)K function to Rab5 regulation of endosome fusion. Nature, 394, 494–498. [DOI] [PubMed] [Google Scholar]
- Spector R. (1976) The specificity and sulphydryl sensitivity of the inositol transport system in the central nervous system. J. Neurochem., 27, 229–236. [DOI] [PubMed] [Google Scholar]
- Thomas R.C. (1984) Experimental displacement of intracellular pH and the mechanism of its subsequent recovery. J. Physiol. (London), 354, 3P–22P. [DOI] [PMC free article] [PubMed] [Google Scholar]
- Tokuyasu K. (1978) A study of positive staining of ultrathin frozen sections. J. Ultrastruct. Res., 63, 287–307. [DOI] [PubMed] [Google Scholar]
- Waldmann R., Champigny,G., Bassilana,F., Heurteux,C. and Lazdunski,M. (1997) A proton-gated cation channel involved in acid-sensing. Nature, 386, 173–177. [DOI] [PubMed] [Google Scholar]
- Wang X. and Horisberger,J.-D. (1995) A conformation of the Na,K-pump is permeable to proton. Am. J. Physiol., 268, C590–C595. [DOI] [PubMed] [Google Scholar]
- Widmann C., Dolci,W. and Thorens,B. (1995) Agonist-induced internalization and recycling of the glucagon-like peptide-1 receptor in transfected fibroblast and in insulinomas. Biochem. J., 310, 203–214. [DOI] [PMC free article] [PubMed] [Google Scholar]
- Williams R.S.B. and Harwood,A.J. (2000) Lithium therapy and signal transduction. Trends Plant Sci., 21, 61–64. [DOI] [PubMed] [Google Scholar]
- Zagon I.S., Higbee,R., Riederer,B.M. and Goodman,S.R. (1986) Spectrin subtypes in mammalian brain: an immunoelectron microscopic study. J. Neurosci., 6, 2977–2986. [DOI] [PMC free article] [PubMed] [Google Scholar]
- Zerangue N., Schwappach,B., Jan,Y.N. and Jan,L.Y. (1999) A new ER trafficking signal regulates the subunit stoichiometry of plasma membrane KATP channels. Neuron, 22, 537–548. [DOI] [PubMed] [Google Scholar]


