

Abstract
Lipid nanoparticles (LNPs) effectively protect mRNA and facilitate its entry into target cells for protein synthesis. Despite these successes, cellular entry alone may not be enough for optimal protein expression, as mRNA translation also depends on the availability of essential metabolites, including metabolic energy sources, coenzymes, and amino acids. Without adequate metabolites, mRNA translation may be less efficient, potentially leading to higher dosing requirements or poorer therapeutic outcomes for LNP therapies. To address this, we develop a metabolite co-delivery strategy by encapsulating essential metabolites within mRNA LNPs, hypothesizing that our approach can uniformly improve mRNA delivery. Instead of adding a fifth component to the organic phase, our strategy involves mixing the metabolite with the mRNA payload in the aqueous phase, while maintaining the molar ratio of the components in the organic phase during LNP formulation. We verify our approach in vitro and in vivo, highlighting the broad applicability of our strategy through mechanism and efficacy studies across multiple cell lines, and physiological conditions, such as normoxia (i.e., 21% oxygen), hypoxia (i.e., 1% oxygen), and in mice. Taken collectively, we anticipate that our metabolite co-delivery strategy may serve as a generalizable strategy to enhance in vitro and in vivo protein expression using mRNA LNPs, potentially offering broad applicability for the study and treatment of disease.
Keywords: mRNA Delivery, lipid nanoparticles, metabolites, hypoxia, co-delivery strategy
Graphical Abstract
INTRODUCTION
Messenger RNA (mRNA)-based therapy has been developed as a powerful treatment in modern medicine, utilizing mRNA to instruct cells to produce proteins for preventing and treating diseases.1-4 Unlike therapies that involve delivering proteins or small molecules directly, mRNA-based therapy provides cells with the genetic instructions to synthesize these proteins themselves.5-11 This versatile and programmable approach makes mRNA therapeutics powerful tools for advancing personalized medicine and improving patient outcomes across diverse therapeutic areas, including protein replacement, gene editing, and vaccines, amongst other areas.12-19 Progress in the field of mRNA delivery has facilitated the development of non-viral delivery vehicles, such as polymeric nanoparticles [e.g., poly(amine-co-ester) (PACE) or poly(β-amino ester) (PBAE)-derived mRNA delivery nanocarriers], protein-based nano-carriers (e.g., cell-penetrating peptide (CPP)-mediated mRNA delivery nanocarriers), and lipid nanoparticles (LNPs), amongst others.20-25 These innovations, especially LNPs, played a critical role in the clinical therapeutic success of the Pfizer (BNT162b2) and Moderna (mRNA-1273) COVID-19 vaccines.23-25 This is largely due to the ability of nanoparticle-based systems to protect mRNAs, traverse complex biological environments, and ultimately promote the entry of mRNA therapeutics into the cytoplasm of target cells of interest.
However, cellular entry alone may not be enough for optimizing protein expression with mRNA LNP therapeutics. This is because the process of mRNA translation into protein also depends on the availability of essential metabolites, such as metabolic energy sources, coenzymes, and amino acids, amongst other components within cells.26-29 Research shows that the metabolic profile of cells can vary significantly across diseases like cancer, diabetes, and cardiovascular disease, as well as in various physiological states such as hypoxia, which can alter metabolite levels, such as ATP, within cells.30-33 Inadequate metabolite levels may impair mRNA translation and reduce protein expression.34-37 Our previous study has shown that delivering free ATP and mRNA LNPs will not increase mRNA transfection efficiency.38 Therefore, the development of strategies and materials that can co-deliver metabolites of interest alongside mRNA could improve the translation efficiency of LNPs, an approach that could potentially improve mRNA LNP therapy by maximizing mRNA-encoded protein expression at a minimal dose.
Thus, we propose a metabolite co-delivery strategy by encapsulating essential metabolites within mRNA LNPs, hypothesizing that this approach can improve mRNA delivery (Figure 1a). Our strategy involves mixing the metabolite with the mRNA payload in the aqueous phase without changing the molar ratio of the organic components when formulating LNPs. We first assessed this strategy under normoxic conditions (i.e., 21% oxygen) to evaluate its effect on protein expression, highlighting its utility. Notably, we observed that hypoxia (i.e., 1% oxygen), a state that affects cellular metabolism and is often associated with diseased cells,39-41 could reduce protein expression as compared to normoxia. Our strategy could then improve protein expression from mRNA LNPs under hypoxic conditions in cells. We then conducted mechanistic studies to explore cellular association/internalization, endocytosis mechanisms, and endosomal escape, to further understand the impact of our metabolite co-delivery strategy on the activity of mRNA LNPs. Our findings suggested that co-delivery of metabolites with mRNA LNPs increased protein expression by up to ~9-fold in vitro and ~4-fold in vivo without altering the innate biodistribution compared to analogous LNP formulations that do not contain the metabolite of interest under normoxic conditions. Additionally, our metabolite co-delivery strategy improved protein expression in hypoxic cells, enhancing it by up to ~19-fold compared to analogous LNP formulations that do not contain the metabolite of interest. Finally, our metabolite co-delivery strategy also afforded LNPs with better protein expression in vivo without causing tolerability issues, as evidenced by studies including histological evaluations, kidney and liver function blood tests, complete blood count paneling, and weight retention studies. We anticipate that our metabolite co-delivery strategy could broadly improve in vitro and in vivo mRNA-encoded protein expression by using LNPs, offering broad applicability for disease study and treatment.
Figure 1.

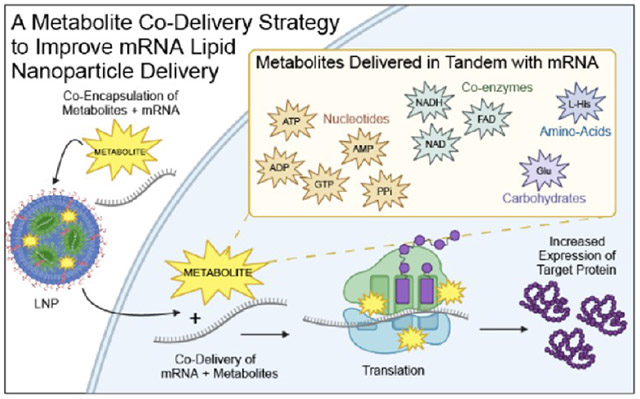
(a) Schematic representation of the study’s central objective, to enhance the efficacy of mRNA LNPs through the co-delivery of metabolites. The metabolites used in this study include nucleotides/nucleotide derivatives – adenosine 5’-triphosphate (ATP), guanosine 5’-triphosphate (GTP), adenosine 5’-diphosphate (ADP), adenosine 5’-monophosphate (AMP), and pyrophosphate (PPi); amino acid – l-histidine (l-His); coenzymes – nicotinamide adenine dinucleotide (NAD), flavin adenine dinucleotide (FAD) and reduced nicotinamide adenine dinucleotide (NADH); and carbohydrate – glucose (Glu). (b) Chemical structures of representative lipids and metabolites used in this study. (c) Schematic illustration of our approach to formulate LNPs with the metabolite of interest via a microfluidic chip. (d) Size/diameter, (e) PDI, (f) zeta potentials, (g) mRNA and metabolite encapsulation efficiency (data presented as the mean ± standard deviation, n = 3). The mRNA encapsulation efficiency was characterized by the Ribogreen assay. The metabolites encapsulation efficiency was determined by their corresponding kits, which have been included in the Supporting information, following the manufacturer’s instructions.
EXPERIMENTAL DETAILS
Materials.
Phosphate-buffered saline (PBS, pH 7.4), cholesterol, sodium citrate, citric acid, penicillin-streptomycin, Triton X-100, NaN3, cytochalasin D, 5-(N-ethyl-N-isopropyl) amiloride (EIPA), Dulbecco’s phosphate-buffered saline (DPBS), adenosine 5′-triphosphate (ATP) disodium salt hydrate, guanosine 5′-triphosphate (GTP) sodium salt hydrate, sodium pyrophosphate decahydrate, pyrophosphate assay kit, adenosine 5’-diphosphate (ADP) sodium salt, adenosine 5′-monophosphate (AMP) disodium salt, d-(+)-glucose, NAD, flavin adenine dinucleotide (FAD) disodium salt hydrate, NADH, l-histidine (l-His), pyrophosphate assay kit, ADP assay kit, and ATPase/GTPase activity assay kit were purchased from Sigma-Aldrich. 1,2-dimyristoyl-sn-glycero-3-phosphoethanolamine-N-[methoxy-(polyethylene glycol)-2000] (ammonium salt) (C14-PEG 2000) and 1,2-dioleoyl-sn-glycero-3-phosphoethanolamine (DOPE) were obtained from Avanti. Moderna SM-102 lipids were purchased from Broadpharm. NADH assay kit (red fluorescence), NAD assay kit (blue fluorescence), glucose quantitation kit, fetal bovine serum (FBS), Hoechst 33342 trihydrochloride, 10 mg mL−1), calcein, LysoTracker Green, Dulbecco’s modified Eagle’s medium (DMEM), and Alexa Fluor 594-wheat germ agglutinin conjugate (AF594-WGA) were purchased from Life Technologies. Bright-Glo Luciferase assay system was obtained from Promega. CleanCap Firefly luciferase (5-moU) mRNA, CleanCap Human EPO mRNA (5-moU), and CleanCap EGFP (5-moU) mRNA were obtained from TriLink Biotechnologies. Cy5-FLuc mRNA was obtained from ApexBio. Luminescent ATP detection assay kit, MicroBCA assay kit, FAD assay kit, and AMP assay kit were obtained from Abcam. Quant-iT RiboGreen RNA assay kit, Alamar Blue reagent, Alexa Fluor 488-wheat germ agglutinin conjugate (AF488-WGA), bafilomycin A1, and Human EPO ELISA kit were purchased from Thermo Fisher Scientific. All experiments utilized ultrapure water (Milli-Q) with a resistivity greater than 18.2 MΩ·cm, which was obtained from a Millipore Milli-Q Plus 185 purification system with a three-stage purification process. All chemicals were used as received without any additional purification.
LNP Formulation.
The organic phase was prepared by mixing Moderna SM-102 ionizable lipid, cholesterol, dioleoyl-sn-glycero-3-phosphoethanolamine (DOPE), and 1,2-dimyristoyl-sn-glycero-3 phosphoethanolamine-N-[methoxy-(polyethylene glycol)-2000] (ammonium salt) (C14-PEG 2000) in a molar ratio of 48:40:10:2. Next, we dissolved 0.26 mg mL−1 mRNA in 10 mM citrate buffer (pH 3) with 2 mg mL−1 metabolites [GTP, ATP, ADP, AMP, pyrophosphate (PPi), l-His, NAD, FAD, NADH, and glucose (Glu)] in 10 mM citrate buffer (pH 3) to prepare the aqueous phase. The organic and aqueous phases were then combined in a 1:3 volume ratio and loaded into a microfluidic chip device. Next, the formulated LNPs were dialyzed in a 20,000 MWCO cassette against 1X PBS buffer at 4 °C in a cold room. After 2 h, the formulated LNPs were stored at 4 °C until further use.
LNP Characterization.
The particle size, polydispersity index (PDI), and surface charge (zeta potential) of LNPs were measured using dynamic light scattering (DLS) and electrophoretic light scattering (ELS) (NanoBrook 90 Plus Zeta, Brookhaven, USA). For size measurements, the formulated LNPs were diluted in 1X PBS (pH 7.4), and for surface charge (zeta potential) analysis, the formulated LNPs were diluted in 0.1X PBS (pH 7.4). The Quant-iT RiboGreen RNA assay kit was used to assess the encapsulation efficiency of FLuc, EGFP, and EPO mRNA according to the manufacturer’s instructions. The measurements were taken with a SpectraMax microplate reader (Molecular Devices, USA) at an excitation wavelength of 480 nm and an emission wavelength of 520 nm. To characterize the overall mRNA concentration, the LNPs were fully dissolved with 1X Triton. The encapsulation efficiency of the metabolites was determined using their corresponding kits. i.e., the encapsulation efficiency of GTP was characterized using the ATPase/GTPase activity assay kit; the encapsulation efficiency of ATP was characterized using the luminescent ATP detection assay kit; the encapsulation efficiency of ADP was characterized using the ADP assay kit; the encapsulation efficiency of AMP was characterized using the AMP assay kit; the encapsulation efficiency of PPi was characterized using the pyrophosphate assay kit; the encapsulation efficiency of l-His was characterized using the MicroBCA assay kit; the encapsulation efficiency of NAD was characterized using the NAD assay kit with blue fluorescence; the encapsulation efficiency of FAD was characterized using the FAD assay kit; the encapsulation efficiency of NADH was characterized using the NADH assay kit with red fluorescence; and the encapsulation efficiency of Glu was characterized using the glucose quantitation kit.
Stability.
At 4 °C, FLuc mRNA-encapsulated LNPs were placed in PBS buffer (pH 7.4) in a cold room for the desired time intervals (0, 7, 14, 21, and 28 days). The size was determined by DLS via diluting the samples in 1X PBS (pH 7.4) buffer. The size of LNPs after desired days (7, 14, 21, and 28 days) vs the size at day 0 was plotted to indicate the stability of the LNPs.
In Vitro FLuc Expression.
MDCK, U87, and U251 cells were plated in 96-well plates and incubated at 37 °C under both normoxic and hypoxic conditions, with a cell seeding density of 1 × 10⁴ cells per well. Next day, the cell media in each well were aspirated. Then, 100 μL of LNPs loaded with FLuc mRNA were added to MDCK, U87, and U251 cells, with an overall mRNA concentration of 500 ng mL−1, and the treated cells were incubated for 24 h. Subsequently, for each well, 100 μL of Bright-Glo Luciferase assay buffer was added, and the mixture was incubated for 2 min. Finally, the FLuc expression value, measured by luminescence, was quantified with a SpectraMax microplate reader.
In Vitro EPO Expression.
U251 cells were plated in 96-well plates and incubated at 37 °C under both normoxic and hypoxic conditions, with the cell seeding density of 1 × 10⁴ cells per well. Next day, the cell media in each treated well were aspirated. Then, 100 μL of LNPs loaded with EPO mRNA were added to U251 cells with an overall mRNA concentration of 500 ng mL−1, and the treated cells were incubated for 24 h. Next, the supernatant from each treated well was set aside for further analysis. The concentration of human EPO protein in the supernatant was then characterized using Human EPO ELISA kits (Thermo Fisher Scientific), followed by the manufacturer’s protocol.
In Vitro EGFP Expression.
EGFP expression was quantified using confocal laser scanning microscopy (CLSM) (Zeiss LSM 980, Germany). Briefly, U251 cells were plated in μ-slide 8-well coverslip slides under both normoxic and hypoxic conditions at 37 °C for 24 hours, with a cell seeding density of 4 × 10⁴ cells per well. The following day, the cell media in each well were aspirated. Then, 200 μL of LNPs loaded with EGFP mRNA were added to the cells, with an overall mRNA concentration of 250 ng mL−1, and the treated cells were incubated for 24 h. The following day, DPBS was added to each well to wash the cells three times, and 300 μL of AF594-WGA (5 μg mL−1) was introduced to the treated cells and incubated for 15 min to stain the cell membrane at 37 °C. Subsequently, DPBS was added to each well to wash the cells three times. Then, 1 μg mL−1 of Hoechst 33342 was added to the cells and incubated for 10 min at 37 °C. In the final step, CLSM (objective: 63× oil immersion) was used to capture live cell images. WCIF ImageJ software was used to analyze and process the acquired live cell images.
Cell Viability by alamarBlue Assay.
MDCK, U87, or U251 cells were grown in complete DMEM cell culture media containing 10% fetal bovine serum (FBS) and 1% penicillin-streptomycin and incubated at 37 °C in a 5% CO2 environment. The cells were plated in 96-well plates and incubated at 37 °C under both normoxic and hypoxic conditions, with a cell seeding density of 1 × 10⁴ cells per well. The following day, the cell media in each well was aspirated. Then, 100 μL of fresh complete DMEM cell culture media (as 100% cell viability control), 100 μL of 1X Triton dissolved in DMEM (as negative control), or 100 μL of LNP formulations with 500 ng mL−1 of total mRNA were introduced into the cells and incubated under normoxic and hypoxic conditions. After a 24-h incubation, the cell media in each treated well was aspirated. Subsequently, 100 μL of aliquoted alamarBlue reagent was added into each well, followed by a 3-h incubation. Finally, the cell viability in each treated well was assessed using a SpectraMax microplate reader with an absorbance measurement at 570 nm, with a reference wavelength of 600 nm. Cells treated with fresh media were used as an untreated control. Empty cells contain aliquoted alamarBlue reagent as background controls. The cell viability results were then calculated by normalizing the absorbance to the untreated cells.
Cellular Association.
MDCK, U87, or U251 cells were grown in complete DMEM cell culture media containing 10% fetal bovine serum (FBS) and 1% penicillin-streptomycin, and incubated at 37 °C in a 5% CO2 environment. The cells were plated in 24-well plates and incubated at 37 °C under both normoxic and hypoxic conditions, with a cell seeding density of 8 × 10⁴ cells per well. The following day, the cell media in each well were aspirated. Then, 200 μL of LNPs loaded with Cy5-FLuc mRNA were added to the cells, with an overall mRNA concentration of 500 ng mL−1 under both normoxic and hypoxic conditions, and the treated cells were incubated for 24 h. Subsequently, DPBS was added to each well to wash the cells three times, and the cells were dissociated using trypsin-EDTA. Finally, an Attune Flow Cytometer (Thermo Fisher Scientific, USA) was used to analyze the samples treated with LNPs loaded with Cy5-FLuc mRNA, as well as the samples treated with fresh complete DMEM cell culture media. The cellular association was characterized by the geometric mean fluorescence intensity (GMFI) of each sample of cells.
Cellular Internalization.
U251 cells were grown in complete DMEM cell culture media containing 10% fetal bovine serum (FBS) and 1% penicillin-streptomycin, and incubated at 37 °C in a 5% CO2 environment. The cells were plated in μ-slide 8-well coverslip slides and incubated at 37 °C under both normoxic and hypoxic conditions, where the cell seeding density was 4 × 10⁴ cells per well. The following day, the cell media in each well was aspirated. Then, 200 μL of LNPs loaded with Cy5-FLuc mRNA were added to the cells with an overall mRNA concentration of 500 ng mL−1 under both normoxic and hypoxic conditions. After 24 h, the supernatant was removed, and DPBS was added to each well to wash the cells three times. Subsequently, 300 μL of AF488-WGA (5 μg mL−1) was introduced and incubated for 15 min to stain the cell membrane at 37 °C. Next, the cells were washed with DPBS three times, followed by the addition of Hoechst 33342 (with the concentration of 1 μg mL−1) to each well and incubated for 10 min at 37 °C. In the final step, CLSM (objective: 63× oil immersion) was used to capture live cell images. WCIF ImageJ software was used to analyze and process the acquired live cell images.
Endocytosis Mechanism.
U251 cells were grown in complete DMEM cell culture media containing 10% fetal bovine serum (FBS) and 1% penicillin-streptomycin, and incubated at 37 °C in a 5% CO2 environment. The cells were plated in 24-well plates and incubated at 37 °C under both normoxic and hypoxic conditions, where the cell seeding density was 8 × 10⁴ cells per well. The following day, the cell media in each well was aspirated. Endocytosis inhibitors (EIPA, NaN3, and cytochalasin D) were introduced to the cells and incubated for 20 min. The final concentrations of inhibitors in each treated well were 15 μg mL−1 of EIPA, 100 mM of NaN3, and 25 μM of cytochalasin D, respectively. 100 μL of LNPs loaded with Cy5-FLuc mRNA were added into the cells with an overall mRNA concentration of 500 ng mL−1 under both normoxic and hypoxic conditions. After 2 h, the supernatant was removed, and DPBS was added to each well to wash the cells twice, followed by dissociation using trypsin-EDTA. Finally, an Attune Flow Cytometer (Thermo Fisher Scientific, USA) was used to analyze the samples treated with LNPs loaded with Cy5-FLuc mRNA, as well as the samples treated with fresh complete DMEM cell culture media. The percentage of inhibition was characterized by normalizing the geometric mean fluorescence intensity (GMFI) of the cells treated with inhibitors to the control cells treated without inhibitors for 2 h.
Endosomal Escape.
U251 cells were grown in complete DMEM cell culture media containing 10% fetal bovine serum (FBS) and 1% penicillin-streptomycin, and incubated at 37 °C in a 5% CO2 environment. The cells were plated in μ-slide 8-well coverslip slides and incubated at 37 °C, with a cell seeding density of 4 × 10⁴ cells per well. The following day, the cell media in each well was aspirated. Then, 200 μL of LNPs loaded with Cy5-FLuc mRNA were added to the cells, with an overall mRNA concentration of 500 ng mL−1. After 3 h of incubation, the supernatant was removed, and DPBS was added to each well to wash the cells twice. Then, 300 μL of 100 nM LysoTracker Green, dissolved in culture media (prewarmed at 37 °C), was introduced. After 1 h of incubation, DPBS was added to each well to wash the cells three times, followed by the addition of Hoechst 33342 (with the concentration of 1 μg mL−1) to each well, and the cells were incubated for 10 min at 37 °C. In the final step, CLSM (objective: 63× oil immersion) was used to capture live cell images. WCIF ImageJ software was used to analyze and process the acquired live cell images. The PCC value was calculated by analyzing five representative cell images, with each image containing more than 20 cells.
Endosomal Escape Mechanism Study with Bafilomycin A1.
U251 cells were grown in complete DMEM cell culture media containing 10% fetal bovine serum (FBS) and 1% penicillin-streptomycin, and incubated at 37 °C in a 5% CO2 environment. The cells were plated in μ-slide 8-well coverslip slides and incubated at 37 °C, with a cell seeding density of 4 × 10⁴ cells per well. The following day, the cell media in each well was aspirated. Subsequently, 180 μL of fresh DMEM cell culture media, with or without bafilomycin A1, was introduced into each well. Then, 20 μL of calcein dissolved in complete DMEM cell culture media with a concentration of 1.5 mg mL−1 was introduced to each well, where a final concentration of calcein was 0.15 mg mL−1 and bafilomycin A1 was 100 nM. Then, LNPs loaded with FLuc mRNA were added to the cells, with an overall mRNA concentration of 500 ng mL−1. After 3 h of incubation, DPBS was added to each well to wash the cells three times. In the final step, CLSM (objective: 40× oil immersion) was used to capture live cell images. WCIF ImageJ software was used to analyze and process the acquired live cell images.
Animal Studies of FLuc mRNA-Encapsulated LNPs.
The animal studies conducted in this manuscript were approved by the Institutional Animal Care and Use Committee at the University of North Carolina at Chapel Hill. All procedures adhered to local, state, and federal regulations. These studies were carried out at the UNC Lineberger ASC at the University of North Carolina at Chapel Hill. FLuc mRNA-encapsulated LNP formulations with the metabolite of interest were prepared. Naked FLuc mRNA and PBS injections were used as control groups. Female C57 black 6 mice (Jackson Laboratory, 18–21 g) were administered injections via tail vein (intravenously). The overall FLuc mRNA concentration dose was 0.3 mg kg−1. After 24 h postinjection, 130 μL of d-luciferin (with the concentration of 30 mg mL−1 in PBS) was intraperitoneally injected into the mice and incubated for 15 min. Next, the mice were euthanized, and various organs, including the heart, ovaries, spleen, kidneys, liver, pancreas, and lungs, were collected for in vivo imaging using an in vivo imaging system (IVIS) (Perkin Elmer, Waltham, MA). Bioluminescence data were captured and analyzed using AuRA software (Spectral Instruments Imaging ). Subsequently, three major organs—lung, spleen, and liver tissues—were fixed in 10% neutral buffered formalin and processed for paraffin embedding. Histological sections were evaluated using hematoxylin and eosin (H&E) stains. Histological sections were prepared by cutting the paraffin blocks into 5 μm slices and mounting them onto positively charged slides. To prepare for histological staining, the slides were baked at 60 °C for 60 min. Subsequently, the samples were deparaffinized in xylene and rehydrated using graded ethanol. H&E staining was performed using the Leica Biosystems Auto Stainer XL, with Hematoxylin (Richard-Allen Scientific, 7211) applied for 2 min, followed by Eosin-Y (Richard-Allen Scientific, 7111) for 1 min. To differentiate the stain, Clarifier 2 (7402) and Bluing (7111) from Richard-Allen Scientific were used. Finally, Cytoseal 60 (8310–4, Thermo Fisher Scientific) was used to dehydrate the slides. Histological analysis was then performed on each sample.
Animal Blood Studies and Animal Studies of EPO mRNA-Encapsulated LNPs.
EPO mRNA-encapsulated LNP formulations with the metabolite of interest were prepared by microfluidic mixing. Naked EPO mRNA and PBS injections were used as controls. Female C57 black 6 mice (Jackson Laboratory, 18–21 g) were administered injections via tail vein (intravenously). The overall EPO mRNA concentration dose was 0.3 mg kg−1. After 24 h, 250 μL of blood was collected from each animal by cardiac puncture, in which 60 μL of blood was transferred to tubes with K2EDTA (BD Microcontainer) and 190 μL of blood to Minicollect tubes (Greiner Bio-One) stored at room temperature. Next, the blood from the Minicollect tubes was centrifuged at 1300 rcf for 10 min to collect the serum. Subsequently, each sample was further diluted for EPO protein analysis. The concentration of human EPO protein was characterized using Human EPO ELISA kits (Thermo Fisher Scientific), followed by the manufacturer’s protocol. The complete blood count and kidney and liver function tests from the blood of each mouse were evaluated using the IDEXX ProCyte Dx hematology analyzer and the Vet Axcel instrument, respectively.
RESULTS AND DISCUSSION
To validate our hypothesis that the utility of our metabolite co-delivery strategy can improve mRNA delivery, we initiated our study by selecting four representative classes of metabolites for incorporation into mRNA LNP formulations (Figure 1b). These classes were chosen based on their critical roles in cellular processes and their potential impact on mRNA translation.42-44 These classes are: (i) nucleotide or nucleotide derivatives, which play important roles in cellular energy conversion through glycolysis, glycogenesis, and glycogenolysis;45,46 (ii) amino acids, which function as building blocks for nascent protein synthesis and antioxidants, and also act as precursors to α-ketoglutarate and glutamine, which are key energy sources for cells;47,48 (iii) coenzymes, which are essential for cellular respiration and energy generation, facilitating the transfer of electrons in metabolic pathways, including gluconeogenesis and oxidative phosphorylation;49,50 and (iv) glucose, which acts as the main source of carbon and energy for cells.51,52 We specifically selected adenosine 5’-triphosphate (ATP), guanosine 5’-triphosphate (GTP), adenosine 5’-diphosphate (ADP), adenosine 5’-monophosphate (AMP), and pyrophosphate (PPi) for nucleotide or nucleotide derivatives; l-histidine (l-His) for amino acids; nicotinamide adenine dinucleotide (NAD), flavin adenine dinucleotide (FAD), and reduced nicotinamide adenine dinucleotide (NADH) for coenzymes; and glucose (Glu). We analyzed 25 physicochemical properties of these ten metabolites using Marvin Sketch (Chemaxon), visualizing them in a heat map format (Figure S1).53 Additionally, principal component analysis (PCA) was conducted to map these physicochemical properties into a 2D space and present them as a PCA score, emphasizing their structural diversity for mRNA LNP development (Figure S1).
Each representative LNP formulation with the metabolite of interest was then manufactured by microfluidic mixing with an organic phase composed of four components: an ionizable lipid (Moderna’s SM-102),54,55 cholesterol,56,57 a helper phospho-lipid (DOPE),57 and a PEG lipid (C14-PEG-2000) at a molar ratio of 48:40:10:2, and an aqueous phase containing mRNA and our selected metabolites of interest (Figure 1b,c).58,59 Our previous studies have demonstrated that our modified DOPE LNP formulations efficiently deliver mRNA both in vitro and in vivo.37,38,59,60 Therefore, we utilized these formulations to assess whether our co-delivery strategy enhances mRNA-encoded protein expression. The size, PDI, surface charge (zeta potential), and encapsulation efficiency of mRNA and metabolite for each formulation were consistent. The size of formulated LNPs was between ~157 nm and ~187 nm (Figure 1d); the PDI of formulated LNPs was between ~0.14 and ~0.26 (Figure 1e); the zeta potential of formulated LNPs was between ~−3.5 mV and ~1.5 mV (Figure 1f); the encapsulation efficiencies of mRNA were between ~63.0% and ~90.0% (Figure 1g); and each representative metabolite’s encapsulation efficiencies were between ~5.0% and ~68.9% (Figure 1g). It is noted that adding these metabolites into the LNP formulation did not impact those parameters. Each formulation remained stable at 4 °C for at least 28 days, as suggested by no change in the LNP size (Figure S2).
To evaluate our hypothesis regarding whether our metabolite co-delivery strategy can enhance mRNA LNP expression, we evaluated the in vitro efficacy of each formulation with three different mRNAs that encode firefly luciferase (FLuc, an intracellular protein), enhanced green fluorescent protein (EGFP, an intracellular protein), or human erythropoietin (EPO, a secreted protein) across three different cell lines—Madin-Darby canine kidney cells (MDCK, a normal kidney cell line used to study the effects of hypoxia on chronic kidney disease), U87 glioblastoma cells (a human glioblastoma cell line used as a model for hypoxic tumors), and U251 glioblastoma cells (another human glioblastoma cell line used for comparison to U87 cells due to different genetic markers for glioblastoma)—under both normoxic (i.e., 21% oxygen) and hypoxic (i.e., 1% oxygen) conditions (Figure 2). We performed confocal microscopy to visualize EGFP expression under normoxic and hypoxic conditions. In these images, blue color represents cell nuclei, red color represents the cell membrane, and green color represents EGFP protein (Figure 2d,e). We also evaluated the ratio of FLuc expression and EPO expression in these cell lines treated with representative LNPs with the metabolite of interest against analogous LNPs that do not contain the metabolite of interest (as a benchmark) under normoxic and hypoxic conditions (Figure 2h,i and Table S2). By analyzing these data together, we observed several trends. First, LNPs formulated with nucleotides or nucleotide derivatives [i.e., GTP, ATP, ADP, and PPi] increased FLuc expression, whereas LNPs formulated with amino acids [i.e., l-His], coenzymes [i.e., NAD, FAD, NADH], and carbohydrates [i.e., Glu] did not enhance the FLuc expression significantly compared to analogous LNPs that do not contain the metabolite of interest in all cell lines (Figure 2b,c and Table S2). Second, GTP and ATP formulations showed the best Fluc expression, ultimately exhibiting up to a ~9-fold increase in normoxic cells (Figure 2b,h and Table S2). Third, GTP and ATP formulations can restore protein expression in hypoxic cells, increasing it up to ~19-fold compared to analogous LNPs that do not contain the metabolite of interest in hypoxic cells (Figure 2c,i and Table S2), suggesting that our approach can potentially address the reduced efficacy of mRNA LNPs under hypoxic conditions. Fourth, GTP and ATP formulations increased EGFP expression, as suggested by the greater intensity of green color observed in the confocal images of both normoxic and hypoxic cells (Figure 2d,e). Fifth, GTP and ATP formulations increased EPO expression, exhibiting a ~3-fold increase in both normoxic and hypoxic cells (Figure 2f-i and Table S2). Sixth, our metabolite co-delivery strategy in different LNP formulations under each studied condition did not cause significant cellular toxicity and may be considered safe for further evaluation (Figures S3 and S4).
Figure 2.

(a) An experimental design for normoxic and hypoxic conditions. Normoxia refers to cells being seeded at an oxygen level of 21% for 24 h, followed by treatment with the respective LNP formulation loaded with FLuc, EGFP, or EPO mRNA under 21% of the oxygen level for an additional 24 h, after which protein expression was quantified. Hypoxia refers to cells being seeded at an oxygen level of 1% for 24 h, followed by treatment with the respective LNP formulation loaded with FLuc, EGFP, or EPO mRNA under 1% of oxygen level for an additional 24 h, after which protein expression was quantified. In vitro FLuc expression of each respective LNP formulation treated on MDCK, U87, and U251 cells under (b) normoxia and (c) hypoxia. (Data presented as the mean ± standard deviation, n = 4, ****p < 0.0001, **p < 0.01 and *p < 0.05, as compared with the analogous LNP group using one-way ANOVA, Dunnett test). The dose of mRNA is 50 ng per well, and the dose of the metabolites is shown in Table S1. Representative confocal images of U251 cells treated with EGFP mRNA LNP formulations under (d) normoxia and (e) hypoxia. In those images, blue represents cell nuclei (Hoechst 33342), red represents cell membranes (AF594-WGA), and green fluorescence was emitted by the EGFP protein. Scale bars are 20 μm. In vitro EPO expression of U251 cells treated with LNP formulations under (f) normoxic and (g) hypoxic conditions for 24 h at 37 °C. (Data presented as the mean ± standard deviation, n = 4, ****p < 0.0001, as compared with the LNP group using one-way ANOVA, Dunnett test). (h) FLuc expression ratio of MDCK, U87, and U251 cells under normoxia treated with LNP formulation with the metabolite of interest/analogous LNP that does not contain the metabolite of interest; EPO expression ratio of U251 cells under normoxia treated with LNP formulation with the metabolite of interest/analogous LNP that does not contain the metabolite of interest. (i) FLuc expression ratio of MDCK, U87, and U251 cells under hypoxia treated with LNP formulation with the metabolite of interest/analogous LNP that does not contain the metabolite of interest; EPO expression ratio of U251 cells under hypoxia treated with the LNP formulation with the metabolite of interest/analogous LNP that does not contain the metabolite of interest. The quantitative data for each bar chart in Figure 2 are shown in Table S2.
We next sought to understand the mechanism by which our metabolite co-delivery strategy operates in cells. Toward this end, we investigated several factors, including cellular association/internalization, endocytosis mechanisms, and endosomal escape. To begin our mechanistic studies, we quantified the cellular association of Cy5-FLuc mRNA in each formulation with a flow cytometer (Figures 3a,b and S5 and Table S3). We also quantified the cellular internalization of these formulations using confocal microscopy; in these images, blue color represents cell nuclei, green color represents cell membranes, and red color represents Cy5-FLuc mRNA (Figure 3c,d). To further explore how our metabolite co-delivery strategy impacts endocytosis pathways, we investigated the specific endocytosis pathway of each formulation. Briefly, we selected three main endocytosis pathways—macropinocytosis inhibited by 5-(N-ethyl-N-isopropyl) amiloride (EIPA), phagocytosis inhibited by cytochalasin D, and energy-dependent endocytosis inhibited by NaN3— and inhibited these pathways individually by adding the corresponding inhibitors under both normoxic and hypoxic conditions (Figure 3e-g and Table S3).60-63 Upon collectively analyzing these data, several trends emerged. First, our approach may alter the cellular association of analogous LNPs. For example, the cellular association of GTP and ATP formulations increased compared to analogous LNPs that do not contain the metabolite of interest, while ADP and FAD formulations decreased in normoxic and hypoxic cells compared to analogous LNPs that do not contain the metabolite of interest, as suggested by the geometric mean fluorescence intensity (GMFI) (Figure 3a,b and Table S3). This suggests that the higher cell uptake of GTP and ATP LNPs could be the reason leading to higher protein expression. Second, our metabolite co-delivery strategy may also impact the cellular internalization of analogous LNPs. For instance, more Cy5-FLuc mRNA (red dots) was observed inside cells treated with GTP and ATP formulations, while less Cy5-FLuc mRNA (red dots) was observed inside cells treated with NADH and Glu formulations under both normoxic and hypoxic conditions (Figure 3c,d). Third, LNPs formulated with various metabolites were internalized by cells through a combination of endocytic pathways, with the energy-dependent endocytosis pathway serving as the main mechanism in both normoxic and hypoxic cells. Therefore, our metabolite co-delivery strategy has the potential to influence these endocytic pathways (Figure 3e-g and Table S3).
Figure 3.
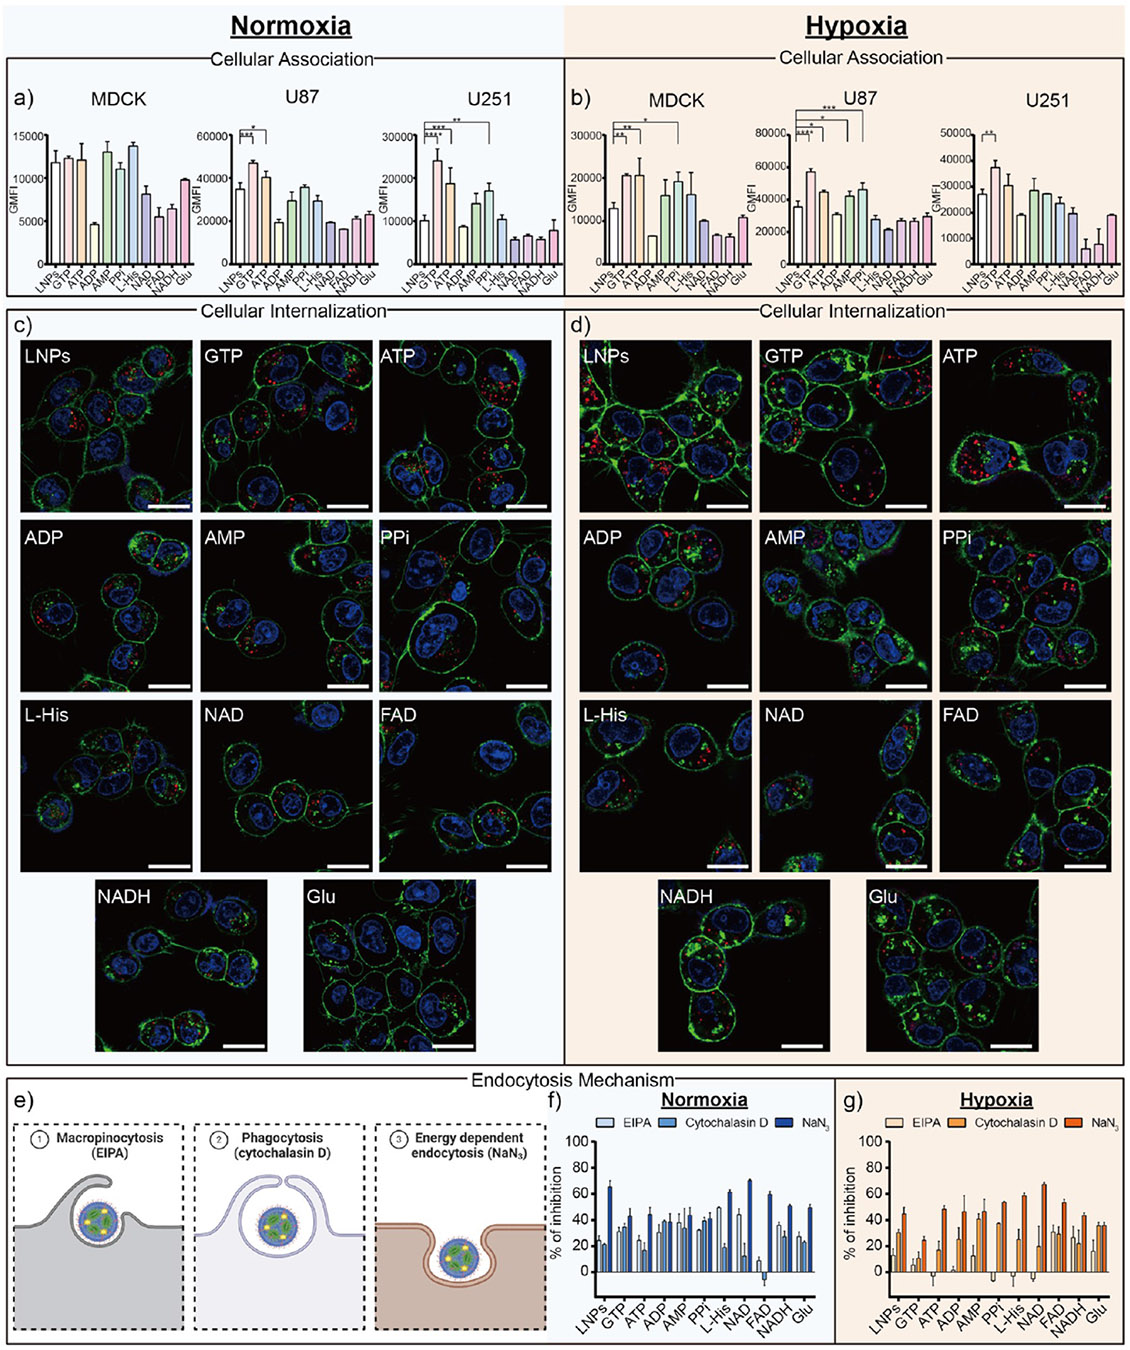
(a, b) Evaluating cellular association behavior when MDCK, U87, and U251 cells were treated with Cy5-FLuc mRNA LNP formulations under normoxic and hypoxic conditions as quantified by a flow cytometer. (Data presented as the mean ± standard deviation, n = 3, ****p < 0.0001, ***p < 0.001, **p < 0.01 and *p < 0.05, as compared with the LNPs group using one-way ANOVA, Dunnett test). (c, d) Representative confocal images of U251 cells treated with Cy5-FLuc mRNA LNP formulations (red) under normoxic and hypoxic conditions for 24 h at 37 °C. In those images, blue color represents cell nuclei (Hoechst 33342), green color represents cell membranes (AF488-WGA,) and red fluorescence was emitted by Cy5-FLuc mRNA. Scale bars are 20 μm. (e) Schematic illustration of the endocytosis mechanisms with the corresponding inhibitors used. EIPA inhibits micropinocytosis, cytochalasin D inhibits phagocytosis, and NaN3 inhibits energy dependent endocytosis. (f, g) Study of the cell endocytosis mechanism of Cy5-FLuc mRNA LNP formulations by monitoring the cellular association efficiency in the presence of different endocytic inhibitors. The quantitative data for each bar chart in Figure 3 are shown in Table S3.
Following these cellular association and internalization mechanism studies, we next sought to understand how our metabolite co-delivery strategy impacts the mechanism of endosomal escape. Endosomal escape remains a daunting step in mRNA delivery, as most LNPs fail to release their mRNA payload into the cytoplasm, preventing the generation of therapeutic proteins.64 Given our previous finding that hypoxia will not affect the endosomal escape of LNPs,37 we performed our endosomal escape study only on normoxic cells. Briefly, we performed the endosomal escape studies using confocal microscopy at 3 h—in those images, blue color represents cell nuclei, green color represents endo/lysosomes, and red color represents Cy5-FLuc mRNA. Thus, the colocalization of the green and red signals, which generates a yellow signal, suggests that the mRNA is still trapped within the endo/lysosomes (Figure 4a,b).38,65 We also quantified the endosomal escape of the LNP formulations with the metabolite of interest in these confocal images using a quantitative parameter—the Pearson correlation coefficient (PCC), where a value of 1 suggests no endosomal escape and 0 suggests complete endosomal escape (Figure 4c).66,67 To further investigate the mechanisms of endosomal escape, we treated cells directly with “label-free” LNP formulations with the metabolite of interest and calcein (a membrane-impermeable dye that remains within endosomes when incubated with cells but can spread throughout the cells if endosome membranes are disrupted), following optional treatment with bafilomycin A1 (an inhibitor that can inhibit the “proton sponge effects” – one mechanism causing endosomal escape) (Figure 4a,d).68,69 After analyzing these confocal image data, several key findings emerged. First, our metabolite co-delivery strategy to formulate LNPs with the metabolite of interest might potentially impact the PCC values, as GTP, ATP, and l-His formulations exhibited lower PCC values than the analogous LNPs that do not contain the metabolite of interest (Figure 4c). This suggests that the better endosomal escape of GTP and ATP LNPs could contribute to higher protein expression. Second, the calcein dye diffused throughout the cells when incubated with the LNP formulations with the metabolites GTP, ATP, AMP, l-His, and FAD compared to analogous LNPs that do not contain the metabolite of interest (upper row, Figure 4d), further suggesting their improved endosomal escape properties. Third, punctuated fluorescence dots were observed when cells were treated with any LNP formulations, calcein, and bafilomycin A1 (bottom row, Figure 4d), suggesting that one of the endosomal escape mechanisms for these LNPs might be the “proton sponge effect”. Taken together, these results suggest that our metabolite co-delivery strategy could alter the endosomal escape properties of mRNA LNPs.
Figure 4.

(a) Schematic overview demonstrating the Lysotracker Green endosomal escape assay, a calcein leakage assay, and a proton sponge effect assay using bafilomycin A1. (b) Representative confocal images of U251 cells treated with Cy5-FLuc mRNA encapsulated LNP formulations (red). Green color was observed when the endo/lysosomes were stained with LysoTracker Green. Blue color was observed when the cell nuclei were stained with Hoechst 33342. Scale bars are 20 μm. (c) Pearson Correlation Coefficient (PCC) analysis of U251 cells treated with Cy5-FLuc mRNA encapsulated LNP formulations (data presented as the mean ± standard deviation, n > 20, *p < 0.05 as compared with the LNPs group using one-way ANOVA, Dunnett test). (d) Representative confocal images of U251 cells incubated with calcein and FLuc mRNA encapsulated LNP formulations in the presence and absence of the bafilomycin A1 inhibitor for 3 h at 37 °C. LNPs encapsulated with FLuc mRNA without Cy5 labeling was used to avoid interference with the calcein signal. Scale bars in all the confocal images represent 20 μm.
We finally sought to complete our study by evaluating if the metabolite co-delivery strategy would also improve in vivo protein expression. In brief, female C57BL/6 mice were intravenously (I.V.) injected with each representative LNP formulation with the metabolite of interest or an analogous mRNA LNP formulation that did not contain the metabolite of interest, with mRNA encoding either FLuc (Figure 5a-c) or EPO protein (Figure 5d). The dose of I.V. injection of mRNA is 0.3 mg kg−1, and the doses of the metabolites for the in vivo injection are shown in Tables S4 and S5. To confirm the safety of our approach for in vivo use, we performed histological evaluations (Figure 5e), kidney and liver function tests with blood sampling (Figure 5f), complete blood count paneling (CBC) (Figures S6-S8), weight retention studies (Figure S9), and inflammatory blood biomarkers (Figure S10) for each formulation. Upon analyzing these data, several trends were observed. First, GTP and ATP formulations improved FLuc expression in the mice compared to the analogous mRNA LNPs without the metabolite of interest, as evidenced by an increased FLuc signal in the resected organs of treated mice (Figure 5a). Notably, only ATP formulations exhibited a significantly higher FLuc signal compared to that of the analogous LNPs that do not contain the metabolite of interest (Figure 5b). Second, our metabolite co-delivery strategy did not alter the innate biodistribution of analogous LNPs that do not contain the metabolite of interest, with most of the FLuc expression still occurring in the liver and a small amount in the spleen (Figure 5c). Third, GTP, ATP, and AMP formulations significantly enhanced secreted EPO protein expression in the mice’s blood serum compared to the analogous LNPs that do not contain the metabolite of interest (Figure 5d). Fourth, our metabolite co-delivery strategy was well tolerated, as suggested by histological evaluations (Figure 5e), complete blood count paneling (Figures S6-S8), weight retention (Figure S9), and kidney and liver function blood tests (Figure 5f). These tests, which included measurements of alkaline phosphatase (ALP), alanine transaminase (ALT), aspartate transaminase (AST), blood urea nitrogen (BUN), and creatinine (CREAT) levels, showed no significant differences in these biomarkers between the treated groups and the control group treated with PBS. Fifth, complete blood count (CBC) results of LNP formulations, including white blood cell count (WBC), neutrophils (NEUT), lymphocytes (LYMPH), monocytes (MONO), eosinophils (EO), and basophils (BASO), as inflammatory markers, showed no significant increase compared to the PBS control group, suggesting that our metabolite co-delivery strategy did not induce a substantial inflammatory response or trigger notable immune activation (Figure S10). Overall, these data suggest that our metabolite co-delivery strategy, especially ATP formulations, can serve as a safe and generalizable approach to improve the intracellular and secreted protein expression of mRNA LNPs both in vitro and in vivo.
Figure 5.
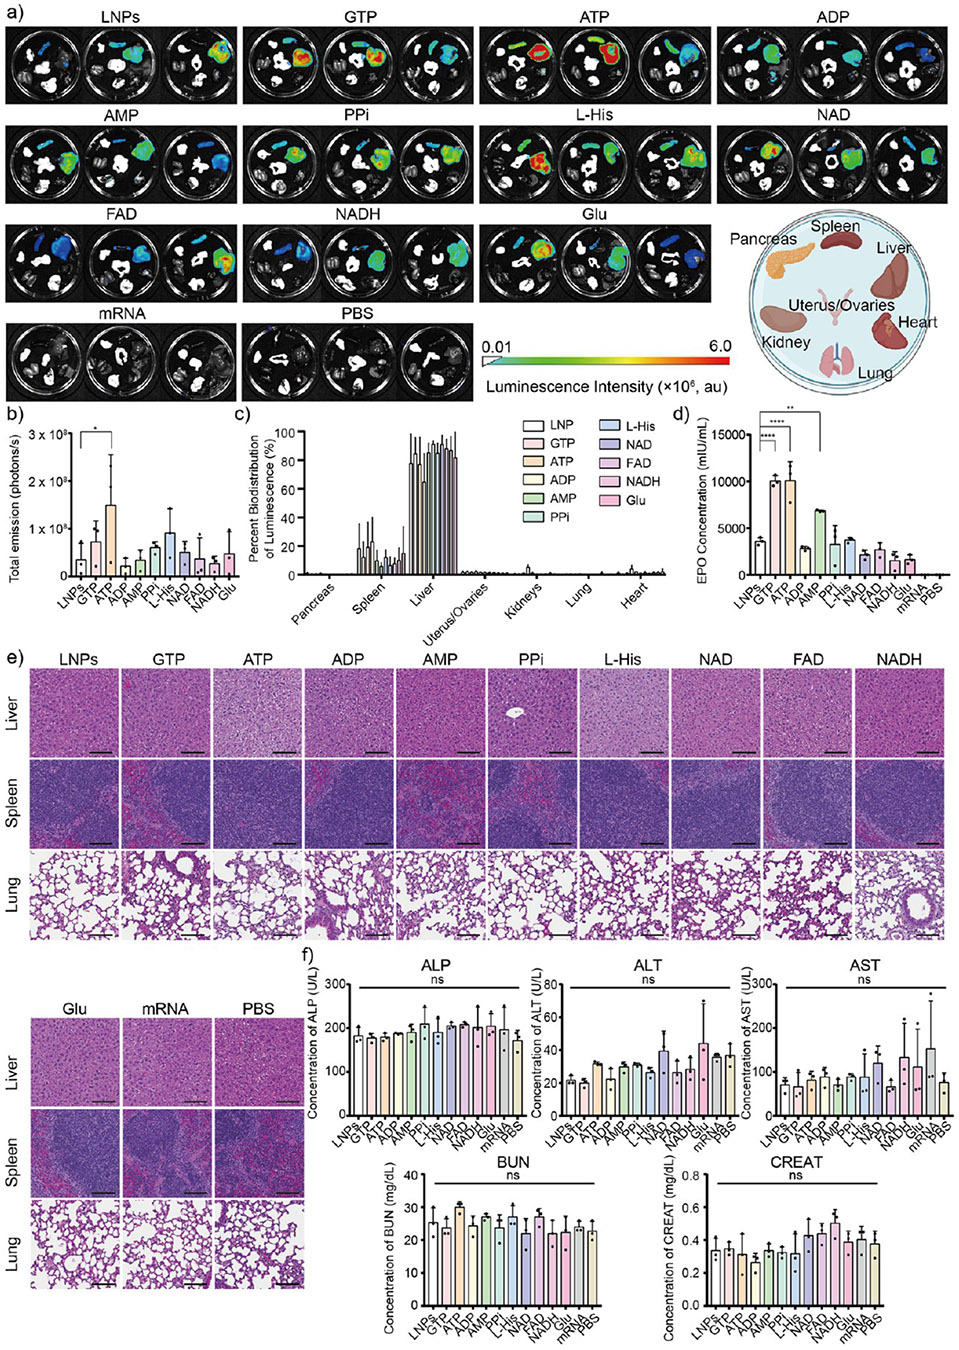
(a) Luminescence biodistribution of FLuc mRNA-encapsulated LNP formulations in vivo (n =3) for each group via intravenous (I.V.) administration. Mice injected with naked FLuc mRNA and only PBS was served as controls. (b) Total luminescence and (c) associated percent of bioluminescence of FLuc mRNA encapsulated LNP formulations across various organs, including pancreas, spleen, liver, kidney, uterus/ovaries, lung, and heart, after 24 h injection (*p < 0.05, as compared with the analogous LNPs that do not contain the metabolite of interest using one-way ANOVA, Dunnett test). (d) Human EPO concentration after the injection of EPO mRNA encapsulated LNP formulations for 24 h. Naked EPO mRNA and PBS were injected into mice and used as controls and benchmarks. The concentration of human EPO protein was characterized by Human EPO ELISA kits following the manufacturer’s protocol. (e) Representative histological images of three main organs, including the liver, spleen, and lung, of mice after 24 h I.V. injection of FLuc mRNA encapsulated LNP formulations (n = 3). Scale bars are 50 μm. (f) ALP, ALT, AST, BUN, and CREAT blood testing results after 24 h I.V. injection of EPO mRNA encapsulated LNP formulations (ns >0.05 as compared with the PBS control group using one-way ANOVA, Dunnett test, and all data presented as mean ± standard deviation, n = 3).
CONCLUSION
In this study, we introduced a metabolite co-delivery strategy by encapsulating key metabolites within mRNA LNPs. Our strategy demonstrated the potential to uniformly enhance mRNA delivery in both in vitro and in vivo applications, without altering the innate biodistribution compared to analogous LNP formulations that do not contain the metabolite of interest. Importantly, our strategy effectively addresses the challenge of inefficient protein expression under hypoxic conditions, offering a promising solution for improving mRNA translation in diseased cells under hypoxic conditions. We also verified that our metabolite co-delivery strategy could influence mechanisms between LNPs and cells, including cellular association/internalization, endocytosis, and endosomal escape. Additionally, we confirmed that this strategy maintains the protein expression ability in vivo without impacting tolerability under these studied conditions, highlighting its therapeutic potential. Currently, our metabolite encapsulation efficiency ranges from ~5.0% to ~68.9%. We hypothesize that metabolite encapsulation efficiency may be increased by adjusting the ratio of mRNA to metabolites, incorporating additional excipients within the LNP system, or modifying microfluidic formulation techniques. Going forward, we plan to further investigate how and why improved delivery is observed with ATP by examining properties such as LNP structure with techniques such as scattering small-angle X-ray scattering and/or electron microscopy, amongst other properties and techniques. Future studies will focus on the integration of different metabolite classes with other mRNA delivery platforms, such as polymeric or protein-based nanoparticles, and investigate their applicability to other RNA types like siRNA, shRNA, or saRNA. Future studies will also focus on the evaluation of our metabolite co-delivery strategy, especially the co-delivery of ATP and mRNA in hypoxic disease models. Ultimately, we hope that our strategy can be a versatile tool for therapeutic applications across diverse disease models by enabling more effective mRNA LNP delivery in vitro and in vivo.
Supplementary Material
The Supporting Information is available free of charge at https://pubs.acs.org/doi/10.1021/acsami.4c22969.
Heatmap generated from ClustVis and PCA analysis; stability of LNPs; cell viability, weight gain, CBC, flow cytograms, and metabolite dosage data (PDF)
ACKNOWLEDGMENTS
This work was supported by the NC Translational and Clinical Sciences (NC TraCS) Institute, funded by the NIH National Center for Advancing Translational Sciences (NCATS) award 1K12TR004416-01. All animal studies were supported within the UNC Lineberger ASC at the University of North Carolina at Chapel Hill, which is partially funded by an NCI Center Core Support Grant (CA16086) to the UNC Lineberger Comprehensive Cancer Center. The Pathology Services Core receives partial support from an NCI Center Core Support Grant (5P30CA016080-42). Microscopy was performed at the UNC Neuroscience Microscopy Core (RRID: SCR_019060), supported in part by NIH-NINDS Neuroscience Center Support Grant P30 NS045892 and NIH-NICHD Intellectual and Developmental Disabilities Research Center Support Grant P50 HD103573. Flow cytometry analysis was performed at the UNC Flow Cytometry Core Facility (RRID: SCR_019170). Additionally, research was supported in part by the North Carolina Biotech Center Institutional Support Grant (2017-IDG-1025) and the National Institutes of Health (1UM2AI30836-01). This work was also supported by the National Institute of 1251 General Medicine Sciences (NIGMS) award 1R35GM157060-1252 01. The content is solely the responsibility of the authors and does not necessarily represent the official views of the National Institutes of Health. We extend our gratitude to Cassie Pham and Mia Evangelista in the Pathology Services Core for expert technical assistance in histopathology and digital pathology. The figures were created in part with BioRender.com.
Footnotes
The authors declare no competing financial interest.
REFERENCES
- (1).VanKeulen-Miller R; Fenton OS Messenger RNA Therapy for Female Reproductive Health. Mol. Pharm 2024, 21, 393. [DOI] [PMC free article] [PubMed] [Google Scholar]
- (2).Narasipura EA; Fenton OS Advances in Non-Viral MRNA Delivery to the Spleen. Biomater. Sci 2024, 12 (12), 3027–3044. [DOI] [PMC free article] [PubMed] [Google Scholar]
- (3).Vargason AM; Anselmo AC; Mitragotri S. The Evolution of Commercial Drug Delivery Technologies. Nat. Biomed. Eng 2021, 5 (9), 951–967. [DOI] [PubMed] [Google Scholar]
- (4).Paunovska K; Loughrey D; Dahlman JE Drug Delivery Systems for RNA Therapeutics. Nat. Rev. Genet 2022, 23 (5), 265–280. [DOI] [PMC free article] [PubMed] [Google Scholar]
- (5).Sun B; Wu W; Narasipura EA; Ma Y; Yu C; Fenton OS; Song H. Engineering Nanoparticle Toolkits for MRNA Delivery. Adv. Drug Delivery Rev 2023, 200, 115042. [DOI] [PubMed] [Google Scholar]
- (6).Shepherd SJ; Warzecha CC; Yadavali S; El-Mayta R; Alameh M-G; Wang L; Weissman D; Wilson JM; Issadore D; Mitchell MJ Scalable MRNA and SiRNA Lipid Nanoparticle Production Using a Parallelized Microfluidic Device. Nano Lett. 2021, 21 (13), 5671–5680. [DOI] [PMC free article] [PubMed] [Google Scholar]
- (7).Ma Y; Li S; Lin X; Chen Y. A Perspective of Lipid Nanoparticles for RNA Delivery. Exploration 2024, 4 (6), 20230147. [DOI] [PMC free article] [PubMed] [Google Scholar]
- (8).Ma Y; Li S; Lin X; Chen Y. Bioinspired Spatiotemporal Management toward RNA Therapies. ACS Nano 2023, 17 (24), 24539–24563. [DOI] [PubMed] [Google Scholar]
- (9).Ma Y; VanKeulen-Miller R; Fenton OS MRNA Lipid Nanoparticle Formulation, Characterization and Evaluation. Nat. Protoc 2025, 1–34. [DOI] [PMC free article] [PubMed] [Google Scholar]
- (10).Huang K; Li N; Li Y; Zhu J; Fan Q; Yang J; Gao Y; Liu Y; Gao S; Zhao P; Wei K; Deng C; Zuo C; Sun Z. Circular MRNA Vaccine against SARS-COV-2 Variants Enabled by Degradable Lipid Nanoparticles. ACS Appl. Mater. Interfaces 2025, 17 (3), 4699–4710. [DOI] [PubMed] [Google Scholar]
- (11).Zeng G; He Z; Yang H; Gao Z; Ge X; Liu L; Liu Z; Chen Y. Cationic Lipid Pairs Enhance Liver-to-Lung Tropism of Lipid Nanoparticles for In Vivo MRNA Delivery. ACS Appl. Mater. Interfaces 2024, 16 (20), 25698–25709. [DOI] [PubMed] [Google Scholar]
- (12).Dong Y; Siegwart DJ; Anderson DG Strategies, Design, and Chemistry in SiRNA Delivery Systems. Adv. Drug Delivery Rev 2019, 144, 133–147. [DOI] [PMC free article] [PubMed] [Google Scholar]
- (13).Narasipura EA; VanKeulen-Miller R; Ma Y; Fenton OS Ongoing Clinical Trials of Nonviral SiRNA Therapeutics. Bioconjugate Chem. 2023, 34 (7), 1177–1197. [DOI] [PubMed] [Google Scholar]
- (14).Hendy DA; Ma Y; Dixon TA; Murphy CT; Pena ES; Carlock MA; Ross TM; Bachelder EM; Ainslie KM; Fenton OS Polymeric CGAMP Microparticles Affect the Immunogenicity of a Broadly Active Influenza MRNA Lipid Nanoparticle Vaccine. J. Control. Release 2024, 372, 168–175. [DOI] [PMC free article] [PubMed] [Google Scholar]
- (15).Ma Y; Wise AK; Shepherd RK; Richardson RT New Molecular Therapies for the Treatment of Hearing Loss. Pharmacol. Ther 2019, 200, 190–209. [DOI] [PMC free article] [PubMed] [Google Scholar]
- (16).Neill B; Romero AR; Fenton OS Advances in Nonviral MRNA Delivery Materials and Their Application as Vaccines for Melanoma Therapy. ACS Appl. Bio Mater 2024, 7 (8), 4894–4913. [DOI] [PMC free article] [PubMed] [Google Scholar]
- (17).Chaudhary N; Weissman D; Whitehead KA MRNA Vaccines for Infectious Diseases: Principles, Delivery and Clinical Translation. Nat. Rev. Drug Discovery 2021, 20 (11), 817–838. [DOI] [PMC free article] [PubMed] [Google Scholar]
- (18).Lee J; Jung W; Lee D; Kang M; Chung HJ; Yeom J. Chirality-Controlled Lipid Nanoparticles for MRNA Delivery. ACS Appl. Mater. Interfaces 2025, 17 (12), 18150–18159. [DOI] [PubMed] [Google Scholar]
- (19).Liao S; Wang S; Wadhwa A; Birkenshaw A; Fox K; Cheng MHY; Casmil IC; Magana AA; Bathula NV; Ho CH; Cheng J-Y; Foster LJ; Harder KW; Ross CJD; Cullis PR; Blakney AK Transfection Potency of Lipid Nanoparticles Containing MRNA Depends on Relative Loading Levels. ACS Appl. Mater. Interfaces 2025, 17 (2), 3097–3105. [DOI] [PMC free article] [PubMed] [Google Scholar]
- (20).Kim H; Kirtane AR; Kim NY; Rajesh NU; Tang C; Ishida K; Hayward AM; Langer R; Traverso G. Gastrointestinal Delivery of an MRNA Vaccine Using Immunostimulatory Polymeric Nanoparticles. Aaps J. 2023, 25 (5), 81. [DOI] [PMC free article] [PubMed] [Google Scholar]
- (21).Abramson A; Kirtane AR; Shi Y; Zhong G; Collins JE; Tamang S; Ishida K; Hayward A; Wainer J; Rajesh NU; Lu X; Gao Y; Karandikar P; Tang C; Lopes A; Wahane A; Reker D; Frederiksen MR; Jensen B; Langer R; Traverso G. Oral MRNA Delivery Using Capsule-Mediated Gastrointestinal Tissue Injections. Matter 2022, 5, 975. [Google Scholar]
- (22).Suberi A; Grun MK; Mao T; Israelow B; Reschke M; Grundler J; Akhtar L; Lee T; Shin K; Piotrowski-Daspit AS; Homer RJ; Iwasaki A; Suh H-W; Saltzman WM Polymer Nanoparticles Deliver MRNA to the Lung for Mucosal Vaccination. Sci. Transl. Med 2023, 15 (709), No. eabq0603. [DOI] [PMC free article] [PubMed] [Google Scholar]
- (23).Suresh B; Ramakrishna S; Kim H. Cell-Penetrating Peptide-Mediated Delivery of Cas9 Protein and Guide RNA for Genome Editing. Methods Mol. Biol 2017, 1507, 81–94. [DOI] [PubMed] [Google Scholar]
- (24).Laanesoo A; Periyasamy K; Pooga M; Rebane A. Development of CPP-Based Methods for Delivery of MiRNAs into the Skin and Airways: Lessons from Cell Culture and Mouse Models. Methods Mol. Biol 2022, 2383, 515–528. [DOI] [PubMed] [Google Scholar]
- (25).Klipp A; Burger M; Leroux J-C Get out or Die Trying: Peptide- and Protein-Based Endosomal Escape of RNA Therapeutics. Adv. Drug Delivery Rev 2023, 200, 115047. [DOI] [PubMed] [Google Scholar]
- (26).Lee C-D; Tu BP Metabolic Influences on RNA Biology and Translation. Crit. Rev. Biochem. Mol. Biol 2017, 52 (2), 176–184. [DOI] [PMC free article] [PubMed] [Google Scholar]
- (27).Bröer S; Bröer A. Amino Acid Homeostasis and Signalling in Mammalian Cells and Organisms. Biochem. J 2017, 474 (12), 1935–1963. [DOI] [PMC free article] [PubMed] [Google Scholar]
- (28).Wullschleger S; Loewith R; Hall MN TOR Signaling in Growth and Metabolism. Cell 2006, 124 (3), 471–484. [DOI] [PubMed] [Google Scholar]
- (29).Holcik M; Sonenberg N. Translational Control in Stress and Apoptosis. Nat. Rev. Mol. Cell Biol 2005, 6 (4), 318–327. [DOI] [PubMed] [Google Scholar]
- (30).Willmann L; Schlimpert M; Halbach S; Erbes T; Stickeler E; Kammerer B. Metabolic Profiling of Breast Cancer: Differences in Central Metabolism between Subtypes of Breast Cancer Cell Lines. J. Chromatogr. B: anal. Technol. Biomed. Life Sci 2015, 1000, 95–104. [DOI] [PubMed] [Google Scholar]
- (31).Griffin JL; Shockcor JP Metabolic Profiles of Cancer Cells. Nat. Rev. Cancer 2004, 4 (7), 551–561. [DOI] [PubMed] [Google Scholar]
- (32).Pietzner M; Kaul A; Henning A-K; Kastenmüller G; Artati A; Lerch MM; Adamski J; Nauck M; Friedrich N. Comprehensive Metabolic Profiling of Chronic Low-Grade Inflammation among Generally Healthy Individuals. BMC Med. 2017, 15 (1), 210. [DOI] [PMC free article] [PubMed] [Google Scholar]
- (33).Costantino S; Paneni F; Cosentino F. Ageing, Metabolism and Cardiovascular Disease. J. Physiol 2016, 594 (8), 2061–2073. [DOI] [PMC free article] [PubMed] [Google Scholar]
- (34).Wouters BG; van den Beucken T; Magagnin MG; Koritzinsky M; Fels D; Koumenis C. Control of the Hypoxic Response through Regulation of MRNA Translation. Semin. Cell. Dev. Biol 2005, 16 (4–5), 487–501. [DOI] [PubMed] [Google Scholar]
- (35).Liu L; Cash TP; Jones RG; Keith B; Thompson CB; Simon MC Hypoxia-Induced Energy Stress Regulates MRNA Translation and Cell Growth. Mol. Cell 2006, 21 (4), 521–531. [DOI] [PMC free article] [PubMed] [Google Scholar]
- (36).Ivanova IG; Park CV; Kenneth NS Translating the Hypoxic Response-the Role of HIF Protein Translation in the Cellular Response to Low Oxygen. Cells 2019, 8 (2), 114. [DOI] [PMC free article] [PubMed] [Google Scholar]
- (37).Ma Y; Fenton OS An Efficacy and Mechanism Driven Study on the Impact of Hypoxia on Lipid Nanoparticle Mediated MRNA Delivery. J. Am. Chem. Soc 2023, 145 (20), 11375–11386. [DOI] [PubMed] [Google Scholar]
- (38).Ma Y; Fenton OS A Unified Strategy to Improve Lipid Nanoparticle Mediated MRNA Delivery Using Adenosine Triphosphate. J. Am. Chem. Soc 2023, 145 (36), 19800–19811. [DOI] [PubMed] [Google Scholar]
- (39).Wong BW; Marsch E; Treps L; Baes M; Carmeliet P. Endothelial Cell Metabolism in Health and Disease: Impact of Hypoxia. Embo J. 2017, 36 (15), 2187–2203. [DOI] [PMC free article] [PubMed] [Google Scholar]
- (40).Eales KL; Hollinshead KER; Tennant DA Hypoxia and Metabolic Adaptation of Cancer Cells. Oncogenesis 2016, 5 (1), No. e190. [DOI] [PMC free article] [PubMed] [Google Scholar]
- (41).Tiwade PB; Ma Y; VanKeulen-Miller R; Fenton OS A Lung-Expressing MRNA Delivery Platform with Tunable Activity in Hypoxic Environments. J. Am. Chem. Soc 2024, 146 (25), 17365–17376. [DOI] [PubMed] [Google Scholar]
- (42).Gowda GAN; Zhang S; Gu H; Asiago V; Shanaiah N; Raftery D. Metabolomics-Based Methods for Early Disease Diagnostics. Expert Rev. Mol. Diagn 2008, 8 (5), 617–633. [DOI] [PMC free article] [PubMed] [Google Scholar]
- (43).Buttgereit F; Brand MD A Hierarchy of ATP-Consuming Processes in Mammalian Cells. Biochem. J 1995, 312 (1), 163–167. [DOI] [PMC free article] [PubMed] [Google Scholar]
- (44).DeBerardinis RJ; Mancuso A; Daikhin E; Nissim I; Yudkoff M; Wehrli S; Thompson CB Beyond Aerobic Glycolysis: Transformed Cells Can Engage in Glutamine Metabolism That Exceeds the Requirement for Protein and Nucleotide Synthesis. Proc. Natl. Acad. Sci. U. S. A 2007, 104 (49), 19345–19350. [DOI] [PMC free article] [PubMed] [Google Scholar]
- (45).Dashty M. A Quick Look at Biochemistry: Carbohydrate Metabolism. Clin. Biochem 2013, 46 (15), 1339–1352. [DOI] [PubMed] [Google Scholar]
- (46).Cheng KW; Agarwal R; Mitra S; Lee J-S; Carey M; Gray JW; Mills GB Rab25 Increases Cellular ATP and Glycogen Stores Protecting Cancer Cells from Bioenergetic Stress. EMBO Mol. Med 2012, 4 (2), 125–141. [DOI] [PMC free article] [PubMed] [Google Scholar]
- (47).Holeček M. Histidine in Health and Disease: Metabolism, Physiological Importance, and Use as a Supplement. Nutrients 2020, 12 (3), 848. [DOI] [PMC free article] [PubMed] [Google Scholar]
- (48).Wu N; Yang M; Gaur U; Xu H; Yao Y; Li D. Alpha-Ketoglutarate: Physiological Functions and Applications. Biomol Ther (Seoul) 2016, 24 (1), 1–8. [DOI] [PMC free article] [PubMed] [Google Scholar]
- (49).Xie N; Zhang L; Gao W; Huang C; Huber PE; Zhou X; Li C; Shen G; Zou B. NAD+ Metabolism: Pathophysiologic Mechanisms and Therapeutic Potential. Signal Transduct. Target. Ther 2020, 5 (1), 227. [DOI] [PMC free article] [PubMed] [Google Scholar]
- (50).Lane AN; Fan TW-M Regulation of Mammalian Nucleotide Metabolism and Biosynthesis. Nucleic Acids Res. 2015, 43 (4), 2466–2485. [DOI] [PMC free article] [PubMed] [Google Scholar]
- (51).Dienel GA Brain Glucose Metabolism: Integration of Energetics with Function. Physiol. Rev 2019, 99 (1), 949–1045. [DOI] [PubMed] [Google Scholar]
- (52).He W; Wu G. Oxidation of Amino Acids, Glucose, and Fatty Acids as Metabolic Fuels in Enterocytes of Developing Pigs. Amino Acids 2022, 54 (7), 1025–1039. [DOI] [PubMed] [Google Scholar]
- (53).Mei K-C; Stiepel RT; Bonacquisti E; Jasiewicz NE; Chaudhari AP; Tiwade PB; Bachelder EM; Ainslie KM; Fenton OS; Nguyen J. Single-Tailed Heterocyclic Carboxamide Lipids for Macrophage Immune-Modulation. Biomater. Sci 2023, 11 (8), 2693–2698. [DOI] [PMC free article] [PubMed] [Google Scholar]
- (54).Schoenmaker L; Witzigmann D; Kulkarni JA; Verbeke R; Kersten G; Jiskoot W; Crommelin DJA MRNA-Lipid Nanoparticle COVID-19 Vaccines: Structure and Stability. Int. J. Pharm 2021, 601, 120586. [DOI] [PMC free article] [PubMed] [Google Scholar]
- (55).Tenchov R; Bird R; Curtze AE; Zhou Q. Lipid Nanoparticles—From Liposomes to MRNA Vaccine Delivery, a Landscape of Research Diversity and Advancement. ACS Nano 2021, 15 (11), 16982–17015. [DOI] [PubMed] [Google Scholar]
- (56).Lu JJ; Langer R; Chen J. A Novel Mechanism Is Involved in Cationic Lipid-Mediated Functional SiRNA Delivery. Mol. Pharm 2009, 6 (3), 763–771. [DOI] [PMC free article] [PubMed] [Google Scholar]
- (57).Allen TM; Cullis PR Liposomal Drug Delivery Systems: From Concept to Clinical Applications. Adv. Drug Delivery Rev 2013, 65 (1), 36–48. [DOI] [PubMed] [Google Scholar]
- (58).Mui BL; Tam YK; Jayaraman M; Ansell SM; Du X; Tam YYC; Lin PJ; Chen S; Narayanannair JK; Rajeev KG; Manoharan M; Akinc A; Maier MA; Cullis P; Madden TD; Hope MJ Influence of Polyethylene Glycol Lipid Desorption Rates on Pharmacokinetics and Pharmacodynamics of SiRNA Lipid Nanoparticles. Mol. Ther. Nucleic Acids 2013, 2, No. e139. [DOI] [PMC free article] [PubMed] [Google Scholar]
- (59).Ma Y; Fenton OS Tannic Acid Lipid Nanoparticles Can Deliver Messenger RNA Payloads and Improve Their Endosomal Escape. Adv. Therap 2023, 6, 2200305. [Google Scholar]
- (60).Ma Y; Tiwade PB; VanKeulen-Miller R; Narasipura EA; Fenton OS Polyphenolic Nanoparticle Platforms (PARCELs) for In Vitro and In Vivo MRNA Delivery. Nano Lett. 2024, 24 (20), 6092–6101. [DOI] [PMC free article] [PubMed] [Google Scholar]
- (61).Qu Y; De Rose R; Kim C-J; Zhou J; Lin Z; Ju Y; Bhangu SK; Cortez-Jugo C; Cavalieri F; Caruso F. Supramolecular Polyphenol-DNA Microparticles for In Vivo Adjuvant and Antigen Co-Delivery and Immune Stimulation. Angew. Chem. Int. Ed 2023, 62 (12), No. e202214935. [DOI] [PMC free article] [PubMed] [Google Scholar]
- (62).McLendon PM; Fichter KM; Reineke TM Poly (Glycoamidoamine) Vehicles Promote PDNA Uptake through Multiple Routes and Efficient Gene Expression via Caveolae-Mediated Endocytosis. Mol. Pharm 2010, 7 (3), 738–750. [DOI] [PubMed] [Google Scholar]
- (63).Sahay G; Querbes W; Alabi C; Eltoukhy A; Sarkar S; Zurenko C; Karagiannis E; Love K; Chen D; Zoncu R; Buganim Y; Schroeder A; Langer R; Anderson DG Efficiency of SiRNA Delivery by Lipid Nanoparticles Is Limited by Endocytic Recycling. Nat. Biotechnol 2013, 31 (7), 653–658. [DOI] [PMC free article] [PubMed] [Google Scholar]
- (64).Su K; Shi L; Sheng T; Yan X; Lin L; Meng C; Wu S; Chen Y; Zhang Y; Wang C; Wang Z; Qiu J; Zhao J; Xu T; Ping Y; Gu Z; Liu S. Reformulating Lipid Nanoparticles for Organ-Targeted MRNA Accumulation and Translation. Nat. Commun 2024, 15 (1), 5659. [DOI] [PMC free article] [PubMed] [Google Scholar]
- (65).Han Y; Zhou J; Hu Y; Lin Z; Ma Y; Richardson JJ; Caruso F. Polyphenol-Based Nanoparticles for Intracellular Protein Delivery via Competing Supramolecular Interactions. ACS Nano 2020, 14 (10), 12972–12981. [DOI] [PubMed] [Google Scholar]
- (66).French AP; Mills S; Swarup R; Bennett MJ; Pridmore TP Colocalization of Fluorescent Markers in Confocal Microscope Images of Plant Cells. Nat. Protoc 2008, 3 (4), 619–628. [DOI] [PubMed] [Google Scholar]
- (67).Chen J; Li J; Zhou J; Lin Z; Cavalieri F; Czuba-Wojnilowicz E; Hu Y; Glab A; Ju Y; Richardson JJ; Caruso F. Metal-Phenolic Coatings as a Platform to Trigger Endosomal Escape of Nanoparticles. ACS Nano 2019, 13 (10), 11653–11664. [DOI] [PubMed] [Google Scholar]
- (68).Hu Y; Litwin T; Nagaraja AR; Kwong B; Katz J; Watson N; Irvine DJ Cytosolic Delivery of Membrane-Impermeable Molecules in Dendritic Cells Using PH-Responsive Core-Shell Nanoparticles. Nano Lett. 2007, 7 (10), 3056–3064. [DOI] [PubMed] [Google Scholar]
- (69).Dröse S; Altendorf K. Bafilomycins and Concanamycins as Inhibitors of V-ATPases and P-ATPases. J. Exp. Biol 1997, 200 (Pt 1), 1–8. [DOI] [PubMed] [Google Scholar]
Associated Data
This section collects any data citations, data availability statements, or supplementary materials included in this article.