Abstract
Telemedicine is increasingly used to expand access to primary healthcare, especially in low- and middle-income countries with workforce and infrastructure constraints. India’s eSanjeevani platform, launched in 2019, is the world’s largest government-led telemedicine initiative. The objective of this study was to analyse the adoption and utilization patterns of eSanjeevani, India’s national telemedicine service, from its national rollout in November 2019 through September 2023. We analysed aggregated programmatic data from the Centre for Development of Advanced Computing and official government sources, assessing teleconsultation volumes by platform type, state, age group, gender and diagnostic category. Over 163 million consultations were conducted across all 28 states and 8 union territories. The provider-assisted eSanjeevani Ayushman Bharat - Health and Wellness Center (AB-HWC) model accounted for >93% of usage. Utilization was highest among women and adults aged 25–45. The platform supported consultations for both acute conditions (e.g. fever, headache, diarrhoea) and chronic diseases, particularly diabetes and hypertension. The findings provide an overview of adoption and utilization trends during the platform’s expansion phase, offering a foundation for future research on patient-level outcomes, continuity of care and equity in access. The early implementation of eSanjeevani reflects the rapid scale-up of a government-led telemedicine platform in India and highlights patterns in its utilization across states, population groups and health conditions. While this study does not assess outcomes or implementation processes, it provides a foundational overview of usage trends during the programme’s expansion phase. We suggest that future research should focus on patient-level outcomes, continuity of care and equity in access, as well as the platform’s integration into broader primary healthcare delivery systems.
Keywords: eSanjeevani, adoption, digital health, innovation, implementation, telemedicine
INTRODUCTION
Access to essential healthcare remains a global challenge, with >4.5 billion people lacking services in 2021 and 344 million pushed into extreme poverty due to healthcare-related expenses [1]. India, despite progress in public health infrastructure, struggles to provide adequate healthcare with only 20.6 doctors and nurses per 10 000 people, and the figure falls below the World Health Organization’s recommendation of 44.5 per 10 000 [2, 3]. Even though the country has achieved a doctor–population ratio of 1:1000, 75% of doctors are urban centric leaving rural areas underserved [4–6]. March 2021 data indicate a 4.3% general physician shortage at primary health centres (PHCs) and a 79.9% specialist shortfall at community health centres, exacerbating rural healthcare disparities [7].
The Indian healthcare system also faces a dual burden of disease. While communicable, maternal and child illnesses persist, non-communicable diseases such as diabetes and hypertension are now a primary concern [8–10]. Due to the uneven distribution of healthcare providers, patients frequently bypass primary care facilities to seek treatment at secondary or tertiary centres, contributing to overcrowding and underutilisation of rural infrastructure [11]. Strengthening comprehensive primary healthcare and enabling earlier intervention are essential to ensure more equitable and effective care. In this context, telemedicine—defined as the delivery of healthcare services through telecommunications technologies—offers a promising solution for expanding access in underserved areas [12–14]. When embedded into primary care systems, telemedicine can reduce the need for physical referrals, support follow-up services and improve specialist access without requiring an in-person presence [12, 13, 15].
In response to these challenges, the Government of India launched ‘eSanjeevani’, the national telemedicine service, in November 2019 [16]. Developed by the Centre for Development of Advanced Computing (C-DAC), the platform enables remote healthcare delivery through two complementary models: (i) ‘eSanjeevani AB-HWC’, an assisted provider-to-provider service operationalized through health and wellness centres (HWCs), and (ii) ‘eSanjeevani OPD’, a direct-to-patient service for those with internet access [17–19]. The assisted model uses a hub-and-spoke architecture that connects Ayushman Arogya Mandirs (AAMs) and PHCs (spokes) to doctors at secondary or tertiary hospitals (hubs). Both services are integrated into the Ayushman Bharat Digital Mission (ABDM), allowing users to generate Ayushman Bharat Health Accounts (ABHA) and maintain longitudinal digital health records [16–18].
The COVID-19 pandemic significantly accelerated eSanjeevani’s adoption, prompting the release of national telemedicine guidelines by the National Medical Commission, Ministry of Health and Family Welfare, and NITI Aayog [20]. By September 2023, the platform had been implemented across all 28 states and 8 union territories (UTs), with >160 million consultations completed. eSanjeevani addresses a range of health needs, including acute conditions such as fever, headache, gastritis, diarrhoea and chronic diseases like diabetes and hypertension. In March 2023, the rollout of ‘eSanjeevani 2.0’ introduced enhanced features, including audio-video stability, prescription synchronization and improved integration with electronic health records. A comparative study in Haryana found that version 2.0 improved consultation quality and patient satisfaction [21].
Globally, other telemedicine platforms such as Doxy.me in the USA and national platforms in China and Europe expanded rapidly during the COVID-19 pandemic. However, these initiatives have largely operated through private or institutional systems with narrower reach. In the USA, platforms primarily catered to insured urban populations [22], while China’s services were predominantly hospital based and inpatient focussed [23, 24]. In contrast, eSanjeevani provides free outpatient consultations within a government-funded framework and is fully integrated with India’s public health system and national digital health infrastructure [25–29]. As of November 2024, eSanjeevani had facilitated >276 million teleconsultations, making it the largest documented government-led telemedicine initiative globally [28].
Despite its scale and significance, few studies have rigorously analysed the adoption and utilization of eSanjeevani using nationally representative programme data. This study addresses that gap through a descriptive quantitative analysis of aggregated programmatic data from the C-DAC, assessing adoption through trends in state-level rollout and operational infrastructure (active hubs, spokes and registered medical practitioners) and examining utilization patterns by analysing consultation volumes, patient demographics and diagnostic categories from November 2019 to September 2023. In doing so, it contributes to the growing evidence base on how government-led digital health initiatives can improve access and equity in low- and middle-income countries.
eSanjeevani workflow
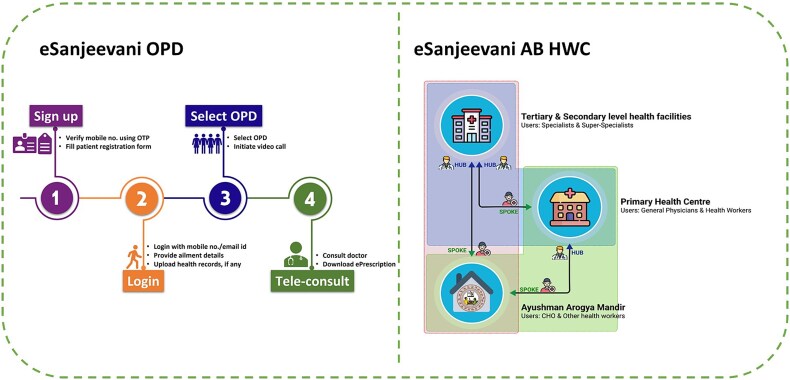
The eSanjeevani platform operates through two distinct but complementary service delivery models: ‘eSanjeevani OPD’ and ‘eSanjeevani AB-HWC’ (Fig. 1). Together, they enable access to outpatient care for both digitally connected users and populations requiring assisted support at the primary care level.
Figure 1.
Workflow diagram of eSanjeevani OPD and eSanjeevani AB-HWC
eSanjeevani OPD is a direct-to-patient telemedicine service designed for individuals with internet-enabled devices. Patients register online, complete a short intake form, and optionally upload previous prescriptions or reports. They then select an available outpatient department and wait in a virtual queue. Once connected, a government-registered medical practitioner conducts a video consultation, reviews patient inputs and issues an e-prescription. This model is particularly suited for follow-up visits and mild conditions requiring remote care.
eSanjeevani AB-HWC follows an assisted provider-to-provider model and is deployed through a hub-and-spoke system. At the spoke site—typically a HWC, also called an Ayushman Arogya Mandir—a community health officer (CHO) conducts an initial patient assessment. If further medical input is needed, the CHO facilitates a teleconsultation with a doctor located at a hub facility such as a district or subdistrict hospital. Depending on the case, patients can be further referred to higher levels of care, forming a digitally enabled referral pathway. This model is tailored for rural and underserved populations with limited digital access or health literacy.
MATERIALS AND METHODS
This study presents a quantitative analysis of the adoption and utilization of the eSanjeevani telemedicine platform between November 2019 and September 2023. The analysis is based on secondary programmatic data provided by the C-DAC, which manages the national backend for India’s telemedicine system. The dataset includes monthly platform-level aggregates and summary statistics on user demographics and presenting conditions.
Data on operational indicators such as the number of active hubs, spokes and registered medical practitioners (RMPs) were shared monthly and disaggregated by state and platform (eSanjeevani AB-HWC and eSanjeevani OPD). In addition, C-DAC provided summary statistics on patient gender, age group and diagnosis categories. These statistics were not based on individual consultations but were presented as aggregates for the entire platform and specific time periods. Data sources for this paper are described in Table 1.
Table 1.
Data sources used in the study
| Data type | Source | Period | Disaggregation/format |
|---|---|---|---|
| Total consultations (by platform/state) | C-DAC, Government of India | Monthly November 2019–September 2023 | State, platform |
| Summary statistics on age and gender | C-DAC aggregated summaries | Cumulative and periodic | Age groups, gender proportions |
| Diagnosis category summaries | C-DAC aggregated summaries | Cumulative and periodic | Top conditions (coded summaries) |
| Service delivery infrastructure | C-DAC programme dashboards | Monthly | Hubs, spokes, active RMPs |
Descriptive analysis and trend summaries were conducted using Microsoft Excel. Consultation volumes were grouped into calendar quarters—Q1 (January–March), Q2 (April–June), Q3 (July–September) and Q4 (October–December)—to assess patterns over time. The study focuses on identifying key trends in service expansion, demographic patterns of utilization and frequently addressed conditions. All data used were aggregate in nature, and no patient-level or identifiable health information was accessed or analysed. This methodology enables a descriptive understanding of eSanjeevani’s scale-up, its demographic reach and its service delivery patterns using the most comprehensive programmatic data available.
This methodology enables a descriptive understanding of eSanjeevani’s scale-up, its demographic reach and its service delivery patterns using the most comprehensive programmatic data available. The study was designed as non-human subjects research using only aggregate, de-identified data obtained from the C-DAC, which manages the national backend for India’s eSanjeevani telemedicine system, and as permitted under data privacy and policy guidelines of the Ministry of Health and Family Welfare. No individual-level data, personally identifiable information or health records were accessed or analysed. The researchers did not interact with any patients or providers, nor did they intervene in healthcare delivery. The analysis is entirely based on secondary programmatic data (e.g. monthly aggregates, demographic summaries, top diagnoses) already compiled for administrative purposes. There is no linkage to any other datasets that could re-identify individuals. As such, the study did not require institutional ethics review or informed consent.
RESULTS
Adoption of eSanjeevani—summary statistics (November 2019 to September 2023)
This section presents descriptive findings on the adoption and utilization of the eSanjeevani platform across India’s 28 states and 8 UTs. It includes analysis of teleconsultation volumes, platform-wise distribution (eSanjeevani AB-HWC and eSanjeevani OPD), demographic characteristics (age and gender), state-level patterns and the scale-up of implementation infrastructure, including hubs, spokes and registered medical practitioners.
Number of states/UTs adopting eSanjeevani
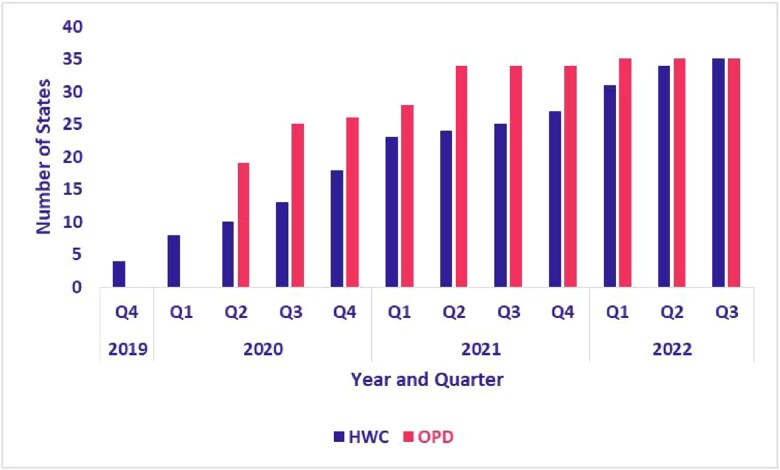
Between November 2019 and August 2023, the adoption of the eSanjeevani platform expanded across Indian states and UTs. The assisted provider-to-provider model (eSanjeevani AB-HWC) was operational in four states and UTs at the end of 2019 and expanded to 28 states and 7 UTs by the third quarter of 2022. By 2022, the eSanjeevani platform had been adopted by 108 840 of India’s 139 389 registered AB-HWCs. State-level data on the proportions of operational AB-HWCs are provided in Table 2. The direct-to-patient model (eSanjeevani OPD), launched in early 2020, was available in 19 states and UTs by the second quarter of 2020 and reached 28 states and 7 UTs by the first quarter of 2022. As shown in Fig. 2, both models were adopted in nearly all states and UTs by August 2023.
Table 2.
Percentage of AB-HWC utilizing eSanjeevani platform by states and UTs
| State | Total AB-HWC (spokes) registered (as of 2022) | AB-HWC operational (as of 2022) | Percentage of AB-HWCs operational |
|---|---|---|---|
| Andaman and Nicobar Islands | 125 | 33 | 26.4% |
| Andhra Pradesh | 10 306 | 9990 | 96.9% |
| Arunachal Pradesh | 309 | 48 | 15.5% |
| Assam | 3592 | 2994 | 83.4% |
| Bihar | 11 433 | 9530 | 83.4% |
| Chandigarh | 59 | 47 | 79.7% |
| Chhattisgarh | 4853 | 3905 | 80.5% |
| Delhi | 0 | 0 | |
| Goa | 28 | 6 | 21.4% |
| Gujarat | 8642 | 7437 | 86.1% |
| Haryana | 1586 | 1125 | 70.9% |
| Himachal Pradesh | 1578 | 1075 | 68.1% |
| Jammu and Kashmir | 2472 | 1632 | 66.0% |
| Jharkhand | 2691 | 1555 | 57.8% |
| Karnataka | 9310 | 8065 | 86.6% |
| Kerala | 1248 | 868 | 69.6% |
| Ladakh | 268 | 150 | 56.0% |
| Lakshadweep | 10 | 8 | 80.0% |
| Madhya Pradesh | 10 421 | 8938 | 85.8% |
| Maharashtra | 11 089 | 8447 | 76.2% |
| Manipur | 262 | 224 | 85.5% |
| Meghalaya | 563 | 462 | 82.1% |
| Mizoram | 356 | 166 | 46.6% |
| Nagaland | 406 | 28 | 6.9% |
| Odisha | 5891 | 4863 | 82.5% |
| Puducherry | 111 | 63 | 56.8% |
| Punjab | 2686 | 1586 | 59.0% |
| Rajasthan | 9171 | 5594 | 61.0% |
| Sikkim | 174 | 155 | 89.1% |
| Tamil Nadu | 8054 | 6432 | 79.9% |
| Telangana | 5973 | 5895 | 98.7% |
| The DNH and DD | 97 | 94 | 96.9% |
| Tripura | 710 | 466 | 65.6% |
| Uttar Pradesh | 16 037 | 10 117 | 63.1% |
| Uttarakhand | 1380 | 896 | 64.9% |
| West Bengal | 7498 | 5946 | 79.3% |
| India | 139 389 | 108 840 | 78.1% |
Figure 2.
Adoption of eSanjeevani AB-HWC and OPD by states and UTs
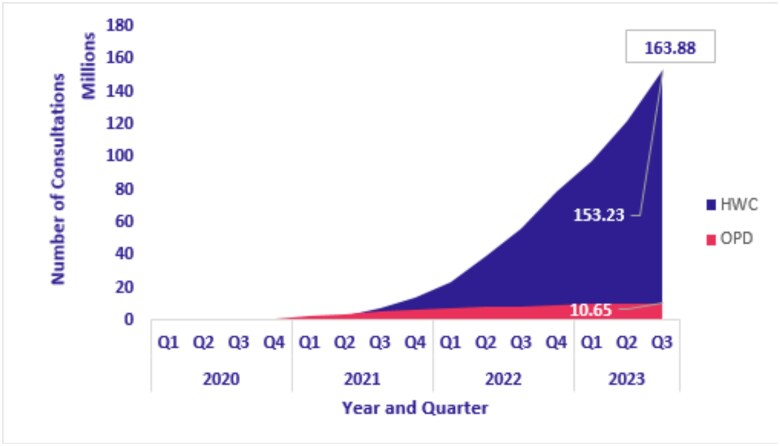
Figure 3 shows the cumulative number of teleconsultations conducted via eSanjeevani AB-HWC and eSanjeevani OPD from January 2020 to September 2023. Utilization increased steadily over time, with a sharp rise in eSanjeevani OPD consultations between Q2 2020 and Q3 2021, coinciding with the COVID-19 waves. In contrast, eSanjeevani AB-HWC displayed a more gradual, linear growth pattern throughout the period.
Figure 3.
Cumulative teleconsultations completed (eSanjeevani AB-HWC and OPD)
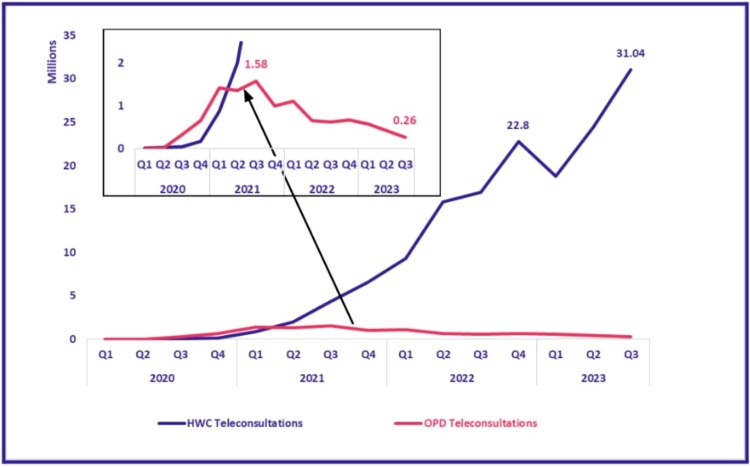
Figure 4 presents quarter-wise growth rates for each platform. eSanjeevani AB-HWC showed consistent quarterly increases, ranging from 7% to 398%, reflecting its phased integration into primary healthcare. eSanjeevani OPD experienced more volatile growth, with a 443% increase in 2021 alone, corresponding with pandemic-related demand surges. The two platforms exhibited distinct utilization patterns: steady uptake in the assisted model and event-driven peaks in the direct-to-patient model.
Figure 4.
Quarter-wise teleconsultations completed (eSanjeevani AB-HWC and OPD)
State-wise distribution
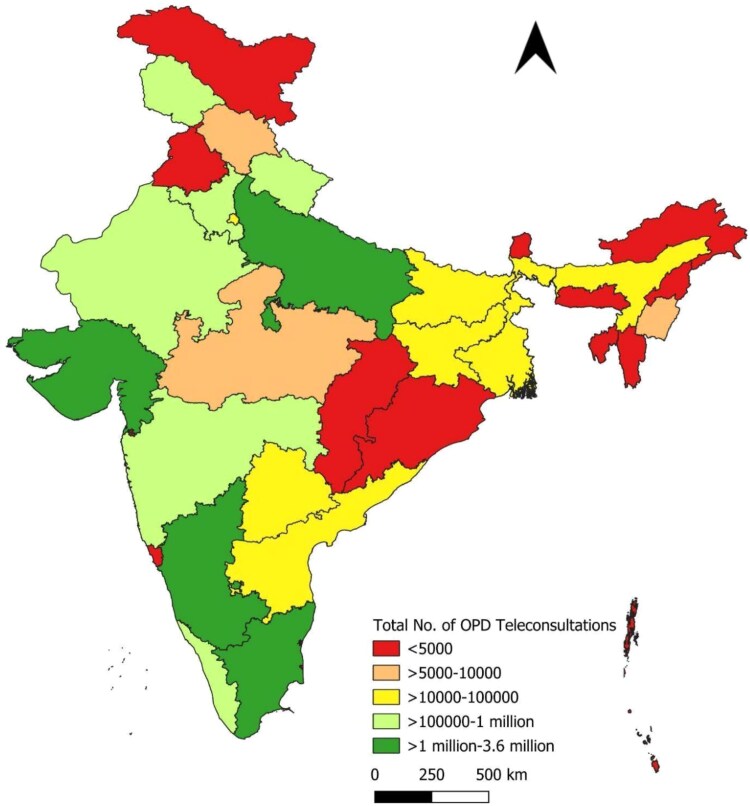
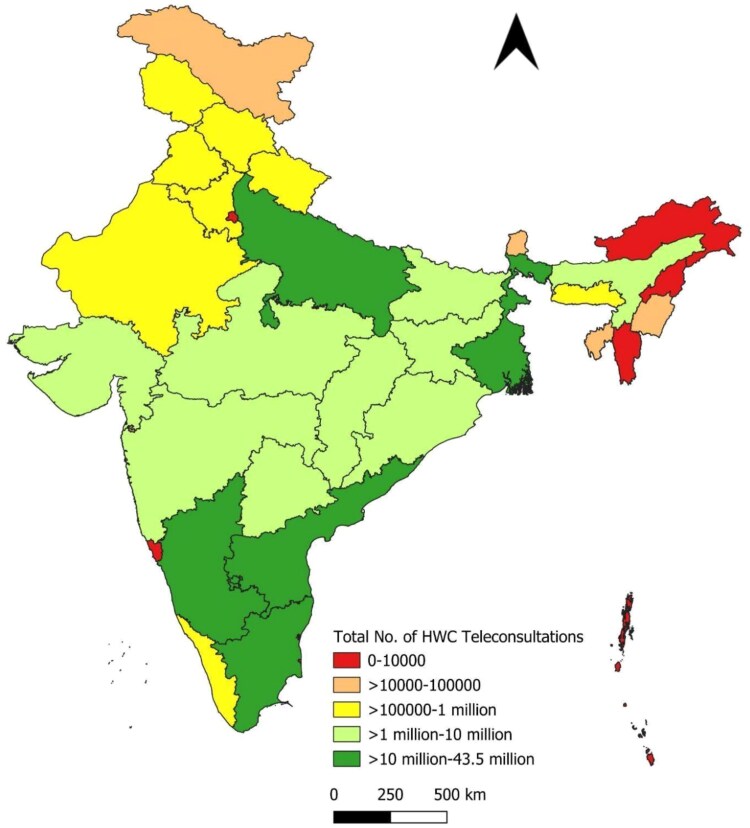
Figures 5, 6 and 7 and Table 3 present the distribution of teleconsultations across states from January 2020 to September 2023. A small number of states accounted for a disproportionately large share of total consultations. The top five contributors—Tamil Nadu, Uttar Pradesh, Madhya Pradesh, Karnataka and Andhra Pradesh—collectively accounted for ~70.6% of all teleconsultations conducted through eSanjeevani. These states also contributed the highest volumes across both platform models. This distribution likely reflects a combination of factors, including population size, service readiness and programmatic rollout timelines.
Figure 5.
State-wise distribution of eSanjeevani AB-HWC teleconsultations
Figure 7.
State-wise distribution of total teleconsultations
Table 3.
Top 5 states with the highest teleconsultations (January 2020–September 2023)
| S. no. | No. of total teleconsultations | No. of eSanjeevani AB-HWC teleconsultations | No. of eSanjeevani OPD teleconsultations |
|---|---|---|---|
| 1 | Andhra Pradesh—43 499 765 | Andhra Pradesh—43 465 307 | Karnataka—3 678 203 |
| 2 | West Bengal—22 868 786 | West Bengal—22 856 605 | Uttar Pradesh—1 830 597 |
| 3 | Tamil Nadu—21 531 609 | Tamil Nadu—19 784 090 | Tamil Nadu—1 747 519 |
| 4 | Karnataka—14 754 405 | Karnataka—11 076 202 | Gujarat—1 014 158 |
| 5 | Uttar Pradesh—12 267 662 | Uttar Pradesh—10 437 065 | Uttarakhand—848 230 |
Figure 6.
State-wise distribution of eSanjeevani OPD teleconsultations
Expansion of eSanjeevani hubs and spokes
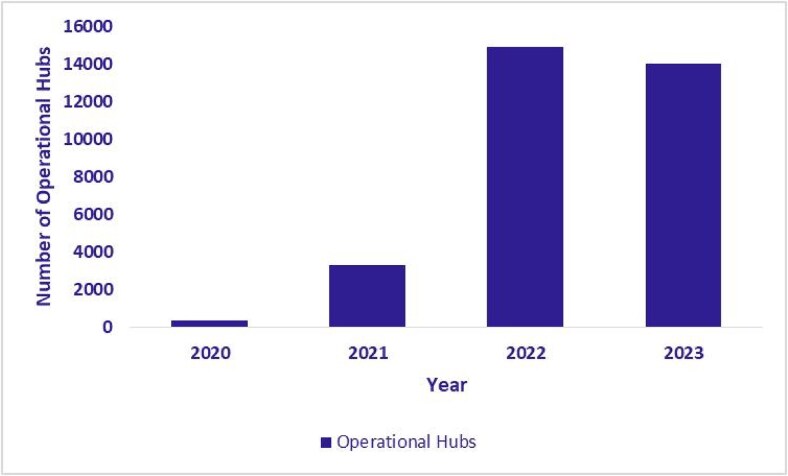
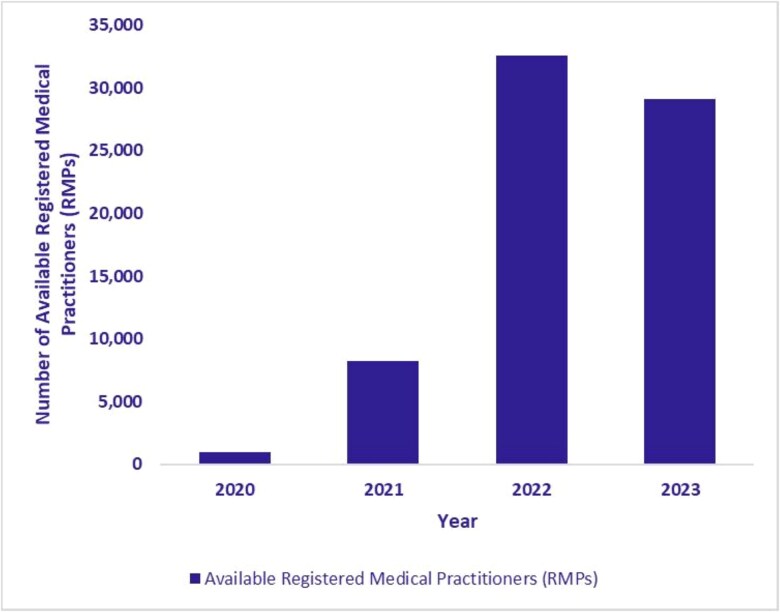
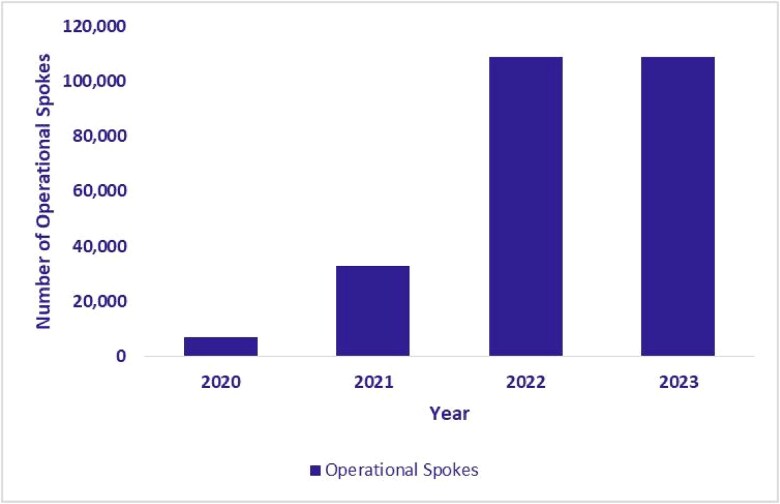
The expansion of the eSanjeevani platform was directly accompanied by a corresponding increase in its service delivery infrastructure. As illustrated in Figs. 8, 9 and 10, the number of operational hubs (secondary or tertiary facilities providing remote consultations) increased from 397 in 2020 to 14 036 by September 2023. The number of spokes, which primarily include HWCs implementing eSanjeevani AB-HWC, grew from 6868 in 2020 to 108 610 during the same period. In addition, the number of RMPs who had provided at least one consultation (in a year) via the platform reached 29 114 by September 2023. These figures reflect a substantial expansion of telemedicine infrastructure across primary and higher-level facilities.
Figure 8.
Growth in operational hubs (January 2020–September 2023)
Figure 10.
Number of available registered medical practitioners (RMPs) (January 2020–September 2023)
Figure 9.
Growth in operational spokes (January 2020–September 2023)
Telemedicine utilization by gender
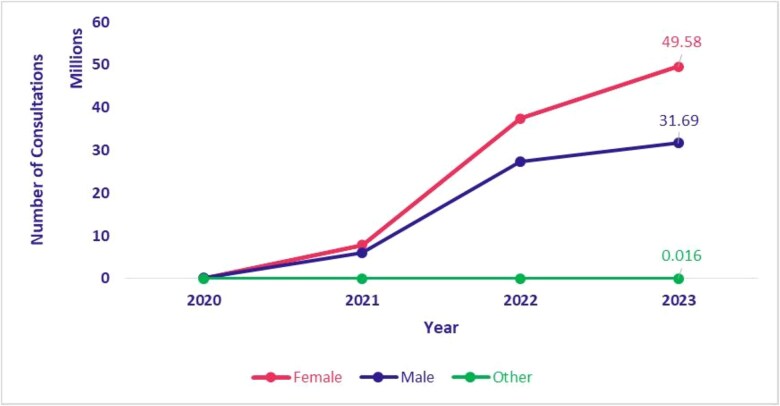
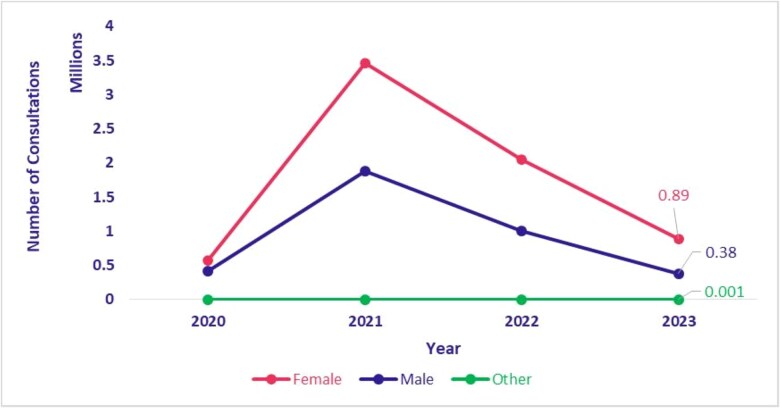
Figures 11 and 12 present the distribution of teleconsultations conducted through eSanjeevani AB-HWC and eSanjeevani OPD from 2020 to 2023, disaggregated by gender. A notable trend is the consistently higher utilization of services by women. In eSanjeevani AB-HWC, female clients accounted for 59.8% (155 903 consultations) compared to 40.2% (104 720 consultations) by male clients in 2020. In subsequent years, the share of female consultations remained stable, ranging between 56.9% and 57.7%. In eSanjeevani OPD, women’s share of teleconsultations increased from 57.6% (567 827 consultations) in 2020 to 70.1% (885 811 consultations) in 2023. During the same period, men’s share declined from 42.4% (417 628 consultations) to 29.8% (376 947 consultations), indicating an increase in proportion of teleconsultations for women.
Figure 11.
eSanjeevani OPD utilization by gender (April 2020–September 2023)
Figure 12.
eSanjeevani AB-HWC utilization by gender (January 2020–September 2023)
Telemedicine utilization by age
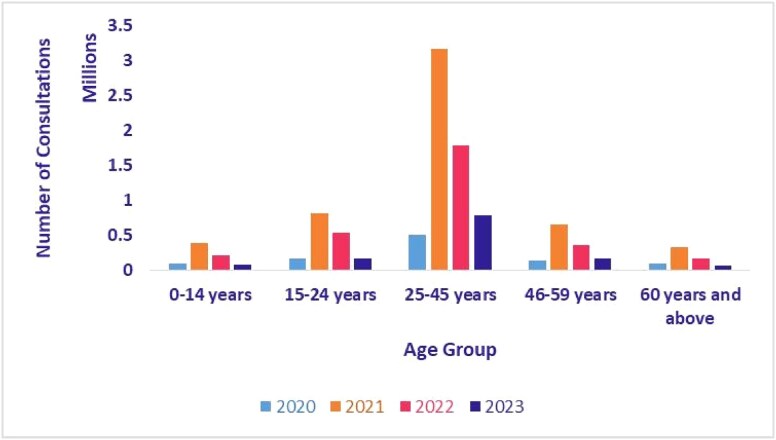
Figures 13 and 14 show the age distribution of teleconsultations on eSanjeevani AB-HWC and eSanjeevani OPD from 2020 to 2023. In both platforms, users aged 25–45 consistently made up the largest share of consultations. In eSanjeevani AB-HWC, this group accounted for 36.7% of consultations in 2020 and rose to >42% by 2023. In eSanjeevani OPD, the same group represented more than half of all consultations each year, increasing from 50.7% in 2020 to 62.2% in 2023. Children (0–14 years) and older adults (60+ years) used the platform less, though their usage also increased in 2021.
Figure 13.
Age-wise teleconsultation—eSanjeevani AB-HWC (April 2020–September 2023)
Figure 14.
Age-wise teleconsultation—eSanjeevani OPD (April 2020–September 2023)
Telemedicine utilization by health conditions
Table 4 presents the top 10 diagnoses in eSanjeevani OPD, dominated by acute conditions such as common cold, fever and headache. In cases where multiple symptoms coexisted (e.g. diarrhoea, vomiting and fever), each diagnosis was recorded as a separate entry. Table 5 presents the most frequently reported health conditions in eSanjeevani AB-HWC across versions 1.0 and 2.0. While common cold, fever and headache remained among the top consultations, version 2.0 shows increased usage for chronic disease management, particularly for follow-up for diabetes and hypertension (The platform did not employ standardized diagnostic coding systems (e.g. ICD-10 or SNOMED CT), and the aggregated data do not distinguish between single and coexisting diagnoses.).
Table 4.
Top 10 diagnoses with highest teleconsultations, eSanjeevani OPD (April 2020–September 2023)
| eSanjeevani OPD | ||
|---|---|---|
| S. no. | Diagnosis name | Number of teleconsultations |
| 1 | Common cold | 1 268 185 |
| 2 | Fever | 1 060 580 |
| 3 | Headache | 6 53 923 |
| 4 | Backache | 3 15 489 |
| 5 | Abdominal pain | 2 29 671 |
| 6 | Myalgia | 1 80 153 |
| 7 | Gastritis | 1 69 973 |
| 8 | Vomiting | 1 21 366 |
| 9 | Joint pain | 83 414 |
| 10 | Toothache | 79 488 |
Table 5.
Top 10 diagnoses with highest teleconsultations, eSanjeevani AB-HWC 1.0 and 2.0 (January 2020–September 2023)
| eSanjeevani AB-HWC 1.0 (January 2020 to February 2023) | eSanjeevani AB-HWC 2.0 (March 2023–September 2023) | |||
|---|---|---|---|---|
| Diagnosis | No. of teleconsultations | Diagnosis Name | No. of teleconsultations | |
| 1 | Common cold | 7 720 104 | Common cold | 4 231 930 |
| 2 | Fever | 6 454 433 | Fever | 3 640 890 |
| 3 | Headache | 5 356 335 | Headache | 2 857 760 |
| 4 | Gastritis | 2 590 654 | Gastritis | 2 146 458 |
| 5 | Backache | 2 048 108 | Joint pain | 1 927 494 |
| 6 | Generalized body pain | 19 163 44 | Abdominal pain | 5 43 683 |
| 7 | Diarrhoea | 1 715 612 | Weakness | 3 87 095 |
| 8 | Abdominal pain | 1 659 784 | Diabetes mellitus | 3 27 491 |
| 9 | Vomiting | 1 520 477 | Vomiting | 2 79 709 |
| 10 | Joint pain | 1 487 660 | Hypertension | 2 71 253 |
A total of 327 491 consultations related to follow-up for diabetes mellitus were recorded. These were primarily follow-up consultations, with diagnoses typically established during in-person visits at public health facilities using confirmatory tests such as HbA1c. eSanjeevani AB-HWC was used to monitor disease progression, manage medication adherence or address complications. Although the data suggest continuity of care, repeat visit counts could not be confirmed, as beneficiary-level data were not available (As the analysis is based on summary statistics provided by C-DAC, individual consultation records and clinical histories were not available for further disaggregation.).
Average time of teleconsultation
As per figures reported by the C-DAC, the national average duration of an eSanjeevani teleconsultation was ~1 min and 15 s as of September 2023. This measure reflects only the active interaction time between the doctor and the patient on the telemedicine platform. It does not capture waiting time before the consultation or the total turnaround time for a case, which may also include reviewing patient records, diagnostic reports or completing documentation. Disaggregated figures by state, platform type or case category were not available.
DISCUSSION
This study examines national trends from the early implementation period of eSanjeevani, India’s public-sector telemedicine platform. Between January 2020 and September 2023, the platform delivered >163 million consultations, of which >93% of consultations were delivered through the provider-assisted eSanjeevani AB-HWC model, indicating its central role in the platform’s overall utilization. Adoption extended across all 28 states and 8 UTs, with a few early-implementing states accounting for a substantial share of consultations. Women constituted the majority of users across both platforms, and the 25–45-year age group accounted for the highest share of consultations. While acute conditions such as fever and common cold remained prevalent (Table 4), use for chronic conditions, particularly diabetes and hypertension, also increased in version 2.0 of eSanjeevani AB-HWC, indicating evolving patterns in service use over time.
The rise and later decline in eSanjeevani OPD usage reflect heightened demand for remote consultations during the COVID-19 pandemic [19], followed by a return to in-person services. In contrast, eSanjeevani AB-HWC continued to grow steadily, aligning with its phased integration into HWCs [16]. Increased use for chronic disease management, like in the case of diabetes follow-ups, coincided with the availability of version 2.0 [21] and its compatibility with point-of-care devices. However, due to the absence of individual-level identifiers, it is not possible to determine whether these consultations represent first-time visits for symptom presentation or follow-up care after an initial diagnosis.
During the COVID-19 pandemic, several Indian states, notably Tamil Nadu, Andhra Pradesh and Karnataka, were among the states with early high uptake of eSanjeevani telemedicine, showing large numbers of consultations. These trends coincide with efforts in many states to train health personnel, deploy telemedicine platforms and expand digital health ecosystems. [29–31]. Supportive policy frameworks have been essential to eSanjeevani’s early expansion. The release of the National Telemedicine Guidelines [20], integration with Ayushman Bharat Digital Mission [16, 18], and government prioritization during the pandemic created enabling conditions for programme growth. The introduction of eSanjeevani 2.0 in 2023 further strengthened the platform by improving audio-video stability, record synchronization and point-of-care integration [21]. Awareness campaigns and state-level engagement also contributed to user uptake.
The higher utilization among women is notable, given persistent digital access and mobility constraints [32]. It may reflect how the assisted model (delivered through CHOs at HWCs) reduces barriers to access. These patterns are observed in aggregate trends and further studies are needed to explore the mechanisms driving gendered engagement with telemedicine, including perceptions of care, digital literacy and household decision-making. The data analysed in this paper are unable to capture how gender intersects with rurality, caste, socioeconomic status or geography in shaping access. Prior evidence suggests that digital gender gaps, smartphone restrictions and limited mobility may still prevent marginalized women from independently accessing telemedicine, particularly in northern states with stricter norms around female autonomy [32]. Future studies should explore intersectional barriers to telemedicine uptake by combining user-level data with qualitative insights, disaggregating patterns by gender, rural/urban status and state-specific norms. Such analysis would help identify subgroups that are underrepresented despite high overall usage, guiding more equitable service design.
Despite its reach, eSanjeevani faces several challenges common to digital health interventions. Teleconsultation uptake is shaped by digital infrastructure, smartphone ownership and internet connectivity—factors that remain limited in rural and low-income communities. Only 38% of Indian households are considered digitally literate, with wide rural–urban and gender gaps [32]. The eSanjeevani AB-HWC model helps bridge these gaps through CHO-assisted consultations; however, barriers remain, including long waiting times [33], platform navigation issues and limited availability of medical officers for real-time consultations. Gender norms in some areas—such as restrictions on women’s mobile phone usage—also impact access [32]. Some states have piloted mitigation strategies, such as deploying dedicated telemedicine practitioners or establishing public–private partnerships to supplement provider availability [34]. These models merit further evaluation to assess scalability and sustainability.
This analysis is based on programme-level summary data shared by the C-DAC, which manages the backend infrastructure for eSanjeevani [15]. Individual-level data were not accessible, and for this period of assessment the platform does not track beneficiaries through unique identifiers like ABHA (The Ayushman Bharat Health Account (ABHA) is a unique 14-digit health ID issued under India’s Ayushman Bharat Digital Mission (ABDM). It enables individuals to link and access their health records across public and private health systems through a secure, consent-based digital platform.) accurately. As a result, it was not possible to determine the number of unique users, measure per capita coverage, or distinguish between new and repeat consultations. This limits the ability to assess care continuity or patient-level outcomes. However, secondary evidence from a detailed state-level implementation study in Jharkhand provides further insight into user engagement and service quality on the eSanjeevani platform. Between May 2021 and March 2022, the telemedicine service recorded a 1000-fold increase in utilization, growing from 50 to >50 000 consultations per month. Treatment compliance was reported at 96.5% among those who received a prescription or medical advice, and 88% of patients were able to access medicines at their HWC. Notably, 31% of surveyed clients reported using the platform more than once, indicating early signs of repeat engagement and platform stickiness. Patient-reported outcomes also indicated a high rate of self-reported recovery: 60% fully recovered and 25% partially recovered from their health problems following a teleconsultation. These findings from Jharkhand, though subnational, reinforce the potential of eSanjeevani to deliver consistent, acceptable and reusable outpatient care in low-resource settings when embedded within primary healthcare infrastructure. [35]
Limitations
This study has several important limitations that should be acknowledged when interpreting the findings. First, our analysis is based exclusively on secondary, aggregate and de-identified data provided by the C-DAC. The data were compiled primarily for administrative and programme monitoring purposes, not for research, which constrains what can be inferred about individual behaviour, quality of care or service delivery nuances.
Second, the aggregated nature of the data means that we lack consultation-level records, and particularly state-wise gender distributions, or the ability to link gender with specific presenting diagnoses. As a result, we cannot determine whether observed gender differentials in usage are driven by differences in health condition burden, access or health-seeking behaviour.
Third, we were unable to analyse the duration of consultations by condition (acute vs. chronic) or assess other time-related metrics such as waiting times or provider turnaround. Such metrics could be informative about quality, intensity and patient satisfaction but were not available in our data sources.
Fourth, data on the infrastructure and resource differences across states (e.g. the number and training levels of CHOs, readiness of digital systems or internet connectivity) are not available in the dataset. Therefore, statements about states with stronger digital infrastructure and faster uptake rely on inference rather than direct measurement.
Finally, because the data cover national and state aggregates, we cannot assess causality—whether stronger infrastructure ‘caused’ higher adoption or whether other factors (political leadership, funding, population density, etc.) played major roles. There may also be reporting delays, differences in how states define or record consultations, and variation in data completeness.
The reliance on aggregate, non–individual-level data may bias interpretation towards overestimating acute conditions, which are more likely to prompt one-time consultations, while underrepresenting continuity of care for chronic illnesses. Without tracking repeat visits or patient identifiers, it is also not possible to assess user retention or treatment completion. As a result, trends may reflect service contact volume rather than sustained healthcare engagement. Furthermore, the system does not use standardized diagnostic coding (e.g. ICD-10 or SNOMED CT), and it is unclear whether coexisting symptoms (e.g. fever, diarrhoea, vomiting) were recorded independently or as a composite. Facility classification is also limited as many different types of facilities (e.g. AAMs, PHCs, SCs) were grouped under HWCs in the available data. Only one state-level qualitative report was available to triangulate findings, limiting the interpretability of user experience and provider behaviour.
These limitations reflect the current design of national-level monitoring systems rather than data quality concerns. As the programme integrates with ABDM and ABHA-linked infrastructure, future evaluations should leverage individual identifiers to assess follow-up behaviour, treatment outcomes and service delivery equity. In the interim, facility-based studies and surveys can complement aggregate monitoring with more detailed evidence.
While this paper focusses on teleconsultation volumes and trends, it does not assess how eSanjeevani integrates with downstream elements of primary care—such as access to medicines, diagnostics or in-person referrals. Understanding whether patients are able to complete treatment plans initiated remotely remains a critical gap. Future evaluations should examine how telemedicine platforms interface with supply chains, referral systems and physical follow-up services to ensure continuity and effectiveness of care beyond the consultation itself.
CONCLUSION
eSanjeevani represents a significant government-led initiative to expand access to outpatient care through telemedicine in India. Its early implementation shows strong uptake across all states and UTs, with the provider-assisted eSanjeevani AB-HWC model emerging as the dominant mode of delivery. The platform has demonstrated potential to support both acute and chronic care management, particularly in rural settings where physical access to doctors is limited.
However, realizing its full potential will depend on addressing current system limitations, including the lack of individual-level tracking, diagnostic standardization and real-time analytics. As eSanjeevani continues to evolve, its integration into comprehensive primary care beyond minor ailments will be essential. Ensuring digital equity, provider availability and robust data systems will be key to improving both reach and quality of care. With continued investment in monitoring, evaluation and infrastructure, eSanjeevani offers a replicable model for scaled public-sector telemedicine in low- and middle-income countries.
ACKNOWLEDGEMENTS
We are grateful to the National eSanjeevani telemedicine services, C-DAC Team and Intelehealth programs team for supporting data collection and analysis to carry out this research work.
Contributor Information
Sanjay Sood, Centre for Development of Advanced Computing A-34, Phase-VIII, Industrial Area, Mohali, Punjab-160071, India.
Kanhaiya Lal, Centre for Development of Advanced Computing A-34, Phase-VIII, Industrial Area, Mohali, Punjab-160071, India.
Madhu Bhatia, Centre for Development of Advanced Computing A-34, Phase-VIII, Industrial Area, Mohali, Punjab-160071, India.
Gagandeep Kapoor, Centre for Development of Advanced Computing A-34, Phase-VIII, Industrial Area, Mohali, Punjab-160071, India.
Sumandeep Singh, Centre for Development of Advanced Computing A-34, Phase-VIII, Industrial Area, Mohali, Punjab-160071, India.
Rajesh Kr Kaushish, Centre for Development of Advanced Computing A-34, Phase-VIII, Industrial Area, Mohali, Punjab-160071, India.
Davinder Bisht, Centre for Development of Advanced Computing A-34, Phase-VIII, Industrial Area, Mohali, Punjab-160071, India.
Vijay Kumar Sharma, Centre for Development of Advanced Computing A-34, Phase-VIII, Industrial Area, Mohali, Punjab-160071, India.
Suchandrima Chakraborty, Intelehealth, Office 1407, Solus Business park, Hiranandani Estate, Thane (W) Maharashtra, 400607, India.
Mahesh Shete, Intelehealth, Office 1407, Solus Business park, Hiranandani Estate, Thane (W) Maharashtra, 400607, India.
Nitin Kumar Solanki, Intelehealth, Office 1407, Solus Business park, Hiranandani Estate, Thane (W) Maharashtra, 400607, India.
Aditya Naskar, Intelehealth, Office 1407, Solus Business park, Hiranandani Estate, Thane (W) Maharashtra, 400607, India.
Mayank Sharma, Intelehealth, Office 1407, Solus Business park, Hiranandani Estate, Thane (W) Maharashtra, 400607, India.
Elakeya Udhaya Subramaniyan, Intelehealth, Office 1407, Solus Business park, Hiranandani Estate, Thane (W) Maharashtra, 400607, India.
Shekhar Waikar, Intelehealth, Office 1407, Solus Business park, Hiranandani Estate, Thane (W) Maharashtra, 400607, India.
Neha Verma, Intelehealth, Office 1407, Solus Business park, Hiranandani Estate, Thane (W) Maharashtra, 400607, India.
AUTHORS’ CONTRIBUTIONS
Sanjay Sood (Conceptualization [equal], Data curation [equal], Formal analysis [equal], Methodology [equal], Project administration [equal], Software [equal], Supervision [equal], Writing—original draft [equal], Writing—review & editing [equal]), Kanhaiya Lal (Data curation [equal], Investigation [equal], Software [equal]), Madhu Bhatia (Data curation [equal], Investigation [equal], Software [equal]), Gagandeep Kapoor (Data curation [equal], Investigation [equal], Software [equal]]), Sumandeep Singh (Data curation [equal], Investigation [equal], Software [equal]), Rajesh Kr Kaushish (Data curation [equal], Software [equal]), Davinder Bisht (Data curation [equal], Software [equal]), Vijay Kumar Sharma (Data curation [equal], Software [equal]), Suchandrima Chakraborty (Conceptualization [equal], Formal analysis [equal], Methodology [equal], Project administration [equal], Supervision [equal], Visualization [equal], Writing—review & editing [equal]), Mahesh Shete (Data curation [equal], Investigation [equal], Methodology [equal], Visualization [equal], Writing—original draft [equal], Writing—review & editing [equal]), Nitin Kumar Solanki (Project administration [equal]), Aditya Naskar (Data curation [equal], Investigation [equal], Methodology [equal], Writing—review & editing [equal]), Mayank Sharma (Data curation [equal], Formal analysis [equal], Investigation [equal], Visualization [equal], Writing—original draft [equal], Writing—review & editing [equal]), Elakeya Udhaya Subramaniyan (Formal analysis [equal], Visualization [equal], Writing—original draft [lead], Writing—review & editing [equal]), Shekhar Waiker (Formal analysis [equal], Project administration [equal], Supervision [equal], Writing—review & editing [equal]), and Neha Verma (Conceptualization [equal], Methodology [equal], Project administration [equal], Supervision [equal], Writing—review & editing [equal])
CONFLICT OF INTEREST
None declared.
STUDY FUNDING
None declared.
APC FUNDING
None declared.
DATA AVAILABILITY
The data underlying this article cannot be shared publicly due to restrictions imposed by the Government of India on patient-level and provider-level health records. In compliance with the Digital Personal Data Protection (DPDP) Act, 2023, health data are considered sensitive personal data and cannot be shared with non-governmental entities without explicit authorization, in order to protect the privacy of individuals and prevent re-identification. The dataset used for this analysis was provided in aggregate and de-identified form by the Centre for Development of Advanced Computing (C-DAC) under the Ministry of Health and Family Welfare, solely for research purposes. The data may be shared in aggregated form on reasonable request to the corresponding author, subject to necessary approvals from the relevant authorities.
ETHICS AND CONSENT
The research utilized secondary data sources from the Centre for Development of Advanced Computing (C-DAC), along with C-DAC reports, white papers, and government and Intelehealth reports. This study involved the analysis of de-identified secondary data and did not directly involve human participants. The central data management team ensured that all data were anonymized and handled with strict confidentiality to maintain the privacy and integrity of the information. The research adheres to the ethical guidelines and principles for research involving data analysis and complies with the standards of data protection and privacy.
DECLARATION OF AI IN THE WRITING PROCESS
During the preparation of this work, the authors used ChatGPT to improve the readability and follow the word count. After using this tool/service, the authors reviewed and edited the content as needed and took full responsibility for the content of the published article.
References
- 1. Tracking Universal Health Coverage: 2023 Global Monitoring Report. Geneva: World Health Organization and International Bank for Reconstruction and Development / The World Bank; 2023. https://www.who.int/publications/i/item/9789240080379 [Google Scholar]
- 2. Karan A, Negandhi H, Nair R et al. Composition and distribution of human resource for health in India: new estimates using National Sample Survey and Registry data. BMJ Open 2019;9:e025979. [DOI] [PMC free article] [PubMed] [Google Scholar]
- 3.World Health Organization. World Health Statistics 2016: Monitoring Health for the SDGs, Sustainable Development Goals. Geneva: World Health Organization; 2016. https://www.who.int/publications/i/item/9789241565264
- 4.Press Information Bureau, Government of India. Government Has Taken Multiple Steps to Further Increase Availability of Doctors in the Country [Press Release]. New Delhi: Press Information Bureau; 2022. https://pib.gov.in/Pressreleaseshare.aspx?PRID=1845081 [Google Scholar]
- 5. Kumar R, Pal R. India achieves WHO recommended doctor population ratio: a call for paradigm shift in public health discourse! J Family Med Prim Care 2018;7:841–4. [DOI] [PMC free article] [PubMed] [Google Scholar]
- 6. Office of the Registrar General & Census Commissioner, India . Rural-Urban Distribution of Population [Census of India 2011 Data]. New Delhi: Government of India; 2011. https://censusindia.gov.in/nada/index.php/catalog/42617
- 7. Ministry of Health and Family Welfare, Government of India . Rural Health Statistics 2020–21. New Delhi: Government of India; 2022. https://www.mohfw.gov.in/sites/default/files/rhs20-21_2.pdf [Google Scholar]
- 8. India State-Level Disease Burden Initiative Collaborators, Dandona L, Dandona R et al. Nations within a nation: variations in epidemiological transition across the states of India, 1990-2016 in the Global Burden of Disease Study. Lancet 2017;390:2437–60. [DOI] [PMC free article] [PubMed] [Google Scholar]
- 9. Prabhakaran D, Jeemon P, Sharma M et al. The changing patterns of cardiovascular diseases and their risk factors in the states of India: the Global Burden of Disease Study 1990-2016. Lancet Glob Health 2018;6:e1339–51. [DOI] [PMC free article] [PubMed] [Google Scholar]
- 10. Lahariya C, Mishra S, Daniel RA et al. Prevention and control of cardiovascular diseases in India needs a strengthened and well-functioning primary health care system: a narrative review. J Med Evid 2021;2:140–6. [Google Scholar]
- 11. Ramani S, Sivakami M. Community perspectives on primary health centers in rural Maharashtra: what can we learn for policy? J Family Med Prim Care 2019;8:2837–44. [DOI] [PMC free article] [PubMed] [Google Scholar]
- 12. National Health Systems Resource Centre . Operational Guidelines for Comprehensive Primary Health Care through Health and Wellness Centers. New Delhi: Ministry of Health and Family Welfare, Government of India; 2021. https://nhsrcindia.org/node/736 [Google Scholar]
- 13. Van Weel C, Kidd MR. Why strengthening primary health care is essential to achieving universal health coverage. Can Med Assoc J 2018;190:E463–6. [DOI] [PMC free article] [PubMed] [Google Scholar]
- 14. Sood S, Mbarika V, Jugoo S et al. What is telemedicine? A collection of 104 peer-reviewed perspectives and theoretical underpinnings. Telemed J E Health 2007;13:573–90. [DOI] [PubMed] [Google Scholar]
- 15. World Health Organization . Building the Economic Case for Primary Health Care: A Scoping Review (WHO/HIS/SDS Report No. WHO/HIS/SDS/2018.48). Geneva: World Health Organization. 2018. https://www.who.int/publications/i/item/WHO-HIS-SDS-2018.48 [Google Scholar]
- 16. Press Information Bureau, Government of India . Union Health Ministry’s Telemedicine Service, eSanjeevani, Completes 6 Lakh Tele-consultations. New Delhi: Ministry of Health and Family Welfare, Government of India. 2020. https://pib.gov.in/pib.gov.in/Pressreleaseshare.aspx?PRID=1668071 [Google Scholar]
- 17.Centre for Development of Advanced Computing. Product Information: eSanjeevani National Telemedicine Service. Pune: Centre for Development of Advanced Computing; n.d. https://www.cdac.in/index.aspx?id=product_details&productId=eSanjeevaniNationalTelemedicineService [Google Scholar]
- 18. Sood SP, Bhatia JS. Development of telemedicine technology in India: “Sanjeevani”—an integrated telemedicine application. J Postgrad Med 2005;51:308–11. [PubMed] [Google Scholar]
- 19.Naithani C, Sood SP, Agrahari A. The Indian healthcare system turns to digital health: eSanjeevaniOPD as a national telemedicine service. Journal of Information Technology Teaching Cases, 2021;13:67–76. 10.1177/20438869211061575 (Original work published 2023). [DOI] [Google Scholar]
- 20. Ministry of Health and Family Welfare, Government of India . Telemedicine Practice Guidelines for Registered Medical Practitioners. New Delhi: Ministry of Health and Family Welfare, Government of India 2020. https://www.mohfw.gov.in/pdf/Telemedicine.pdf
- 21. Gupta R, Priya MP, Dash N et al. Evolution of India’s national teleconsultation platform e-Sanjeevani: a comparative analysis of versions 2.0 and 1.0, with a preliminary report from the state of Haryana. Health Technol 2025;15:153–60. [Google Scholar]
- 22. Dubin JM, Wyant WA, Balaji NC et al. Telemedicine usage among urologists during the COVID-19 pandemic: cross-sectional study. J Med Internet Res 2020;22:e21875. [DOI] [PMC free article] [PubMed] [Google Scholar]
- 23. Li P, Liu X, Mason E et al. How telemedicine integrated into China’s anti-COVID-19 strategies: case from a national referral center. BMJ Health Care Inform 2020;27:e100164. [DOI] [PMC free article] [PubMed] [Google Scholar]
- 24. Wang TT, Li JM, Zhu CR et al. Assessment of utilization and cost-effectiveness of telemedicine program in western regions of China: a 12-year study of 249 hospitals across 112 cities. Telemed J E Health 2016;22:909–20. [DOI] [PubMed] [Google Scholar]
- 25. Vogt EL, Welch BM, Bunnell BE et al. Quantifying the impact of COVID-19 on telemedicine utilization: retrospective observational study. Interact J Med Res 2022;11:e29880. [DOI] [PMC free article] [PubMed] [Google Scholar]
- 26. Nagaraja VH, Dastidar BG, Suri S et al. Perspectives and use of telemedicine by doctors in India: a cross-sectional study. Health Policy Technol 2024;13:100845. [Google Scholar]
- 27. Shardha HK, Kumar G, Sagar M et al. Perceptions of telemedicine among healthcare professionals in rural tertiary care hospitals of rural Sindh, Pakistan: a qualitative study. Ann Med Surg 2024;86:726–33. [DOI] [PMC free article] [PubMed] [Google Scholar]
- 28. Dastidar BG, Jani AR, Suri S et al. Reimagining India’s National Telemedicine Service to improve access to care. Lancet Reg Health Southeast Asia 2024;30:100480. [DOI] [PMC free article] [PubMed] [Google Scholar]
- 29. Ministry of Health and Family Welfare . Health Ministry’s eSanjeevani Initiative Completes 1 Crore Consultations: National Telemedicine Service Has Grown over 1000% in Last 10 Months. New Delhi: Press Information Bureau, Government of India. 2021. Available at: https://www.pib.gov.in/PressReleasePage.aspx?PRID=1748652 [Google Scholar]
- 30. Ministry of Health and Family Welfare, Government of India . Health Ministry’s eSanjeevani Initiative Completes 1 Crore Consultations: National Telemedicine Service has Grown over 1000% in Last 10 Months [Press release]. Press Information Bureau. 2021. https://www.pib.gov.in/PressReleasePage.aspx?PRID=1748652 [Google Scholar]
- 31. Rohilla A. Digital transformation: catalyst for sustainable development in India’s future. Int J Res Human Soc Sci 2024;12:11–26. [Google Scholar]
- 32.U.S. Agency for International Development. The Gender Digital Divide Primer. Washington, D.C.: USAID; 2020. https://www.usaid.gov/digital-development/gender-digital-divide-primer
- 33. JMIR Aging - Health-Seeking Behavior and Its Associated Technology Use: Interview Study Among Community-Dwelling Older Adults https://aging.jmir.org/2023/1/e43709/ [DOI] [PMC free article] [PubMed]
- 34. Ratzan SC. Public-private partnerships for health. J Health Commun 2007;12:315–6. [DOI] [PubMed] [Google Scholar]
- 35. Intelehealth & Transforming Rural India Foundation . Strengthening eSanjeevani telemedicine Services in Jharkhand: approaches, impact lessons learned 2022. https://www.intelehealth.org/reports/esanjeevani-jharkhand-impact-report-2022.pdf
Associated Data
This section collects any data citations, data availability statements, or supplementary materials included in this article.
Data Availability Statement
The data underlying this article cannot be shared publicly due to restrictions imposed by the Government of India on patient-level and provider-level health records. In compliance with the Digital Personal Data Protection (DPDP) Act, 2023, health data are considered sensitive personal data and cannot be shared with non-governmental entities without explicit authorization, in order to protect the privacy of individuals and prevent re-identification. The dataset used for this analysis was provided in aggregate and de-identified form by the Centre for Development of Advanced Computing (C-DAC) under the Ministry of Health and Family Welfare, solely for research purposes. The data may be shared in aggregated form on reasonable request to the corresponding author, subject to necessary approvals from the relevant authorities.


