

ABSTRACT
Background
Bullying perpetration has been associated with depressive symptoms. Although the bullying literature is large, most studies are correlational and cannot address the question of causation directly. This study explored bidirectional causal relationships between bullying perpetration and depressive symptoms using data from the TwinLife study, a comprehensive longitudinal survey of German twins. We aimed to clarify whether bullying perpetration leads to depressive symptoms or vice versa, or if other underlying factors might explain their co‐occurrence.
Methods
The analysis included 1975 twin pairs from the TwinLife study, with data on depressive symptoms and bullying. The analysis used an extension to the Direction of Causation model, a bivariate causal inferential twin model that adjusts the effect of measurement error. A range of models was tested. Age, sex, inter‐twin aggression and household income were included in all models as covariates.
Results
After testing five models with and without causal paths, we found the model without causal paths but including common genetic and unique environmental liabilities best explained the data.
Conclusion
It was found that depressive symptoms and bullying perpetration share genetic influences.
Keywords: bullying, causal inference, depression, twin design
Summary
Bullying perpetration shares genetic liability with depressive symptoms.
The statistic test could not identify a causal link between depression symptoms and bullying perpetration.
Because of the genetic liability overlap, prevention strategy should encompass peer context, family environment, emotion regulation and environmental aspects.
1. Introduction
Bullying is a common behaviour across cultures (Vrijen et al. 2023), most prevalent between ages 9 and 14 (Moore et al. 2017). It is a group phenomenon defined by the repeated intention to harm and an imbalance of power between perpetrator and victim (Thomas et al. 2018). The phenomenon is commonly divided into those who perpetrate, their victims and individuals who are both perpetrators and victims (bullies, victims and bully–victims) (Cook et al. 2010). It is estimated that between 10% and 30% of children and adolescents are involved in some form of bullying (Cook et al. 2010; Serafini et al. 2023). Although many studies have focused on bullying victimization, less is known about bullying perpetration.
It is estimated that 13% of students engage in bullying perpetration. A large US study of 15,686 students in Grades 6 through 10 found that the percentage of students who engaged in bullying at least once was 27% males, 27% in 6th grade and 26% White (Nansel et al. 2001). Additionally, bullying perpetration was linked to higher alcohol use, smoking and below average academic achievement (Nansel et al. 2001). A meta‐analysis of 1622 studies of perpetrators (n = 89,450) supported increased risk of perpetration in males, older ages and associations with externalizing problems, internalizing problems and lower academic performance. The authors further report important contextual predictors, such as family/home environment, school climate, community factors and peer influence (Cook et al. 2010). They reported a weighted β for internalizing problems of 0.12 (95% CI 0.06, 0.17), which was smaller than the association with externalizing problems, 0.34 (95% CI 0.30, 0.38). A more recent longitudinal study reports that the relationship between perpetration and internalizing disorders is bidirectional (N = 13,200 youths; OR = 1.49, 95% CI 1.15–1.94 in the forward direction; and OR = 1.95, 95% CI 1.65–2.31 in the reverse direction) (Azevedo Da Silva et al. 2020).
Bullying perpetration in childhood appears related to mental health problems later in life. An Australian study (n = 1590) has reported that child bullies were more likely to present mental health issues at 17 years of age. Those who engaged in aggression at 14 years of age were more likely to be depressed at 17 years (OR = 1.81, 95% CI 1.19–2.76) (Moore et al. 2014). Another study looked at how depressive symptoms in youth have a mediating effect in the relation between parent‐related problems (family violence and emotional maltreatment) and bullying perpetration and found significant mediation of depressive symptoms for both interpersonal bullying and cyberbullying (Li et al. 2021). The latter is strongly correlated with interpersonal bullying but less prevalent (Modecki et al. 2014).
Nevertheless, there are large variations in the reported prevalence of bullying perpetration, which might be related to different definitions used across studies (Cook et al. 2010). Similarly, the psychometric properties of a measure affect how perpetration is reported. Jetelina et al. (2019) found that, in a longitudinal survey data analysis (n = 4297 children in 5th–7th grade), a 3% bullying prevalence was found using a single‐item measure but 18% if using a multiple‐item measure (Jetelina et al. 2019). This suggests that the prevalence might change depending on the structure of the measures used. Yun and Espelage (2024) report from 1373 students in South Korea that, relative to the peer‐identified bully group, self‐identified bullies were 24% more likely to exhibit depressive symptoms and 7% less likely to endorse delinquent behaviour. These findings suggest that, as in many other psychological conditions, measurement error and construct validity can interfere not only with diagnosis but also with estimation of associations.
Finally, genetic liability appears to be an influential factor in bullying perpetration, with an estimated twin heritability (twin‐h) of 70% (Vrijen et al. 2023). Genetic confounding due to pleiotropy, where a gene affects multiple traits, may partially explain the genetic correlation between bullying victimization and internalizing disorders (Kretschmer et al. 2018) and between perpetration and externalizing disorders (Vrijen et al. 2023). However, it is currently unknown whether any shared genetic liability exists between bullying perpetration and internalizing disorders, despite their significant association (Moore et al. 2014). Depression, a costly (Araújo et al. 2022) and prevalent condition (35%) in adolescence (Costello et al. 2003; Shorey et al. 2022), is also moderately heritable, with estimates ranging from 12.5% (SNP heritability, SNP‐h2) to 37% (twin‐h2) (Sullivan et al. 2000). A knowledge gap remains regarding whether the association reported by Moore et al. (2014) is due to a common genetic liability or a directional effect and therefore requires investigation.
The aim of this study is to dissect the association between bullying perpetration and depressive symptoms by investigating three main factors: (i) measurement error, stemming from construct validity, (ii) genetic liability, which may explain correlation due to polygenicity and pleiotropy between phenotypes, and (iii) causation. Randomized clinical trials examining the effects of bullying on depressive symptoms (and vice versa) are unethical, so we must resort to quasi‐experimental methods to improve causal inference. One such method is the Direction of Causation (DoC) model, which uses cross‐twin cross‐trait correlations to tease apart what is a causal effect from genetic correlation. It is based on an extension of the classical twin design (CTD) that allows for causal inference in a cross‐sectional design. Furthermore, the test is bidirectional, allowing for the estimation of the causal effect of bullying perpetration on depressive symptoms and vice versa. This can potentially reveal a feedback‐loop type of mechanism between conditions and more directly assess the reciprocal effects, as Li et al. (2021) and Azevedo Da Silva et al. (2020) reported. Our hypothesis, given the strength of the effects reported thus far, is that bullying perpetration will increase depressive symptoms, and vice versa, after adjusting for age, sex, inter‐twin aggression and household income.
2. Methods
2.1. Data
TwinLife is a German twin study that obtained information on several aspects of life, including life events, work performance and psychopathology (Lang et al. 2020; Mönkediek et al. 2019). The design was multi‐cohort, cross‐sequential, with in‐person interviews alternating with telephone interviews performed yearly. Four thousand families with same‐sex twins were interviewed over 9 years; participants were obtained across the country and sampling was restricted to communities with 5000 or more inhabitants. We included all respondents of the questions about bullying perpetration and depressive symptoms in the face‐to‐face interviews from the second wave of the study, which took place in 2016. Data were released in 2020, Version 4.0.0. A full description of the study design can be found in Lang and Kottwitz (2017).
TwinLife exclusively involves same‐sex dizygotic twin children and similarity‐based zygosity assignment. As of Version 4.0.0, zygosity was assessed using questionnaires about physical similarities (Goldsmith 1991) with an accuracy varying between 96% in self‐reports and 97% in parental reports in comparison to genotyped zygosity from a subsample of the study (Mönkediek et al. 2019). A total of 916 monozygotic pairs and 1059 dizygotic pairs were included in the following analysis. To maximize the use of data, all available complete or incomplete pairs were included and estimation was performed using full information maximum likelihood (FIML).
2.2. Measures
All questions used Likert scales. Bullying perpetration questions were part of the delinquent behaviour section of the interview and included three binary items: (i) teasing and intimidating a classmate, (ii) threatening someone and (iii) threatening/insulting/spreading gossip/making fun of someone on the internet. These variables were chosen because they represent intentional threatening behaviour towards others inside and outside the school environment, as well as online. Additionally, a single factor psychometric model with variance decomposed into ACE components was fitted to the data and resulted in moderately strong loadings (~0.4) (Supporting Information).
Depressive symptoms questions are based on the Beck Depression Inventory‐Fast Screen (BDI‐FS) (Beck et al. 1961). This scale is validated for patients aged 13 years and older. In TwinLife, the seven items were measured using a 4‐level Likert scale ranging from ‘Never’ to ‘Always’. The reported sensitivity and specificity were 0.86 and 0.93, respectively (Pietsch et al. 2012). The questions are: ‘I am sad’, ‘I am pessimistic about my future’, ‘I feel like a failure’, ‘Difficult to enjoy anything’, ‘Disappointed in myself’, ‘Blame myself for mistakes and weaknesses’ and ‘Think about hurting myself’.
Phenotypes were included in the models as continuous. Because the sex influence in bullying is well established, sex was residualized on the perpetration data using the umx_residualize() function. We further adjusted for inter‐twin aggression to remove within‐pair influences and avoid pair interactions that could bias genetic liabilities and directional effects (Carey 1986; Heath et al. 1993; Neale and Cardon 1992). The hurting other twin variable has five levels (never, rarely, occasionally, often, very often) and was residualized on perpetration. Finally, family income in Euros and age were residualized in all variables.
2.3. Model Specification
The models specified in the analyses were all based on the CTD. CTD models permit decomposing the phenotypic variance into A (additive genetic), D (dominance), C (shared environmental) and E (unique environmental) components. For the model to be identified (to have more information than parameters to be estimated), D and C cannot be estimated simultaneously, and only three of the four components can be estimated. A represents the additive genetic influences across the genome, D accrues the non‐additive genetic influences or dominance, C includes factors that make family members alike, such as socioeconomic status and parenting styles, and finally, E typically includes both environmental factors and measurement error (Neale and Cardon 1992). In order to decide whether either phenotype should be modelled with the shared genetic (C) or dominance (D) variances, a likelihood ratio test (LRT) was performed comparing an ACE decomposed psychometric model to the ADE and AE models (Table 3). The ACE reduction test could not significantly differentiate between the three models; however, estimations for neither C nor D variances were significant. Therefore, AE models were specified in the next tests.
TABLE 3.
ACE reduction analyses.
| Model | EP | Δ df | p | AIC | Δ AIC | Compare with model | Fit units |
|---|---|---|---|---|---|---|---|
| Bullying perpetration | |||||||
| ACE | 8 | 10,313 | 0 | −2lnL | |||
| ADE | 8 | 0 | 10,313 | 0 | ACE | −2lnL | |
| AE | 7 | 1 | 0.288 | 10,312 | −0.87 | ACE | −2lnL |
| Depressive symptoms | |||||||
| ACE | 12 | 55,574 | 0 | −2lnL | |||
| ADE | 12 | 0 | 55,574 | 0 | ACE | −2lnL | |
| AE | 11 | 1 | 0.137 | 55,573 | 0.209 | ACE | −2lnL |
Note: Fit comparisons between models based in a likelihood ratio test. No significant fit differences were found for either phenotype. All variables were treated as ordinal factors, age and household income were included as covariates. AIC, Akaike information criteria; df, degrees of freedom; EP, estimated parameters; lnL, log‐likelihood.
To assess directional effects, we specified a multiple‐indicators DoC (MI‐DoC) model (Gillespie et al. 2003), whereby we include each item with independent measurement error variance (Figure 1). MI‐DoC is a multivariate extension of the DoC models, which are used to infer causality in twin designs (Heath et al. 1993; Neale et al. 1994). In DoC, you can have the A, C and E covariances specified and the causal paths forward and reverse, but due to identification, one can only estimate three of these five parameters (Maes et al. 2021). Usually, to estimate both causal paths, one needs to fix the C and E covariances to zero (L. Castro‐de‐Araujo, Singh, Zhou, Vinh, Maes, et al. 2023; L. F. S. Castro‐de‐Araujo, Singh, Zhou, Vinh, Verhulst, et al. 2023). Fixing the E covariance to zero leads to bias in the causal estimation (Rasmussen et al. 2019). Furthermore, in DoC modelling, the power to detect either causal path is contingent on distinct patterns of inheritance or distinct A variances in each phenotype (Neale et al. 1994). MI‐DoC is a psychometric version of these models, which allows bidirectional causal inference and does not include ACE covariances. The assumption of distinct phenotypic A variances is expected to be similar to those in DoC; however, this has never been shown in simulation.
FIGURE 1.
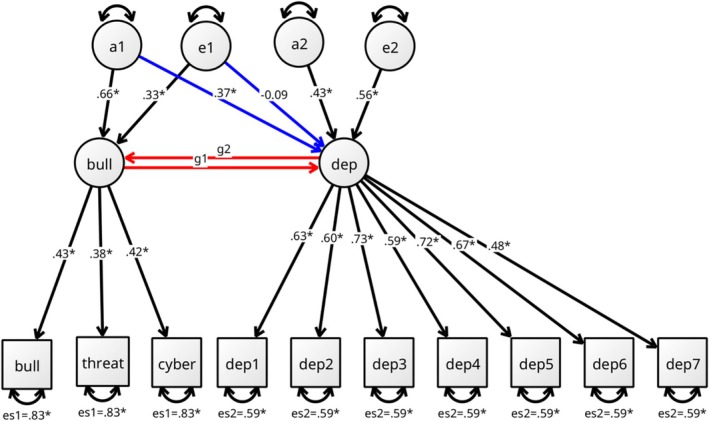
Diagram overlaying the five models tested and including the Multiple Indicators DoC model. The paths in red are the causal paths between bullying and depression. Unlabelled paths are fixed to 1. Values indicate the standardized estimates and significance of the parameter coefficients in the best fitting model, hence no values for parameters g1 and g2, as the best fitting model did not include those, see Table 4. Asterisks indicate significance obtained from standard errors. This model allows for measurement error at the item level, parameters es1 and es2, which were equated between bullying perpetration items and depressive symptoms items. Blue paths represent the model specification in a Cholesky decomposition variant, which was the best fitting model in the LRT (see Table 4).
In the MI‐DoC specified, indicators load into two latent variables, one for bullying perpetration (bull) and another for depressive symptoms (dep). The variance of the latent variables is further decomposed into A and E variances. Item‐specific measurement errors were estimated with an equality constraint for all errors in the bullying indicators (parameter es1, Figure 1) and all errors in the depressive symptoms indicators (parameter es2, Figure 1). A Cholesky specification (Carey 2005), whereby the A and E variance components from the bull latent variable point to the dep latent, with no causal paths, was estimated to model shared genetic and unique environmental liabilities (blue parameters, Figure 1). In total, five models were used: MI‐DoC with forward cause, reverse cause, feedback loop, no cause and the Cholesky model (Table 4, Figure 1).
TABLE 4.
Model parsimony test.
| Model | EP | Δ Fit | Δ df | p | AIC | Δ AIC | Compare with model | Fit units |
|---|---|---|---|---|---|---|---|---|
| Cholesky | 20 | 65,863 | 0 | −2lnL | ||||
| Reverse causation | 19 | 136.15 | 1 | < 0.001 | 65,997 | 134.15 | Cholesky | −2lnL |
| Forward causation | 19 | 4.597 | 1 | 0.033 | 65,865 | 2.597 | Cholesky | −2lnL |
| No cause | 18 | 136.152 | 2 | < 0.001 | 65,995 | 132.152 | Cholesky | −2lnL |
| Feedback loop | 20 | 135.3 | 0 | < 0.001 | 65,998 | 135.3 | Cholesky | −2lnL |
Note: All models were tested against the Cholesky model, which was also the best fitting model (Figure 1). AIC, Akaike information criteria; df, degrees of freedom; EP, estimated parameters; lnL, log‐likelihood.
The three main elements of this complex relationship—measurement error, shared genetic liability and cause—can be assessed with MI‐DoC and the Cholesky model. This is possible with a multiple‐step procedure. First, the model is specified with measurement error, thus correcting for this effect (parameters es1 and es2 in Figure 1). Second, the Cholesky model (blue paths in Figure 1) checks for the shared genetic liability. Third, the causal model (MI‐DoC, red paths in Figure 1) checks for direct effects in either or both directions for bull and dep. The causal model assumes no background confounding. Fourth, a LRT between these models is performed so that the models can be compared. If the models differ significantly, the best‐fitting model explains the relationship better than the alternatives. Thus, if the causal model is the best‐fitting model, there is evidence of causation and our hypothesis is confirmed.
Estimation was performed using FIML with the SLSQP optimizer. All model comparison tests assumed an alpha of 0.05. Analyses were performed in the R statistical environment (Version 4.3.2) (R Core Team 2021) using OpenMx (Version 2.21.12) (Neale et al. 2016) and umx (Version 4.20) (Bates et al. 2019). All models were tested for local identification using the OpenMx mxCheckIdentification function (Hunter et al. 2021).
3. Results
3.1. Sample Description
A total of 3803 participants were included in the analyses. Table 1 lists the demographic characteristics of the sample. The mean age was 18.3 (range: 12–27, SD = 4.87), with males slightly younger (age = 17.9). The mean age of those who responded to the depressive symptoms questions was 15.11 (SD = 6.55). The mean household income was €4070, with female–female twin families poorer than their male–male counterparts. In terms of twin pairs, the data includes 916 MZ pairs and 1059 DZ pairs. Unsurprisingly, male participants endorsed engaging more in cyber‐ and interpersonal bullying (10.9% and 5.9%, respectively) than their female counterparts (5.4% and 2.1%, respectively; Table S1).
TABLE 1.
Item level sample characteristics.
| Age quantiles | Overall | (12–13] | (13–19] | (19–24] | (24–27) |
|---|---|---|---|---|---|
| n | 3797 | 950 | 949 | 949 | 949 |
| Sex = M (%) | 1709 (45.0) | 460 (48.4) | 442 (46.6) | 404 (42.6) | 403 (42.5) |
| Age (mean [SD]) | 18.28 (4.87) | 12.93 (0.26) | 15.57 (2.83) | 19.50 (1.28) | 25.14 (0.78) |
| Zygosity MZ (%) | 1764 (46.5) | 375 (39.5) | 444 (46.8) | 435 (45.8) | 510 (53.7) |
| Household income € (mean [SD]) | 4070.23 (3178.78) | 4694.36 (2843.80) | 4268.23 (3452.42) | 4048.50 (2732.16) | 3270.00 (3421.02) |
| Depressive symptoms items | |||||
| I am sad (%) | |||||
| 1 Never | 925 (24.4) | 240 (25.3) | 247 (26.0) | 207 (21.8) | 231 (24.3) |
| 2 | 1991 (52.4) | 539 (56.7) | 515 (54.3) | 470 (49.5) | 467 (49.2) |
| 3 | 446 (11.7) | 87 (9.2) | 98 (10.3) | 125 (13.2) | 136 (14.3) |
| 4 Always | 57 (1.5) | 9 (0.9) | 14 (1.5) | 15 (1.6) | 19 (2.0) |
| NA | 378 (10.0) | 75 (7.9) | 75 (7.9) | 132 (13.9) | 96 (10.1) |
| I am pessimistic about my future (%) | |||||
| 1 Never | 1933 (50.9) | 530 (55.8) | 467 (49.2) | 439 (46.3) | 497 (52.4) |
| 2 | 1042 (27.4) | 233 (24.5) | 278 (29.3) | 268 (28.2) | 263 (27.7) |
| 3 | 327 (8.6) | 73 (7.7) | 90 (9.5) | 87 (9.2) | 77 (8.1) |
| 4 Always | 61 (1.6) | 19 (2.0) | 15 (1.6) | 14 (1.5) | 13 (1.4) |
| NA | 434 (11.4) | 95 (10.0) | 99 (10.4) | 141 (14.9) | 99 (10.4) |
| I feel like a failure (%) | |||||
| 1 Never | 2373 (62.5) | 652 (68.6) | 610 (64.3) | 527 (55.5) | 584 (61.5) |
| 2 | 800 (21.1) | 172 (18.1) | 204 (21.5) | 225 (23.7) | 199 (21.0) |
| 3 | 214 (5.6) | 47 (4.9) | 51 (5.4) | 53 (5.6) | 63 (6.6) |
| 4 Always | 43 (1.1) | 10 (1.1) | 8 (0.8) | 17 (1.8) | 8 (0.8) |
| NA | 367 (9.7) | 69 (7.3) | 76 (8.0) | 127 (13.4) | 95 (10.0) |
| Difficult to enjoy anything (%) | |||||
| 1 Never | 1879 (49.5) | 568 (59.8) | 514 (54.2) | 419 (44.2) | 378 (39.8) |
| 2 | 1072 (28.2) | 235 (24.7) | 258 (27.2) | 266 (28.0) | 313 (33.0) |
| 3 | 378 (10.0) | 66 (6.9) | 77 (8.1) | 104 (11.0) | 131 (13.8) |
| 4 Always | 90 (2.4) | 10 (1.1) | 20 (2.1) | 28 (3.0) | 32 (3.4) |
| NA | 378 (10.0) | 71 (7.5) | 80 (8.4) | 132 (13.9) | 95 (10.0) |
| Disappointed in myself (%) | |||||
| 1 Never | 1599 (42.1) | 445 (46.8) | 404 (42.6) | 356 (37.5) | 394 (41.5) |
| 2 | 1387 (36.5) | 355 (37.4) | 362 (38.1) | 321 (33.8) | 349 (36.8) |
| 3 | 379 (10.0) | 67 (7.1) | 97 (10.2) | 123 (13.0) | 92 (9.7) |
| 4 Always | 59 (1.6) | 15 (1.6) | 11 (1.2) | 17 (1.8) | 16 (1.7) |
| NA | 373 (9.8) | 68 (7.2) | 75 (7.9) | 132 (13.9) | 98 (10.3) |
| Blame myself for mistakes and weaknesses (%) | |||||
| 1 Never | 1204 (31.7) | 400 (42.1) | 345 (36.4) | 223 (23.5) | 236 (24.9) |
| 2 | 1400 (36.9) | 338 (35.6) | 346 (36.5) | 345 (36.4) | 371 (39.1) |
| 3 | 659 (17.4) | 118 (12.4) | 142 (15.0) | 192 (20.2) | 207 (21.8) |
| 4 Always | 151 (4.0) | 22 (2.3) | 35 (3.7) | 56 (5.9) | 38 (4.0) |
| NA | 383 (10.1) | 72 (7.6) | 81 (8.5) | 133 (14.0) | 97 (10.2) |
| Think about hurting myself (%) | |||||
| 1 Never | 3146 (82.9) | 820 (86.3) | 803 (84.6) | 733 (77.2) | 790 (83.2) |
| 2 | 194 (5.1) | 43 (4.5) | 52 (5.5) | 57 (6.0) | 42 (4.4) |
| 3 | 58 (1.5) | 13 (1.4) | 15 (1.6) | 17 (1.8) | 13 (1.4) |
| 4 Always | 25 (0.7) | 9 (0.9) | 5 (0.5) | 5 (0.5) | 6 (0.6) |
| NA | 374 (9.8) | 65 (6.8) | 74 (7.8) | 137 (14.4) | 98 (10.3) |
| Bullying items | |||||
| Cyberbullying (%) | |||||
| No | 3038 (80.0) | 821 (86.4) | 748 (78.8) | 701 (73.9) | 768 (80.9) |
| Yes | 299 (7.9) | 40 (4.2) | 88 (9.3) | 93 (9.8) | 78 (8.2) |
| NA | 460 (12.1) | 89 (9.4) | 113 (11.9) | 155 (16.3) | 103 (10.9) |
| Bullying classmates (%) | |||||
| No | 1225 (32.3) | 749 (78.8) | 460 (48.5) | 16 (1.7) | 0 (0.0) |
| Yes | 144 (3.8) | 77 (8.1) | 65 (6.8) | 2 (0.2) | 0 (0.0) |
| NA | 2428 (63.9) | 124 (13.1) | 424 (44.7) | 931 (98.1) | 949 (100.0) |
| Threatening others (%) | |||||
| No | 3339 (87.9) | 839 (88.3) | 847 (89.3) | 805 (84.8) | 848 (89.4) |
| Yes | 35 (0.9) | 16 (1.7) | 14 (1.5) | 2 (0.2) | 3 (0.3) |
| NA | 423 (11.1) | 95 (10.0) | 88 (9.3) | 142 (15.0) | 98 (10.3) |
Note: Individual twin.
A total of 3797 participants were included. Table 1 describes characteristics by age quartiles: Q1 (12–13 years; n = 950), Q2 (13–19 years; n = 949), Q3 (19–24 years; n = 949) and Q4 (24–27 years; n = 949). The quartile‐specific mean ages were 12.93, 15.57, 19.50 and 25.14 years. Males comprised 45.0% of the sample overall (48.4%, 46.6%, 42.6% and 42.5% across Q1–Q4). Monozygotic twins represented 46.5% overall.
Household income showed a decline across quartiles, from €4694 in the youngest group to €3270 in the oldest. The bullying classmates' question was entirely missing in Q4; note that the analyses are performed in FIML, which means that those rows in the data will not contribute to the variance of the bull factor.
3.2. Twin Correlations
The monozygotic/dizygotic correlations (rMZ:rDZ) are useful as an indication of possible additive genetic influence in the data. In order to assess rMZ:rDZ at the latent level, scores of the latent factor for each condition were generated with the umxEFA() function. The correlation between these two factor scores was −0.68 (Supporting Information). For depressive symptoms, the latent factor score rMZ (0.41) was more than twice that of rDZ (0.15), suggesting non‐additive genetic influence. The rMZ for the bullying perpetration latent factor was 0.28, and the rDZ was 0.15, suggesting additive genetic influences (Table 2). Next, we fit psychometric ACE models to calculate the heritabilities of each latent factor, and we found the bullying perpetration twin‐h2 = 0.67, and the depressive symptoms twin‐h2 = 0.41 (Supporting Information). The heritability for the latent depressive symptoms factor was slightly higher than the previously reported twin‐h2 = 37% (Sullivan et al. 2000), whereas the bullying perpetration twin‐h2 was slightly lower than the 70% previously reported (Vrijen et al. 2023). The difference in A variance and the rMZ:rDZ ratio suggests that the MI‐DoC modelling does not violate the assumption of distinct patterns of inheritance from conventional DoC modelling.
TABLE 2.
MZ/DZ correlations.
| Variable | Mean | SD | rMZ (916) | rDZ (1059) |
|---|---|---|---|---|
| Bullying perpetration factor score (717/829) | −0.02 | 2 | 0.28 (0.03) | 0.17 (0.03) |
| Depression factor score (739/876) | 0 | 1.09 | 0.41 (0.02) | 0.15 (0.02) |
Note: MZ/DZ correlations and standard errors. (n/n) = MZ/DZ complete pairs.
Abbreviation: SD, standard deviation.
3.3. Model Comparisons
Before checking for possible directional effects, we tried to determine whether the phenotypes should be modelled with either shared environmental (C) or dominance (D) variances. An LRT was performed comparing ACE‐decomposed psychometric models (for each depressive symptom and bullying perpetration) to the ADE and AE models (Table 3). In this step, we found no significant difference between the three versions; however, the C or D variances were consistently not significant. For this reason, the AE specifications were chosen for the next step.
Five models were specified aiming to identify whether the empirical correlations found were due to shared genetic/environmental liability (Cholesky specification, blue paths in Figure 1) or directional effects (feedback‐loop model, red paths in Figure 1). The models were: the forward unidirectional effect model (forward, Table 4) from bull to dep (g1 path in red, Figure 1), reverse unidirectional effect model (reverse, Table 4) from dep to bull (g2 path in red, Figure 1), no directional effect (no cause, Table 4) and feedback‐loop (both g1 and g2 estimated). The last model was the Cholesky specification (blue paths, Figure 1). Figure 1 overlays the five models and includes the standardized estimates in the paths of the best fitting model. Significance is defined via SE‐based confidence intervals and marked with an asterisk. The full report is available in the Supporting Information.
An LRT was performed comparing all models (Table 4). The Cholesky (AIC = 65,863, CFI: 0.844, TLI: 0.866, RMSEA: 0.0355) had a significantly better fit than the other models in the LRT, suggesting that the association between bullying perpetration and depressive symptoms is best explained by shared genetic and environmental influences and not by causal links. Path estimates are reported in Figure 1, with the full report in the Supporting Information.
4. Discussion
Bullying is a highly concerning behaviour, and understanding its relationship to depressive symptoms may help parents and teachers better target interventions to prevent or modify it. Previous papers have reported relatively strong bidirectional associations between these conditions (Azevedo Da Silva et al. 2020; Cook et al. 2010; Li et al. 2021; Moore et al. 2014). To assess this relationship, we applied an extension to CTD that allows a directional effects investigation between bullying perpetration and depressive symptoms (adjusting for key confounders), with the hypothesis that the relationship was causal. First, we found that bullying perpetration and depressive symptoms differed in heritability and were best modelled by including additive genetic and unique environmental variance (AE) in the TwinLife data. Second, contrary to our hypothesis, we found that the model without directional effects, but that allowed shared genetic and unique environmental liabilities, best explained the data. Although we are not aware of any previous similar work in bullying perpetration, our findings are consistent with findings in bullying victimization (Kretschmer et al. 2018), where pleiotropy was found to play a major role.
Vrijen et al. (2023) found that bullying perpetration and later externalizing problems were confounded by pleiotropy, implying that causal inference must adjust for such effects. However, they did not look into the pleiotropy between perpetration and internalizing disorders, though depressive symptoms have been related to bullying perpetration in the literature. The present study fills this gap, and it was found that shared genetic and environmental liability appeared to best explain their association.
Moreover, only the cross‐sectional case was tested in this analysis. The relation between bullying perpetration and depressive symptoms is dynamic, with depressive symptomatology appearing later in life. A possible future direction for this research would be to use genetically informed cross‐lagged panel models to disentangle the complex interplay between bullying, psychiatric symptoms and genetic liabilities over time (Castro‐de‐Araujo et al. 2025; Littlefield et al. 2024; Singh et al. 2023).
This work should be interpreted in the context of some important limitations. First, key general CTD assumptions are that monozygotic twins are genetically identical and dizygotic twins share, on average, half of their genes; that mate selection is random; and that genetic and environmental influences are independent, with no gene–environment interaction (Neale and Cardon 1992). Second, CTD assumes that both types of twins are treated equally, otherwise known as the equal environment assumption (EEA); or that non‐elicited environmental effects are equally correlated for MZ and DZ twin pairs. Though these are necessary for the models to be identified, it is possible that some of these assumptions do not hold for all families. Third, the model assumes no sibling interaction, but this was partially addressed by adjusting for within‐pair aggression. Fourth, our findings indicate missing data in the assessment of bullying perpetration, with slightly younger participants answering those questions. As kids age, they are less likely to endorse perpetrating bullying, which might interfere with most study designs set to assess bullying perpetration. Future studies might be able to address this problem, incorporating measures of bullying perpetration provided by peers, teachers and parents. Fifth, questions on bullying classmates were only asked up to 19 years of age; therefore, that question did not contribute to variance across the whole age range included in the analysis.
Our findings indicate that the association between bullying perpetration and depressive symptoms is best explained by shared genetic and unique environmental liabilities. This interpretation is consistent with genetically informed research showing that both bullying involvement and internalizing problems (including depression) are substantially heritable and that a sizable portion of their covariance reflects common genetic influences (Connolly and Beaver 2016; Veldkamp et al. 2019).
Unique environmental experiences, such as peer stressors, appear to shape individual differences beyond genetic predisposition and are linked to more adverse depressive trajectories (Kwong et al. 2019) as well as the effects of bullying on mental health in co‐twin control designs (Singham et al. 2017). Future studies should leverage longitudinal, genetically informed designs to map how genetic correlations between bullying behaviour and depression unfold developmentally and to differentiate pleiotropy from causal processes.
Ethics Statement
The TwinLife study received ethical approval from the German Psychological Society (Deutsche Gesellschaft für Psychologie; Protocol Numbers: RR 11.2009 and RR 09.2013) and thus met the ethical standards of the 1964 Helsinki Declaration and its subsequent amendments. All data from study participants are collected by an external survey institute and pseudonymised through assignment of personal and family ID numbers for each individual. Prior to each data collection, participants received a data protection notice informing them about the processing and use of their personal data in accordance with the data protection law and voluntariness of study participation.
Conflicts of Interest
The authors declare no conflicts of interest.
Supporting information
Figure S1: Polychoric correlations.
Figure S2: Whole sample age × sex density.
Table S1: Item level sample characteristics, sex stratified.
Acknowledgements
We acknowledge all participants from the TwinLife study for their invaluable contribution.
Araujo, J. , Lannoy S., Kanaan R., and Castro‐de‐Araujo L.. 2025. “Bullying Perpetration and Depressive Symptoms: A Causal Investigation of TwinLife Data.” Clinical Psychology & Psychotherapy 32, no. 5: e70167. 10.1002/cpp.70167.
Richard A. A. Kanaan and Luis F. S. Castro‐de‐Araujo are joint last authors.
Funding: Luis F. S. Castro‐de‐Araujo is funded by the National Institutes of Health (Grant No. 5T32MH‐020030). Jacyra Azevedo Paiva de Araujo is funded by NIAAA (Grant No. T32AA029975). Severine Lannoy is funded by NIAAA (Award Number K99AA030611).
Data Availability Statement
The TwinLife data are archived in the GESIS data catalogue: https://search.gesis.org/research_data/ZA6701, https://doi.org/10.4232/1.13932. Data are only released for academic research and teaching after the data depositor's written authorization.
References
- Araújo, J. A. P. d. , Rodrigues E. d. S., Castro‐de‐Araujo L. F. S., Machado D. B., and Barreto M. L.. 2022. “Use of Routine Health Records to Study Mental Health Care of Brazilian Children.” Jornal Brasileiro de Psiquiatria 71: 204–209. 10.1590/0047-2085000000385. [DOI] [Google Scholar]
- Azevedo Da Silva, M. , Gonzalez J. C., Person G. L., and Martins S. S.. 2020. “Bidirectional Association Between Bullying Perpetration and Internalizing Problems Among Youth.” Journal of Adolescent Health 66, no. 3: 315–322. 10.1016/j.jadohealth.2019.09.022. [DOI] [PMC free article] [PubMed] [Google Scholar]
- Bates, T. C. , Maes H., and Neale M. C.. 2019. “Umx: Twin and Path‐Based Structural Equation Modeling in R.” Twin Research and Human Genetics 22, no. 1: 27–41. 10.1017/thg.2019.2. [DOI] [PubMed] [Google Scholar]
- Beck, A. T. , Ward C. H., Mendelson M., Mock J., and Erbaugh J.. 1961. “An Inventory for Measuring Depression.” Archives of General Psychiatry 4, no. 6: 561–571. 10.1001/archpsyc.1961.01710120031004. [DOI] [PubMed] [Google Scholar]
- Carey, G. 1986. “Sibling Imitation and Contrast Effects.” Behavior Genetics 16, no. 3: 319–341. 10.1007/BF01071314. [DOI] [PubMed] [Google Scholar]
- Carey, G. 2005. “Cholesky Problems.” Behavior Genetics 35, no. 5: 653–665. 10.1007/s10519-005-5355-9. [DOI] [PubMed] [Google Scholar]
- Castro‐de‐Araujo, L. , Singh M., Zhou Y., et al. 2023. “Power, Measurement Error, and Pleiotropy Robustness in Twin‐Design Extensions to Mendelian Randomization.” Research Square: rs.3.rs‐3411642. 10.21203/rs.3.rs-3411642/v1. [DOI] [Google Scholar]
- Castro‐de‐Araujo, L. F. , Singh M., Zhou D., et al. 2025. “Longitudinal Bidirectional Effects Between ADHD and Education Performance: A New RI‐CLPM Model With Instrumental Variables.” Psychiatry and Clinical Psychology. 10.1101/2025.08.06.25333140. [DOI] [Google Scholar]
- Castro‐de‐Araujo, L. F. S. , Singh M., Zhou Y., et al. 2023. “MR‐DoC2: Bidirectional Causal Modeling With Instrumental Variables and Data From Relatives.” Behavior Genetics 53: 63–73. 10.1007/s10519-022-10122-x. [DOI] [PMC free article] [PubMed] [Google Scholar]
- Connolly, E. J. , and Beaver K. M.. 2016. “Considering the Genetic and Environmental Overlap Between Bullying Victimization, Delinquency, and Symptoms of Depression/Anxiety.” Journal of Interpersonal Violence 31, no. 7: 1230–1256. 10.1177/0886260514564158. [DOI] [PubMed] [Google Scholar]
- Cook, C. R. , Williams K. R., Guerra N. G., Kim T. E., and Sadek S.. 2010. “Predictors of Bullying and Victimization in Childhood and Adolescence: A Meta‐Analytic Investigation.” School Psychology Quarterly 25, no. 2: 65–83. 10.1037/a0020149. [DOI] [Google Scholar]
- Costello, E. J. , Mustillo S., Erkanli A., Keeler G., and Angold A.. 2003. “Prevalence and Development of Psychiatric Disorders in Childhood and Adolescence.” Archives of General Psychiatry 60, no. 8: 837–844. 10.1001/archpsyc.60.8.837. [DOI] [PubMed] [Google Scholar]
- Gillespie, N. A. , Zhu G., Neale M. C., Heath A. C., and Martin N. G.. 2003. “Direction of Causation Modeling Between Cross‐Sectional Measures of Parenting and Psychological Distress in Female Twins.” Behavior Genetics 33, no. 4: 14. [DOI] [PubMed] [Google Scholar]
- Goldsmith, H. H. 1991. “A Zygosity Questionnaire for Young Twins: A Research Note.” Behavior Genetics 21, no. 3: 257–269. 10.1007/BF01065819. [DOI] [PubMed] [Google Scholar]
- Heath, A. C. , Kessler R. C., Neale M. C., Hewitt J. K., Eaves L. J., and Kendler K. S.. 1993. “Testing Hypotheses About Direction of Causation Using Cross‐Sectional Family Data.” Behavior Genetics 23, no. 1: 29–50. 10.1007/BF01067552. [DOI] [PubMed] [Google Scholar]
- Hunter, M. D. , Garrison S. M., Burt S. A., and Rodgers J. L.. 2021. “The Analytic Identification of Variance Component Models Common to Behavior Genetics.” Behavior Genetics 51, no. 4: 425–437. 10.1007/s10519-021-10055-x. [DOI] [PMC free article] [PubMed] [Google Scholar]
- Jetelina, K. K. , Reingle Gonzalez J. M., Cuccaro P. M., et al. 2019. “Self‐Reporting Discrepancies of Bullying Victimization and Perpetration Measures.” Annals of Epidemiology 32: 58–63. 10.1016/j.annepidem.2019.01.008. [DOI] [PubMed] [Google Scholar]
- Kretschmer, T. , Tropf F. C., and Niezink N. M. D.. 2018. “Causality and Pleiotropy in the Association Between Bullying Victimization in Adolescence and Depressive Episodes in Adulthood.” Twin Research and Human Genetics 21, no. 1: 33–41. 10.1017/thg.2017.71. [DOI] [PubMed] [Google Scholar]
- Kwong, A. S. F. , López‐López J. A., Hammerton G., et al. 2019. “Genetic and Environmental Risk Factors Associated With Trajectories of Depression Symptoms From Adolescence to Young Adulthood.” JAMA Network Open 2, no. 6: e196587. 10.1001/jamanetworkopen.2019.6587. [DOI] [PMC free article] [PubMed] [Google Scholar]
- Lang, V. , and Kottwitz A.. 2017. “The Sampling Design and Socio‐Demographic Structure of the First Wave of the TwinLife Panel Study: A Comparison With the Microcensus (No. 03; TwinLife Technical Report Series).” Universität Bielefeld and Universität des Saarlandes.
- Lang, V. , Weigel L., Mönkediek B., et al. 2020. “An Introduction to the German Twin Family Panel (TwinLife).” Jahrbücher Für Nationalökonomie Und Statistik 240, no. 6: 837–847. 10.1515/jbnst-2019-0066. [DOI] [Google Scholar]
- Li, X. , Huebner E. S., and Tian L.. 2021. “Vicious Cycle of Emotional Maltreatment and Bullying Perpetration/Victimization Among Early Adolescents: Depressive Symptoms as a Mediator.” Social Science & Medicine 291: 114483. 10.1016/j.socscimed.2021.114483. [DOI] [PubMed] [Google Scholar]
- Littlefield, A. , Lopez D., Sher K., et al. 2024. “Longitudinal Analysis of the ABCD Study.” https://longitudinal.dev/manuscript/manuscript.html.
- Maes, H. H. , Neale M. C., Kirkpatrick R. M., and Kendler K. S.. 2021. “Using Multimodel Inference/Model Averaging to Model Causes of Covariation Between Variables in Twins.” Behavior Genetics 51, no. 1: 82–96. 10.1007/s10519-020-10026-8. [DOI] [PMC free article] [PubMed] [Google Scholar]
- Modecki, K. L. , Minchin J., Harbaugh A. G., Guerra N. G., and Runions K. C.. 2014. “Bullying Prevalence Across Contexts: A Meta‐Analysis Measuring Cyber and Traditional Bullying.” Journal of Adolescent Health 55, no. 5: 602–611. 10.1016/j.jadohealth.2014.06.007. [DOI] [PubMed] [Google Scholar]
- Mönkediek, B. , Lang V., Weigel L., et al. 2019. “The German Twin Family Panel (TwinLife).” Twin Research and Human Genetics 22, no. 6: 540–547. 10.1017/thg.2019.63. [DOI] [PubMed] [Google Scholar]
- Moore, S. E. , Norman R. E., Sly P. D., Whitehouse A. J. O., Zubrick S. R., and Scott J.. 2014. “Adolescent Peer Aggression and Its Association With Mental Health and Substance Use in an Australian Cohort.” Journal of Adolescence 37, no. 1: 11–21. 10.1016/j.adolescence.2013.10.006. [DOI] [PubMed] [Google Scholar]
- Moore, S. E. , Norman R. E., Suetani S., Thomas H. J., Sly P. D., and Scott J. G.. 2017. “Consequences of Bullying Victimization in Childhood and Adolescence: A Systematic Review and Meta‐Analysis.” World Journal of Psychiatry 7, no. 1: 60–76. 10.5498/wjp.v7.i1.60. [DOI] [PMC free article] [PubMed] [Google Scholar]
- Nansel, T. R. , Overpeck M., Pilla R. S., Ruan W. J., Simons‐Morton B., and Scheidt P.. 2001. “Bullying Behaviors Among US Youth: Prevalence and Association With Psychosocial Adjustment.” JAMA 285, no. 16: 2094. 10.1001/jama.285.16.2094. [DOI] [PMC free article] [PubMed] [Google Scholar]
- Neale, M. C. , and Cardon L. R.. 1992. Methodology for Genetic Studies of Twins and Families. Springer Netherlands. 10.1007/978-94-015-8018-2. [DOI] [Google Scholar]
- Neale, M. C. , Duffy D. L., and Martin N. G.. 1994. “Direction of Causation: Reply to Commentaries.” Genetic Epidemiology 11, no. 6: 463–472. 10.1002/gepi.1370110603. [DOI] [Google Scholar]
- Neale, M. C. , Hunter M. D., Pritikin J. N., et al. 2016. “OpenMx 2.0: Extended Structural Equation and Statistical Modeling.” Psychometrika 81, no. 2: 535–549. 10.1007/s11336-014-9435-8. [DOI] [PMC free article] [PubMed] [Google Scholar]
- Pietsch, K. , Hoyler A., Frühe B., Kruse J., Schulte‐Körne G., and Allgaier A.‐K.. 2012. “Early Detection of Major Depression in Paediatric Care: Validity of the Beck Depression Inventory‐Second Edition (BDI‐II) and the Beck Depression Inventory‐Fast Screen for Medical Patients (BDI‐FS).” Psychotherapie, Psychosomatik, Medizinische Psychologie 62, no. 11: 418–424. 10.1055/s-0032-1314869. [DOI] [PubMed] [Google Scholar]
- R Core Team . 2021. R: A Language and Environment for Statistical Computing [R]. R Foundation for Statistical Computing. https://www.R‐project.org/. [Google Scholar]
- Rasmussen, S. H. R. , Ludeke S., and Hjelmborg J. V. B.. 2019. “A Major Limitation of the Direction of Causation Model: Non‐Shared Environmental Confounding.” Twin Research and Human Genetics 22, no. 1: 14–26. 10.1017/thg.2018.67. [DOI] [PubMed] [Google Scholar]
- Serafini, G. , Aguglia A., Amerio A., et al. 2023. “The Relationship Between Bullying Victimization and Perpetration and Non‐Suicidal Self‐Injury: A Systematic Review.” Child Psychiatry and Human Development 54, no. 1: 154–175. 10.1007/s10578-021-01231-5. [DOI] [PMC free article] [PubMed] [Google Scholar]
- Shorey, S. , Ng E. D., and Wong C. H. J.. 2022. “Global Prevalence of Depression and Elevated Depressive Symptoms Among Adolescents: A Systematic Review and Meta‐Analysis.” British Journal of Clinical Psychology 61, no. 2: 287–305. 10.1111/bjc.12333. [DOI] [PubMed] [Google Scholar]
- Singh, M. , Dolan C. V., and Neale M. C.. 2023. “Integrating Cross‐Lagged Panel Models With Instrumental Variables to Extend the Temporal Generalizability of Causal Inference.” Multivariate Behavioral Research 58, no. 1: 148–149. 10.1080/00273171.2022.2160954. [DOI] [PMC free article] [PubMed] [Google Scholar]
- Singham, T. , Viding E., Schoeler T., et al. 2017. “Concurrent and Longitudinal Contribution of Exposure to Bullying in Childhood to Mental Health: The Role of Vulnerability and Resilience.” JAMA Psychiatry 74, no. 11: 1112. 10.1001/jamapsychiatry.2017.2678. [DOI] [PMC free article] [PubMed] [Google Scholar]
- Sullivan, P. F. , Neale M. C., and Kendler K. S.. 2000. “Genetic Epidemiology of Major Depression: Review and Meta‐Analysis.” American Journal of Psychiatry 157, no. 10: 1552–1562. 10.1176/appi.ajp.157.10.1552. [DOI] [PubMed] [Google Scholar]
- Thomas, H. J. , Connor J. P., and Scott J. G.. 2018. “Why Do Children and Adolescents Bully Their Peers? A Critical Review of Key Theoretical Frameworks.” Social Psychiatry and Psychiatric Epidemiology 53, no. 5: 437–451. 10.1007/s00127-017-1462-1. [DOI] [PubMed] [Google Scholar]
- Veldkamp, S. A. M. , Boomsma D. I., de Zeeuw E. L., et al. 2019. “Genetic and Environmental Influences on Different Forms of Bullying Perpetration, Bullying Victimization, and Their Co‐Occurrence.” Behavior Genetics 49, no. 5: 432–443. 10.1007/s10519-019-09968-5. [DOI] [PMC free article] [PubMed] [Google Scholar]
- Vrijen, C. , Nolte I. M., Oldehinkel A. J., Veenstra R., and Kretschmer T.. 2023. “Genetic Confounding in Bullying Research: Causal Claims Revisited.” Development and Psychopathology 1–12: 1–12. 10.1017/S0954579423000445. [DOI] [PubMed] [Google Scholar]
- Yun, H.‐Y. , and Espelage D.. 2024. “Self‐Ratings and Peer‐Ratings of Bullying Perpetrators: Intrapersonal and Interpersonal Factors That Differentiate Bully Subgroups.” Journal of School Psychology 106: 101358. 10.1016/j.jsp.2024.101358. [DOI] [PubMed] [Google Scholar]
Associated Data
This section collects any data citations, data availability statements, or supplementary materials included in this article.
Supplementary Materials
Figure S1: Polychoric correlations.
Figure S2: Whole sample age × sex density.
Table S1: Item level sample characteristics, sex stratified.
Data Availability Statement
The TwinLife data are archived in the GESIS data catalogue: https://search.gesis.org/research_data/ZA6701, https://doi.org/10.4232/1.13932. Data are only released for academic research and teaching after the data depositor's written authorization.