

Abstract
Biological techniques are regarded as more sustainable to synthesize nanoparticles compared to physical and chemical ones due to their environmentally friendly characteristics and cost efficiency. In this research, silver nanoparticles (AgNPs) were synthesized using aqueous extracts of Trigonella hamosa Leave via conventional and microwave-assisted methods. The leaf extract of Trigonella hamosa L. was effectively employed as both a reducing and stabilizing agent in the preparation of AgNPs. Microwave-assisted synthesis of AgNPs shows average size of crystal (14 nm) less than that obtained without microwave (16 nm). The prepared AgNPs was characterized using XRD, FTIR, HR-TEM, and UV–vis. The UV–visible spectrophotometer identified the formation of AgNPs by observing the surface plasmon resonance absorption (SPR) band peak at approximately 430 nm. The HR-TEM and XRD studies show that the AgNPs particles have an average diameter of 14 nm and are nearly spherical, as indicated by the TEM. Synthesized AgNPs have been successfully used as a catalyst for photodegradation of methylene blue dye (MB) and paracetamol under sunlight and/or visible lamp irradiation. The MB dye experienced degradation rates of 96.2 and 94.9%, whereas paracetamol showed degradation percentages of 94.5 and 92% when subjected to sunlight and visible lamp irradiation, respectively. The results of this research indicate that AgNPs may serve as a viable alternative for the effective and safe elimination of hazardous organic pollutants.
Keywords: Trigonella hamosa L., Silver nanoparticles, Microwave, Photodegradation, MB dye, Paracetamol
Subject terms: Biotechnology, Chemistry, Environmental sciences, Materials science, Nanoscience and technology
Introduction
Nanotechnology is presented as a swiftly advancing area of contemporary research, focusing on the creation of materials at the nanoscale, which generally ranges from 1 to 100 nm1. Metal nanoparticles (NPs) possess a distinctive volume-to-surface ratio along with unique physical and chemical characteristics, allowing them to be utilized in various areas such as water purification and catalysis2, pharmaceutical and medicine industries3,4, optics2, cosmetics, biomedicine 5, chemical factories, drug delivery, edible products, electron transistors, mechanics, and electrochemical devices6,7, and cancer analysis and treatment8. Furthermore, there is an increasing interest in creating environmentally friendly methods for NP synthesis that utilize biocompatible substances instead of expensive and dangerous chemicals9.
Nanoparticles (NPs) are synthesized through several techniques, including physical chemical and biological processes. Physical and chemical methods seem to be very expensive, hazardous, lengthy, involve hazardous chemicals, and may pose risks to the environment. The physical techniques consist of several methods such as evaporation, condensation, laser ablation, ultraviolet microwave radiation, sono-electrochemical, and photochemical10. Chemical processes include spray pyrolysis, metal salt precursor reduction in solution, micro-emulsions, sonochemical, and microwave-assisted11. Biological processes appear to be straightforward, quick, non-harmful, reliable, and environmentally friendly methods that can yield precise sizes and shapes when conditions are optimized12.
The green synthesis of NPs is a special method since it just needs plants for the process, which is a good substitute due to its cost-effectiveness, environmental sustainability, and ease of expansion for large-scale processing. High temperatures, pressures, and toxic chemicals are not necessary when using the green method, which operates under mild conditions. Some different phytoconstituents, such as alkaloids, terpenoids, and flavonoids are used as reducing agents for synthesis of AgNPs13. Therefore, it’s highly recommended for synthesis of NPs based on the development of a biologically inspired procedure14,15.
Metal nanoparticles, particularly AgNPs, have gained interest due to their strong surface plasmon resonance (SPR) effect, which enhances photocatalytic activity under light irradiation. AgNPs can be found in different geometries, including hexagonal plates, decahedral nanoparticles, pentagonal nanorods, nanowires, nanocubes, nanoflowers, and nanospheres16. They can exist as nanocapsules, nanorods, carbon nanotubes, quantum dots, nanoemulsions, and fullerenes17. These AgNPs are characterized by their conductivity, catalysis, chemical stability, anti-fungal, antimicrobial, anti-viral, and anti-inflammatory potential18,19. They have been integrated into products like fibers, cosmetic goods, superconducting materials20, food containers, paints, textile products, dressings, catheters, disinfection sprays11, shampoos, detergents, shoes, toothpaste, and medications21.
In recent years, biological entities such as plants, bacteria, fungi, hormones22, proteins23,24, and urease25 have been utilized in the NPs synthesis. A one-protein technique could be used to quickly prepare biomolecule-functionalized NPs at room temperature. These protein-functionalized nanoparticles were successfully produced for various proteins with differing molecular weights and isoelectric points.
The synthesis of green plant-based materials not only lowers preparation costs but also eliminates the need for specialized techniques and plant preparations for creating nano-composites, as they utilize readily available local plant seeds26. The synthesis of NPs facilitated by plants is increasingly favored because of its benefits, including being non-toxic, environmentally friendly, and more economical than methods involving microorganisms that need sterile conditions for cell culture27.
There are 11 annual herbaceous species in the genus Trigonella, which is a member of the Fabaceae family, in the Egyptian flora. One of these florae is Trigonella hamosa, which is an annual herb that is common in Egypt28. Many phytochemistry studies of Trigonella hamosa have been carried out. According to Hamed29 steroidal saponins were isolated from the Egyptian Trigonella hamosa seeds and showed biological activities against diabetes, lipid profiles, and glucose homeostasis30. The isolated saponins from Trigonella hamosa seeds mitigated the harmful effects of chronic diabetes31.
Trigonella hamosa L. leaves extract was utilized in our study as a stabilizing and reduction agent in the preparation of AgNPs. Trigonella hamosa L. leaves extract, which is used as a reducing agent, not only offers numerous advantages but also requires fewer chemicals. Using microwave assistance in the synthesis of AgNPs makes up a more effective and eco-friendly method. Various pharmaceutical pollutants have been identified in wastewater32, surface and groundwater33, and drinking water34. Specifically, compounds like antibiotics, hormones, and analgesics are commonly found in the aquatic environment35.
The existence of pharmaceutical pollutants in drinking water is considered as a significant problem because they can lead to carcinogenic disorders, which have a negative impact on human health and cause public concern these substances have harmful effects such as resistance to pathogenic microorganisms, toxicity, and endocrine34.
Acetaminophen, often known as paracetamol, is a common, highly water-soluble, non-biodegradable substance that is found in over 100 prescription medicinesb36. Paracetamol (PCA) is one of the most common drugs which used for treating a variety of colds, influenza, and headaches.
Dyes are aromatic organic compounds described as colored, and ionizing, they are used in the textile industry37. Organic dyes are becoming more and more common in daily life as a result of increasing population, civilizations, and consumerism. Organic dyes are used in different sectors such as food, plastics, leather, paints, cosmetics, paper, textiles, and medicines. These non-biodegradable materials are a serious environmental hazard that has to be eliminated from the ecosystem. Both the environment and human health are harmed by these synthetic organic dyes.
The management of organic dyes that reach water bodies through wastewater is considered the most difficult problem in the postproduction of products from these sectors.
Coagulation, reverse osmosis, adsorption, and filtration have all been used in traditional color removal techniques. These hues have aromatic structural stability, so their removal from water is very difficult. Kumari, et al.38 studied the removal of methylene blue from polluted water using composite hydrogel based on pine needles, chitosan, and gelatin as adsorbent.
Many techniques, including electrocoagulation, flocculation, UV light degradation, activated carbon sorption, and redox treatments, are regularly used for reducing dyes39,40. One of the most promising substances for reducing synthetic dyes is nanocatalysts.
Recently, various methods, such as electrochemical41, ozonation42, Fenton and photo-Fenton43, and oxidation techniques H2O2/UV44 have been developed. Heterogeneous photocatalysis is among the most promising advanced oxidation techniques (AOPs) for extracting paracetamol from a water medium.
There have been reports about the photocatalytic degradation of methylene blue by green-synthesized AgNPs under sunlight. Exposure to sun radiation (exposure duration) has a vital role in photocatalytic degradation activity of AgNPs. Through the photocatalytic degradation of MB dye under sunlight, the dye color was dark blue and changed to light blue/colorless after reaction time. With a UV–visible spectrometer, the absorbance can be measured to determine that the dye’s absorption intensity decreases with exposure time, while in the presence of AgNPs catalyst, the dye degradation is shown by a decrease in the absorption intensity, which also indicates a reduction in the dye. The rate of AgNPs degradation depends on many factors, such as the size of the particles, morphology, structure, and pollutant concentration. AgNPs size is the most important factor in dye degradation, as the rate of reaction (dye degradation) increases with decreasing particle size, and also, because smaller particles have a larger volume -to- surface ratio and so they adsorb more strongly to the reactants. According to reports, in the dye degradation process, the AgNPs are the mediators of transferring the electrons. Additionally, it has been suggested that AgNPs’ surface plasmon resonance (SPR) may be excited, which could explain photocatalytic activity. In other words, the photonic excitation of AgNPs speeds up the dye degradation rate45.
Several researches have been published about the photocatalytic activity of green AgNPs on MB dye. According to Saha, et al.46 reported the complete degradation of MB dye in 10 min in the presence of 3.0 mL of Ag nanoparticles with 17 nm average particle size. Additionally, Banu, et al.47 syntheses AgNPs particle with average size 15 nm using Bael Gum as a stabilizer and reluctant and applied it for degradation of MB dye using microwave assitance. Also, Kuyyogsuy, et al.48 reported 90% degradation of methylene blue in 90 min with an average 48 nm particle size.
It has been found that the AgNPs size has an important effect on the degradation of different colors. The smaller the silver particle, the faster it degrades and the more effective the degradation is. The degradation is faster and more efficient when the silver particle is smaller. Additionally, efficacy and dye degradation are influenced by silver nanoparticle concentration, the higher the concentration, the greater the dye degradation.
Although there have been several research studies on the preparation of AgNPs from plant extracts to the best of our knowledge, there is no published literature on the preparation of AgNPs using Trigonella hamosa L. plant. So far, the objectives of this study are to:- (i) prepare AgNPs using Trigonella hamosa L. for the first time. (ii) Compare the preparation methods using microwave irradiation. (iii) photodegradation of methylene blue dye and paracetamol drug using the prepared AgNPs under sunlight and visible lamp irradiation.
Materials and methods
Materials and reagents
Plant material collections
The aerial parts of Trigonella hamosa L. plant (Fig. 1) were collected from Botanical Garden at Aswan University, Aswan Government, Egypt after permission of Aswan University Garden sector. The collected plant material was established in compliance with the national guidelines. They were kindly authenticated by Prof.Mohamed Gaber Shadeed (Department of Botany, Faculty of Science, Aswan University). A voucher specimen no. 012001 was deposited in the Herbarium of Botany Department, Faculty of Science, Aswan University.
Fig. 1.

Picture of Trigonella hamosa plant.
Reagents, chemicals and instruments
Analytical grade chemicals, silver nitrate (1 mM AgNO3), methylene blue dye, and paracetamol were procured from Sigma-Aldrich Co.Domestic microwave oven (ELEKTA) working at a power of 700 W and frequency of 2450 MHz was used for predation of AgNPs. Visible lamp (1000 W) was used as an irradiation source. A TOMOS UV spectrophotometer was used to perform UV–vis spectrum analysis. The FTIR spectrum was recorded on a CLASS LASER PRODUCT-4600 spectrometer with ATR attachment. A Bruker co D8, Germany X-ray spectrometer was used for XRD measurement. High-resolution transmission electron microscopic (HR-TEM) images were taken using a JEOL JEM-2100 microscope.
Methods
Preparation of T. hamosa L. leaf extract
The leaves of T. hamosa L. were washed thoroughly in tap water and then in distilled water, and they were laid out evenly and allowed to air dry. The dried fresh leaves (10 g) were cut into thin strips, placed into a 200 mL glass flask, boiled with bidistilled water at 60 °C in 1 h, cooled, and filtered with Whatman filter paper using a vacuum filter. The Trigonella hamosa L. leaf extract had a light brown color (Fig. 2). For later usage, the extracted solution was kept in a refrigerator.
Fig. 2.

Picture of Trigonella hamosa L. leaves extract.
Synthesis of AgNPs
Microwave assisted synthesis of AgNPs
A 250 mL beaker containing 90 mL of 1 mM silver nitrate solution was used for microwave-assisted synthesis. 10 mL of T. hamosa L. leaf extract was added to the contents and stir well at pH 6.9. After then the beaker with its contents was put in a domestic microwave oven (ELEKTA) that ran at 700 W and 2450 MHz, and it was exposed to microwave radiation for five minutes. After the radiation time, AgNPs solution was centrifuged at a speed of 10,000 rpm for 10 min for separation of the green-synthesized AgNPs. The resultant pellets were washed three times with deionized water and let at room temperature to dry in order to get rid of the contaminants that had settled down with the synthesized NPs. After five minutes of microwave irradiation in the 300–700 nm region, the reaction mixture was analyzed using UV–vis spectrometer to observe the formation of silver AgNPs.
Non microwave assisted synthesis of AgNPs
In order to understand how microwave heating affects the rate of AgNPs formation, the synthesis of AgNPs was also carried out without use of microwave. For that, 90 mL AgNO3 aqueous solution (1 mM) was added to 10 mL of T. hamosa L. extract at pH 6.9, heated at 70 °C with stirring for 3–4 h.
To investigate the AgNPs formation, the reaction mixture was regularly analyzed using UV Vis spectroscopy.
Photocatalytic degradation of MB dye using AgNPs
Typically, a stock solution was made by adding 10 ml of MB dye to 1000 mL of bidistilled water. About 100 mL of methylene blue dye solution with a concentration of 10 ppm was mixed with 10 mg of synthesized AgNPs at pH = 6.5. Additionally, a control sample was kept in the absence of AgNPs. To ensure that the working solution was in equilibrium, the reaction suspension was thoroughly mixed by magnetic stirring for 30 min prior to exposure to radiation. The dispersion was then placed under sunlight and observed for 24 h, from sunrise to sunset. Aliquots of a 2–3 mL suspension were filtered at set time intervals and used to determine the dye’s photodegradation. A UV–Vis spectrophotometer was used to measure the absorbance spectra of the supernatant at different wavelengths. The absorbance value at 660 nm was used to determine the dye concentration throughout degradation. All studies were carried out in a comparable photoreactor. The reactor was put under a visible lamp for 7 h at room temperature (24 ± 2 °C). A UV–Vis spectrophotometer was used to measure the absorbance spectra of the supernatant at different wavelengths. The absorbance value at 660 nm is used to calculate the dye concentration during degradation.
The percentage of MB degradation (DEMB) was obtained by the following Eq. (1):
| 1 |
where C₀ and C are the initial concentration of MB and the final concentration, respectively.
Photocatalytic degradation of Paracetamol (PCA) using AgNPs
The degradation of paracetamol was used to evaluate the photocatalytic degradation efficiency of AgNPs. A stock paracetamol solution was made by dissolving 0.5 g of paracetamol in 0.5 L bidistilled water. The working paracetamol solution 50 ppm was prepared by diluting the stock one the resulting stock solution was then diluted to prepare a working solution. Photodecatalytic degradation tests were carried out using a photoreactor (200 mL) equipped with a magnetic stirrer and a visible lamp. Every catalytic test was carried out at room temperature (24 °C) using visible lamp illumination. For sunlight irradiation, all experiments were conducted in the same photoreactor but under sunlight irradiation. The reactor was exposed to direct sunlight for 24 h, from morning until sunset on sunny days (temperature was 38 ± 2 °C) with constant stirring. Aliquot degraded samples were taken at a specific time period. The resulted Paracetamol concentration was monitored using a UV–vis spectrophotometer at 325 nm. The paracetamol percentage degradation was calculated using Eq. (2).
| 2 |
where C0 is the initial paracetamol concentration, C is the paracetamol concentration in the reactor after illumination.
Characterization
Ultraviolet–visible spectral analysis was performed utilizing a TOMOS UV spectrophotometer. FTIR spectrum was obtained using a CLASS LASER PRODUCT-4600 spectrometer equipped with an ATR attachment. XRD measurements were conducted on a Bruker co D8 spectrometer from Germany. HR-TEM images were obtained with microscope JEOL JEM-2100.
Results and discussion
UV–vis spectroscopic
Ultraviolet–visible spectroscopy is recognized as a method utilized to verify the formation and stability of metal nanoparticles, as the solution displays an absorption band within the UV–vis range due to the surface plasmon oscillations of metal electrons, which provide insights into the shape and size of the nanoparticles. The mixture of AgNO3 and T. hamosa L. plant extract appeared pale yellow; the solution’s color shifted to a yellowish brown when subjected to microwave radiation. (Fig. 3).
Fig. 3.

Images of (a) mixture of plant extract and AgNO3 before microwave and (b) AgNP-after microwave.
There was no peak between 300 and 700 nm for T. hamosa L. plant extract before microwave irradiation (Fig. 4).
Fig. 4.

Images of (a) mixture of plant extract and AgNO3 before microwave and (b) AgNP-after microwave.
AgNPs were prepared using T. hamosa L. leave extract without microwave irradiation to investigate the impact of microwave irradiation on the formation rate of AgNPs. The UV–vis.spectra of the resulted reaction solution without microwave irradiation was recorded at 60 min intervals (Fig. 5a). After 1 h reaction time, a peak was observed at 440 nm due to surface plasmon resonance (SPR) of AgNPs.
Fig. 5.

(a) UV–vis absorption spectra of AgNP synthesized with T. hamosa L. leaves extract, (a) without microwave irradiation (60 min stirring time, 70 °C), (b) under microwave irradiation after 5 min.recorded after 60 min under.
The microwave method is a faster way to synthesize nanoparticles since it reduced Ag⁺ ions into Ag and simultaneously formed stable nanoparticles in about 5 min. Figure 5b illustrates the UV–Vis spectra collected during the microwave synthesis of AgNPs. At 5 min of the irradiation process, a peak was detected at 430 nm, attributed to the surface plasmon resonances (SPR) of AgNPs; this peak’s intensity grew with the duration of irradiation while its position remained relatively stable. After five minutes of exposure, there was no further increase in absorbance, indicating that all Ag⁺ had been converted to Ag. The SPR band emerges due to the collective oscillations of the conduction electrons in the nanoparticles and is significantly affected by the size and shape of the nanoparticles49. It has been noted that the SPR band shifts towards longer wavelengths as the particle size increases (14–16 nm). In this synthetic approach, the microwave-assisted synthesis produces smaller nanoparticles in significantly shorter reaction times compared to traditional methods without microwave assistance. TEM analysis provides additional confirmation of this observation.
Anis, et al.27 reported the presence of an absorption band in the range of 400–500 nm when synthesized AgNPs using pineapple leaves waste mediated by microwave-assisted extraction.
Microwave synthesis has been utilized for nanoparticle production due to its ability to deliver quick and uniform heating of the starting materials. The penetration ability of microwave irradiation allows for even heating of the reaction mixture. This leads to rapid growth of crystals, resulting in crystallites with a narrow size distribution. In contrast to traditional methods, microwave irradiation synthesis offers the benefit of shorter reaction times, which can be attributed to the combined electric and magnetic forces of the microwave that generate friction and molecular collisions.
T. hamosa L. leaf extract is abundant in phenolic compounds and flavonoids, among other phytochemicals. These phytochemicals serve as both stabilizing and reducing agents during the production of AgNPs. By adding the leaf extract to the AgNO3 solution, the silver ions are reduced to silver atoms, which then aggregate to form AgNPs. Also, the phytochemicals coat the nanoparticles, preventing them from coalescing50. The position of the AgNPs SPR band remains unchanged even after being stored at room temperature for several weeks, as demonstrated by UV–vis spectra, indicating that the phytochemicals effectively stabilize the AgNPs.
FTIR
The different functional groups in the T. hamosa L. leaf extract and on the surface of their synthesized AgNPs were identified by FTIR analysis. These functional groups have an important role in reducing Ag⁺ to Ag and stabilizing the synthesized AgNPs.
The impact of T. hamosa leaves extract in stabilizing the AgNPs was examined using FTIR spectroscopy. The spectrum FTIR of the T. hamosa leaf extract (Fig. 6a) revealed prominent absorption peaks at 1118, 1384, 1716, 2923, and 3438 cm−1. The strong broad band at 3438 cm−1 indicates the presence of -OH functional groups found in alcohols and phenolic substances. An aliphatic-CH stretching band is located at 2923 cm−1. Band amide I of the proteins extracted from T. hamosa leaves has also been recognized to show a band at 1716 cm−1. The geminal methyl has a band at 1384 cm−1, while the ether (C–O–C) bond has a weak band at 1118 cm−1. These functional groups provided evidence for the presence of phytochemical constituents51. According to, Lin, et al.52, the carbonyl groups from protein peptides and amino acid residues and the hydroxyl groups of alcohols have a great affinity for binding metals. This enables them to function as encapsulating agents and therefore prevents the agglomeration of nanoparticles.
Fig. 6.

(a) FT-IR spectrum of an aqueous leaf extract, (b), and (c) synthesized AgNPs without and by microwave.
The FTIR spectrum of the AgNPs synthesized without microwave (Fig. 3b) showed bands at 3413, 2923, 1637, 1384, and 1020 cm−1. The CO- (NH) group is represented by a band at 1637 cm−1, while the -OH group in phenols and alcohols is represented by a band at 3413 cm−1. AgNO3 reduction is to be the cause of a small decrease in band intensity from 3438 to 3413 cm−1 by a value of 25 cm−1.The absorption frequency shift indicates that the -OH group is involved in the reduction process. Also, the shift of a band from 1716 to 1637 cm−1 indicates that the CO-(NH) group is also involved in the reduction of AgNPs. Additionally, bands at 2923, 1384, and 1020 cm−1 represent aliphatic –CH stretching, geminal methyl, and ether linkage, respectively. The FTIR spectrum of the synthesized AgNPs using microwave (Fig. 3c) showed bands at 3413, 2919, 1635, 1384, and 1018 cm−1. The –OH in phenols and alcohols is represented by a band at 3413 cm−1, while the stretching vibration of the CO-(NH) group is represented by a band at 1635 cm−1. AgNO3 reduction is as the result of a small decrease in band intensity from 3438 to 3413 cm−1 by 25 cm−1; and the absorption frequency shift indicates that the -OH group is involved in the reduction process. The shift of a band from 1716 to 1635 cm−1 indicates that the CO–(NH) group is also involved in the reduction of AgNPs. Additionally, bands at 2919, 1384, and 1018 cm−1 represent aliphatic –CH stretching, geminal methyl, and ether linkage, respectively.
In conclusion FTIR data suggested that AgNPs produced by T. hamosa leaf extract are composed of proteins and metabolites as terpenoids with functional groups of alcohols, amines, ketones, aldehydes, and carboxylic acids.
XRD study
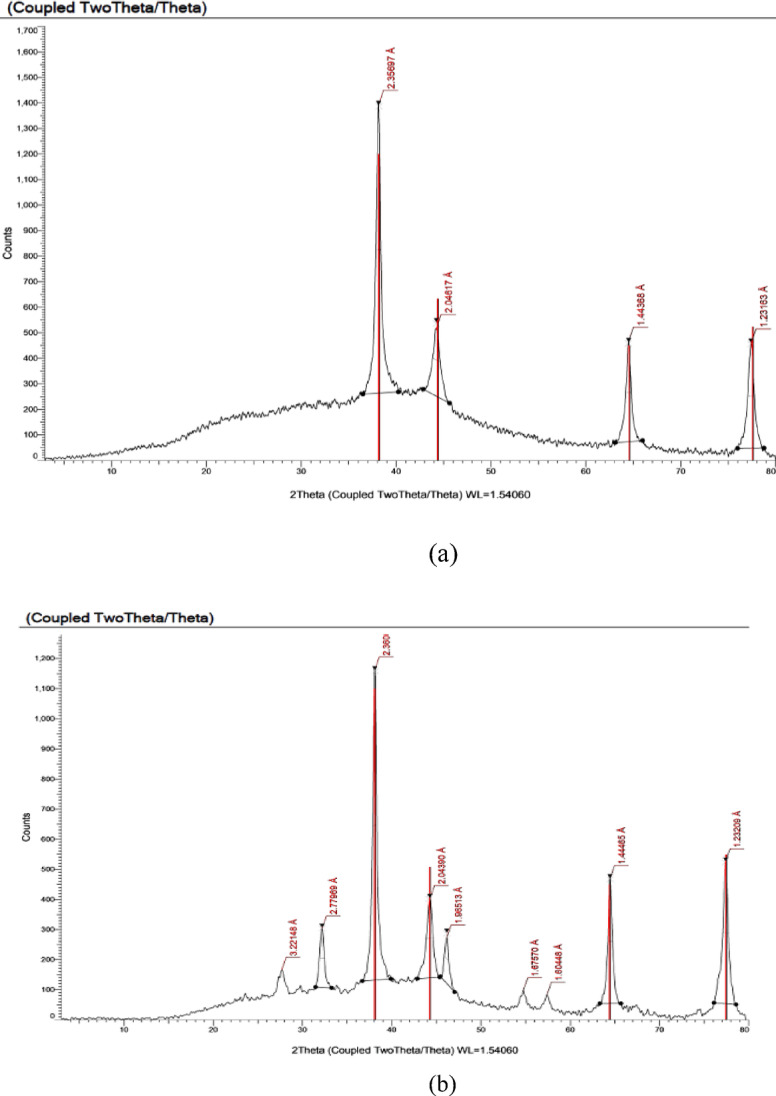
The XRD analysis provides insights into the crystalline characteristics of the AgNPs. The XRD spectrum for AgNP-T. hamosa without microwave treatment (Fig. 7a) reveals diffraction peaks at 2θ angles of 38.139°, 44.26°, 64.51°, and 77.40°. In contrast, the spectrum obtained with microwave treatment (Fig. 7b) displays diffraction peaks at 2θ values of 32.17°, 38.098°, 44.26°, 46.14°, 64.45°, and 77.40°. The face-centered cubic structure of Ag allows these peaks to be attributed to the (111), (200), (220), and (311) crystallographic plane Joint Committee on Powder Diffraction Standard record (JCPDS File no. 04–0783) 50.
Fig. 7.
(a). XRD pattern of AgNP- T. hamosa prepared without microwave. (b) XRD pattern of AgNP- T. hamosa prepared using microwave.
Based on the XRD results, AgNP-T. hamosa is predominantly crystalline. Debye–Scherrer’s formula is used to estimate the average size of the AgNPs53. The average of silver nanoparticles synthesized by T. hamosa without microwave is 14 nm, and the average of AgNPs synthesized by T. hamosa using microwave is 16 nm (Tables 1, 2). Table 3 shows published research about the particle size of AgNPs prepared by different plant extract.
Table 1.
Crystallite size, FWHM, particle size and d-spacing values of AgNPs synthesized by T. hamosa extract without microwave with respect to 2θ.
| Position 2θ (°) | FWHM 2θ (°) | d-spacing (Å) | Particle size (nm) |
|---|---|---|---|
| 38.151° | 0.379° | 2.357 Å | 15.7 |
| 44.229° | 0.100° | 2.046 Å | 10.3 |
| 64.493° | 0.351 | 1.443 Å | 15.7 |
| 77.429° | 0.369° | 1.231 Å | 14.0 |
Average particle size of the nanoparticles: 14.
Table 2.
Crystallite size, FWHM, particle and d-spacing values of AgNPs synthesized by T. hamosa extract using microwave with respect to 2θ.
| Position 2θ (°) | FWHM 2θ (°) | d-spacing (Å) | Particle size (nm) |
|---|---|---|---|
| 32.174° | 0.567° | 2.779 Å | 14.5 |
| 38.098° | 0.461° | 2.360 Å | 18.1 |
| 44.260° | 0.762° | 2.044 Å | 11.1 |
| 46.148° | 0.491° | 1.965 Å | 17.5 |
| 64.457° | 0.503° | 1.444 Å | 18.5 |
| 77.403° | 0.650° | 1.231 Å | 15.5 |
Average particle size of the nanoparticles: 16.
Table3.
Summary of the competitive research on MB dye degradation using different plants.
| Plant | Size of AgNPs (nm) | % MB degradation | Condition | References |
|---|---|---|---|---|
| Fruit Gmelina arborea | 17 | 100 | 10 min | Saha.et al., 2017 |
| Cauliflower (Brassica oleracea var. botrytis) | 35.08 | 97.57 | 150 min | Kadam et al.,2020 |
| Peltophorum pterocarpum (leaf) | 50 | 82 | 6 min | Adesetan, 2023 |
| Combretum indicum (leaf) | 48 | 90 | 90 min | Kuyyogsuy et al., 2021 |
| Andographis Paniculata Leaves | 85 | 84 | 16 h | Noorafshaet al., 2021 |
| Chlorella vulgaris | 55 | 96.51 | 3 h | Rajkumar et al., 2021 |
| Trigonella hamosa L. | 15 | 96.2 | 7 h | Our study using AgNPs synthesized with microwave |
The AgNPs synthesized using T. hamosa leaf extract were optimized by different parameters including time, temperature, and pH. The results obtained and represented in Fig. 7a, b which show that the rate of AgNP nanoparticles formation is increased by increasing temperature. The particle size is initially reduced as a result of the reduction in aggregation of the growing nanoparticles. AgNPs formation is decreased in acidic conditions, but it is enhanced in basic one. At low pH values (pH 4), large nanoparticles were generated, while at high pH value (pH 9) small and highly dispersed AgNPs were obtained. At neutral pH, the normal AgNPs size is formed. The optimum time needed to complete the formation of AgNPs was 5 min using a microwave and 4 h without a microwave.
HR-TEM study
To confirm the shape, size, and morphology of the synthesized AgNPs, TEM analysis was performed. The TEM images (Figs. 8, 9) confirm that the AgNPs formed without and by microwave are in nanoscale, and the majority of the particles have spherical shape with an average diameter of 9–24 nm for that without microwave (Fig. 8) and 5–23 nm for that with microwave (Fig. 9). Both large and small particles were also observed. This result was as that during the microwave irradiation, smaller particles transformed into larger particles via subsequent crystallization, which required the nucleation and growth processes of larger particles from smaller ones. The results clearly show that the synthesized colloidal AgNPs were uniformly distributed, homogeneous, primarilyspherical, and well crystalline in nature, as shown in Figs. 8, 9. Because of the encapsulation of the AgNPs with the leaf extract of the T. hamosa, agglomeration of the AgNPs was not seen.
Fig. 8.

(a, b & c) TEM images of AgNP-synthesized without microwave at different magnifications, (d) SAED pattern.
Fig. 9.

(a, b & c) TEM images of AgNP synthesized using microwave at different magnifications, (d) SAED pattern.
Photocatalytic degradation of MB dye using AgNPs
By the decolonization of industrial dyes under sunlight and visible lamp irradiation, the photocatalytic activity of green-produced AgNPs was investigated. The photocatalytic performance of the synthesized AgNPs was evaluated using methylene blue dye, which displayed a major absorption band at 620 nm. It was observed that MB dye is converted from the oxidized form (deep blue) to the reduced form (leuco form), which is colorless in the presence of sunlight for 24 h with AgNPs synthesized from Trigonella hamosa L. (Fig. 10). The most probable explanation is that electrons are activated when photons strike the surface of the Ag NPs. The dissolved oxygen molecules from the solution receive the excited electrons from the surface of the AgNPs and change them into O2 radicals, which breakdown the dye and convert the organic color into simpler organic molecules54. Therefore, in the presence of visible lamp irradiation, the biosynthesized AgNPs may function as a stable and effective green catalyst for the degradation of MB.
Fig. 10.

Photo degradation of MB dye using Trigonella hamosa leaf extract mediated synthesized silver nanoparticles.
MB dye is a cationic thiazine dye that has numerous applications in a several fields, including biology and chemistry. MB dye is used in the aquaculture sector as a chemotherapeutic and anti-malarial agent as well as indicator in analytical chemistry. Also, it is used to analyze the trace concentration of sulfide ions in water samples55.
The sun and visible lamp irradiation were irradiated to the MB dye solution, and the photocatalytic studies were conducted for 10 ppm MB dye concentration, 24 h sunlight irradiation, and 450 min under visible lamp irradiation.
In our study, it’s found that 96.2% degradation of MB occurs in the presence of 10 mg of AgNPs with an average size of 14 nm within 24 h under sunlight, and 94.9% within 7 h under a visible lamp. Table 3 shows the degradation of MB using different plant extract regarding to our study.
The proportion of dye degradation was calculated according to the following formula:
| 3 |
where the degradation percentage is denoted by % D, Co and C refer to the initial and final concentration of the MB dye after decolorization, respectively. The data of the degradation conditions (time and the rate constant values) are provided in Tables 4 and 5.
Table 4.
Rate constants and kinetic studies for degradation of MB dye using AgNPs under solar light.
| 10 ppm Methylene Blue + 10 mg (AgNO3) + Solar light | |||||
|---|---|---|---|---|---|
| T (hr) | C | C/°C | Log C/°C | − Log C/°C | % D |
| 0 | 10 | 1 | 0 | 0 | 0% |
| 3 | 8.21 | 0.821 | − 0.0856 | 0.0856 | 17.9 |
| 6 | 6.54 | 0.654 | − 0.1844 | 0.1844 | 34.6 |
| 9 | 5.57 | 0.557 | − 0.2541 | 0.2541 | 44.3 |
| 12 | 4.47 | 0.447 | − 0.3496 | 0.3496 | 55.3 |
| 15 | 2.62 | 0.262 | − 0.5816 | 0.5816 | 73.8 |
| 18 | 1.22 | 0.122 | − 0.9136 | 0.9136 | 87.8 |
| 21 | 0.49 | 0.049 | − 1.3098 | 1.3098 | 95.1 |
| 24 | 0.38 | 0.038 | − 1.4202 | 1.4202 | 96.2 |
Table 5.
Rate constants and kinetic studies for degradation of MB dye using AgNPs under visible lamp.
| 10 ppm Methylene Blue + 10 mg (AgNO3) + visible light | |||||
|---|---|---|---|---|---|
| T min | C | C/°C | Log C/°C | − Log C/°C | % D |
| 0 | 10 | 1 | 0 | 0 | 0 |
| 30 | 9.67 | 0.967 | − 0.0145 | 0.0145 | 3.3 |
| 60 | 9.03 | 0.903 | − 0.0443 | 0.0443 | 9.7 |
| 90 | 7.9 | 0.790 | − 0.1023 | 0.1023 | 21 |
| 120 | 6.89 | 0.689 | − 0.1617 | 0.1617 | 31.1 |
| 150 | 5.33 | 0.533 | − 0.2732 | 0.2732 | 46.7 |
| 180 | 4.61 | 0.461 | − 0.3362 | 0.3362 | 53.9 |
| 210 | 3.74 | 0.374 | − 0.4271 | 0.4271 | 62.6 |
| 240 | 3.07 | 0.307 | − 0.5128 | 0.5128 | 69.3 |
| 270 | 2.6 | 0.260 | − 0.5850 | 0.5850 | 74 |
| 300 | 1.99 | 0.199 | − 0.7011 | 0.7011 | 80.1 |
| 330 | 1.58 | 0.158 | − 0.8013 | 0.8013 | 84.2 |
| 360 | 1.16 | 0.116 | − 0.9355 | 0.9355 | 88.4 |
| 390 | 0.7 | 0.07 | − 1.1549 | 1.1549 | 93 |
| 420 | 0.62 | 0.062 | − 1.2076 | 1.2076 | 93.8 |
| 450 | 0.51 | 0.051 | − 1.2924 | 1.2924 | 94.9 |
The plot of (C/Co) Vs time (t) (Fig. 11 a, b) confirms that the dye degradation increased with time and was maximum at 24 h under sunlight and 450 min under visible lamp irradiation. MB dye removal can occur when sunlight or visible lamp irradiation is present.
Fig. 11.

The relationship between (C/Co) and time (t) for MB dye degradation in maximum time 24 h under natural sunlight irradiation (a) and 450 min under visible lamp (b).
In this work, we can estimate that 94.9% of the MB dye in distilled water is degraded using a visible lamp after 7 h, and around 96.2% is degraded after 24 h under natural sunlight irradiation, as shown in Fig. 12a, b.
Fig. 12.

The degradation percentage of MB dye under natural sunlight irradiation (a) and under visible lamp (b).
Photocatalytic degradation of paracetamol using AgNPs
The proportion of paracetamol degradation was calculated according to Eq. 3.
Where the degradation percentage is denoted by % D, Co and C refer to the initial and residual concentration of the paracetamol solution after removal in equilibrium, respectively.
The specifics of the degradation in relation to time and the values of the rate constant.are provided in Tables 6 and 7.
Table 6.
Rate constants and kinetic studies for AgNPs for paracetamol removal under solar light for 24 h.
| 50 ppm paracetamol + 10 mg (AgNO3) + Solar light | |||||
|---|---|---|---|---|---|
| T (hr) | C | C/°C | Log C/°C | − Log C/°C | % D |
| 0 | 50 | 1 | 0 | 0 | 0 |
| 3 | 43.9 | 0.878 | − 0.0565 | 0.0565 | 12.2 |
| 6 | 38.65 | 0.773 | − 0.1118 | 0.1118 | 22.7 |
| 9 | 35.7 | 0.714 | − 0.1463 | 0.1463 | 28.6 |
| 12 | 32.35 | 0.647 | − 0.1890 | 0.1890 | 35.3 |
| 15 | 22.2 | 0.444 | − 0.3526 | 0.3526 | 55.6 |
| 18 | 11.35 | 0.227 | − 0.6439 | 0.6439 | 77.3 |
| 21 | 3.8 | 0.076 | − 1.1191 | 1.1191 | 92.4 |
| 24 | 2.75 | 0.055 | − 1.2596 | 1.2596 | 94.5 |
Table 7.
Rate constants and kinetic studies of AgNPs for paracetamol removal under visible lamp for 7 h.
| 50 ppm paracetamol + 10 mg (AgNO3) + visible light | |||||
|---|---|---|---|---|---|
| T min | C | C/°C | Log C/°C | − Log C/°C | % D |
| 0 | 50 | 1 | 0 | 0 | 0 |
| 30 | 49.85 | 0.997 | − 0.0013 | 0.0013 | 0.3 |
| 60 | 48.15 | 0.963 | − 0.0163 | 0.0163 | 3.7 |
| 90 | 47.95 | 0.959 | − 0.0181 | 0.0181 | 4.1 |
| 120 | 46.75 | 0.935 | − 0.0291 | 0.0291 | 6.5 |
| 150 | 46.55 | 0.931 | − 0.0310 | 0.0310 | 6.9 |
| 180 | 46 | 0.92 | − 0.0362 | 0.0362 | 8 |
| 210 | 44.25 | 0.885 | − 0.0530 | 0.0530 | 11.5 |
| 240 | 37.7 | 0.754 | − 0.1226 | 0.1226 | 24.6 |
| 270 | 34.95 | 0.699 | − 0.1555 | 0.1555 | 30.1 |
| 300 | 27.7 | 0.554 | − 0.2564 | 0.2564 | 44.6 |
| 330 | 19.6 | 0.392 | − 0.4067 | 0.4067 | 60.8 |
| 360 | 13.4 | 0.268 | − 0.5718 | 0.5718 | 73.2 |
| 390 | 5.05 | 0.101 | − 0.9956 | 0.9956 | 89.9 |
| 420 | 4.2 | 0.084 | − 1.0757 | 1.0757 | 91.6 |
| 450 | 3.95 | 0.079 | − 1.1023 | 1.1023 | 92.1 |
Figure 13a, b reveals the plot of (C/Co) vs. time (t), which confirms that the paracetamol degradation increased with time and was maximum at 24 h under sunlight and 450 min under visible lamp irradiation. Paracetamol removal can occur when sunlight or visible lamp irradiation is present.
Fig. 13.

The relationship between (C/Co) and time (t) for paracetamol degradation in maximum time at 24 h under natural sunlight irradiation (a), and 450 min under visible lamp (b).
The resulted data in this work estimated that 92% of the paracetamol in distilled water can be degraded using visible lamp irradiation, and 94.5% is degraded after 24 h under natural sunlight irradiation, as shown in Fig. 14a, b.
Fig. 14.

The degradation percentage of paracetamol under natural sunlight irradiation (a) and under visible lamp (b).
Effect of recycle times of AgNPs on the photo degradation of paracetamol and methylene blue dye under sun and visible lamp irradiation
A green photocatalysis technology has no concerns with waste disposal, thus it is vital to preserve AgNPs during each usage cycle.
The reuse and regeneration of AgNPs are investigated, and the outcome is shown in Figs. 15 and 16. After each cycle, it is obvious that the photocatalyst was subjected to centrifugation, washing, and drying and then reused for subsequent degradation. The photodegradation of the Paracetamol and Methylene Blue under sunlight is reduced by about 30% after five cycles, and the photodegradation under visible lamp irradiation is reduced by about 20% after four cycles. The results confirm that AgNPs remain highly photocatalytically active after five cyclical experiments.
Fig. 15.

Effect of recycle times of on the photodegradation of paracetamol and MB dye under natural sunlight irradiation.
Fig. 16.

Effect of recycle times of on the photodegradation of paracetamol and MB dye under natural sunlight irradiation.
Conclusions
In this work, AgNPs was synthesized using a microwave-assisted method technique as a novel approach, employing the leaf extract of T. hamosa as both a reducing and capping agent for the synthesis of nanoparticles in an aqueous solution. This method for synthesis of AgNPs is quick, simple, economical, and environmentally friendly. The nanoparticles exhibit stability in an aqueous medium for an extended period.
FTIR, XRD, TEM, and UV–vis methods were used to characterize the prepared AgNPs. The AgNPs yielded from this method were highly crystalline and well dispersed and found to be extremely effective catalysts for the degradation of MB dye and paracetamol drug.
Degradation of MB dye and paracetamol drug was performed using the prepared AgNPs under sunlight and visible lamp irradiation. The degradation of MB dye was found to be 96.2% and 94.9%, whereas that for paracetamol was 94.5% and 92% when subjected to sunlight and visible lamp irradiation, respectively. This novel method for green synthesis of AgNPs has various benefits and provides an efficient and cost-effective way to protect the environment.
Also, the most significant finding of the study is to use this green AgNPs for photocatalysis degradation of dyes and drugs.
Author contributions
All authors contributed to the study conception and design. Material preparation, data collection and analysis were performed by Tereasa M. Ghabrial. The first draft of the manuscript was written by M.Nageeb Rashed, and all authors commented on previous versions of the manuscript. All authors read and approved the final manuscript.
Funding
Open access funding provided by The Science, Technology & Innovation Funding Authority (STDF) in cooperation with The Egyptian Knowledge Bank (EKB).
Data availability
The datasets used and/or analysed during the current study available from the corresponding author (M.Nageeb Rashed, email: mnrashed@aswu.edu.eg) on reasonable request.
Declarations
Competing interests
The authors declare no competing interests.
Ethical approval
Not available.
Footnotes
Publisher’s note
Springer Nature remains neutral with regard to jurisdictional claims in published maps and institutional affiliations.
References
- 1.Tarannum, N. & Gautam, Y. K. Facile green synthesis and applications of silver nanoparticles: a state-of-the-art review. RSC Adv.9, 34926–34948 (2019). [DOI] [PMC free article] [PubMed] [Google Scholar]
- 2.Edison, T. N. J. I., Lee, Y. R. & Sethuraman, M. G. Green synthesis of silver nanoparticles using Terminalia cuneata and its catalytic action in reduction of direct yellow-12 dye. Spectrochim. Acta Part A Mol. Biomol. Spectrosc.161, 122–129 (2016). [DOI] [PubMed] [Google Scholar]
- 3.Deekonda, K., Muniyandy, S., Lim, Y. Y. & Janarthanan, P. Electron beam radiation mediated green synthesis of silver nanoparticles using carboxymethyl sago pulp obtained from sago waste. Polymer86, 147–156 (2016). [Google Scholar]
- 4.Skiba, M. I., Vorobyova, V. I., Pivovarov, A. & Makarshenko, N. P. Green synthesis of silver nanoparticles in the presence of polysaccharide: optimization and characterization. J. Nanomater.2020, 3051308 (2020). [Google Scholar]
- 5.Some, S. et al. Biosynthesis of silver nanoparticles and their versatile antimicrobial properties. Mater. Res. Express6, 012001 (2018). [Google Scholar]
- 6.Ahmed, S., Ahmad, M., Swami, B. L. & Ikram, S. A review on plants extract mediated synthesis of silver nanoparticles for antimicrobial applications: a green expertise. J. Adv. Res.7, 17–28 (2016). [DOI] [PMC free article] [PubMed] [Google Scholar]
- 7.Alaqad, K. & Saleh, T. A. Gold and silver nanoparticles: synthesis methods, characterization routes and applications towards drugs. J. Environ. Anal. Toxicol.10.4172/2161-0525.1000384 (2016). [Google Scholar]
- 8.Subhani, M. A. et al. Synthesis of silver nanoparticles from plant extracts and their antimicrobial application. Int. J. Biosci.14, 243–257 (2019). [Google Scholar]
- 9.Khan, A. U. et al. Electrochemical and antioxidant properties of biogenic silver nanoparticles. Int. J. Electrochem. Sci.10, 7905–7916 (2015). [Google Scholar]
- 10.Moldovan, B., David, L., Achim, M., Clichici, S. & Filip, G. A. A green approach to phytomediated synthesis of silver nanoparticles using Sambucusnigra L. fruits extract and their antioxidant activity. J. Mol. Liq.221, 271–278 (2016). [Google Scholar]
- 11.Thuc, D. T. et al. Green synthesis of colloidal silver nanoparticles through electrochemical method and their antibacterial activity. Mater. Lett.181, 173–177 (2016). [Google Scholar]
- 12.Gurunathan, S., Park, J. H. & Han, J. W. Kim JH 2015 Comparative assessment of the apoptotic potential of silver nanoparticles synthesized by Bacillustequilensis and Calocybeindica in MDA-MB-231 human breast cancer cells: targeting p53 for anticancer therapy. Int. J. Nanomedicine10, 4203–4223 (2015). [DOI] [PMC free article] [PubMed] [Google Scholar]
- 13.López-Miranda, J. L., Vázquez, M., Fletes, N., Esparza, R. & Rosas, G. Biosynthesis of silver nanoparticles using a Tamarixgallica leaf extract and their antibacterial activity. Mater. Lett.176, 285–289 (2016). [Google Scholar]
- 14.Dhand, V. et al. Green synthesis of silver nanoparticles using Coffeaarabica seed extract and its antibacterial activity. Mater. Sci. Eng., C58, 36–43 (2016). [DOI] [PubMed] [Google Scholar]
- 15.Masum, M. M. I. et al. Biogenic synthesis of silver nanoparticles using Phyllanthusemblica fruit extract and its inhibitory action against the pathogen Acidovorax oryzae strain RS-2 of rice bacterial brown stripe. Front. Microbiol.10, 820 (2019). [DOI] [PMC free article] [PubMed] [Google Scholar]
- 16.Iranifam, M. Chemiluminescence reactions enhanced by silver nanoparticles and silver alloy nanoparticles: applications in analytical chemistry. TrAC, Trends Anal. Chem.82, 126–142 (2016). [Google Scholar]
- 17.Castillo-Henríquez, L. et al. Green synthesis of gold and silver nanoparticles from plant extracts and their possible applications as antimicrobial agents in the agricultural area. Nanomaterials10, 1763 (2020). [DOI] [PMC free article] [PubMed] [Google Scholar]
- 18.Some, S. et al. Bio-molecule functionalized rapid one-pot green synthesis of silver nanoparticles and their efficacy toward the multidrug resistant (MDR) gut bacteria of silkworms (Bombyxmori). RSC Adv.10, 22742–22757 (2020). [DOI] [PMC free article] [PubMed] [Google Scholar]
- 19.Ni, Z. et al. Synthesis of silver nanoparticle-decorated hydroxyapatite (HA@ Ag) poriferous nanocomposites and the study of their antibacterial activities. RSC Adv.8, 41722–41730 (2018). [DOI] [PMC free article] [PubMed] [Google Scholar]
- 20.Ajitha, B., Reddy, Y. A. K., Rajesh, K. M. & Reddy, P. S. Sesbania grandiflora leaf extract assisted green synthesis of silver nanoparticles: Antimicrobial activity. Mater. Today: Proc.3, 1977–1984 (2016). [Google Scholar]
- 21.Rao, P. V. et al. Phytochemicals and biogenic metallic nanoparticles as anticancer agents. Oxid. Med. Cell. Longev.2016, 3685671 (2016). [DOI] [PMC free article] [PubMed] [Google Scholar]
- 22.Karaagac, Z., Gul, O. T., Ildiz, N. & Ocsoy, I. Transfer of hydrophobic colloidal gold nanoparticles to aqueous phase using catecholamines. J. Mol. Liq.315, 113796 (2020). [Google Scholar]
- 23.Leng, Y. et al. Protein-directed synthesis of highly monodispersed, spherical gold nanoparticles and their applications in multidimensional sensing. Sci. Rep.6, 28900 (2016). [DOI] [PMC free article] [PubMed] [Google Scholar]
- 24.He, X., Gao, L. & Ma, N. One-step instant synthesis of protein-conjugated quantum dots at room temperature. Sci. Rep.3, 2825 (2013). [DOI] [PMC free article] [PubMed] [Google Scholar]
- 25.Shi, H. et al. One-pot and one-step synthesis of bioactive urease/ZnFe 2 O 4 nanocomposites and their application in detection of urea. Dalton Trans.43, 9016–9021 (2014). [DOI] [PubMed] [Google Scholar]
- 26.Saxena, A., Tripathi, R. M. & Singh, R. P. Biological synthesis of silver nanoparticles by using onion (Allium cepa) extract and their antibacterial activity. Dig. J. Nanomater Bios.5, 427–432 (2010). [Google Scholar]
- 27.Anis, S. N. S. et al. Microwave-assisted green synthesis of silver nanoparticles using pineapple leaves waste. Clean. Eng. Technol.15, 100660 (2023). [Google Scholar]
- 28.Boulos, L. Flora of egypt: monocotyledons (Alismataceae-Orchidaceae) (Al Hadara Pub, 1999). [Google Scholar]
- 29.Hamed, A. I. Steroidal saponins from the seeds of Trigonellahamosa L.. Nat. Prod. Commun.2, 1934578X0700200207 (2007). [Google Scholar]
- 30.Salah-Eldin, A.-E., Mahalel, U. A. & Hamed, A. I. Protective role of trigonella hamosa saponins against diabetic perturbations and complications in rats. Nat. Prod. Commun.2, 1934578X0700200805 (2007). [Google Scholar]
- 31.Kumar, P. et al. Antidiabetic effects of Trigonella foenum-graecum seed powder in a rat model. Toxicol. Environ. Chem.93, 2085–2097 (2011). [Google Scholar]
- 32.Di Marcantonio, C. et al. Evaluation of removal of illicit drugs, pharmaceuticals and caffeine in a wastewater reclamation plant and related health risk for non-potable applications. Process Saf. Environ. Prot.152, 391–403 (2021). [Google Scholar]
- 33.Silori, R. et al. Global groundwater vulnerability for pharmaceutical and personal care products (PPCPs): the scenario of second decade of 21st century. J. Environ. Manag.320, 115703 (2022). [DOI] [PubMed] [Google Scholar]
- 34.Syed, A. et al. Highly-impressive performances of novel NiCo2O4/Bi2O3/Ag2ZrO3 nanocomposites in photocatalysis system, removal pathway, toxicity estimation, and antibacterial activities. J. Taiwan Inst. Chem. Eng.149, 105004 (2023). [Google Scholar]
- 35.Chen, Y. et al. A facile preparation method for efficiency a novel LaNiO3/SrCeO3 (pn type) heterojunction catalyst in photocatalytic activities, bactericidal assessment and dopamine detection. Surf. Interfaces38, 102830 (2023). [Google Scholar]
- 36.Behravesh, S., Mirghaffari, N., Alemrajabi, A. A., Davar, F. & Soleimani, M. Photocatalytic degradation of acetaminophen and codeine medicines using a novel zeolite-supported TiO2 and ZnO under UV and sunlight irradiation. Environ. Sci. Pollut. Res.27, 26929–26942 (2020). [DOI] [PubMed] [Google Scholar]
- 37.Bonnia, N. N. et al. Green biosynthesis of silver nanoparticles using ‘Polygonum Hydropiper’and study its catalytic degradation of methylene blue. Procedia Chemistry19, 594–602 (2016). [Google Scholar]
- 38.Kumari, B., Chauhan, S., Kumar, K., Singh, S. & Chauhan, G. S. Simultaneous removal of cationic and anionic dyes from a complex mixture using a novel composite hydrogel based on pine needles, chitosan, and gelatin. Int. J. Biol. Macromol.307, 141447 (2025). [DOI] [PubMed] [Google Scholar]
- 39.Rashed, M. N., Arifien, A. E. & El-Dowy, F. A. Preparation and characterization of nanomuscovite by intercalation method for adsorption of heavy metals from polluted water. Environ. Geochem. Health45, 5127–5144 (2023). [DOI] [PMC free article] [PubMed] [Google Scholar]
- 40.Vanaja, M. et al. Degradation of methylene blue using biologically synthesized silver nanoparticles. Bioinorg. Chem. Appl.2014, 742346 (2014). [DOI] [PMC free article] [PubMed] [Google Scholar]
- 41.Henrique, J. M. M. et al. Integrated-electrochemical approaches powered by photovoltaic energy for detecting and treating paracetamol in water. J. Electroanal. Chem.876, 114734 (2020). [Google Scholar]
- 42.Peralta-Hernández, J. M. & Brillas, E. A critical review over the removal of paracetamol (acetaminophen) from synthetic waters and real wastewaters by direct, hybrid catalytic, and sequential ozonation processes. Chemosphere313, 137411 (2023). [DOI] [PubMed] [Google Scholar]
- 43.Pacheco-Álvarez, M., Benítez, R. P., Rodríguez-Narváez, O. M., Brillas, E. & Peralta-Hernández, J. M. A critical review on paracetamol removal from different aqueous matrices by Fenton and Fenton-based processes, and their combined methods. Chemosphere303, 134883 (2022). [DOI] [PubMed] [Google Scholar]
- 44.Pasupuleti, K. S. et al. ZnO@ Ti3C2T x MXene hybrid composite-based schottky-barrier-coated SAW sensor for effective detection of sub-ppb-level NH3 at room temperature under UV illumination. ACS Mater. Lett.5, 2739–2746 (2023). [Google Scholar]
- 45.Ma, Y., Tao, L., Bai, S. & Hu, A. Green synthesis of Ag nanoparticles for plasmon-assisted photocatalytic degradation of methylene blue. Catalysts11, 1499 (2021). [Google Scholar]
- 46.Saha, J., Begum, A., Mukherjee, A. & Kumar, S. A novel green synthesis of silver nanoparticles and their catalytic action in reduction of Methylene Blue dye. Sustain. Environ. Res.27, 245–250 (2017). [Google Scholar]
- 47.Banu, R., Ramakrishna, D., Reddy, G. B., Veerabhadram, G. & Mangatayaru, K. G. Facile one-pot microwave-assisted green synthesis of silver nanoparticles using Bael gum: Potential application as catalyst in the reduction of organic dyes. Mater. Today: Proc.43, 2265–2273 (2021). [Google Scholar]
- 48.Kuyyogsuy, A. et al. Green synthesis, characterization, antioxidant, antibacterial and dye degradation of silver nanoparticles using Combretum indicum leaf extract. Asian J. Chem.34, 216–222 (2021). [Google Scholar]
- 49.Hamouda, R. A., Hussein, M. H., Abo-Elmagd, R. A. & Bawazir, S. S. Synthesis and biological characterization of silver nanoparticles derived from the cyanobacterium Oscillatorialimnetica. Sci. Rep.9, 13071 (2019). [DOI] [PMC free article] [PubMed] [Google Scholar]
- 50.Ogundare, S. A. et al. Catalytic degradation of methylene blue dye and antibacterial activity of biosynthesized silver nanoparticles using Peltophorumpterocarpum (DC.) leaves. Environ. Sci. Adv.2, 247–256 (2023). [Google Scholar]
- 51.Vinayagam, R., Varadavenkatesan, T. & Selvaraj, R. Green synthesis, structural characterization, and catalytic activity of silver nanoparticles stabilized with Bridelia retusa leaf extract. Green Process. Synth.7, 30–37 (2018). [Google Scholar]
- 52.Lin, Z., Wu, J., Xue, R. & Yang, Y. Spectroscopic characterization of Au3+ biosorption by waste biomass of Saccharomyces cerevisiae. Spectrochim. Acta Part A Mol. Biomol. Spectrosc.61, 761–765 (2005). [DOI] [PubMed] [Google Scholar]
- 53.Sayed, R., Elmasri, M. & Dhmees, A. S. A comparative study of particle size measurement of silver, gold and silica sand nanoparticles with different nanometrological techniques. Egypt. J. Chem.66, 385–393 (2023). [Google Scholar]
- 54.Rashed, M. N., El Taher, M. A. & Fadlalla, S. M. M. Synthesis and photocatlytic application of drinking water treatment sludge@ TiO2 composite for degradation of methylene blue dye. Pollution6, 785–799 (2020). [Google Scholar]
- 55.Small, J. M. & Hintelmann, H. Methylene blue derivatization then LC–MS analysis for measurement of trace levels of sulfide in aquatic samples. Anal. Bioanal. Chem.387, 2881–2886 (2007). [DOI] [PubMed] [Google Scholar]
Associated Data
This section collects any data citations, data availability statements, or supplementary materials included in this article.
Data Availability Statement
The datasets used and/or analysed during the current study available from the corresponding author (M.Nageeb Rashed, email: mnrashed@aswu.edu.eg) on reasonable request.