



Abstract
Carbohydrates are found in various forms in living organisms, both as free-standing glycans as well as glycoconjugates including glycoproteins, glycolipids, and glycosaminoglycans. These structures play crucial roles in many biological processes, often mediated or influenced by interactions of carbohydrates with other biomolecules. However, studying these interactions is particularly challenging due to the structural complexity of carbohydrates, their dynamic conformational behavior, and the low binding affinities often involved. To address these challenges, we are developing a novel method that leverages mass spectrometry-based radical footprinting of carbohydrates (RFC). We monitored changes in the solvent accessibility of specific regions within oligosaccharides by measuring variations in the apparent rate of hydroxyl radical and trifluoromethyl radical-mediated oxidation. In our studies, a collection of trisaccharide isomers and N, N′,N′′-triacetylchitotriose (NAG3) shows no significant change in modification in non-binding protein solutions. However, in the presence of two proteins that bind NAG3 specifically, NAG3 oxidation is reduced. We find that the free reducing end is the primary site of hydroxyl radical oxidation under covalent labeling conditions, allowing it to distinguish interactions at the glycan reducing end. Trifluoromethyl radicals, conversely, label broadly across the trisaccharide by substitution into a C-H bond. Overall, this approach offers a powerful novel approach for identifying glycan-protein interactions and mapping the binding interface of glycans.
Graphical Abstract

INTRODUCTION
Carbohydrates play diverse roles in biological systems. They serve as primary energy source and form structural components like cellulose in plant cell walls and chitin in fungi and arthropod exoskeletons. Glycoconjugates are broadly found on the cell surface, playing a variety of roles in cellular biology. Structurally, carbohydrates range from simple monosaccharides like glucose to complex polysaccharides, with complexity arising from anomeric configurations, linkage positions, branching, and modifications1, 2. There are many types of carbohydrates on the mammalian cell surface, including N-glycans, O-glycans, glycosaminoglycans (GAGs), lipo-oligosaccharides and glycolipids. These carbohydrates bind with various proteins and mediate various biological processes3. These interactions can be monovalent or multivalent and are often dynamic. Understanding carbohydrate interactions is essential to understanding biology across various scientific domains due to their roles in cellular communication, pathogen-host interactions, disease development, drug delivery, biotechnology, nutritional science, and structural biology.
Studying carbohydrate interactions from complex mixtures is fraught with challenges due to the structural complexity, diversity, and dynamic nature of carbohydrates. Glycan microarrays offer high-throughput screening but face hurdles in representing the full natural complexity of glycan structures. Various biophysical and computational methods have been utilized to study carbohydrate interactions from different perspectives. Techniques such as X-ray crystallography4, NMR spectroscopy5, 6, molecular modeling7, surface plasmon resonance8, and isothermal titration calorimetry9, 10 have all contributed to uncovering critical structural details involved in the formation of carbohydrate-protein complexes. They are limited by the amount of sample needed and the purity of the sample required.
MS is now commonly used to study glycan-protein interactions. Electrospray ionization (ESI) MS directly measures the free and glycan-bound protein ions in solution11. One promising approach screens interaction based on a catch-and-release-ESI-MS assay, where the binding glycan first “catches” the protein and then is “released” by CID and identified by MS12. A filter-entrapment enrichment pull-down assay coupled with MS analysis has been used to study GAG-protein interactions in a rapid screening manner, including various binding affinities13. Overall, MS-based characterization approaches are extremely useful. However, current MS-based technologies generally cannot probe the specific portions of the glycan involved in the interaction. Protein-carbohydrate interactions have been extensively studied using footprinting techniques, but only from the perspective of the protein, identifying protein surfaces that interact with the carbohydrate14–18. There is currently no established footprinting methodology for carbohydrates. In 2014, a novel approach was introduced for fingerprinting polysaccharides through reaction with hydroxyl radicals (•OH). Their work demonstrated that hydroxyl radicals can induce non-enzymatic scission in polysaccharides, particularly pectin, using a fluorescent labeling technique to document oxidative damage19. Given the diverse composition of glycan preparations and the vital role of mass spectrometry in glycan research, glycan footprinting would be a valuable tool for investigating glycan interactions with other biomolecules.
Here, we report the footprinting of a model trisaccharide, triacetylchitotriose (NAG3), by both hydroxyl and trifluoromethyl radicals. Hydroxyl radical oxidation of NAG3 was performed using excimer laser photoexcitation of hydrogen peroxide20 and footprinting by trifluoromethyl radicals was performed by hydroxyl radical-induced decomposition of sodium triflinate21 using the Flash Oxidation (FOX) Photolysis System, a commercially available standardized system that utilizes a broadband UV flash lamp22.
MATERIALS AND METHODS
Materials
Triacetylchitotriose (NAG3), 1-kestose, isomaltotriose, raffinose, melezitose, myoglobin, ubiquitin, tris base, dimethylthiourea, sodium triflinate, and sodium borohydride were bought from Sigma (St. Louis, MO). Disodium phosphate and monosodium phosphate were purchased from VWR (Radnor, PA). LC-MS-grade water, acetonitrile, formic acid, and hydrogen peroxide were purchased from Fischer Chemicals (Fair Lawn, NJ). Lysozyme was bought from Goldbio (St. Louis, MO). Griffonia lectin was purchased from Vector Laboratories Inc. (Burlingame, CA). Methionine amide was obtained from Bachem (Torrance, CA). Sequencing-grade-modified trypsin was purchased from Promega Corp. (Madison, WI). We used all reagents without further purification. All pH measurements were made with a Mettler Toledo pH meter at 25°C.
Hydroxyl radical carbohydrate footprinting
A glycan mixture containing 25 μM each of NAG3, isomaltotriose, 1-kestose, raffinose, and melezitose was prepared in 10 mM sodium phosphate buffer (pH 7.4). Four proteins were evaluated in this study, comprising two non-carbohydrate-binding proteins (ubiquitin and myoglobin) and two carbohydrate-binding proteins (lysozyme and lectin). Each protein was prepared in combination with the glycan mixture at a glycan-to-protein ratio of 1:2 to help push glycans towards the protein:glycan complex, with the proteins also dissolved in 10 mM sodium phosphate buffer (pH 7.4) at a final concentration of 50 μM. The hydroxyl radical carbohydrate footprinting (HRCF) experiment was performed based on established protocols23, 24. Briefly, a mixture containing 1 mM adenine, 17 mM glutamine, and 100 mM hydrogen peroxide was loaded into a gastight syringe (Hamilton, Reno, NV). The mixture was passed through the focused beam path of a COMPex Pro 102 KrF excimer laser (Coherent, Inc., CA) operating at 20 Hz with an exclusion volume of 15% and a fluence of approximately 13 mJ/mm2. 20 μL of exposed samples were collected into a microcentrifuge tube of 25 μL of quenching solution containing 0.3 μg/μL catalase and 0.5 μg/mL methionine amide. Adenine absorbance at 260 nm was measured using a NanoDrop UV/VIS spectrophotometer (Thermo Scientific) to confirm consistent radical dose delivery across all experimental replicates. This measurement ensured the reproducibility of the effective radical exposure. All the samples were prepared and analyzed in triplicate.
Trifluoromethyl radical carbohydrate footprinting
The reaction conditions were optimized using NAG3 as the model compound by varying the concentration of hydrogen peroxide across a range of 10 to 90 mM at a fixed concentration of 40 mM sodium triflinate. NAG3 was dissolved in LC-MS water to achieve a final concentration of 25 μM. We generated trifluoromethyl radicals in situ using 40 mM of sodium triflinate, CF3SO2Na (Langlois Reagent- LR), and 10 mM hydrogen peroxide. Hydrogen peroxide was added immediately before injection, and samples were illuminated with a Fox Photolysis system25 at 900 V lamp voltage (GenNext Technologies, Inc., Half Moon Bay, CA). A combination of quench and reduction solution containing 1 M sodium borohydride, 70 mM methionine amide, and 100 mM dimethylthiourea (DMTU) of an equal volume as the illuminated sample was placed in the collection tube prior to illumination. We deposited the sample into this quench/reduction solution immediately after photolabeling. After illumination and quenching, we incubated the samples at 37 °C with rotation for 20 hours.
We used five different glycans (25 μM each of NAG3, isomaltotriose, 1-kestose, melezitose, and raffinose) and four different model proteins (lysozyme, lectin, myoglobin, or ubiquitin). Each protein was prepared in combination with all five glycans at a glycan-to-protein ratio of 1:2, with each glycan-protein combination prepared in a separate microcentrifuge tube. Each protein was dissolved in 10 mM sodium phosphate buffer (pH 7.4) to achieve a final protein concentration of 50 μM. We generated trifluoromethyl radicals in situ using 40 mM of sodium triflinate (CF3SO2Na, Langlois Reagent) and 40 mM of hydrogen peroxide. The illumination and quenching procedures were performed as described in the previous section, and the samples were stored at −20 °C until analysis by liquid chromatography-mass spectrometry (LC-MS).
HDX- Direct Infusion MS of NAG3
NAG3 was dissolved in LC-MS grade water to a final concentration of 25 μM. Trifluoromethyl radicals were generated in situ using 40 mM sodium triflinate (CF3SO2Na) and 10 mM hydrogen peroxide. The illumination and quenching steps using the FOX photolysis system were performed as previously described.
Desalting and purification were performed using a nonporous graphitized carbon black-solid phase extraction (GCB-SPE) cartridge (Thermo Fisher Scientific, Waltham, MA, USA). The cartridge was preconditioned by sequential washing with 3 mL of 80% acetonitrile containing 0.1% trifluoroacetic acid (TFA) and 3 mL of LC-MS grade water. The sample was then loaded onto the cartridge, washed with 7 mL of LC-MS grade water at a flow rate of approximately 1 mL/min, and eluted with 2 mL of 20% acetonitrile in water. The eluted sample was dried using a lyophilizer and lyophilized sample was reconstituted to yield a final concentration of 25μM in LC-MS grade water, with a portion diluted 1:20 in D2O.
For direct infusion analysis, the irradiated and reconstituted samples were subjected to electrospray ionization mass spectrometry (ESI-MS) without chromatographic separation using a Thermo Orbitrap Fusion Tribrid mass spectrometer (Thermo Fisher Scientific, Waltham, MA, USA) equipped with a conductive emitter at a flow rate of 3 μL/min. Data was acquired in positive ion mode using electrospray ionization (H-ESI) with a spray voltage of 400 V, a capillary temperature of 300 °C, and sheath and auxiliary gas flows were set to 1 to ensure stable ion generation and transfer. MS spectra were acquired at a resolution of 60000 and MS2 spectra were obtained by collision-induced dissociation (CID) at 30% collision energy. The activation time was set to 10 ms with an activation Q of 0.25. Isotopic ratios at different deuterium incorporation levels were modeled using IsoPro 3.0.
LC-MS Analysis
All samples were loaded onto a HILIC column (1.0 mm × 150 mm, 1.7 μm, Waters) at a 60 μL/min flow rate coupled to a Dionex Ultimate 3000 nanoLC system Thermo Fisher Scientific, San Jose, CA). Injection volume of the samples was 5μl. Solvent A was 0.1% formic acid in water, and solvent B was 0.1% formic acid in acetonitrile. We eluted the reduced and modified glycans using a gradient consisting of 90% solvent B held constant until 4 minutes, between 4 and 18 minutes, a linear gradient reduces solvent B to 40%, and from 18 to 20 minutes, the B is held constant at 40%, a re-equilibration phase is introduced from 20 to 24 minutes, where the solvent B returns to 90%. The LC column eluant fed into the electrospray ionization source of a Thermo Orbitrap Fusion Tribrid mass spectrometer (Thermo Fisher Scientific, Waltham, MA, USA) using a conductive emitter. All data were acquired in positive ion mode using electrospray ionization (H-ESI) with a spray voltage of 4.0 kV, a capillary temperature of 300 °C, and optimized sheath and auxiliary gas flow for stable ion generation and transfer. MS spectra were acquired at a resolution of 60000, and MS2 spectra were acquired in orbitrap mode after collision-induced dissociation (CID) at 30% collision energy , and activation time was set to 10 ms with an activation Q of 0.25. In CID mode, full MS scans were acquired from m/z 200 to 2000, followed by targeted MS2 scans corresponding to expected masses of NAG3 and other glycans, along with their modification products. The mass spectrometry data have been deposited to the ProteomeXchange consortium via the PRIDE26 partner repository with the dataset identifier PXD066426.
DATA ANALYSIS
The modified fraction was determined by calculating the ratio of the LC peak areas corresponding to CF3 (+67.998) or OH (+15.995) modifications to the total LC peak areas, which included both unmodified and all modified products. Raw MS data files were acquired using Xcalibur software.
We determined the percentage modification using the following equation:
| (1) |
The trisaccharides were identified using extracted ion chromatograms (EIC) of full targeted MS data. We generated fragment masses using GlycoWorkbench and manually assigned MS/MS peaks to theoretical fragments for validation.
RESULTS & DISCUSSION
Hydroxyl Radical Carbohydrate Footprinting
To probe the inherent reactivity of carbohydrates, NAG3 was used, which consists of three identical n-acetyl-glucosamine monosaccharides with a free-reducing end and a non-reducing end. After oxidation by excimer laser-induced photolysis of hydrogen peroxide, samples were quenched and analyzed. The only oxidation product observed at substantial amounts was the net addition of one oxygen atom (+15.994). No scission products as expected from NAG327 were identified, Figure S1, Supporting Information. The extracted ion chromatograms of reduced NAG3 and NAG3 + O, unreduced and unmodified, reduced and modified NAG3 is shown in Figure 1A. CID MS/MS spectra were obtained. Figure 1B shows the annotated MS/MS spectrum of reduced NAG3. Reduction of the reducing end allows for differentiation of product ions, and both B- and Y-type ions are observed in the spectrum. Conversely, no masses consistent with reduced (NAG3+O) were observed in Figure S2, Supporting Information. The spectrum of (NAG3+O) after attempted reduction Figure 1C showed no ions uniquely assignable to the reducing end of the trisaccharide.
Figure 1. Hydroxyl radical-carbohydrate chemistry under FOX conditions.
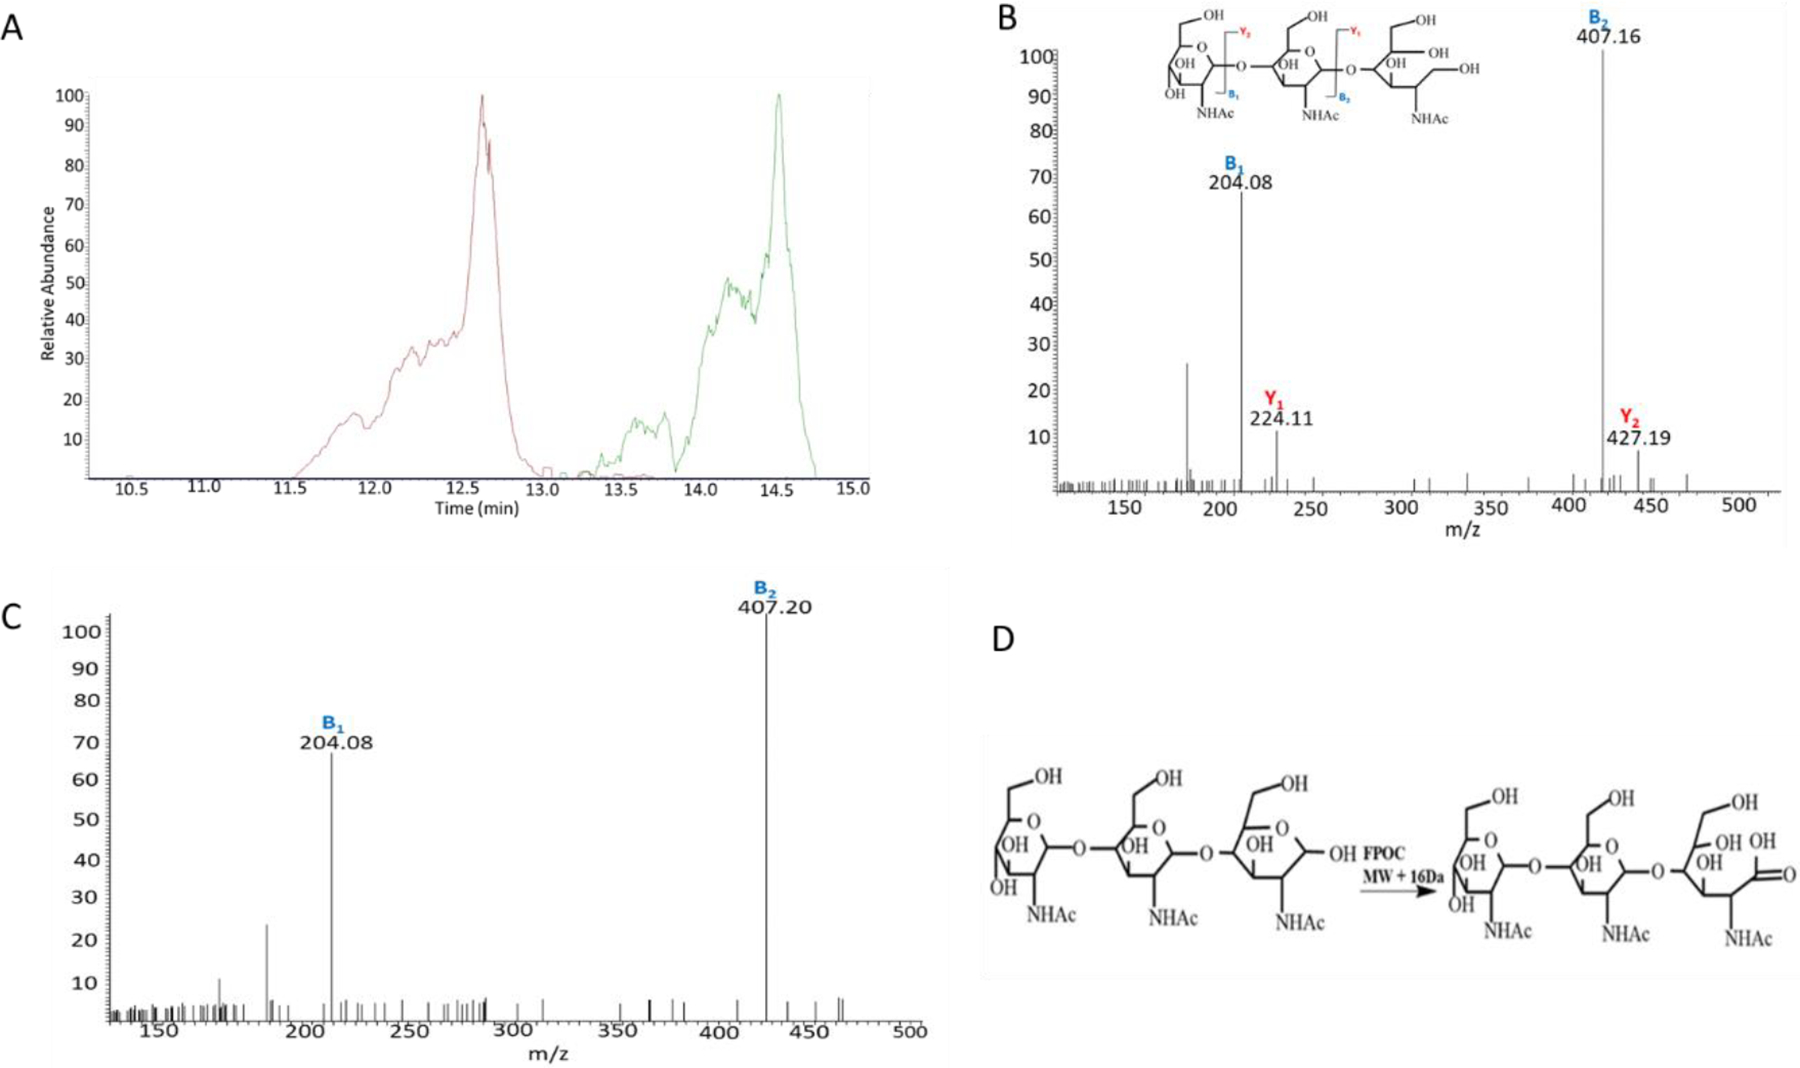
(A) HILIC-MS extracted ion chromatogram of reduced NAG3 (red), (NAG3 + O green), unmodified unreduced NAG3 (black, no signal detected) and reduced and modified NAG3 (blue, no signal detected). (B) MS/MS spectrum of the reduced NAG3 after sodium borohydride reduction. (C) MS/MS spectrum of (NAG3+O) after attempted sodium borohydride reduction. No reduced modified NAG3 was observed, and no ions containing the reducing end was observed. (D) Proposed scheme for observed hydroxyl radical oxidation product.
In contrast, the B1 and B2 ions do not show a mass shift consistent with adding an oxygen atom to either of the two monosaccharides at the non-reducing end of NAG3. These data together indicate a specific site of hydroxyl radical reactivity at the reducing end. We propose a scheme in Figure 1D where the hemiacetal of the reducing end is oxidized by hydroxyl radical to a ring-opened carboxylic acid (which is resistant to sodium borohydride reduction), resulting in the net addition of an oxygen atom.
We then probed the sensitivity of hydroxyl radical reaction rates to changes in solvent accessibility of the reaction site. We used a mixture of five model trisaccharides (NAG3, isomaltotriose, 1-kestose, melezitose, and raffinose) and four model proteins (lysozyme, lectin, myoglobin, or ubiquitin) with two non-carbohydrate-binding proteins (ubiquitin and myoglobin) as a control. We used two proteins that specifically bind NAG3 and none of the other trisaccharides in the mixture: lysozyme binds the reducing end of NAG328, while G. simplicifolia lectin binds the non-reducing end29, 30. The non-binding trisaccharides were selected to be isomeric so their results could be measured collectively, eliminating the need for multiple testing corrections when statistically evaluating their modification. We found that non-binding trisaccharides (isomaltotriose, 1-kestose, melezitose, and raffinose) show no significant modification differences in their oxidation event irrespective of the proteins present in the solution, as shown in Figure 2A. As shown in Figure 2B, the oxidation of NAG3 was significantly reduced in the presence of the proteins it binds (lysozyme and lectin) as compared to the samples where non-binding proteins (myoglobin, ubiquitin) are present. Moreover, the reduction in oxidation extent was greater when the protein bound at the reducing end (lysozyme) compared to the non-reducing end (lectin). The results of an ANOVA are presented in Table S1, Supporting Information. This protection pattern provides direct evidence of the molecular footprinting capabilities of HRCF, similar to its use in hydroxyl radical protein footprinting23, 31, 32. In the absence of protein binding, the modification of NAG3 was similar to the modification of the group of isomeric trisaccharides at ~20%, suggesting that HRCF is a generalizable technique.
Figure 2: Hydroxyl radical carbohydrate footprinting:

An equimolar mixture of NAG3 and four isomeric trisaccharides (Isomaltotriose, 1-kestose, raffinose, and melezitose) was oxidized with hydroxyl radicals generated by the laser irradiation of hydrogen peroxide in the presence of different proteins. Brackets with asterisk indicate a statistically significant difference between bracketed pairs by ANOVA with Tukey’s post-hoc analysis (p < 0.05). (A) The mixture of isomeric trisaccharides that do not bind to any protein show no significant difference in oxidation, irrespective of the protein used. (B) NAG3 oxidation is significantly reduced in the presence of proteins it binds (lysozyme and lectin) compared to proteins it does not bind (ubiquitin and myoglobin). Error bars represent one standard deviation from a triplicate data.
Trifluoromethyl Radical Carbohydrate Footprinting
While hydroxyl radicals show utility in footprinting the accessibility of the reducing end of glycans, a more generally reactive radical that can modify glycans at all monosaccharides in the chain would have broader applicability in studying carbohydrate interactions. The Gross lab first introduced the use of sodium triflinate (Langlois reagent) in Fast Photochemical Oxidation of Proteins (FPOP) to generate trifluoromethyl radicals (•CF3) for protein footprinting33. Subsequently, the Chance lab adapted this strategy to an X-ray radiolysis platform, demonstrating that synchrotron-generated hydroxyl radicals could similarly activate sodium triflinate for trifluoromethyl radical labeling, expanding the toolkit for structural analysis of proteins21. This method generates trifluoromethyl radicals from the rapid reaction of sodium triflinate with hydroxyl radicals. Because of the highly different reactivity of trifluoromethyl radicals compared to hydroxyl radicals, we tested the ability for trifluoromethyl radicals to broadly modify our model NAG3 glycan, using a commercially available FOX Photolysis System25 to maximize the ability to replicate the chemistry in other labs.
We first evaluated the effect of different concentrations of hydrogen peroxide on the yield of trifluoromethyl radicals in the presence of 40 mM sodium triflinate and with a FOX system flash voltage of 900V using the mixture of NAG3 and isomeric trisaccharides described previously. The only major modification product identified was an increase of 67.987 Da, consistent with hydrogen loss and addition of a trifluoromethyl group. This modification was found on both NAG3 and the mixture of trisaccharides, and all glycans modified with CF3 were capable of reduction with sodium borohydride (data not shown). As shown in Figure 3A, we found maximum modification levels at a peroxide concentration of 40 mM. Interestingly, there was no modification at 10 mM and 20 mM of H2O2 concentration. No difference in modification percentage was found between NAG3 and the group of isomeric glycans Figure 3B, suggesting trifluoromethyl radicals as is generalizable an RCF label.
Fig 3. Optimization of H2O2 concentration for trifluoromethyl RCF.

(A) Percentage of modified NAG3 at different concentrations of H2O2 in the presence of 40 mM sodium triflinate with a 900V FOX lamp voltage. (B) Percentage modification of NAG3 and isomeric glycans at 40 mM hydrogen peroxide.
Next, we tested the sensitivity of trifluoromethyl radical RCF labeling to protein-carbohydrate interactions. The non-binding isomeric trisaccharide mixture shows an apparent reduced modification in the presence of lectin Figure 4A, but testing by ANOVA indicates that this apparent reduction is not statistically significant (p = 0.174). Figure 4B shows the percent modification of NAG3 with binding proteins (lysozyme, lectin) and non-binding proteins (myoglobin, ubiquitin). The modification of NAG3 was reduced in the presence of the two proteins it is known to bind (lysozyme and lectin), indicating structural sensitivity of trifluoromethyl radical RCF. A one-way ANOVA shows that the differences are statistically significant (p = 0.013), with a Tukey’s post-hoc test indicating significant differences between lysozyme and myoglobin (p = 0.012), lysozyme and ubiquitin (p = 0.031), myoglobin and lectin (p = 0.012), and ubiquitin and lectin (p = 0.028). No significant differences were found between lysozyme and lectin (p = 0.999) or myoglobin and ubiquitin (p = 0.871) (Table S2, Supporting Information).
Figure 4: Trifluoromethyl radical carbohydrate footprinting.

Mixture of NAG3 and isomeric trisaccharides (Isomaltotriose, 1-kestose, raffinose, and melezitose) was oxidized with trifluoromethyl radicals in the presence of a protein. Brackets with asterisk indicate a statistically significant difference between bracketed pairs by ANOVA with Tukey’s post-hoc analysis (p < 0.05). (A) Isomeric trisaccharides that do not bind to any protein show no significant difference in modification irrespective of the protein present (p = 0.174). (B) NAG3 modification is significantly reduced (p<0.05) in the presence of proteins it binds (lysozyme and lectin) as compared to proteins it does not bind (ubiquitin and myoglobin). Error bars represent one standard deviation from a triplicate data set.
MS/MS spectra were obtained to compare unmodified and CF3-modified NAG3 in both lysozyme and lectin-containing samples. MS/MS spectra were averaged across all partially resolved modification isomers to maximize signal-to-noise. The MS/MS spectrum of unmodified reduced NAG3 in the presence of lysozyme is shown in Figure 5A. Here, a full b- and y-ion series is present, showing the fragmentation pattern of unmodified NAG3. MS/MS of modified reduced NAG3 in the presence of lysozyme is displayed in Figure 5B. Again, a full b- and y-ion series is present. Each product ion is present in both the modified and unmodified form. Comparison of the relative abundance of the modified to the unmodified version of each product ion (e.g., B2:B2+CF3) clearly shows that the amount of modification increases as the product ion size increases; this is true for both b- and y-ions. These data together indicate that CF3 modification is spread across all three monosaccharides of NAG3. The MS/MS spectrum of unmodified reduced NAG3 in the presence of lectin is shown in Figure 5C, with the MS/MS spectrum of modified reduced NAG3 in the presence of lectin shown in Figure 5D. The MS/MS spectrum of NAG3 in the presence of lectin is almost identical to the MS/MS spectrum of NAG3 in the presence of lysozyme, suggesting that any differences in the footprint are differences in the quantity of modification at a particular site rather than a complete presence/absence of modification on a monosaccharide. This is consistent with the vast array of data obtained in radical protein footprinting. Unfortunately, while HILIC chromatography gave multiple peaks for reduced modified NAG3, indicating the presence of modification isomers (Figure 6), we were unable to identify each modification isomer by MS/MS spectra due to poor MS/MS signal (data not shown).
Figure 5: MS/MS spectra of reduced trifluoromethylated NAG3.
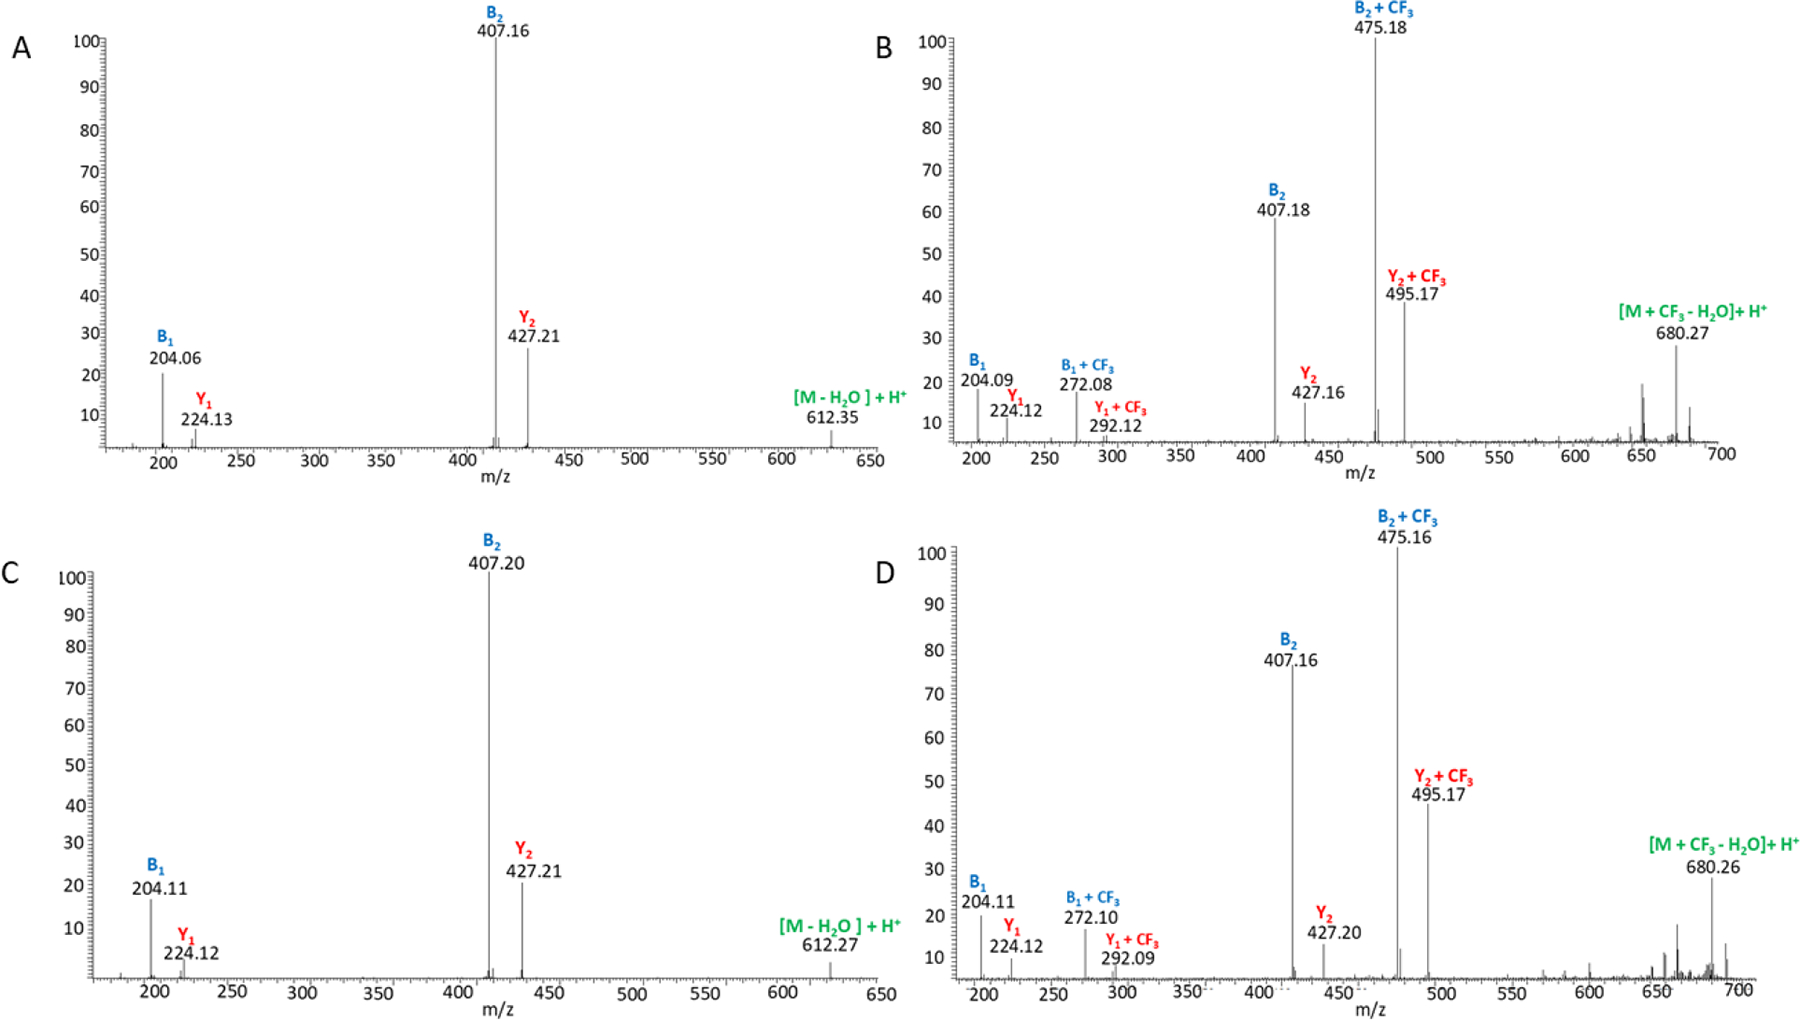
(A) MS/MS spectrum of reduced NAG3 in the presence of lysozyme. (B) MS/MS spectrum of reduced trifluoromethylated NAG3 in the presence of lysozyme. (C) MS/MS spectrum of reduced NAG3 in the presence of lectin. (D) MS/MS spectrum of reduced trifluoromethylated NAG3 in the presence of lectin.
Figure 6. HILIC-MS analysis of trifluoromethylated NAG3.

(A) HILIC-MS extracted ion chromatogram of unmodified reduced NAG3. (B) HILIC-MS extracted ion chromatogram of trifluoromethylated and reduced NAG3.
While our prior data clearly indicates that trifluoromethyl radicals modify glycans on all monosaccharides, it is unclear what molecular mechanism is used to modify the glycan. Two plausible mechanisms exist for modification of NAG3 on each monosaccharide; the CF3 could replace hydrogen in a C-H bond, or the CF3 could replace hydrogen in an O-H and/or N-H amide bond. To investigate the mechanism of trifluoromethyl radical-induced modification on NAG3, we used hydrogen-deuterium exchange mass spectrometry (HDX-MS) to differentiate between a non-exchangeable C-H hydrogen replacement from an exchangeable O-H or N-H hydrogen. NAG3 contains eleven exchangeable hydrogen atoms, which can be monitored through HDX-MS. Following deuterium exchange, the mass spectrum of unmodified NAG3 exhibited the most abundant ion of m/z = 656.266, as shown in Figure 7A. Isotopic modeling shows that the unmodified NAG3 reached a net level of 50% deuteration (Figure S3, Supporting Information). Despite sustained efforts, we were unable to reach a higher level of deuteration under our laboratory conditions. The trifluoromethylated ion was observable in the same spectrum (Figure 7B). Assuming the same overall deuterium exchange percentage for the unmodified and modified NAG3 observed in the same spectrum, the mass spectrum is most consistent with a NAG3 ion that retains 11 exchangeable hydrogens (Figure S4, Supporting Information). These results indicate that CF3 replaces a non-exchangeable hydrogen in a C-H bond rather than an exchangeable O-H or N-H hydrogen to create the final labeled product. This interpretation relies upon the assumption that the rate of back-exchange is equivalent between the modified and unmodified NAG3, and that this back-exchange in the ionization source is the result of the incomplete deuteration observed. If, for example, there is a subset of hydrogens that are particularly susceptible to back-exchange, and if CF3 modification solely occurs on one of those hydrogens, we may measure equivalent deuteration levels even though an exchangeable hydrogen is replaced by CF3 modification.
Figure 7. Hydrogen-deuterium exchange shows CF3 replaces a C-H hydrogen.

(A) MS of unmodified NAG3 after HDX of ~50%. (B) MS of trifluoromethylated NAG3 taken from same spectrum. Spectrum is consistent with a trifluoromethylated NAG3 that retains all 11 exchangeable hydrogens with ~50% exchange. It is inconsistent with trifluoromethylated NAG3 with only 10 exchangeable hydrogens with ~50% exchange.
CONCLUSION
We demonstrated two separate RCF reagents with their unique purposes: hydroxyl radicals, which specifically label the free reducing end under HRCF conditions, and trifluoromethyl radicals, which modify a variety of glycans across all monosaccharides through substitution at C-H bonds. Both labels exhibited sensitivity to protein-carbohydrate interactions. We were able to measure that the hydroxyl radical is sensitive to the specific portion of the glycan that is recognized by the protein binding partner. We were unable to confirm this with the trifluoromethyl radicals due to difficulties in identifying and quantifying particular positional modification isomers by MS/MS. We are currently working on further advances in properly resolving and identifying these positional isomers of trifluoromethyl radical labeling through improvements in labeled glycan LC separation and improvements in ionization efficiency. These difficulties mirror those encountered in mass spectrometry-based hydroxyl radical protein footprinting23, 34, 35; the increased difficulties in ionization of carbohydrates have made RCF challenging, but the hydrophobicity of the CF3 group compared to most glycan moieties give us potential options for enrichment and separations to potentially address this issue in future work.
Our observations of the specificity of hydroxyl radical modification are quite different from previously reported results19, that occurred in hydroxyl radical exposures that were much longer, using lower steady-state concentrations of hydroxyl radicals in a Fenton reaction than the peak concentrations used here in an FPOP-like experiment36. While it may be possible to generate a broader HRCF footprint using a slower radical reaction scheme, it is important to remember that these radicals will modify both the carbohydrate analyte and the protein binding partner37, 38. Such slow but thorough modification of the protein binding partner can readily change the protein’s conformation39–41, disrupting protein-carbohydrate interactions and introducing artifacts. Therefore, for topographical analysis of the full carbohydrate, it is preferable to find a reagent that can broadly modify the carbohydrate analyte under very rapid experimental conditions. Our results indicate that the trifluoromethyl radical is such a reagent. However, the resulting mixture of products from a broadly reactive label are challenging to analyze and localize, making the hydroxyl radical preferable for experiments that specifically wish to probe the reducing end of the glycan. Recent reports from Jain and co-workers on multiplex hydroxyl and CF3 footprinting in proteins42 inspire the possibility of taking such a complimentary approach with carbohydrates, now that the orthogonal specificity of these two labels has been demonstrated in this report. Our results in Figure 3 suggest that modification of the triflinate: hydroxyl radical ratio would adversely affect labeling efficiency, so we chose not to pursue this multiplex approach at this time. However, the approach is intriguing, and particular applications where differentiating labeling at the reducing end from labeling at other regions of the glycan could demand such an approach.
Supplementary Material
Tukey’s post-hoc analysis of ANOVA of •OH RCF in the presence of different proteins; Tukey’s post-hoc analysis of ANOVA of •CF3 RCF in the presence of different proteins; Correlation of simulated mass spectra with theoretical mass spectra at different deuterium incorporation levels for NAG3 and Correlation of simulated mass spectrum of 50% deuterium exchanged trifluoromethylated NAG3 with experimental results; HILIC-MS of unmodified and •OH modified NAG3.
ACKNOWLEDGMENTS
This work was funded by the National Institute of General Medical Sciences (R01GM127267). Research reported in this publication was supported by the Analytical and Biophysical Chemistry Research Core of the Glycoscience Center of Research Excellence, a Center of Biomedical Research Excellence supported by the National Institute of General Medical Sciences of the National Institutes of Health under award number P20GM130460.
Footnotes
J.S.S. discloses a significant interest in GenNext Technologies, Inc., a company commercializing technologies for protein higher-order structure analysis.
REFERENCES
- (1).Berg JM; Tymoczko JL; Stryer L Biochemistry, 8th ed.; W.H. Freeman: New York, 2015. [Google Scholar]
- (2).Pratt CW; Cornely K Essential Biochemistry; Wiley: Hoboken, NJ, 2014. [Google Scholar]
- (3).Varki A; Cummings RD; Esko JD; Stanley P; Hart GW; Aebi M; Seeberger PH, et al. Essentials of Glycobiology, 3rd ed.; Cold Spring Harbor Laboratory Press: Cold Spring Harbor, NY, 2017. [Google Scholar]
- (4).Palmer RA; Niwa H X-ray Crystallographic Studies of Protein–Ligand Interactions. Biochem. Soc. Trans 2003, 31 (5), 973–979. [DOI] [PubMed] [Google Scholar]
- (5).Kogelberg H; Solis D; Jimenez-Barbero J New Structural Insights into Carbohydrate–Protein Interactions from NMR Spectroscopy. Curr. Opin. Struct. Biol 2003, 13 (5), 646–653. [DOI] [PubMed] [Google Scholar]
- (6).Diercks T; Medrano FJ; FitzGerald FG; Beckwith D; Pedersen MJ; Reihill M; Ludwig AK; Romero A; Oscarson S; Cudic M; et al. Galectin–Glycan Interactions: Guidelines for Monitoring by (77)Se NMR Spectroscopy and Solvent (H2O/D2O) Impact on Binding. Chem. Eur. J 2021, 27 (1), 316–325. [DOI] [PMC free article] [PubMed] [Google Scholar]
- (7).Frank M; Schloissnig S Bioinformatics and Molecular Modeling in Glycobiology. Cell. Mol. Life Sci 2010, 67 (16), 2749–2772. [DOI] [PMC free article] [PubMed] [Google Scholar]
- (8).Smith EA; Thomas WD; Kiessling LL; Corn RM Surface Plasmon Resonance Imaging Studies of Protein–Carbohydrate Interactions. J. Am. Chem. Soc 2003, 125 (20), 6140–6148. [DOI] [PubMed] [Google Scholar]
- (9).Doyle ML Characterization of Binding Interactions by Isothermal Titration Calorimetry. Curr. Opin. Biotechnol 1997, 8 (1), 31–35. [DOI] [PubMed] [Google Scholar]
- (10).Singh, F HF. Calorimetric Methods for Interpreting Protein–Ligand Interactions. Energetics of Biological Macromolecules, 1995. [DOI] [PubMed] [Google Scholar]
- (11).Wang Y; Park H; Lin H; Kitova EN; Klassen JS Multipronged ESI-MS Approach for Studying Glycan-Binding Protein Interactions with Glycoproteins. Anal. Chem 2019, 91 (3), 2140–2147. [DOI] [PubMed] [Google Scholar]
- (12).Li J; Han L; Li J; Kitova EN; Xiong ZJ; Privé GG; Klassen JS Detecting Protein–Glycolipid Interactions Using CaR-ESI-MS and Model Membranes: Comparison of Pre-Loaded and Passively Loaded Picodiscs. J. Am. Soc. Mass Spectrom 2018, 29 (7), 1493–1504. [DOI] [PubMed] [Google Scholar]
- (13).Yu Y; Zhang F; Renois-Predelus G; Amster IJ; Linhardt RJ Filter-Entrapment Enrichment Pull-Down Assay for Glycosaminoglycan Structural Characterization and Protein Interaction. Carbohydr. Polym 2020, 245, 116623. [DOI] [PMC free article] [PubMed] [Google Scholar]
- (14).Li Z; Moniz H; Wang S; Ramiah A; Zhang F; Moremen KW; Linhardt RJ; Sharp JS High Structural Resolution Hydroxyl Radical Protein Footprinting Reveals an Extended Robo1–Heparin Binding Interface. J. Biol. Chem 2015, 290 (17), 10729–10740. [DOI] [PMC free article] [PubMed] [Google Scholar]
- (15).Wang X; Watson C; Sharp JS; Handel TM; Prestegard JH Oligomeric Structure of the Chemokine CCL5/RANTES from NMR, MS, and SAXS Data. Structure 2011, 19 (8), 1138–1148. [DOI] [PMC free article] [PubMed] [Google Scholar]
- (16).Olson LJ; Misra SK; Ishihara M; Battaile KP; Grant OC; Sood A; Woods RJ; Kim JP; Tiemeyer M; Ren G; et al. Allosteric Regulation of Lysosomal Enzyme Recognition by the Cation-Independent Mannose 6-Phosphate Receptor. Commun. Biol 2020, 3 (1), 498. [DOI] [PMC free article] [PubMed] [Google Scholar]
- (17).Bohnsack RN; Misra SK; Liu J; Ishihara-Aoki M; Pereckas M; Aoki K; Ren G; Sharp JS; Dahms NM Lysosomal Enzyme Binding to the Cation-Independent Mannose 6-Phosphate Receptor Is Regulated Allosterically by Insulin-Like Growth Factor 2. Sci. Rep 2024, 14 (1), 26875. [DOI] [PMC free article] [PubMed] [Google Scholar]
- (18).Wang K; Dagil R; Lavstsen T; Misra SK; Spliid CB; Wang Y; Gustavsson T; Sandoval DR; Vidal-Calvo EE; Choudhary S; et al. Cryo-EM Reveals the Architecture of Placental Malaria VAR2CSA and Provides Molecular Insight into Chondroitin Sulfate Binding. Nat. Commun 2021, 12 (1), 2956. [DOI] [PMC free article] [PubMed] [Google Scholar]
- (19).Vreeburg RA; Airianah OB; Fry SC Fingerprinting of Hydroxyl Radical-Attacked Polysaccharides by N-Isopropyl-2-aminoacridone Labelling. Biochem. J 2014, 463 (2), 225–237. [DOI] [PMC free article] [PubMed] [Google Scholar]
- (20).Hambly DM; Gross ML Laser Flash Photolysis of Hydrogen Peroxide to Oxidize Protein Solvent-Accessible Residues on the Microsecond Timescale. J. Am. Soc. Mass Spectrom 2005, 16 (12), 2057–2063. [DOI] [PubMed] [Google Scholar]
- (21).Cheng M; Asuru A; Kiselar J; Mathai G; Chance MR; Gross ML Fast Protein Footprinting by X-ray Mediated Radical Trifluoromethylation. J. Am. Soc. Mass Spectrom 2020, 31 (5), 1019–1024. [DOI] [PMC free article] [PubMed] [Google Scholar]
- (22).Sharp JS; Chea EE; Misra SK; Orlando R; Popov M; Egan RW; Holman D; Weinberger SR Flash Oxidation (FOX) System: A Novel Laser-Free Fast Photochemical Oxidation Protein Footprinting Platform. J. Am. Soc. Mass Spectrom 2021, 32 (7), 1601–1609. [DOI] [PMC free article] [PubMed] [Google Scholar]
- (23).Gau BC; Sharp JS; Rempel DL; Gross ML Fast Photochemical Oxidation of Protein Footprints Faster than Protein Unfolding. Anal. Chem 2009, 81 (16), 6563–6571. [DOI] [PMC free article] [PubMed] [Google Scholar]
- (24).Tadi S; Misra SK; Sharp JS Inline Liquid Chromatography–Fast Photochemical Oxidation of Proteins for Targeted Structural Analysis of Conformationally Heterogeneous Mixtures. Anal. Chem 2021, 93 (7), 3510–3516. [DOI] [PMC free article] [PubMed] [Google Scholar]
- (25).Sharp JS; Chea EE; Misra SK; Orlando R; Popov M; Egan RW; Holman D; Weinberger SR Flash Oxidation (FOX) System: A Novel Laser-Free Fast Photochemical Oxidation Protein Footprinting Platform. J. Am. Soc. Mass Spectrom 2021, 32 (7), 1601–1609. [DOI] [PMC free article] [PubMed] [Google Scholar]
- (26).Perez-Riverol Y; Bai J; Kundu DJ; Kamatchinathan S; Hewapathirana S; John NS; Prakash A; Walzer M; Wang S; Vizcaíno JA The PRIDE Database at 20 Years: 2025 Update. Nucleic Acids Res. 2025, 53 (D1), D543–D553. [DOI] [PMC free article] [PubMed] [Google Scholar]
- (27).Tudella J; Nunes FM; Paradela R; Evtuguin DV; Domingues P; Amado F; Coimbra MA; Barros AI; Domingues MR Oxidation of Mannosyl Oligosaccharides by Hydroxyl Radicals as Assessed by Electrospray Mass Spectrometry. Carbohydr. Res 2011, 346 (16), 2603–2611. [DOI] [PubMed] [Google Scholar]
- (28).Dahlquist FW; Jao L; Raftery M On the Binding of Chitin Oligosaccharides to Lysozyme. Proc. Natl. Acad. Sci. U.S.A 1966, 56 (1), 26–30. [DOI] [PMC free article] [PubMed] [Google Scholar]
- (29).Ren X-M; Li D-F; Jiang S; Lan X-Q; Hu Y; Sun H; Wang D-C Structural Basis of Specific Recognition of Non-Reducing Terminal N-Acetylglucosamine by an Agrocybe aegerita Lectin. PLoS One 2015, 10 (6), e0129608. [DOI] [PMC free article] [PubMed] [Google Scholar]
- (30).Lis H; Sharon N Lectins: Carbohydrate-Specific Proteins That Mediate Cellular Recognition. Chem. Rev 1998, 98 (2), 637–674. [DOI] [PubMed] [Google Scholar]
- (31).Chance MR; Farquhar ER; Yang S; Lodowski DT; Kiselar J Protein Footprinting: Auxiliary Engine to Power the Structural Biology Revolution. J. Mol. Biol 2020, 432 (9), 2973–2984. [DOI] [PMC free article] [PubMed] [Google Scholar]
- (32).Ralston CY; Sharp JS Structural Investigation of Therapeutic Antibodies Using Hydroxyl Radical Protein Footprinting Methods. Antibodies 2022, 11 (4), 49. [DOI] [PMC free article] [PubMed] [Google Scholar]
- (33).Cheng M; Zhang B; Cui W; Gross ML Laser-Initiated Radical Trifluoromethylation of Peptides and Proteins: Application to Mass-Spectrometry-Based Protein Footprinting. Angew. Chem. Int. Ed 2017, 56 (45), 14007–14010. [DOI] [PMC free article] [PubMed] [Google Scholar]
- (34).Wang L; Chance MR Structural Mass Spectrometry of Proteins Using Hydroxyl Radical Based Protein Footprinting. Anal. Chem 2011, 83 (19), 7234–7241. [DOI] [PMC free article] [PubMed] [Google Scholar]
- (35).Watson C; Janik I; Zhuang T; Charvátová O; Woods RJ; Sharp JS Pulsed Electron Beam Water Radiolysis for Submicrosecond Hydroxyl Radical Protein Footprinting. Anal. Chem 2009, 81 (7), 2496–2505. [DOI] [PMC free article] [PubMed] [Google Scholar]
- (36).Hambly DM; Gross ML Laser Flash Photolysis of Hydrogen Peroxide to Oxidize Protein Solvent-Accessible Residues on the Microsecond Timescale. J. Am. Soc. Mass Spectrom 2005, 16 (12), 2057–2063. [DOI] [PubMed] [Google Scholar]
- (37).Sharp JS; Becker JM; Hettich RL Analysis of Protein Solvent Accessible Surfaces by Photochemical Oxidation and Mass Spectrometry. Anal. Chem 2004, 76 (3), 672–683. [DOI] [PubMed] [Google Scholar]
- (38).Maleknia SD; Brenowitz M; Chance MR Millisecond Radiolytic Modification of Peptides by Synchrotron X-rays Identified by Mass Spectrometry. Anal. Chem 1999, 71 (18), 3965–3973. [DOI] [PubMed] [Google Scholar]
- (39).Venkatesh S; Tomer KB; Sharp JS Rapid Identification of Oxidation-Induced Conformational Changes by Kinetic Analysis. Rapid Commun. Mass Spectrom 2007, 21 (23), 3927–3936. [DOI] [PubMed] [Google Scholar]
- (40).Sharp JS; Tomer KB Analysis of the Oxidative Damage-Induced Conformational Changes of Apo- and Holocalmodulin by Dose-Dependent Protein Oxidative Surface Mapping. Biophys. J 2007, 92 (5), 1682–1692. [DOI] [PMC free article] [PubMed] [Google Scholar]
- (41).Sharp JS; Sullivan DM; Cavanagh J; Tomer KB Measurement of Multisite Oxidation Kinetics Reveals an Active Site Conformational Change in Spo0F as a Result of Protein Oxidation. Biochemistry 2006, 45 (20), 6260–6266. [DOI] [PubMed] [Google Scholar]
- (42).Jain R; Dhillon NS; Farquhar ER; Wang B; Li X; Kiselar J; Chance MR Multiplex Chemical Labeling of Amino Acids for Protein Footprinting Structure Assessment. Anal. Chem 2022, 94 (27), 9819–9825. [DOI] [PMC free article] [PubMed] [Google Scholar]
Associated Data
This section collects any data citations, data availability statements, or supplementary materials included in this article.