

Abstract
Objective
To improve understanding and awareness of the impact of subfoveal choroidal neovascularization (CNV) on health-related quality of life, we sought to measure the preference value that patients with subfoveal CNV assigned to their health and vision status.
Patients and Methods
Patients with subfoveal CNV completed telephone interviews about their quality of life prior to enrollment and random treatment assignment in the Submacular Surgery Trials, a set of multi-center randomized controlled trials evaluating outcomes of submacular surgery compared with observation. The interviewers asked patients to rate their current vision on a scale from 0 (completely blind) to 100 (perfect vision). The interviewers also asked them to rate complete blindness and then perfect vision, assuming their health otherwise was the same as it was at the time of the interview, on a scale from 0 (dead) to 100 (perfect health with perfect vision). Scores were converted to a 0 to 1 preference value scale for health and vision status, where 0 represents death and 1 represents perfect health and vision.
Results
Of 1015 participants enrolled in the Submacular Surgery Trials, 996 completed interviews that included the rating questions, and 792 (80%) answered all 3 rating questions in a manner permitting calculation of a single overall preference value for their current health and vision status on a scale from 0 (dead) to 1 (perfect). The mean preference value was 0.64 (median, 0.68; interquartile range, 0.51–0.80). The preference values correlated with age (Pearson correlation coefficient, −0.11; P=.002), patients’ self-rated perception of overall health (Spearman correlation coefficient, 0.36; P<.001), and self-reported perception of vision (Spearman correlation coefficient, 0.47; P<.001). The preference values were significantly lower with poorer visual acuity in the better eye and greater evidence of dysfunction on either the Hospital Anxiety and Depression Scale or the Physical or Mental Component Summary scales of the Short Form-36 Health Survey but did not differ significantly by gender or other baseline characteristics such as race, treatment assignment, or size of the CNV lesion.
Conclusions
Vision loss from subfoveal CNV is associated with patient preference values that are as low as or lower than values previously reported for other serious medical conditions such as dialysis-dependent renal failure and AIDS, indicating that both unilateral and bilateral CNV have a profound impact on how patients feel about their overall health-related quality of life.
Choroidal neovascularization (CNV) is the main cause of severe vision loss in patients who have age-related macular degeneration (AMD) and is the most common cause of irreversible central vision loss in older persons living in the United States.1–4 Choroidal neovascularization also may cause vision loss in patients who have the ocular histoplasmosis syndrome or an unknown cause (idiopathic CNV).5,6 Vision loss due to CNV is an important public health problem.7
Previous studies have demonstrated that vision loss can have a profound effect on how people view their health-related quality of life.8–13 However, relatively little work has been done to measure the impact of vision loss due to CNV on health-related quality of life. One study demonstrated that poorer visual acuity in patients with recurrent subfoveal CNV from AMD was associated with somewhat poorer scores on the Physical and Mental Component Summary scales of the Short Form-36 health survey (SF-36), a generic instrument for assessing health-related quality of life.12 Another study found that decreased visual acuity in patients with AMD was associated with a substantial decrease in the utility or preference values that patients assigned to their health and vision status,14 where preference values refer to how people feel about the desirability of a health state and utility values are preference values measured using methods consistent with utility theory.15 Both of these studies had relatively few participants, thereby limiting the ability to examine clinical and sociodemographic factors that may influence a patient’s view of the impact of vision loss due to CNV on health-related quality of life. Since quality of life considerations are extremely important in the management of CNV, clinicians and investigators need a better understanding of how CNV affects health-related quality of life, especially as new treatments emerge.
Therefore, to improve understanding and awareness of the impact of subfoveal CNV on health-related quality of life, we analyzed data collected from a large population of patients with subfoveal CNV in at least 1 eye to measure the preference values that patients with subfoveal CNV assigned to their health and vision status.
METHODS
STUDY DESIGN AND POPULATION
We conducted a cross-sectional analysis of the baseline preference values and characteristics of participants in the Submacular Surgery Trials (SST), a set of 3 randomized controlled trials among 27 clinical centers designed to evaluate the surgical removal of subfoveal CNV.12 Patients eligible for the SST had either: (1) subfoveal CNV due to AMD with blood accounting for at least 50% of the total lesion (group B); (2) new (not recurrent) subfoveal CNV due to AMD with blood accounting for less than 50% of the lesion (group N); or (3) subfoveal CNV due to the ocular histoplasmosis syndrome or an unknown cause (group H). Other principal eligibility criteria are summarized in Table 1. For each group, patients were randomized in a 1-to-1 ratio between surgery and observation, after completing the consent process and signing a consent form approved by the institutional review board of each center.
Table 1.
Principal Ocular Eligibility Criteria for the Submacular Surgery Trials
| Criterion | Group B (Blood) | Group N (New CNV) | Group H (CNV Due to OHS or Unknown Causes) |
|---|---|---|---|
| Age, y | ≥50 | ≥50 | ≥18 |
| CNV cause | AMD | AMD | OHS or unknown |
| Classic CNV | Optional | Required | Required |
| Occult CNV | Optional | Optional | Optional |
| Foveal center | Blood or CNV | CNV | CNV |
| Lesion size, MPS disc areas | >3.5* | ≤9† | ≤9 |
| % of blood as a lesion component | ≥50% of lesion | <50% of lesion | Any |
| Prior laser photocoagulation for CNV‡ | Optional | Not allowed | Optional |
| Best visual acuity, approximate Snellen equivalent | 20/100 | 20/100 | 20/50 |
| Worst visual acuity, approximate Snellen equivalent | <20/1600 to light perception | 20/800 | 20/800 |
Abbreviations: AMD, age-related macular degeneration; CNV, choroidal neovascularization; MPS, Macular Photocoagulation Study; OHS, ocular histoplasmosis syndrome.
Area of CNV≤9 MPS disc areas; no limit to total lesion size (including area of CNV, area of blood, and area of other components of lesion) except ≥75% of blood must be posterior to equator.
If total area of lesion ≤3.5 MPS disc areas, then boundaries must be poorly demarcated.
Prior laser photocoagulation could not extend under center of foveal avascular zone.
METHOD OF MEASURING PREFERENCE VALUES
We developed a vision-related preference value scale for the SST, the Submacular Surgery Trials Vision Preference Value Scale (SST-VPVS), using a rating-scale technique to measure the preference values that patients assign to their health and vision status (Table 2). The rating-scale technique was used because it has good test-retest reliability in most studies and generally has better internal consistency than other scaling techniques, such as the standard-gamble and time-trade-off techniques.8,15,16 In addition, the rating-scale technique can be expected to yield higher response and completion rates than the other techniques because it is easier for most people to understand. It yields reliable and valid results even without an in-person interview or visual aids.16 These considerations were important in this study because they allowed us to administer the instrument centrally by telephone without requiring visual aids that might not be seen by patients with subfoveal CNV in the second eye after loss of central vision in the first eye. We did not perform an evaluation of the test-retest reliability of the rating scale in our study population, because we did not have any reason to expect that reliability would be less in this study than in other studies in which reliability had been established.
Table 2.
Versions of the Patient Preference Questions Used in the Submacular Surgery Trials
Version 1: October 9, 1997, to March 16, 1999
|
Version 2: March 17, 1999, to January 23, 2001 [Bold Indicates Words to Be Stressed by Interviewers]
|
| Version 3: January 24, 2001, to September 30, 2003 (Same 3 Questions as Version 2 but Data Check Added) |
| If Q2 = Q3 then: Based on your last two answers, it appears that you would feel the same about your overall current health (including vision) regardless of whether you were blind or had perfect vision. Is this true? |
| If Q2>Q3 then: Based on your last two answers, it appears that you would feel better about your overall current health (including vision) if you were blind than if you had perfect vision. Is this true? |
Telephone interviewers at the SST Coordinating Center first asked patients by telephone to rate their current vision using both eyes on a rating scale from 0 (completely blind) to 100 (perfect vision). As was done in previous work,10 complete blindness and perfect vision were chosen as the scale anchors because it was judged to be easier for an individual to rate a visual state on a scale defined in terms of vision than on a scale defined in other terms, such as from death to perfect health. The interviewers then asked the patients to rate what they imagined it would be like to be completely blind in both eyes (with otherwise the same health), using a scale from 0 (death) to 100 (perfect health). Finally, study patients were asked to rate what it would be like to have perfect vision without any other change in their health, again using a scale from 0 (death) to 100 (perfect health). These 3 questions permitted conversion of the first rating on the vision-only scale to preference values on a scale from death to perfect health and vision (Figure 1). The responses were converted to a scale from 0 to 1 to be consistent with the manner in which preference values typically are reported.8,13 For example, as shown in Figure 1, if a patient rated current vision as 80 on the vision scale and rated complete blindness (with otherwise same health) as 20 and perfect vision (with otherwise same health) as 70 on the death to perfect health scale, the final preference value for the current vision and health state would be 0.60 on the final 0 to 1 scale from death to perfect health. By asking patients to assign a preference value to perfect vision with their otherwise same current health, we were able to adjust for the perceived effects of coexisting health problems on ratings of their overall health state.
Figure 1.
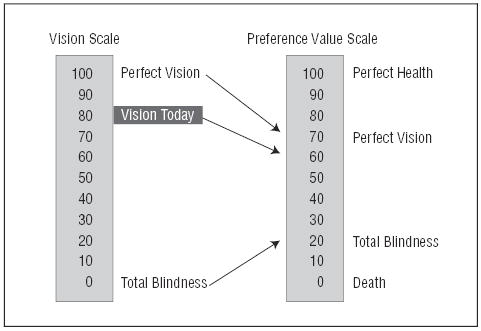
Conversion of ratings on a vision scale to a preference value on a scale from death to perfect health.
DATA COLLECTION
Patients completed interviews about their health-related quality of life prior to enrollment and random treatment assignment in the SST. Because many SST participants would not be able to read a printed questionnaire because of vision loss in both eyes, interviews were administered by telephone by trained interviewers located at the SST Coordinating Center. At follow-up visits, the SST participants could choose to have an interviewer call them at home or they could call the Coordinating Center from their own homes or from the clinic sites where they had their clinical examinations. The interviewers used a computer-generated script and entered responses directly into computer files.
The interviews included 3 validated instruments for assessing generic and specific aspects of health-related quality of life in addition to the questions used to determine the preference value that patients assigned to their health and vision status: (1) the SF-3617; (2) the 39-item National Eye Institute Visual Function Questionnaire (NEI-VFQ)18; and (3) the Hospital Anxiety and Depression Scale (HADS).19 In the interviews, the SF-36 immediately preceded the HADS and the NEI-VFQ immediately preceded the questions used to determine the preference value, but a computer program randomly selected either the SF-36 or NEI-VFQ to be administered first. After October 9, 1997, all patients enrolled in the SST were asked the preference value questions in addition to the other health-related quality-of-life questions. On average, it took patients about 26 to 27 minutes to answer all of the questions about preference values and quality of life.
The SST Patient-Centered Outcomes Subcommittee (PCOS) met regularly with the interviewers to discuss problems encountered during the interviews. Because the interviewers found that some patients could not answer the preference value questions, the PCOS made minor simplifications on 2 occasions to 3 questions used to determine the SST vision preference value (Table 2). Previous studies have found that up to 30% of the general public has difficulty understanding scaling techniques for measuring preference values.15,20 The scaling techniques typically are unfamiliar to people and often require visual aids to help people understand the questions and scales.
As part of the interview on the health-related quality of life, interviewers asked patients to rate their health in general on a scale of excellent, very good, good, fair, or poor (SF-36) as well as on a scale from 0 to 10 where 0 represented death and 10 was best possible health (NEI-VFQ). The interviewers similarly asked patients to rate their eyesight using both eyes as excellent, good, fair, poor, very poor, or completely blind (NEI-VFQ) and on a scale from 0 to 10 where 0 represented blind and 10 was best possible vision (NEI-VFQ).
The SST database included data on the sociodemographic and clinical characteristics of enrolled patients,12 including age, gender, self-reported race/ethnicity, occupational status, SST group (H, N, or B), specific features of the CNV, treatment assignment (surgery or observation), right or left eye involvement, clinic site, and best-corrected visual acuity in each eye.
STATISTICAL ANALYSIS
We summarized the distribution of responses to each of the preference value scale questions by determining means, medians, and interquartile (IQ) ranges. Standard box and whisker plots were created to provide graphic summaries of the distributions. To assess differences in patient characteristics between patients with and without usable preference values, we used the t test, Wilcoxon rank sum test, Kruskal-Wallis analysis of variance, χ2 test for homogeneity, or Fisher exact test, as appropriate. To examine the strength of the relation between preference values and patients’ self-rated perception of overall health or self-reported perception of vision, we used Spearman rank correlation analysis. To determine whether preference values differed by selected patient characteristics, we used Kruskal-Wallis analysis of variance and sequential multivariate linear regression. P values <.05 were deemed to indicate any statistical significance; P values <.01 were deemed to indicate moderate significance; P values <.001 were deemed to indicate high significance. No adjustment to P values was made for multiple comparisons. The analyses were performed using SAS software version 8 (SAS, Inc, Cary, NC).
RESULTS
PATIENT CHARACTERISTICS
A total of 1015 patients enrolled in the SST between April 1997 and September 2001. Nineteen of these patients (2%) enrolled before the SST-VPVS was included in the baseline interview. Table 3 summarizes the characteristics of the 996 patients who were asked the preference value questions.
Table 3.
Characteristics of Patients Enrolled in the Submacular Surgery Trials According to Whether They Had Usable Answers on the SST Vision Preference Value Scale*
| Characteristic | Not Usable (n = 204) | Usable (n = 792) | PValue |
|---|---|---|---|
| Age, y | |||
| <30 | 2 (1) | 16 (2) | <.001† |
| 30–49 | 7 (3) | 81 (10) | |
| 50–69 | 22 (11) | 140 (18) | <.001‡ |
| 70–99 | 173 (85) | 555 (70) | |
| Median | 78 | 75 | |
| Women | 117 (57) | 423 (53) | .34§ |
| Race/ethnicity | |||
| White | 198 (97) | 769 (97) | >.99§ |
| Other | 6 (3) | 23 (3) | |
| Occupation | |||
| Employed | 20 (10) | 169 (21) | <.001† |
| Retired | 171 (84) | 567 (72) | |
| Other | 13 (6) | 56 (7) | |
| Trial group || | |||
| B | 80 (39) | 256 (32) | .049† |
| H | 31 (15) | 175 (22) | |
| N | 93 (46) | 361 (46) | |
| Vision in better eye¶ | |||
| ≥20/40 | 99 (49) | 482 (61) | <.001† |
| 20/50–20/160 | 64 (31) | 226 (29) | |
| ≤20/200 | 41 (20) | 84 (11) | .001‡ |
| Median | 20/50 | 20/32 | |
| Vision in worse eye¶ | |||
| ≥20/40 | 0 | 0 | .37§ |
| 20/50–20/160 | 66 (32) | 284 (36) | |
| <20/200 | 138 (68) | 415 084 (64) | .11‡ |
| Median | 20/250 | 20/250 | |
| Vision in both eyes¶ | |||
| ≥20/40 And 20/50–20/160 | 52 (25) | 233 (29) | .002† |
| ≥20/40 And ≤20/200 | 47 (23) | 249 (31) | |
| 20/50–20/160 Both eyes | 14 (7) | 51 (6) | |
| 20/50–160 And ≤20/200 | 50 (25) | 175 (22) | |
| ≤20/200 Both eyes | 41 (20) | 84 (11) | |
| Subfoveal CNV lesion size in study eye, MPS DA | |||
| ≤3.5 | 26 (13) | 135 (17) | .32† |
| >3.5 And ≤9 | 109 (53) | 425 (54) | |
| >9 | 64 (31) | 219 (28) | |
| Unknown | 5 (2) | 12 (2) | |
| Missing# | 0 | 1 | |
| CNV status of fellow eye | |||
| CNV | 105 (51) | 307 (39) | .001§ |
| No CNV | 99 (49) | 484 (61) | |
| Missing# | 0 | 1 | |
| Diabetes mellitus | 25 (12) | 88 (11) | .77† |
| Hypertension | 105 (51) | 384 (48) | .48§ |
| HADS classification of anxiety | |||
| Noncase | 166 (86) | 632 (81) | .21† |
| Doubtful case | 20 (10) | 94 (12) | |
| Definite case | 8 (4) | 57 (7) | |
| Missing# | 10 | 9 | |
| HADS classification of depression | |||
| Noncase | 175 (86) | 667 (84) | .78† |
| Doubtful case | 18 (9) | 83 (10) | |
| Definite case | 11 (5) | 41 (5) | |
| Missing# | 0 | 1 | |
| SF-36 PCS percentile | |||
| >75 | 41 (20) | 198 (25) | .17† |
| 51–75 | 42 (21) | 198 (25) | |
| 26–50 | 57 (28) | 198 (25) | .04‡ |
| ≤25 | 61 (30) | 197 (25) | |
| Missing# | 3 | 1 | |
| SF-36 MCS percentile | |||
| >75 | 67 (33) | 198 (25) | .03† |
| 51–75 | 38 (19) | 197 (25) | |
| 26–50 | 56 (28) | 198 (25) | .04‡ |
| ≤25 | 40 (20) | 198 (25) | |
| Missing# | 3 | 1 | |
| NEI-VFQpercentile | |||
| >75 | 53 (26) | 198 (25) | .82† |
| 51–75 | 46 (23) | 198 (25) | |
| 26–50 | 49 (24) | 198 (25) | .76‡ |
| ≤25 | 56 (27) | 198 (25) | |
Abbreviations: CNV, choroidal neovascularization; HADS, Hospital Anxiety and Depression Scale; MPS DA, Macular Photocoagulation Study disc area (1 MPS DA=2.5 mm2); NEI-VFQ, National Eye Institute Visual Function Questionnaire; SF-36, Short Form-36 Health Survey; PCS: SF-36 Physical Component Summary Scale; MCS: SF-36 Mental Component Summary Scale.
Values are expressed as number (percentage) of patients unless otherwise indicated. Not usable answers include refusals, questionable values, and equal values for perfect vision and complete blindness.
Determined using the χ2 test for homogeneity.
Determined using the Wilcoxon rank sum test.
Determined using the Fisher exact test.
See Table 1.
All visual acuities are approximate Snellen equivalents.
Missing not included in percentages or P values.
ABILITY TO ANSWER THE PREFERENCE VALUE QUESTIONS
Of the 996 patients questioned, 145 (15%) were unable to answer 1 or more of the 3 preference value questions. In addition, 59 patients (6%) assigned a value to complete blindness that was equal to or greater than the value they assigned to perfect vision, suggesting that they did not understand the questions. As shown in Table 3, we found significant, albeit small, differences in the demographic and clinical characteristics of those who did and those who did not give usable answers to the preference value questions, in that those who were not able to answer the questions were slightly older, more often were retired, had somewhat worse vision in the better eye, more often had CNV in the fellow eye, and had, on average, lower Physical Component Summary scores and higher Mental Component Summary scores on the SF-36.
When comparing responses according to the version of the questions that patients were asked (Table 2), we found a trend but did not find a significant difference (P>.10) in the percentage unable to answer the questions (17% of 223 for the first version, 14% of 647 for the second version, and 12% of 126 for the third version). We also found a trend but did not find a statistically significant trend in the percentage that rated complete blindness as equal to or better than perfect vision (8% for the first version, 6% for the second version, and 2% for the third version).
PREFERENCE VALUES ASSIGNED TO CURRENT VISION WITH CNV
The main analysis was based on the responses of the 792 patients who gave usable answers to the preference questions that permitted calculation of SST-VPVS scores. When they were asked to rate their current vision on a scale (Figure 1) where 0 corresponds to complete blindness and 100 corresponds to perfect vision, they gave a mean rating of 55 (median, 50; IQ range, 50–75). On a scale where 0 corresponds to death and 100 corresponds to perfect health with perfect vision, the patients gave a mean rating of 35 to indicate how they imagined they would feel if they were completely blind in both eyes with their same health otherwise (median, 30; IQ range, 10–50). On the same scale, they gave a mean rating of 90 to indicate how they imagined they would feel if they had perfect vision with their same health otherwise (median, 95; IQ range, 80–100). We then calculated that the mean preference value assigned to current vision and health with CNV was 0.64 (median, 0.68; IQ range, 0.51–0.80) on the scale where 0 corresponds to death and 1 corresponds to perfect health with perfect vision.
The calculated preference values assigned to current vision and health with CNV differed between the groups that received different versions of the questions: (1) mean, 0.61 and IQ range, 0.48 to 0.76 with the first version (168 patients); (2) mean, 0.66 and IQ range, 0.55 to 0.81 with the second version (516 patients); and (3) mean, 0.63 and IQ range, 0.47 to 0.78 with the third version (108 patients) (P<.01 for the difference across the 3 versions by Kruskal-Wallis test). Because the differences between means and IQ ranges were small despite a P value less than .01, when the 3 sets of values were compared, the presentation of the rest of the analysis combines the data from all 792 patients who gave usable answers to the preference value questions. The calculated preference values were similar when we limited the analysis to the 516 patients who gave usable answers to the second version of the questions (mean, 0.66; median, 0.70; IQ range, 0.55–0.81).
CORRELATION OF PREFERENCE VALUES WITH OTHER MEASURES
As shown in Figure 2, the calculated preference values for current vision and health with CNV were moderately well correlated with patients’ ratings of their eyesight as excellent, good, fair, poor, very poor, or completely blind (Spearman correlation coefficient, 0.38; P<.001). The preference values for current vision and health with CNV also were correlated with patients’ ratings of their eyesight on a 0 to 10 scale (Spearman correlation coefficient, 0.47; P<.001), patients’ ratings of their overall health on a 0 to 10 scale (Spearman correlation coefficient, 0.36; P<.001), and patients’ ratings of their overall health as excellent, very good, good, fair, or poor (Spearman correlation coefficient, 0.28; P<.001).
Figure 2.
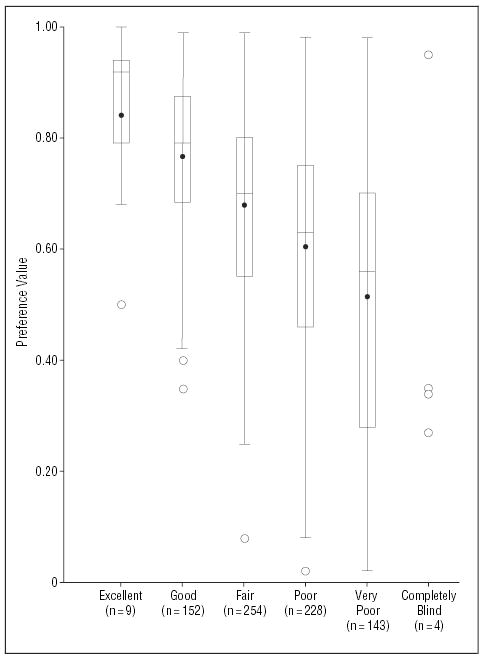
Relation of patient preference values for current vision and health (y-axis values) by National Eye Institute Visual Function Questionnaire (NEI-VFQ) ratings of eyesight (x-axis values) (Spearman correlation coefficient, 0.38; P<.001). For patient preference values, boxed areas show interquartile ranges, dots within boxes show means, lines within boxes show medians, and whiskers extending from box show 1.5 times the interquartile range. Circles beyond the whiskers are outliers. For the 4 individuals who reported themselves to be completely blind, the 4 points are plotted instead of showing a box and whisker plot.
RELATION OF PREFERENCE VALUES TO PATIENT CHARACTERISTICS
As shown in Table 4, the calculated preference values for current vision and health differed modestly among the 3 trial groups. Group H patients, who had the youngest mean age and the best visual acuity scores, had the highest mean preference values. The preference values differed somewhat by employment status and patient age but did not differ (P>.05) by gender or race/ethnicity. The preference values differed significantly by visual acuity in the better-seeing eye or worse-seeing eye and differed somewhat by specific features of the CNV lesion. Patients with a visual acuity of 20/200 or worse in both eyes had a mean preference value of 0.53 compared with a mean preference value of at least 0.67 if 1 eye had a visual acuity of 20/40 or better. In addition, the preference values were lower when the HADS indicated the presence of anxiety or depression or when the Mental or Physical Component Summary scores of the SF-36 were lower.
Table 4.
Distribution of Submacular Surgery Trials Vision Preference Values by Specific Characteristics of Patients With Subfoveal Choroidal Neovascularization (CNV)
| Characteristic | Sample Size | Mean | Median | Interquartile Range | PValue* | |
|---|---|---|---|---|---|---|
| Overall | 792 | 0.64 | 0.68 | 0.51–0.80 | ||
| Age, y | ||||||
| <30 | 16 | 0.70 | 0.73 | 0.62–0.85 | ] | .04 |
| 30–49 | 81 | 0.70 | 0.73 | 0.58–0.85 | ||
| 50–69 | 140 | 0.64 | 0.69 | 0.51–0.80 | ||
| 70–99 | 555 | 0.63 | 0.68 | 0.50–0.80 | ||
| Gender | ||||||
| F | 423 | 0.64 | 0.68 | 0.50–0.81 | ] | .68 |
| M | 369 | 0.64 | 0.69 | 0.51–0.79 | ||
| Race/ethnicity | ||||||
| White | 769 | 0.64 | 0.68 | 0.51–0.80 | ] | .69 |
| Other | 23 | 0.67 | 0.70 | 0.55–0.80 | ||
| Occupation | ||||||
| Employed | 169 | 0.69 | 0.73 | 0.60–0.82 | ] | .004 |
| Retired | 567 | 0.63 | 0.68 | 0.50–0.80 | ||
| Other | 56 | 0.61 | 0.64 | 0.48–0.79 | ||
| Group† | ||||||
| B | 256 | 0.62 | 0.65 | 0.50–0.79 | ] | .004 |
| H | 175 | 0.69 | 0.72 | 0.60–0.82 | ||
| N | 361 | 0.64 | 0.68 | 0.50–0.80 | ||
| Vision in better eye‡ | ||||||
| ≥20/40 | 482 | 0.69 | 0.71 | 0.56–0.82 | ] | <.001 |
| 20/50–20/160 | 226 | 0.58 | 0.63 | 0.43–0.76 | ||
| ≤20/200 | 84 | 0.53 | 0.60 | 0.34–0.71 | ||
| Vision in worse eye‡ | ||||||
| 20/50–20/160 | 284 | 0.68 | 0.71 | 0.56–0.82 | ] | <.001 |
| ≤20/200 | 508 | 0.62 | 0.65 | 0.50–0.79 | ||
| Vision in both eyes‡ | ||||||
| ≥20/40 And 20/50–160 | 233 | 0.71 | 0.74 | 0.60–0.82 | ] | <.001 |
| ≥20/40 And ≤20/200 | 249 | 0.67 | 0.70 | 0.54–0.81 | ||
| 20/50–20/160 Both eyes | 51 | 0.56 | 0.60 | 0.39–0.75 | ||
| 20/50–160 And ≤20/200 | 175 | 0.59 | 0.63 | 0.45–0.78 | ||
| ≤20/200 Both eyes | 84 | 0.53 | 0.60 | 0.34–0.71 | ||
| Subfoveal CNV lesion size in study eye, MPS DA | ||||||
| ≤3.5 | 135 | 0.69 | 0.72 | 0.58–0.82 | ] | .02 |
| >3.5 And ≤9 | 425 | 0.64 | 0.68 | 0.51–0.80 | ||
| >9 | 219 | 0.63 | 0.66 | 0.50–0.80 | ||
| Unknown | 12 | 0.53 | 0.48 | 0.36–0.69 | ||
| Missing | 1 | 0.55 | 0.55 | 0.55 | ||
| CNV status of fellow eye | ||||||
| CNV | 307 | 0.59 | 0.64 | 0.44–0.78 | ] | <.001 |
| No CNV | 484 | 0.68 | 0.70 | 0.55–0.81 | ||
| Missing | 1 | 0.55 | 0.55 | 0.55 | ||
| Diabetes mellitus | ||||||
| Yes | 88 | 0.60 | 0.63 | 0.46–0.78 | ] | .15 |
| Questionable | 12 | 0.65 | 0.70 | 0.54–0.78 | ||
| No | 692 | 0.65 | 0.69 | 0.51–0.80 | ||
| Hypertension | ||||||
| Yes | 384 | 0.62 | 0.66 | 0.50–0.79 | ] | .004 |
| No | 408 | 0.66 | 0.70 | 0.53–0.82 | ||
| HADS classification of anxiety | ||||||
| Noncase | 632 | 0.66 | 0.70 | 0.53–0.82 | ] | <.001 |
| Doubtful | 94 | 0.58 | 0.60 | 0.46–0.73 | ||
| Definite | 57 | 0.55 | 0.58 | 0.45–0.70 | ||
| Missing | 9 | 0.72 | 0.76 | 0.60–0.80 | ||
| HADS classification of depression | ||||||
| Noncase | 667 | 0.67 | 0.70 | 0.55–0.81 | ] | <.001 |
| Doubtful | 83 | 0.51 | 0.50 | 0.35–0.66 | ||
| Definite | 41 | 0.50 | 0.50 | 0.33–0.69 | ||
| Missing | 1 | 0.98 | 0.98 | 0.98 | ||
| SF-36 PCS percentile | ||||||
| >75 | 198 | 0.70 | 0.75 | 0.56–0.85 | ] | <.001 |
| 51–75 | 198 | 0.69 | 0.71 | 0.59–0.82 | ||
| 25–50 | 198 | 0.63 | 0.67 | 0.52–0.79 | ||
| ≤25 | 197 | 0.55 | 0.58 | 0.41–0.71 | ||
| Missing | 1 | 0.55 | 0.55 | 0.55 | ||
| SF-36 MCS percentile | ||||||
| >75 | 198 | 0.70 | 0.72 | 0.59–0.85 | ] | <.001 |
| 51–75 | 197 | 0.69 | 0.75 | 0.60–0.82 | ||
| 25–50 | 198 | 0.63 | 0.65 | 0.51–0.78 | ||
| ≤25 | 198 | 0.56 | 0.58 | 0.40–0.73 | ||
| Missing | 1 | 0.55 | 0.55 | 0.55 | ||
| NEI-VFQ percentile | ||||||
| >75 | 198 | 0.78 | 0.80 | 0.70–0.89 | ] | <.001 |
| 51–75 | 198 | 0.69 | 0.70 | 0.56–0.80 | ||
| 25–50 | 198 | 0.61 | 0.62 | 0.49–0.75 | ||
| ≤25% | 198 | 0.50 | 0.52 | 0.30–0.68 | ||
In a multivariate analysis (Figure 3) (Table 5) of the relation of demographic characteristics (age, gender, race/ethnicity, and employment status) to the preference values for current vision and health with CNV, we found that preference values were independently associated only with being employed (P<.001). In a multivariate analysis of the relation of clinical features of CNV to the preference values (Figure 3) (Table 5), we found that preference values were independently associated only with visual acuity of the better eye (P<.001). When employment status and visual acuity of the better eye were both considered (Figure 3) (Table 5), only the latter was significantly associated with the preference values. When comorbid conditions were considered in the model, visual acuity of the better eye remained significant (P<.001) and only hypertension was associated with a decrease in preference values (P=.02). When the HADS classification of depression was added to the model, all 3 variables were independently associated with the preference values: vision in the better eye (P<.001), hypertension (P=.049), and HADS depression classification (P<.001), with an overall R2 of 0.18. When the SF-36 Physical Component and Mental Component Summary scores were considered instead of the HADS, the only significant variables in the final model were visual acuity of the better eye (P<.001), Physical Component Summary score (P<.001) and Mental Component Summary score (P<.001), with an overall R2 of 0.20. When the NEI-VFQ score was considered instead of the HADS scores or the SF-36 scores, only the NEI-VFQ score was significantly associated with the preference values (P<.001; R2= 0.26).
Figure 3.
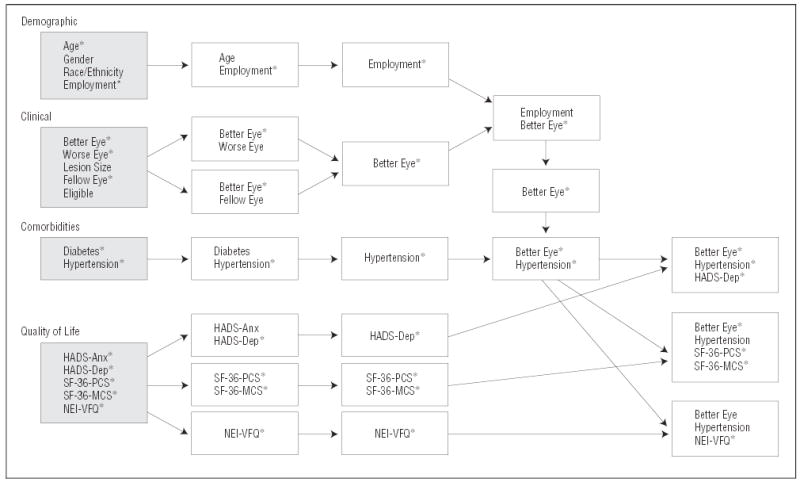
Variables were grouped into 4 categories for multivariate analyses: demographic characteristics, clinical features, comorbid conditions, and quality of life. Each variable was evaluated alone for its relation to the preference value (shaded boxes). Statistically significant variables were then combined to form the best multivariate model (white boxes and arrows in third column) for each category. Once the best demographic model was picked, the best clinical model variables were added. Once the best demographic and clinical model was picked, the best comorbid conditions model was added. Quality of life variables were kept separate by instrument and were then added to the best demographic, clinical, and comorbid model. Asterisks (*) denote statistically significant variables. HADS-Anx indicates Hospital Anxiety and Depression Scale classification of anxiety; HADS-Dep, Hospital Anxiety and Depression Scale classification of depression; NEI-VFQ, National Eye Institute Visual Function Questionnaire; SF-36-MCS, Short-Form 36 Mental Component Summary Scale; and SF-36-PCS, Short-Form 36 Physical Component Summary Scale.
Table 5.
Sequential Multivariate Analysis of Factors Associated With the Preference Value for Current Health and Vision of Patients With Subfoveal Choroidal Neovascularization
| Factors Included in Model | β Value | PValue | R2Value | |
|---|---|---|---|---|
| Demographic factors | ||||
| Employed (Y/N) | 0.06 | .001 | 0.02 | |
| Vision measures | ||||
| Better eye vision* | 0.003 | <.001 | 0.08 | |
| Demographic factors and vision measures | ||||
| Better eye vision* | 0.003 | <.001 | ] | 0.08 |
| Employed (Y/N) | 0.02 | .30 | ||
| Other clinical factors | ||||
| Hypertension (Y/N) | −0.04 | .006 | 0.009 | |
| Demographic factors, vision measures, and other clinical factors | ||||
| Better eye vision* | 0.003 | <.001 | ] | 0.09 |
| Hypertension (Y/N) | −0.03 | .02 | ||
| Demographic factors, vision measures, other clinical factors, and HADS depression | ||||
| Better eye vision* | 0.002 | <.001 | ] | 0.18 |
| Hypertension (Y/N) | −0.03 | .049 | ||
| HADS | 0.02 | <.001 | ||
| Demographic factors, vision measures, other clinical factors, and NEI-VFQ summary score | ||||
| Better eye vision* | −0.001 | .12 | 0.26 | |
| Hypertension (Y/N) | −0.02 | .20 | ||
| NEI-VFQ | 0.007 | <.001 | 0.007 | |
| Demographic factors, vision measures, other clinical factors, and NEI-VFQ summary score | ||||
| NEI-VFQ | 0.007 | <.001 | 0.26 | |
| Demographic factors, vision measures, other clinical factors, and SF-36 scores | ||||
| Better eye vision* | 0.002 | <.001 | ] | 0.20 |
| Hypertension (Y/N) | −0.02 | .17 | ||
| PCS | 0.006 | <.001 | ||
| MCS | 0.005 | <.001 | ||
| Demographic factors, vision measures, other clinical factors, and SF-36 scores | ||||
| Better eye vision* | 0.002 | <.001 | ] | 0.20 |
| PCS | 0.006 | <.001 | ||
| MCS | 0.005 | <.001 | ||
Abbreviations: HADS, Hospital Anxiety and Depression Scale; NEI-VFQ, National Eye Institute Visual Function Questionnaire; SF-36, Short Form-36 Health Survey; PCS: SF-36 Physical Component Summary Scale; MCS, SF-36 Mental Component Summary Scale.
Number of letters.
COMMENT
As one of the largest studies of preference values in patients with eye disease, this investigation has shown convincingly that patients with subfoveal CNV in one eye, with or without a neovascular lesion in the fellow eye, assign low preference values to their health status. A mean preference of 0.64 on a scale from 0 (dead) to 1 (perfect health) indicates that subfoveal CNV, on average, has a profound impact on how patients feel about their quality of life. The impact is greatest in those with the most severe loss of vision, but even patients with visual acuity of at least 20/40 in 1 eye had relatively low preference values. As presented in Table 6 for comparison, previous studies have reported a mean preference value of 0.77 for congestive heart failure,21 0.65 for symptomatic human immunodeficiency virus infection or AIDS,13 0.54 for chronic renal failure requiring home dialysis,22 0.50 to 0.70 for minor stroke,23 and 0 to 0.30 for major stroke.13,23 The relatively low mean preference value assigned to subfoveal CNV would suggest that patients with CNV would be more willing to consider a risky or expensive treatment than patients with an ocular condition associated with a higher preference value.
Table 6.
Preference Values Elicited From Patients With Selected Ocular and Other Clinical Conditions
| Condition | Mean Preference Value* | Measurement Method | Source |
|---|---|---|---|
| AMD | 0.81 | Standard gamble | Brown et al14 |
| Congestive heart failure | 0.77 | Time trade-off | Havranek et al21 |
| AMD | 0.72 | Time trade-off | Brown et al14 |
| Cataract | 0.68 | Rating scale | Bass et al10 |
| Symptomatic HIV infection or AIDS | 0.65 | Rating scale | Morimoto and Fukui13 |
| Subfoveal CNV† | 0.64 | Rating scale | NA |
| Chronic renal failure on home dialysis | 0.54 | Time trade-off | Torrance and Feeny22 |
| Minor stroke | 0.50–0.70 | Multiple | Post et al23 |
| Complete blindness | 0.33–0.39 | Multiple | Torrance and Feeny22; Bass et al10 |
| Major stroke | 0–0.30 | Multiple | Post et al23 |
Abbreviations: AMD, age-related macular degeneration; CNV, choroidal neovascularization; HIV, human immunodeficiency virus; NA, not applicable.
0=death; 1=perfect health.
See text for the preference value estimate for subfoveal CNV.
These results are consistent with the pathophysiologic features and natural history of CNV. It is often a progressive and generally irreversible disorder that frequently causes severe loss of central vision.1–3,24–28 Thus, it is not surprising that patients with central vision loss from CNV in at least 1 eye report that their vision loss markedly decreased their health-related quality of life12 and the preference values they assigned to their overall health. Moreover, the impact of CNV on health-related quality of life and preference values may be worsened by uncertainty about the efficacy of treatment. Chronic impairments typically are associated with lower preference values than temporary impairments, even if patients are able to adjust to their chronic impairments.5,6
The results also are consistent with previous reports on the preference or utility values that patients assign to visual impairment (Table 6). Brown et al,14 in a study of 80 patients with AMD, reported a mean patient preference value of 0.72 using the time-trade-off technique and a mean utility value of 0.81 using the standard-gamble technique. The preference or utility values reported by Brown et al may be higher than the values reported in our study because, as empirical work has shown, the time-trade-off and standard-gamble techniques typically yield higher values than the rating-scale technique we used.15 We used the rating-scale technique because it is easier for patients to understand,15 less dependent on patients’ education, and could be adapted to a telephone interview rather than require an in-person interview, thereby contributing to the SST’s ability to collect such data from a large population of patients with CNV. For this visually impaired population, we also thought it was important to use a scaling technique that did not depend on use of visual aids. In comparison, another relatively small study examined the preference values of 47 patients with cataract who were scheduled to have cataract surgery. In that study, the mean preference value for preoperative vision was 0.68 using a rating-scale technique.10 Of note, the median Snellen visual acuity in the eye scheduled for surgery was 20/70, better than the worse-eye median visual acuity in the current study (20/250). However, in that study, the preference values were not correlated very well with measures of visual acuity, suggesting that measures of visual acuity do not adequately predict how patients feel about the impact of their visual impairment. Studies also have reported that patients would assign an extremely low preference value to complete blindness, ranging from 0.33 to 0.39.10,22 Although it is important to emphasize that preference values may differ markedly depending on the scaling technique that is used, the results of our study and previous studies are consistent in demonstrating that patients with visual impairment have a marked decrease in the preference values that they assign to their health status, indicating a profound impact on how patients feel about their quality of life.
This study was large enough to permit determination of the sociodemographic and clinical characteristics of patients that were associated with a difference in the SST-VPVS scores that patients assigned to their current health with CNV. As expected, visual acuity in the better eye was strongly associated with the preference values. Also, the preference values were higher in group H patients (ocular histoplasmosis syndrome or idiopathic CNV) than in groups B (CNV with blood) and N (new CNV). However, the data suggest that this most likely was due to the lesser effects of CNV on visual acuity at baseline and more frequent unilateral involvement in group H rather than the younger age of group H specifically. Group H patients tended to have smaller CNV lesions and better visual acuity in both the study eye and fellow eye, as compared with patients in groups B and N. We did not have enough information on the extent of CNV in the fellow eye to assess whether preference values differed according to the severity of CNV in the fellow eye. As presented in Table 4, age was significantly associated with the preference values. We could not determine whether the preference values differed by race/ethnicity because so few of the patients were nonwhite.
Older patients with CNV may be particularly vulnerable to the effects of vision loss on their health-related quality of life because of coexisting diseases and impairments. This study found that older age by itself was associated with a significant decrease in preference values, although in a multivariate analysis, this association no longer was significant when employment was added to the multivariate model. The presence of hypertension was associated with decreased preference values in the multivariate model, likely because hypertension itself is associated with other complications and the need for medications that may affect quality of life. The SST-VPVS scores for current health with CNV were lower when patients had evidence of anxiety or depression (as measured by the HADS)19 or a decrease in mental or physical functioning (as measured by the Mental or Physical Component Summary scores of the SF-36).17 In our multivariate analysis, the preference values were independently associated with vision in the better eye, the Physical Component Summary score, and the Mental Component Summary score. The relatively low R2 value of that multivariate model (0.20) indicates that it is very difficult to predict how any given patient will feel about the effects of CNV on quality of life.
One limitation of this study is that we used a rating-scale technique to measure preference values without comparison with another scaling technique. Some “utility” experts contend that the standard-gamble technique is the gold standard for measuring patient utility values,8,16 but as mentioned previously, use of the standard-gamble technique has been limited by difficulty in administering it without an in-person interview and accompanying visual aids. In populations like ours that include patients with very poor vision, the use of visual aids is not feasible. The time-trade-off technique often is used instead of the standard-gamble technique, but it also is difficult to administer without visual aids. Perhaps more importantly, all 3 scaling techniques have been shown to have reasonable reliability and validity; approximately one third of studies on patient preference assessment have used a rating-scale technique.13 By using the simpler rating-scale technique, we were able to take advantage of a unique opportunity to incorporate an assessment of patient preference values into large multi-center trials.
Approximately 20% of the patients in the SST had difficulty answering the rating-scale questions at the baseline interview. This is not surprising since previous studies often have found that 10% to 30% of study subjects have difficulty answering questions that involve quantification of their preference values.15,20 While Brown et al29 have reported low rates of difficulty in studies of preference values in ophthalmology patients, it is unclear whether that was owing to use of an in-person interviewer or unique aspects of the study populations. It is possible that responses were biased by a loss of concentration related to the length of the questions about preference values and quality of life, but we suspect this would have been a more serious problem if we had used a more difficult scaling technique. Our modification of the wording of the questions did not appear to increase understanding of the questions significantly, although we saw a slight trend toward a decrease in the percentage of patients unable to answer the questions. The trend suggests that it would be appropriate to use the final version of the questions in future studies. However, we emphasize that estimates of patients’ preference values in the SST were similar regardless of the minor differences in wording of the questions. An even higher percentage of patients might not have been able to give appropriate answers to questions based on the standard-gamble technique because that technique is known to be particularly difficult for people to understand. It is not clear why patients with slightly better scores on the Mental Component Summary of the SF-36 were less likely to give usable answers, but the observed difference in Mental Component Summary scores was so small (median, 55.8 for those with usable answers vs 56.4 for those without usable answers) that it is unlikely to be clinically significant. Additionally, we note that patients with severe cognitive impairment would not have been able to give informed consent to participate in the trials. After excluding patients who gave answers to the 3 preference questions that were not consistent with each other, moderate correlation existed between the preference values and measures of visual acuity as well as measures of health-related quality of life. The correlation data indicate that the questions had reasonable construct validity.
Of course, our results may not apply to all patients with CNV since the study population enrolled in the SST included very few nonwhite patients, consistent with the epidemiological factors.30 However, the study population did include patients with different types of CNV.
We conclude that subfoveal CNV has a profound impact on how patients feel about their quality of life. The data provided by the SST-VPVS lend support to the importance of giving attention to the needs of such patients for visual rehabilitation and mental health services that could minimize the impact of the disease on their quality of life while remaining alert to the possibility of coexisting depression or mental health problems that would further impair a patient’s quality of life. The data also provide further justification for pursuit of more effective prevention and treatment options for patients with subfoveal CNV. Even relatively costly medical or surgical treatments for CNV could prove to be cost-effective from the patient’s point of view, especially if cost-effectiveness is measured in terms of the recommended rubric of dollars per quality-adjusted life year gained.31
The SST are poised to make a unique contribution to the field by virtue of having included patients’ preference values as an outcome that was measured across time. These data will allow the investigators to analyze changes across time relative to changes in visual acuity and progression of the ocular condition. The data also will enable the investigators to analyze the cost-effectiveness of submacular surgery, if it is shown to be efficacious, taking into consideration the substantial effects of CNV on quality of life. The SST-VPVS also will allow investigators to analyze the cost-effectiveness of other treatments for CNV, again taking into consideration the substantial effects of CNV on quality of life.
Acknowledgments
We thank the interviewers and patients for their fine efforts in making this study possible.
Footnotes
Group Information: A list of the investigators and other personnel who contributed data for this report was published in Arch Ophthalmol. 2004;122:857-863. A list of the Submacular Surgery Trials Patient Centered Outcomes Subcommittee and Writing Committee appears at the end of this article.
Financial Disclosure: None.
Submacular Surgery Trials Patient Centered Outcomes Subcommittee and Writing Committee: Eric B. Bass, MD, MPH (Patient Centered Outcomes Subcommittee and Writing Committee co-chair); Marta J. Marsh, MS (Writing Committee co-chair); Carol M. Mangione, MD, MSPH (Patient Centered Outcomes Subcommittee chair); Neil M. Bressler, MD; Ashley L. Childs, MS; Li Ming Dong, PhD; Barbara S. Hawkins, PhD; Harris A. Jaffee, PhD; and Päivi H. Miskala, PhD.
Funding/Support: The Submacular Surgery Trials are supported by cooperative agreements U10 EY11547, EY11557, and EY11558 between the National Eye Institute, National Institutes of Health, Department of Health and Human Services; Bethesda, Md, and The Johns Hopkins University, Baltimore, Md. Participating clinical centers are supported by contracts with The Johns Hopkins University. Participation of Dr Mangione is supported by a contract between The David Geffen School of Medicine, University of California, Los Angeles, and The Johns Hopkins University.
References
- 1.Leibowitz HM, Krueger DE, Maunder LR, et al. The Framingham Eye Study Monograph: an ophthalmological and epidemiological study of cataract, glaucoma, diabetic retinopathy, macular degeneration, and visual acuity in a general population of 2631 adults, 1973–1975. Surv Ophthalmol. 1980;24(suppl):335–610. [PubMed] [Google Scholar]
- 2.Sommer A, Tielsch JM, Katz J, et al. Racial differences in the cause-specific prevalence of blindness in East Baltimore. N Engl J Med. 1991;325:1412–1417. doi: 10.1056/NEJM199111143252004. [DOI] [PubMed] [Google Scholar]
- 3.Klein R, Wang Q, Klein BEK, Moss SE, Meuer SM. The relationship of age-related maculopathy, cataract, and glaucoma to visual acuity. Invest Ophthalmol Vis Sci. 1995;36:182–191. [PubMed] [Google Scholar]
- 4.Rahmani B, Tielsch JM, Gottsch J, Quigley H, Javitt J, Sommer A. The cause-specific prevalence of visual impairment in an urban population: the Baltimore Eye Survey. Ophthalmology. 1996;103:1721–1726. doi: 10.1016/s0161-6420(96)30435-1. [DOI] [PubMed] [Google Scholar]
- 5.Macular Photocoagulation Study Group. Argon laser photocoagulation for ocular histoplasmosis: results of a randomized clinical trial. Arch Ophthalmol. 1983;101:1347–1357. doi: 10.1001/archopht.1983.01040020349002. [DOI] [PubMed] [Google Scholar]
- 6.Macular Photocoagulation Study Group. Krypton laser photocoagulation for neovascular lesions of ocular histoplasmosis: results of a randomized clinical trial. Arch Ophthalmol. 1987;105:1499–1507. doi: 10.1001/archopht.1987.01060110045029. [DOI] [PubMed] [Google Scholar]
- 7.Saaddine JB, Narayan KMV, Vinicor F. Vision loss: a public health problem? Ophthalmology. 2003;110:253–254. doi: 10.1016/s0161-6420(02)01839-0. [DOI] [PubMed] [Google Scholar]
- 8.Torrance GW. Measurement of health state utilities for economic appraisal: a review. J Health Econ. 1986;5:1–30. doi: 10.1016/0167-6296(86)90020-2. [DOI] [PubMed] [Google Scholar]
- 9.Fryback DG, Dasbach EJ, Klein R, et al. The Beaver Dam Health Outcomes Study: initial catalog of health-state quality factors. Med Decis Making. 1993;13:89–102. doi: 10.1177/0272989X9301300202. [DOI] [PubMed] [Google Scholar]
- 10.Bass EB, Wills S, Scott IU, et al. Preference values for visual states in patients planning to undergo cataract surgery. Med Decis Making. 1997;17:324–330. doi: 10.1177/0272989X9701700309. [DOI] [PubMed] [Google Scholar]
- 11.Brown MM, Sharma S, Brown MM, Garrett S. Quality in Medicine Study Research Group: evidenced-based medicine and cost-effectiveness. J Health Care Finance. 1999;26:14–23. [PubMed] [Google Scholar]
- 12.Submacular Surgery Trials Pilot Study Investigators. Submacular Surgery Trials randomized pilot trial of laser photocoagulation versus surgery for recurrent choroidal neovascularization secondary to age-related macular degeneration, II: quality of life outcomes—SST Pilot Study report No. 2. Am J Ophthalmol. 2000;130:408–418. doi: 10.1016/s0002-9394(00)00730-3. [DOI] [PubMed] [Google Scholar]
- 13.Morimoto T, Fukui T. Utilities measured by rating scale, time trade-off, and standard gamble: review and reference for health care professionals. J Epidemiol. 2002;12:160–178. doi: 10.2188/jea.12.160. [DOI] [PMC free article] [PubMed] [Google Scholar]
- 14.Brown GC, Sharma S, Brown MM, Kistler J. Utility values and age-related macular degeneration. Arch Ophthalmol. 2000;118:47–51. doi: 10.1001/archopht.118.1.47. [DOI] [PubMed] [Google Scholar]
- 15.Froberg DG, Kane RL. Methodology for measuring health-state preferences, II: Scaling methods. J Clin Epidemiol. 1989;42:459–471. doi: 10.1016/0895-4356(89)90136-4. [DOI] [PubMed] [Google Scholar]
- 16.Ryan M, Scott DA, Reeves C, et al. Eliciting public preferences for healthcare: a systematic review of techniques. Health Technol Assess. 2001;5:1–186. doi: 10.3310/hta5050. [DOI] [PubMed] [Google Scholar]
- 17.Ware JE, Sherbourne CD. The MOS 36-Item Short Form Health Survey (SF-36), I: conceptual framework and item selection. Med Care. 1992;30:473–483. [PubMed] [Google Scholar]
- 18.Mangione CM, Lee PP, Pitts J, Gutierrez P, Berry S, Hays RD. NEI-VFQ Field Test Investigators. Psychometric properties of the National Eye Institute Visual Function Questionnaire (NEI-VFQ) Arch Ophthalmol. 1998;116:1496–1504. doi: 10.1001/archopht.116.11.1496. [DOI] [PubMed] [Google Scholar]
- 19.Zigmond AS, Snaith RP. The Hospital Anxiety and Depression Scale. Acta Psychiatr Scand. 1983;67:361–370. doi: 10.1111/j.1600-0447.1983.tb09716.x. [DOI] [PubMed] [Google Scholar]
- 20.Torrance GW. Utility approach to measuring health-related quality of life. J Chronic Dis. 1987;40:593–600. doi: 10.1016/0021-9681(87)90019-1. [DOI] [PubMed] [Google Scholar]
- 21.Havranek EP, McGovern KM, Weinberger J, et al. Patient preferences for heart failure treatment: utilities are valid measures of health-related quality of life in heart failure. J Card Fail. 1999;5:85–91. doi: 10.1016/s1071-9164(99)90030-1. [DOI] [PubMed] [Google Scholar]
- 22.Torrance GW, Feeny D. Utilities and quality-adjusted life years. Int J Technol Assess Health Care. 1989;5:559–575. doi: 10.1017/s0266462300008461. [DOI] [PubMed] [Google Scholar]
- 23.Post PN, Stiffelbout AM, Wakker PP. The utility of health states after stroke: a systematic review of the literature. Stroke. 2001;32:1425–1429. doi: 10.1161/01.str.32.6.1425. [DOI] [PubMed] [Google Scholar]
- 24.Ghafour IM, Allan D, Foulds WS. Common causes of blindness and visual handicap in the west of Scotland. Br J Ophthalmol. 1983;67:209–213. doi: 10.1136/bjo.67.4.209. [DOI] [PMC free article] [PubMed] [Google Scholar]
- 25.Gibson JM, Lavery JR, Rosenthal AR. Blindness and partial sight in an elderly population. Br J Ophthalmol. 1986;70:700–705. doi: 10.1136/bjo.70.9.700. [DOI] [PMC free article] [PubMed] [Google Scholar]
- 26.Jonasson F, Thordarson K. Prevalence of ocular disease and blindness in a rural area in the eastern region of Iceland during 1980 through 1984. Acta Ophthalmol Suppl. 1987;182:40–43. doi: 10.1111/j.1755-3768.1987.tb02587.x. [DOI] [PubMed] [Google Scholar]
- 27.Attebo K, Mitchell P, Smith W. Visual acuity and the causes of visual loss in Australia: the Blue Mountains Eye Study. Ophthalmology. 1996;103:357–364. doi: 10.1016/s0161-6420(96)30684-2. [DOI] [PubMed] [Google Scholar]
- 28.Rosenberg T, Klie F. Current trends in newly registered blindness in Denmark. Acta Ophthalmol Scand. 1996;74:395–398. doi: 10.1111/j.1600-0420.1996.tb00716.x. [DOI] [PubMed] [Google Scholar]
- 29.Brown MM, Brown GC, Sharma S, Busbee B, Brown H. Quality of life associated with unilateral and bilateral good vision. Ophthalmology. 2001;108:643–647. doi: 10.1016/s0161-6420(00)00635-7. [DOI] [PubMed] [Google Scholar]
- 30.Pieramici DJ, Bressler NM, Bressler SB, Schachat AP. Choroidal neovascularization in black patients. Arch Ophthalmol. 1994;112:1043–1046. doi: 10.1001/archopht.1994.01090200049020. [DOI] [PubMed] [Google Scholar]
- 31.Cost-effectiveness in Health and Medicine. Project Summary. From the Report of the Panel on Cost-Effectiveness in Health and Medicine Washington, DC: Office of Public Health and Science, US Public Health Service; 1996.